Page 1
Characterization of Crude oil sample from a local
South African Refinery
Tsholofelo Ezekiel Rankwane
A Research report submitted to the Faculty of Engineering and the Built
Environment, University of the Witwatersrand, in fulfilment of the requirements of
the degree of Master of Science in Engineering
Johannesburg 2013
Page 2
i
Declaration
I Tsholofelo Ezekiel Rankwane I hereby declare the following:
I am aware that plagiarism (the use of someone else‟s work without their
permission and/or without acknowledging the original source) is against
University Policy.
I confirm that the work submitted for assessment for the research report is my
own unaided work except where I have explicitly stated otherwise.
I have followed the required conventions in referencing the thoughts, ideas,
and visual materials of others.
I understand that the University of the Witwatersrand may take disciplinary
action against me if there is a belief that this is not my own unaided work, or that
I have failed to acknowledge the source of the ideas or words in my writing.
Signature: __________________________ Date: January-2014
Page 3
ii
Abstract
Characterization of crude oil and petroleum products comprises of numerous
analytical techniques which are complex, time consuming and do not address the
major hydrocarbon classes present. SARA analysis have been shown to produce rapid
analysis for classifying crude oil and petroleum products in terms of saturates,
aromatics, resins and asphaltenes hydrocarbon composition, and an in-depth
understanding of asphaltenes structural characteristics, but have not been well
investigated in South African refineries. The aims of this study were to use an in-
house developed HPLC method and a combination of analytical techniques to
determine the estimates of four major hydrocarbon classes in crude oil, lubricant oil,
petrol and diesel samples obtained from local refineries, and further investigate the
structural characteristics of asphaltenes. The four major classes were successfully
identified and determined in the samples studied and from SARA composition of
crude oil the colloidal instability index and crystallite parameters were obtained. The
crude oil investigated was found to be composed of 38% of saturates, 28% of
aromatics, 21% of resins and 11% of asphaltenes. From this composition the colloidal
instability index of crude oil sample is estimated to value of 1.02 which suggests a
good stability for refining. The composition of petroleum products samples of
lubricant oil, petrol and diesel successfully identified saturates and aromatics
hydrocarbon classes with a large presence of aromatics. These results provide an
understanding of major hydrocarbon classes present in crude oil and petroleum
products in the South African fuel specifications.
Page 4
iii
Acknowledgements
My acknowledgements go to the school of chemical engineering and chemistry for
support and motivation towards this research project. A special thanks to Chemical
Industries Education and Training Authority (CHIETA) for financial assistance.
Page 5
iv
Table of Content
Declaration ........................................................................................................ i
Abstract ............................................................................................................ ii
Acknowledgements .........................................................................................iii
Table of Content ............................................................................................. iv
List of figures .................................................................................................. vi
List of tables .................................................................................................. vii
Nomenclature ................................................................................................viii
List of abbreviations ....................................................................................... ix
1. INTRODUCTION ........................................................................................... 1
1.1. Research Statement .......................................................................................... 2
1.2. Research Objectives ......................................................................................... 2
1.3. Research Scope and Limitations ...................................................................... 3
2. LITERATURE REVIEW ................................................................................ 4
2.1. Crude Oil Properties ........................................................................................ 4
2.1.1. Chemical Composition .................................................................................... 5
2.1.2. Physical Properties ........................................................................................... 9
2.2. Petrol Fuel Properties .................................................................................... 11
2.3. Diesel Fuel Properties .................................................................................... 12
2.4. Sara Analysis ................................................................................................. 13
2.5. Asphaltene Precipitation ................................................................................ 16
2.6. Asphaltene Molecular Structure .................................................................... 17
3. EXPERIMENTAL METHODS AND MATERIALS ................................... 20
3.1. Asphaltene Precipitation Methodology ......................................................... 20
3.2. X-Ray Diffraction Methodology ................................................................... 21
3.3. NMR Analyses Methodology ........................................................................ 21
3.4. HPLC Analysis Methodology ........................................................................ 21
3.5. API Determination Methodology .................................................................. 23
4. EXPERIMENTAL RESULTS AND DISCUSSION .................................... 24
4.1. Asphaltene Precipitation Discussion ............................................................. 25
4.2. Structural Characterization of Asphaltene ..................................................... 26
4.3. NMR Spectra of Crude Oil samples .............................................................. 29
Page 6
v
4.4. HPLC analysis on Petroleum crude and Products ......................................... 31
5. CONCLUSION AND RECOMMENDATION ............................................ 33
5.1. Conclusion ..................................................................................................... 33
5.2. Recommendation ........................................................................................... 34
6. REFERENCES .............................................................................................. 35
7. APPENDIX .................................................................................................... 38
7.1. Appendix A: South African Fuel Specifications ........................................... 38
7.2. Appendix B: Experimental Results ............................................................... 40
7.3. Appendix C: Picture Sample of Asphaltenes Precipitate............................... 55
Page 7
vi
List of figures
Figure 2.1: Distribution of compounds throughout crude oil ........................................ 5
Figure 2.2: Examples of hetero-compounds containing oxygen, nitrogen and sulphur
compounds. ................................................................................................. 8
Figure 2.3: Chemical structures of typical vanadyl complexes in crude oil. ................. 9
Figure 2.4: Petroleum products with carbon numbers and boiling ranges .................. 10
Figure 2.5: Schematic diagram for SARA fractions .................................................... 13
Figure 2.6: Example of Asphaltene precipitation using three different solvents ......... 17
Figure 2.7: Cross-section of asphaltene model and group types that give rise to XRD
peaks .......................................................................................................... 18
Figure 3.1: Summary of asphaltene precipitation ........................................................ 20
Figure 3.2: HPLC process diagram .............................................................................. 22
Figure 4.1: Summary of experimental results .............................................................. 24
Figure 4.2: Fraction precipitated from crude oil .......................................................... 25
Figure 4.3: XRD pattern of asphaltene precipitate ...................................................... 27
Figure 4.4: X-ray diffraction pattern of four Saudi crude asphaltene .......................... 28
Figure 4.5: H-NMR spectrum of crude oil sample ...................................................... 29
Figure 4.6: C-NMR spectrum of crude oil sample ...................................................... 30
Figure B1: Calibration curve of Saturates standards ................................................... 41
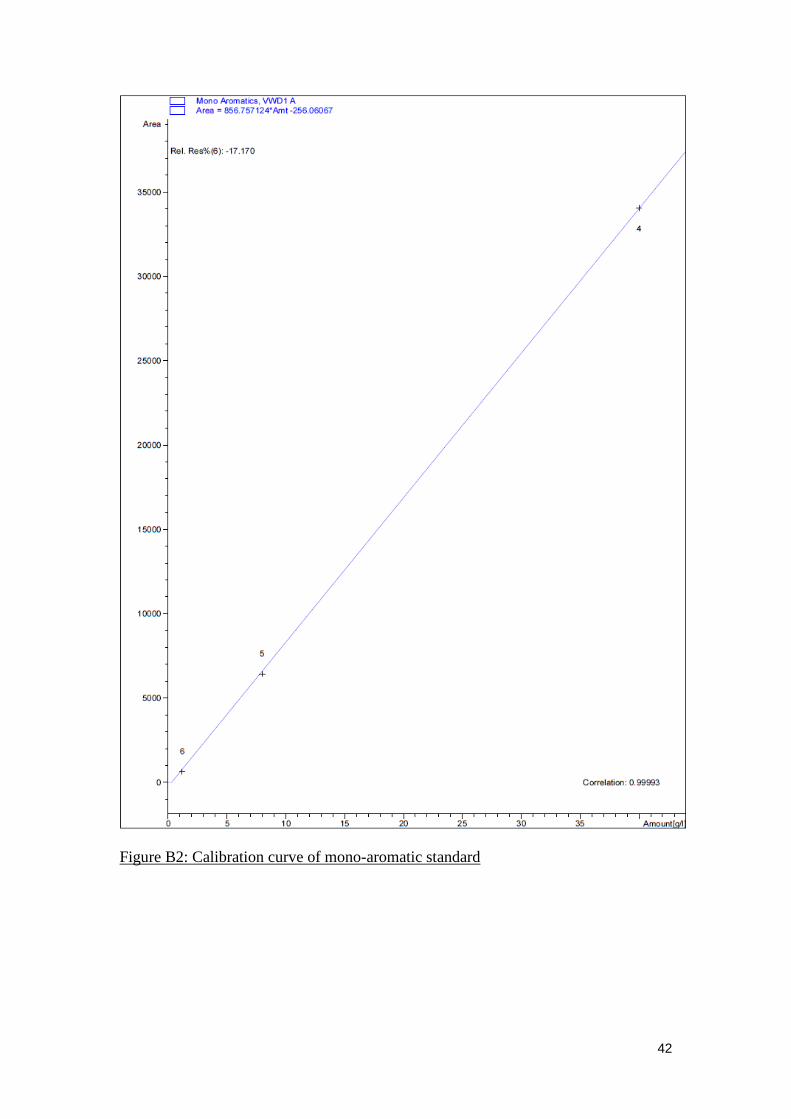
Figure B2: Calibration curve of mono-aromatic standard ........................................... 42
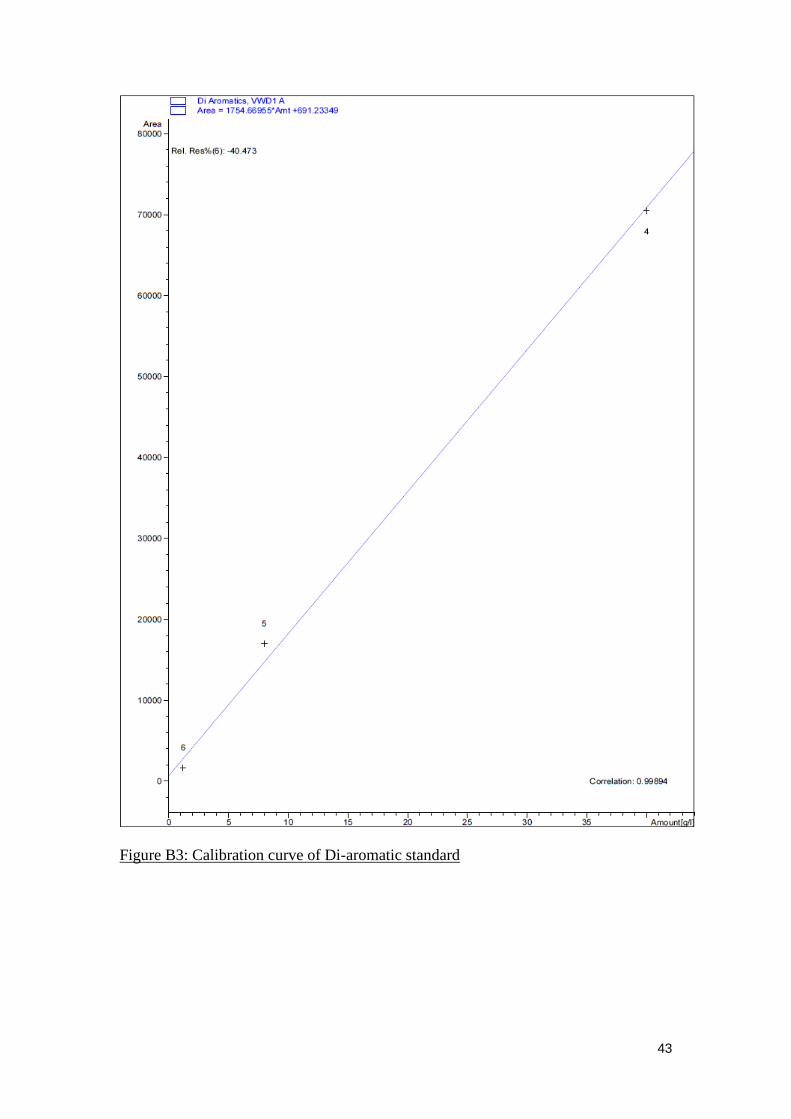
Figure B3: Calibration curve of Di-aromatic standard ................................................ 43
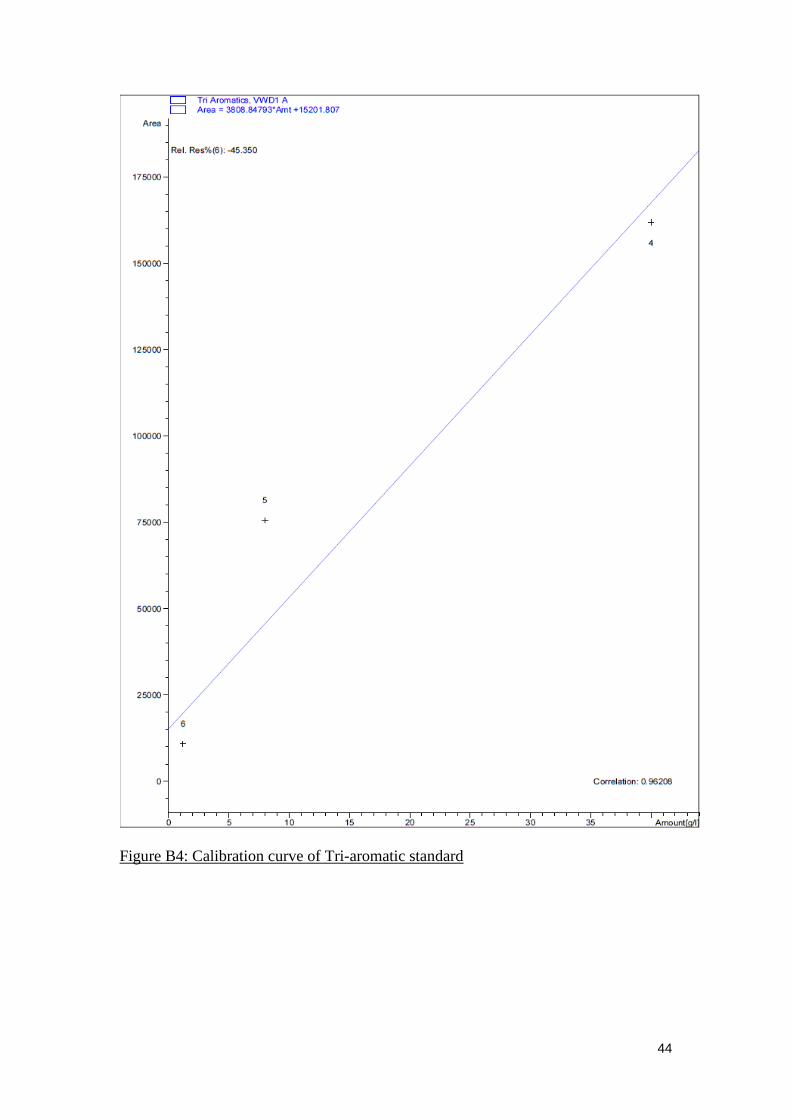
Figure B4: Calibration curve of Tri-aromatic standard ............................................... 44
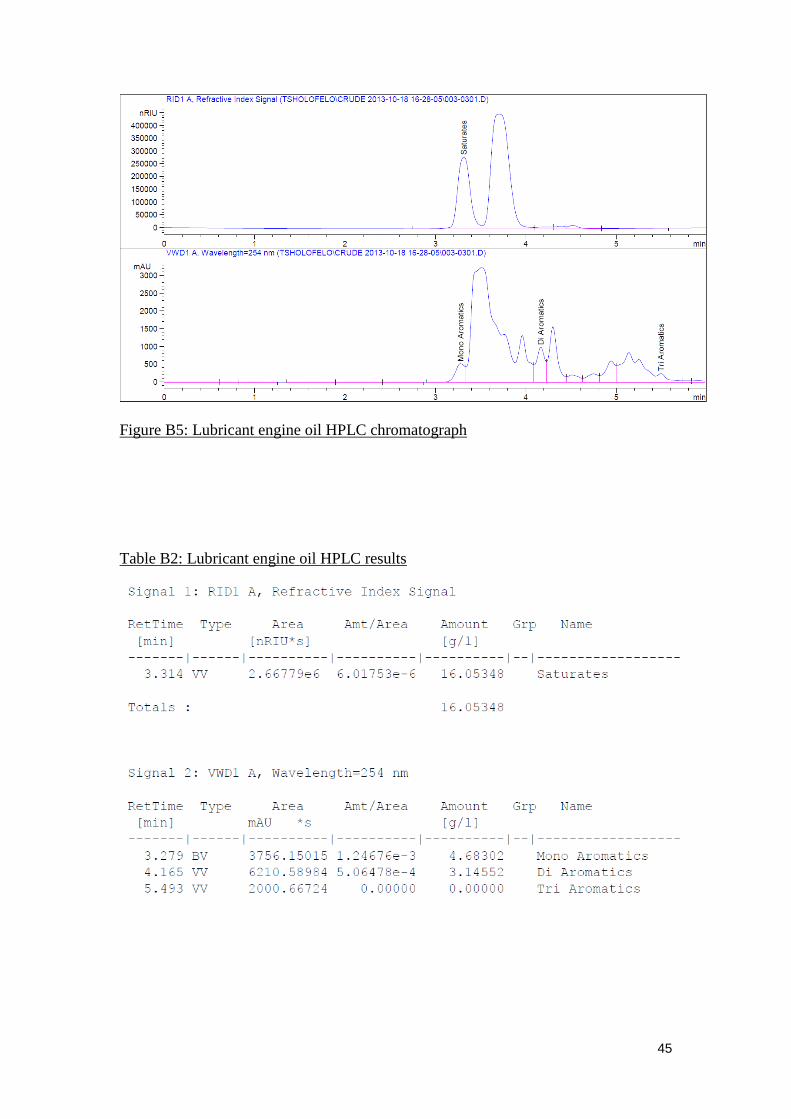
Figure B5: Lubricant engine oil HPLC chromatograph .............................................. 45
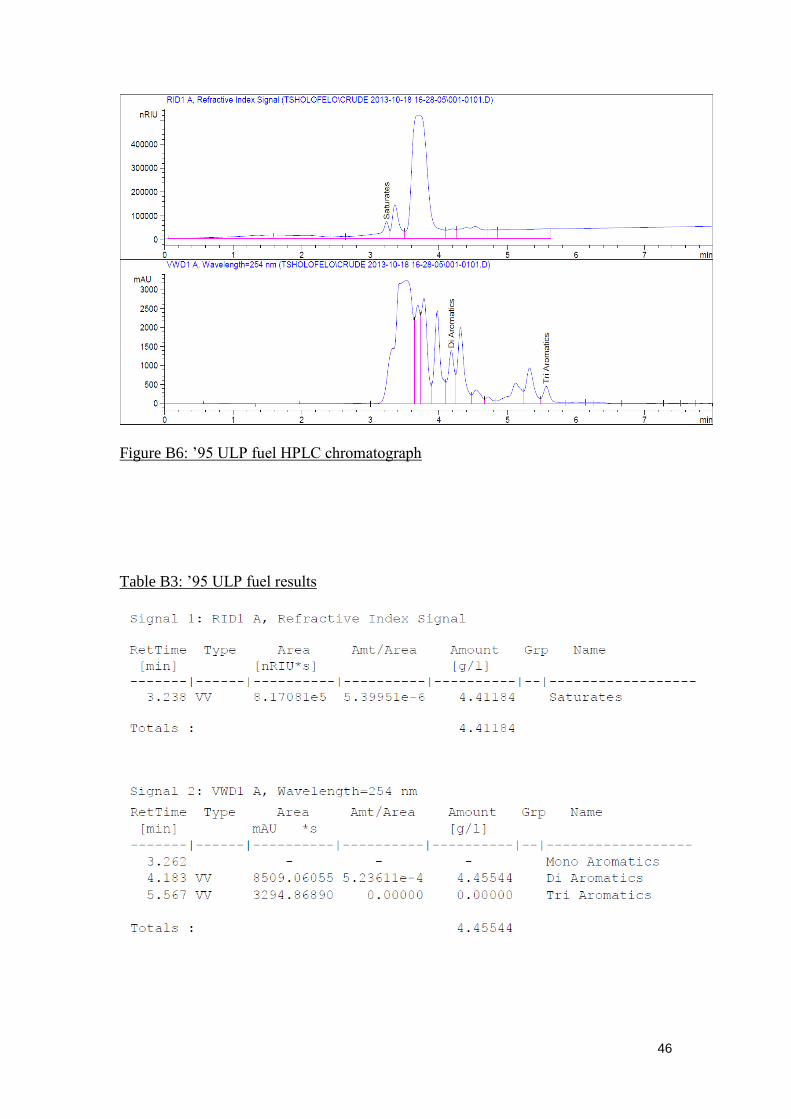
Figure B6: ‟95 ULP fuel HPLC chromatograph .......................................................... 46
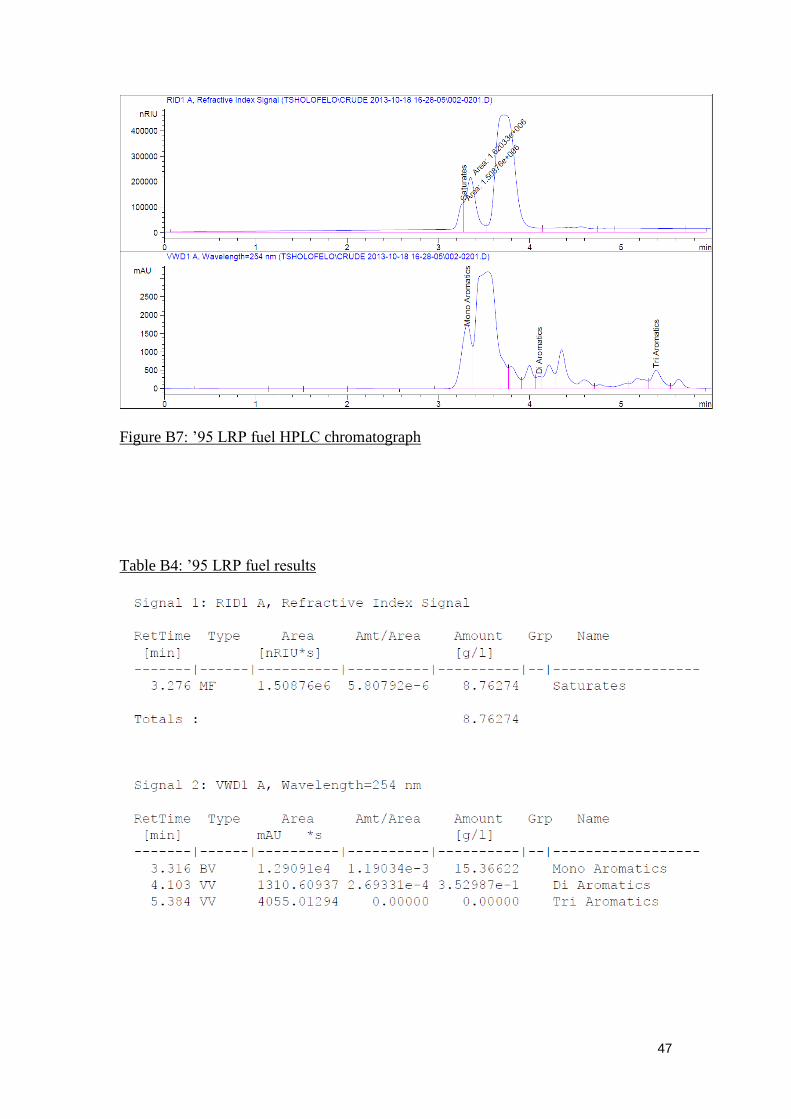
Figure B7: ‟95 LRP fuel HPLC chromatograph .......................................................... 47
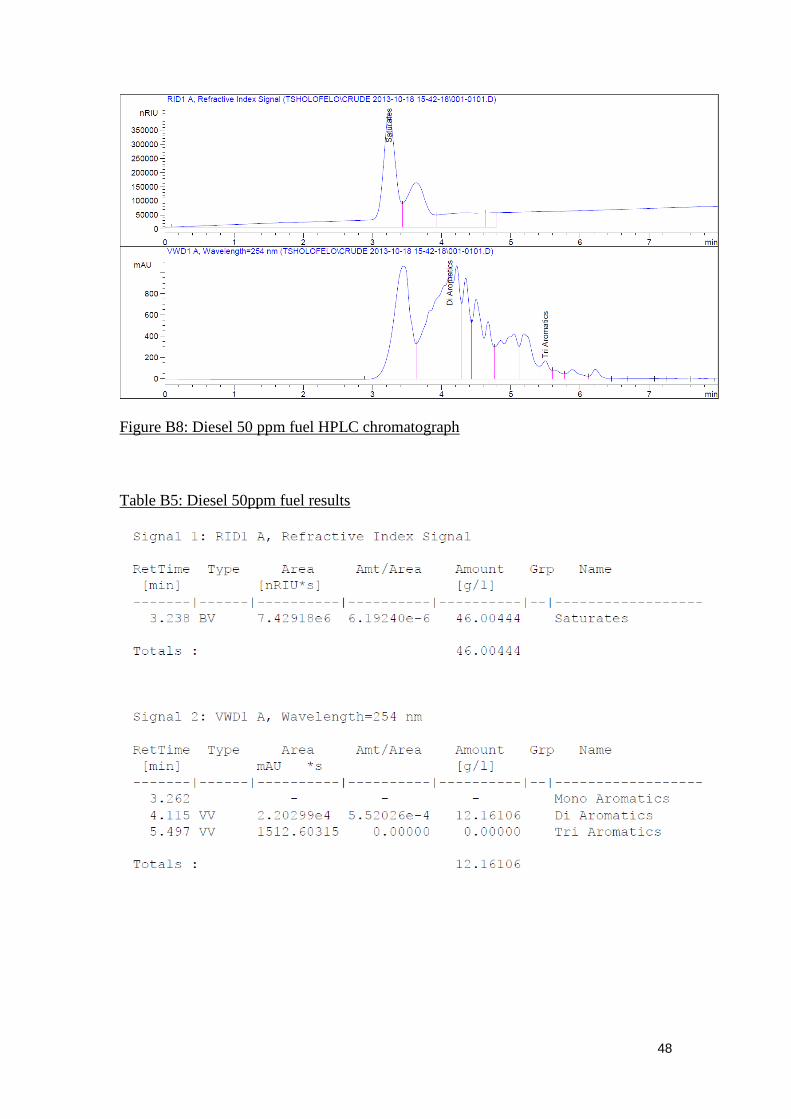
Figure B8: Diesel 50 ppm fuel HPLC chromatograph ................................................ 48
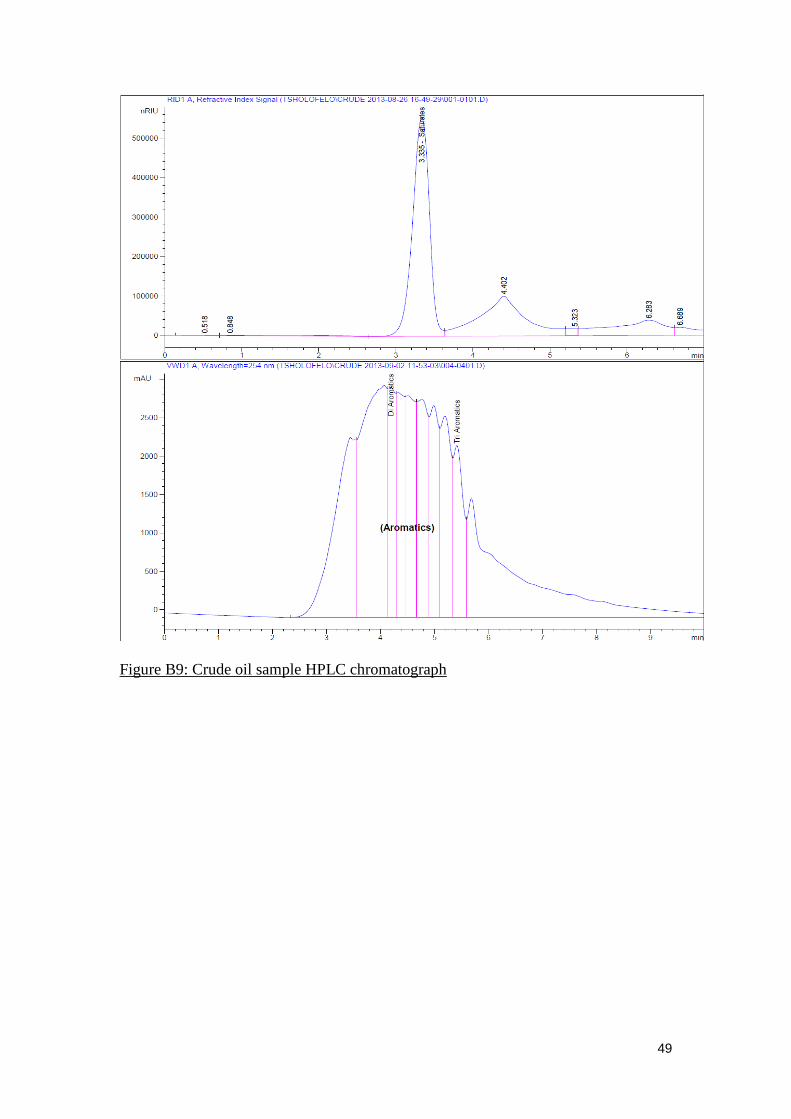
Figure B9: Crude oil sample HPLC chromatograph .................................................... 49
Figure B10: X-Ray pattern of asphaltene precipitate .................................................. 52
Figure B11: 13C-NMR spectrum of crude oil sample ................................................. 53
Figure B12: 1H-NMR spectrum of crude oil sample ................................................... 54
Figure B13: Asphaltene precipitate sample ................................................................. 55
Page 8
vii
List of tables
Table 2.1: Examples of Paraffin molecules ................................................................... 6
Table 2.2: Typical examples of aromatic compounds ................................................... 7
Table 2.3: Typical Examples of Olefins compounds ..................................................... 7
Table 2.4: Typical volume share and properties of Gasoline fuel ............................... 11
Table 2.5: Typical volume shares and properties of diesel fuel .................................. 12
Table 4.1: Experimental data of asphaltene precipitation ............................................ 25
Table 4.2: Crystallite parameters of asphaltene ........................................................... 26
Table 4.3: X-Ray diffraction pattern of four Saudi crude asphaltene .......................... 28
Table 4.4: Sara Composition of Crude oil sample ....................................................... 31
Table A1: South African Unleaded Petrol Specifications ........................................... 38
Table A2: South African Automotive Diesel Fuel Specifications ............................... 39
Table B1: Calibration of standards used in HPLC ....................................................... 40
Table B2: Lubricant engine oil HPLC results .............................................................. 45
Table B3: ‟95 ULP fuel results .................................................................................... 46
Table B4: ‟95 LRP fuel results .................................................................................... 47
Table B5: Diesel 50ppm fuel results ............................................................................ 48
Table B6: Sara composition calculations using NMR data ......................................... 50
Table B7: Asphaltene precipitation experimental data ................................................ 51
Table B8: Estimation of density of crude oil results .................................................... 51
Page 9
viii
Nomenclature
Aliphatic Carbon Cal
Aliphatic Hydrogen Hal
Alpha Carbon Cα
Alpha Hydrogen Hα
Angstrom Ǻ
Area under graphene peak A(graphene)
Area under γ-Peak A(γ)
Aromatic Carbon Car
Aromatic Hydrogen Har
Aromaticity Factor of Carbon FCA=(fa)
Aromaticity Factor of Hydrogen FHA
Bragg angle θ
Colloidal Instability Index CII
Density ρ
Full width at half maximum B1/2
Inter-chain layer distance dγ
Inter-planar Spacing dm
Methyl Carbon CMethyl
Methyl Hydrogen HMethyl
Methylene Carbon CMe
Methylene Hydrogen HMe
Naphthenic Carbon CNaph
Naphthenic Hydrogen HNaph
Normal n-
Octane Number 93 Rating „93
Octane Number 95 Rating „95
Parts Per Million ppm
Wavelength λ
Page 10
ix
List of abbreviations
13
C-NMR Carbon Nuclear Magnetic Resonance
1H-NMR Hydrogen Nuclear Magnetic Resonance
Amt Amount
API American Petroleum Institute
ASTM American Society for Testing and Materials
HPLC High Performance Liquid Chromatography
LRP Lead Replacement Petrol
mAU milli-Absorbance Unit
Min Minute(s)
nRIU nano Refractive Index Unit
PAH Polycyclic Aromatic Hydrocarbon
RID Refractive Index Detector
SAPIA South African Petroleum Industry Association
SARA Saturates Aromatics Resins Asphaltenes
ULP Un-Leaded Petrol
VWD Variable Wavelength Detector
XRD X-Ray Diffraction
wt% Weight Percentage
Page 11
1
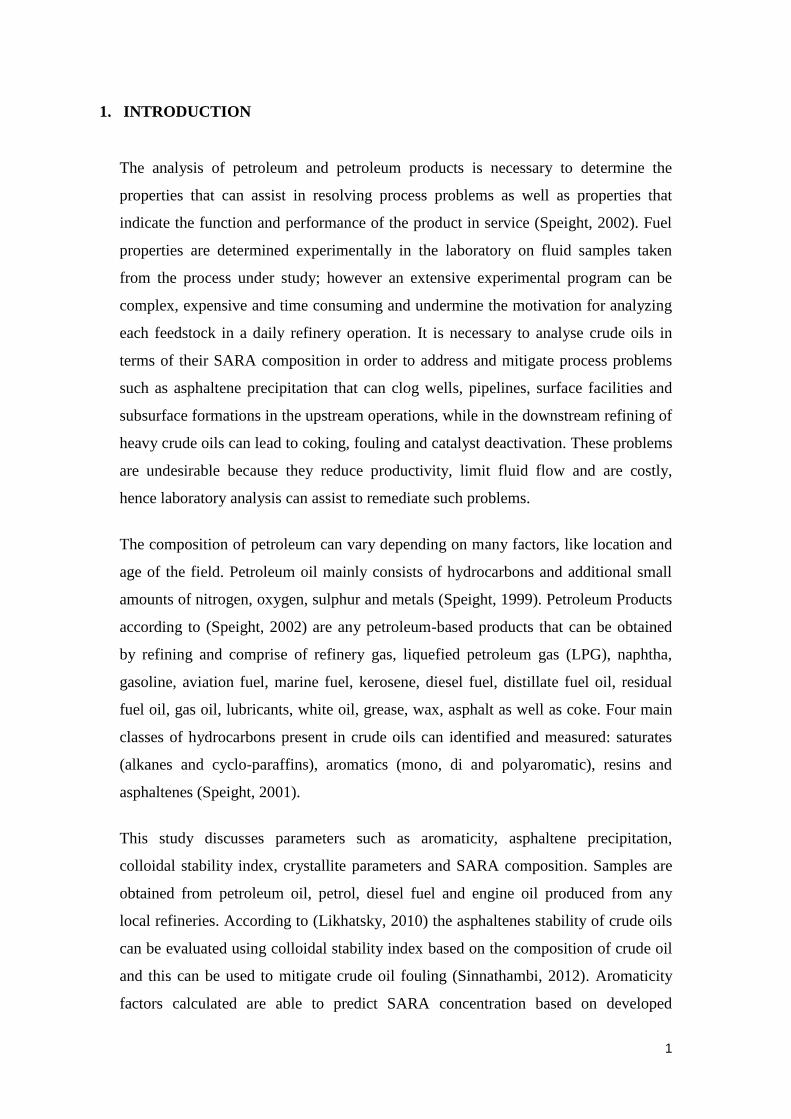
1. INTRODUCTION
The analysis of petroleum and petroleum products is necessary to determine the
properties that can assist in resolving process problems as well as properties that
indicate the function and performance of the product in service (Speight, 2002). Fuel
properties are determined experimentally in the laboratory on fluid samples taken
from the process under study; however an extensive experimental program can be
complex, expensive and time consuming and undermine the motivation for analyzing
each feedstock in a daily refinery operation. It is necessary to analyse crude oils in
terms of their SARA composition in order to address and mitigate process problems
such as asphaltene precipitation that can clog wells, pipelines, surface facilities and
subsurface formations in the upstream operations, while in the downstream refining of
heavy crude oils can lead to coking, fouling and catalyst deactivation. These problems
are undesirable because they reduce productivity, limit fluid flow and are costly,
hence laboratory analysis can assist to remediate such problems.
The composition of petroleum can vary depending on many factors, like location and
age of the field. Petroleum oil mainly consists of hydrocarbons and additional small
amounts of nitrogen, oxygen, sulphur and metals (Speight, 1999). Petroleum Products
according to (Speight, 2002) are any petroleum-based products that can be obtained
by refining and comprise of refinery gas, liquefied petroleum gas (LPG), naphtha,
gasoline, aviation fuel, marine fuel, kerosene, diesel fuel, distillate fuel oil, residual
fuel oil, gas oil, lubricants, white oil, grease, wax, asphalt as well as coke. Four main
classes of hydrocarbons present in crude oils can identified and measured: saturates
(alkanes and cyclo-paraffins), aromatics (mono, di and polyaromatic), resins and
asphaltenes (Speight, 2001).
This study discusses parameters such as aromaticity, asphaltene precipitation,
colloidal stability index, crystallite parameters and SARA composition. Samples are
obtained from petroleum oil, petrol, diesel fuel and engine oil produced from any
local refineries. According to (Likhatsky, 2010) the asphaltenes stability of crude oils
can be evaluated using colloidal stability index based on the composition of crude oil
and this can be used to mitigate crude oil fouling (Sinnathambi, 2012). Aromaticity
factors calculated are able to predict SARA concentration based on developed
Page 12
2
correlation equations developed by (Sanchez-Minero et al, 2012) using NMR data.
Structural characteristics of asphaltene are from crystallite parameters such as
aromaticity and interplanar spacing. The petroleum products are investigated for
composition content with in-house developed HPLC method and these products
include ULP 95 petrol, LRP 95 petrol, 50ppm diesel and lubricant engine oil samples.
The chemical constituents of petroleum are determined by techniques available to
separate and analyse the various compounds that are found in petroleum
(Behrenbruch, 2007). The spectrometric techniques used in this study are useful for
analyzing petroleum crude samples by separating the sample into the major
hydrocarbon classes. By using high performance liquid chromatography (HPLC),
crude oil separated into components according to their polarity.
1.1. RESEARCH STATEMENT
The determination of SARA composition of crude oil and petroleum products by the
use of analytical techniques is necessary to provide an in-depth understanding of
asphaltene precipitation in crude oil and estimates of four major hydrocarbon groups.
1.2. RESEARCH OBJECTIVES
The analysis involves a number of analytical instruments used not only in determining
the group type composition of crude oil, petrol and diesel samples, but also in
determining physical properties such as colloidal instability index, aromaticity factors
of hydrogen and carbon in crude oil, and structural characteristics of asphaltenes. The
objectives of this research are to:
To determine the composition of crude oil in terms of hydrocarbon group type
of saturates, aromatics, resins and asphaltenes using HPLC and NMR.
To characterize the asphaltenes samples by XRD.
To determine the saturates and aromatics hydrocarbons in petrol, diesel,
lubricant samples
To find the API and colloidal instability index of crude oil.
Page 13
3
1.3. RESEARCH SCOPE AND LIMITATIONS
There is a vast majority of test methods on petroleum products that is available that
cannot all be covered on this topic. Laboratory tests and analysis that are relevant to
the research is covered in this report. The limitations involved in this research project
include:
Comparison of different types of crude oil cannot be achieved as only one
sample of crude oil is obtained.
The HPLC equipment available restricts the determination of resins fraction
because the method requires two amino columns connected in series and a
column switching valve.
Hexane solvent as a single parameter for asphaltenes precipitation is only used
to produce asphaltenes, hence parameters such as temperature, pressure and
different solvents are kept constant.
Page 14
4
2. LITERATURE REVIEW
2.1. CRUDE OIL PROPERTIES
Elemental analysis of petroleum shows that the major constituents are carbon and
hydrogen with smaller amounts of sulphur, nitrogen, oxygen and trace elements such
as vanadium, nickel, iron and copper. Sulphur is the most abundant non hydrocarbon
and often considered the most important by refiners. However nitrogen and trace
metal can be poisonous on the refining catalyst (Speight, 2002). Crude oils form a
continuum of hydrocarbon species from gas to the heaviest components made up of
asphaltenes, given the complexity of the mixtures, it is difficult to analyze crude oils
completely, and hence techniques of fractionation are used in the characterization of
petroleum as well as techniques of elemental analysis applied to the fractions
obtained. When it comes to the heaviest of petroleum fraction such as asphaltenes,
modern analytical methods are not able to isolate and characterize completely
(Wauquier, 1994). The physical properties such as API gravity are considerably
influenced by high-boiling constituents, in which the heteroatoms (Sulphur, nitrogen
and metals) concentrate, therefore these lead to determining the percentage of
asphaltenes and resins (Fahim, 2012).
The determination of various compounds present in crude oils can be used for
classification, such as boiling point fractionation which is widely used for
classification based on the temperature range at which types of compounds are
removed and the boiling point range is directly related to the size and complexity of
crude oil components (Klein, 2005). Depending on the boiling point range of the
sample, fractionated products fall into three major categories: light distillates, middle
distillates, and heavy distillates. All gasoline range materials and naphtha are
considered light distillates, the middle distillate are diesel, jet fuel and kerosene range
samples. The ideal chromatographic method for the determination of individual
compounds, boiling point distribution, and the method should fulfill the following the
requirements that it should be (i) reproducible, (ii) rapid, (iii) adequate for quality
control, (iv) quantitative and (v) applicable to the whole sample without requiring pre-
Page 15
5
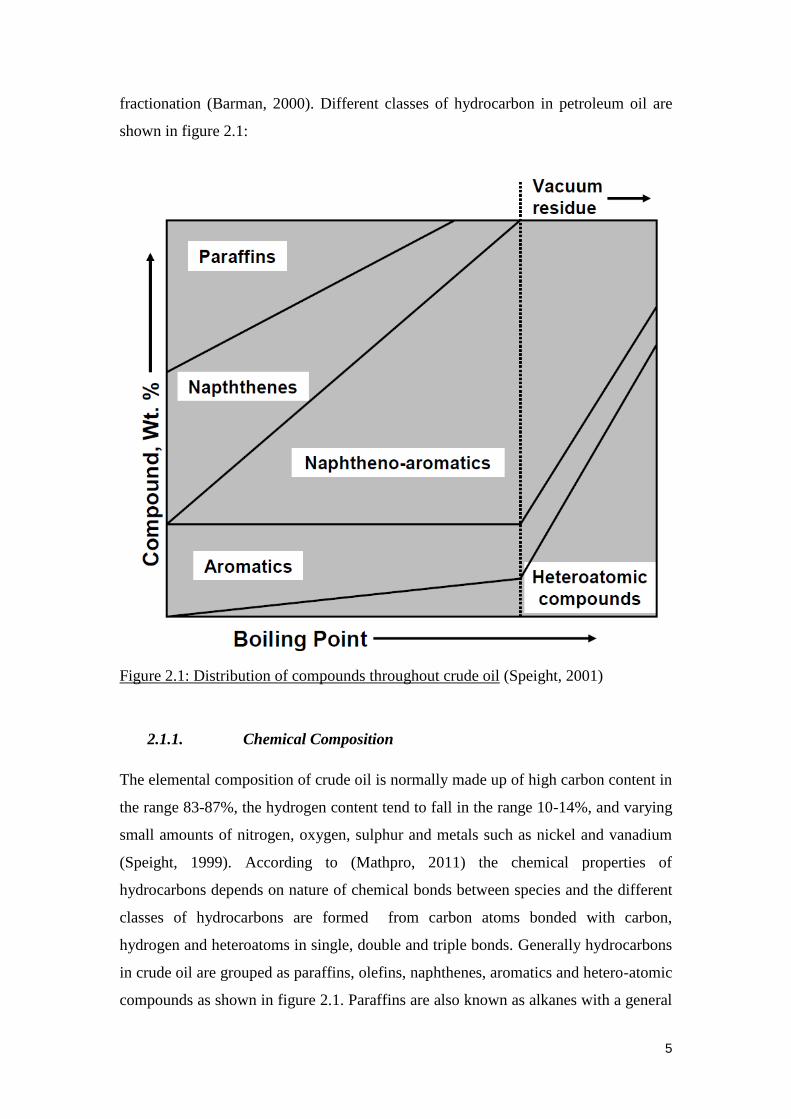
fractionation (Barman, 2000). Different classes of hydrocarbon in petroleum oil are
shown in figure 2.1:
Figure 2.1: Distribution of compounds throughout crude oil (Speight, 2001)
2.1.1. Chemical Composition
The elemental composition of crude oil is normally made up of high carbon content in
the range 83-87%, the hydrogen content tend to fall in the range 10-14%, and varying
small amounts of nitrogen, oxygen, sulphur and metals such as nickel and vanadium
(Speight, 1999). According to (Mathpro, 2011) the chemical properties of
hydrocarbons depends on nature of chemical bonds between species and the different
classes of hydrocarbons are formed from carbon atoms bonded with carbon,
hydrogen and heteroatoms in single, double and triple bonds. Generally hydrocarbons
in crude oil are grouped as paraffins, olefins, naphthenes, aromatics and hetero-atomic
compounds as shown in figure 2.1. Paraffins are also known as alkanes with a general
Page 16
6
molecular formula of CnH2n+2 and occur as straight or branched chains of carbon
atoms. This group of compounds are saturated hydrocarbons with branched chain
paraffins possessing higher octane number than the normal paraffins (Speight, 1980).
Examples of straight chain molecule (Butane) and branched chain paraffin molecule
isobutane are illustrated in Table 2.1 .
Table 2.1: Examples of Paraffin molecules
Methane (CH4) Butane (C4H10) Isobutane (C4H10)
Aromatic compounds are characterized by at least single benzene ring as part of their
molecular structure and the aromatics class of compounds are unsaturated cyclic
compounds which tend to react readily because of presence of chemical double bonds.
Typical examples of aromatic compounds include Benzene and Naphthalene as shown
on the following table:
Page 17
7
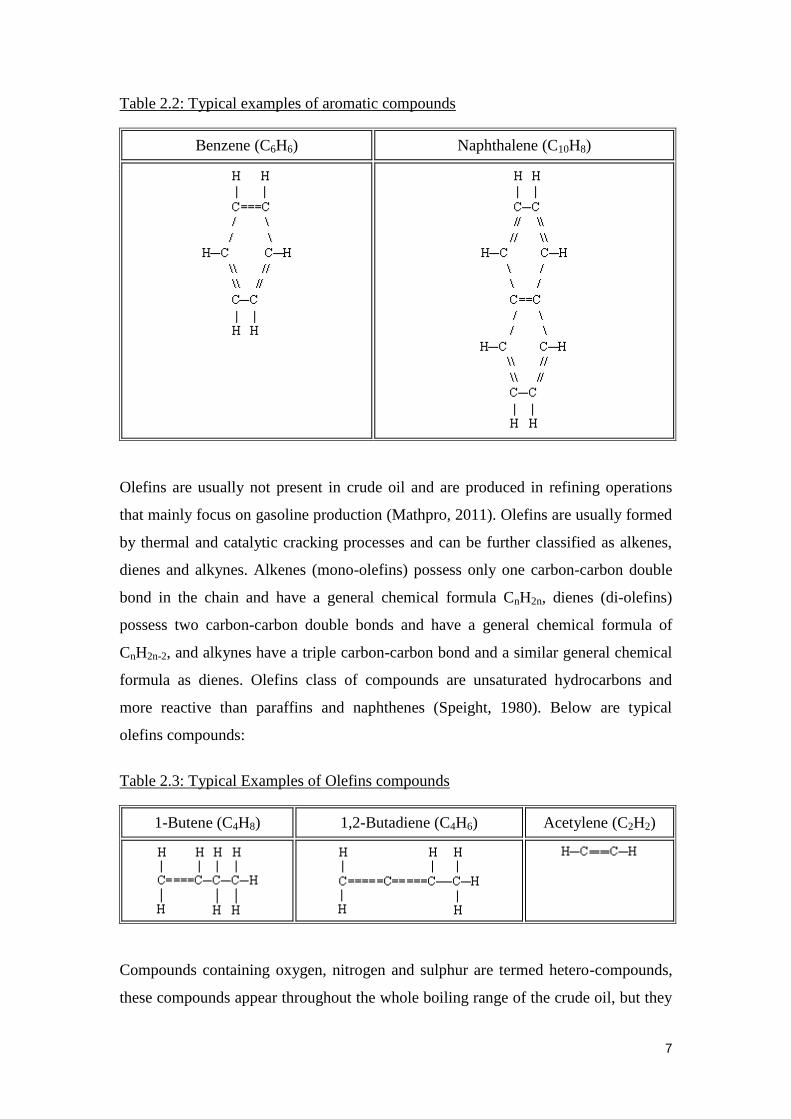
Table 2.2: Typical examples of aromatic compounds
Benzene (C6H6) Naphthalene (C10H8)
Olefins are usually not present in crude oil and are produced in refining operations
that mainly focus on gasoline production (Mathpro, 2011). Olefins are usually formed
by thermal and catalytic cracking processes and can be further classified as alkenes,
dienes and alkynes. Alkenes (mono-olefins) possess only one carbon-carbon double
bond in the chain and have a general chemical formula CnH2n, dienes (di-olefins)
possess two carbon-carbon double bonds and have a general chemical formula of
CnH2n-2, and alkynes have a triple carbon-carbon bond and a similar general chemical
formula as dienes. Olefins class of compounds are unsaturated hydrocarbons and
more reactive than paraffins and naphthenes (Speight, 1980). Below are typical
olefins compounds:
Table 2.3: Typical Examples of Olefins compounds
1-Butene (C4H8) 1,2-Butadiene (C4H6) Acetylene (C2H2)
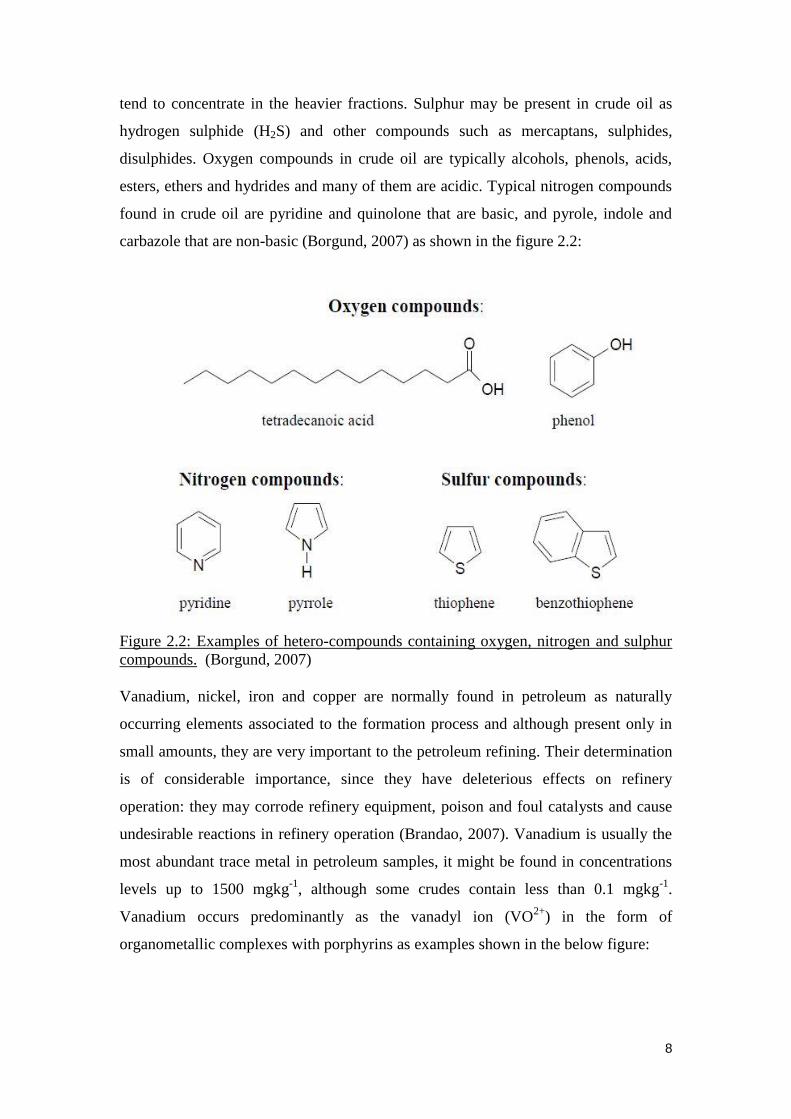
Compounds containing oxygen, nitrogen and sulphur are termed hetero-compounds,
these compounds appear throughout the whole boiling range of the crude oil, but they
Page 18
8
tend to concentrate in the heavier fractions. Sulphur may be present in crude oil as
hydrogen sulphide (H2S) and other compounds such as mercaptans, sulphides,
disulphides. Oxygen compounds in crude oil are typically alcohols, phenols, acids,
esters, ethers and hydrides and many of them are acidic. Typical nitrogen compounds
found in crude oil are pyridine and quinolone that are basic, and pyrole, indole and
carbazole that are non-basic (Borgund, 2007) as shown in the figure 2.2:
Figure 2.2: Examples of hetero-compounds containing oxygen, nitrogen and sulphur
compounds. (Borgund, 2007)
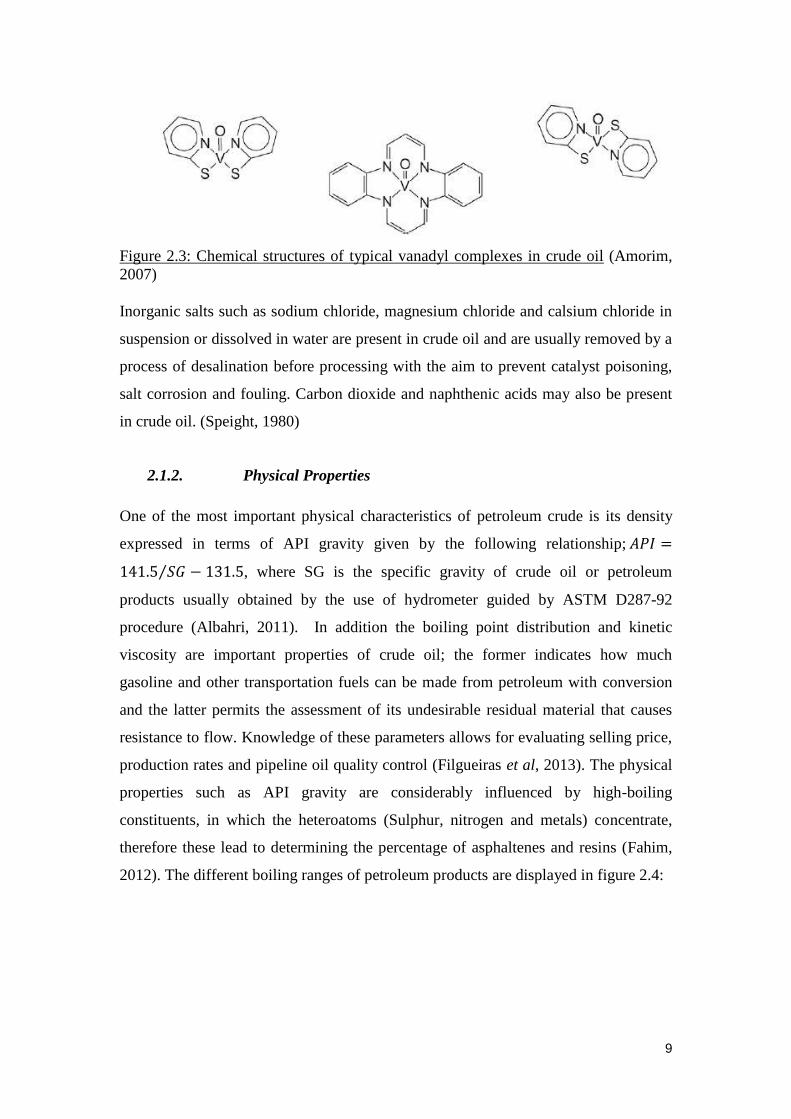
Vanadium, nickel, iron and copper are normally found in petroleum as naturally
occurring elements associated to the formation process and although present only in
small amounts, they are very important to the petroleum refining. Their determination
is of considerable importance, since they have deleterious effects on refinery
operation: they may corrode refinery equipment, poison and foul catalysts and cause
undesirable reactions in refinery operation (Brandao, 2007). Vanadium is usually the
most abundant trace metal in petroleum samples, it might be found in concentrations
levels up to 1500 mgkg-1
, although some crudes contain less than 0.1 mgkg-1
.
Vanadium occurs predominantly as the vanadyl ion (VO2+
) in the form of
organometallic complexes with porphyrins as examples shown in the below figure:
Page 19
9
Figure 2.3: Chemical structures of typical vanadyl complexes in crude oil (Amorim,
2007)
Inorganic salts such as sodium chloride, magnesium chloride and calsium chloride in
suspension or dissolved in water are present in crude oil and are usually removed by a
process of desalination before processing with the aim to prevent catalyst poisoning,
salt corrosion and fouling. Carbon dioxide and naphthenic acids may also be present
in crude oil. (Speight, 1980)
2.1.2. Physical Properties
One of the most important physical characteristics of petroleum crude is its density
expressed in terms of API gravity given by the following relationship;
⁄ , where SG is the specific gravity of crude oil or petroleum
products usually obtained by the use of hydrometer guided by ASTM D287-92
procedure (Albahri, 2011). In addition the boiling point distribution and kinetic
viscosity are important properties of crude oil; the former indicates how much
gasoline and other transportation fuels can be made from petroleum with conversion
and the latter permits the assessment of its undesirable residual material that causes
resistance to flow. Knowledge of these parameters allows for evaluating selling price,
production rates and pipeline oil quality control (Filgueiras et al, 2013). The physical
properties such as API gravity are considerably influenced by high-boiling
constituents, in which the heteroatoms (Sulphur, nitrogen and metals) concentrate,
therefore these lead to determining the percentage of asphaltenes and resins (Fahim,
2012). The different boiling ranges of petroleum products are displayed in figure 2.4:
Page 20
10
Figure 2.4: Petroleum products with carbon numbers and boiling ranges (Fahim,
2010)
Page 21
11
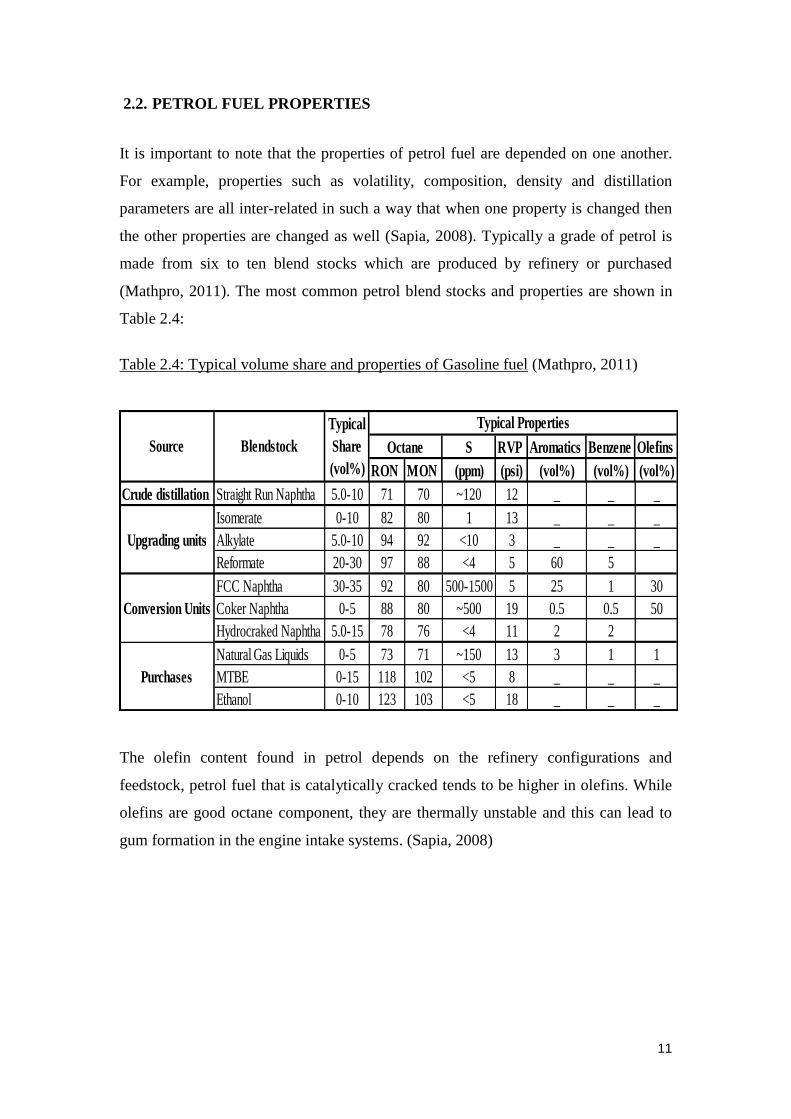
2.2. PETROL FUEL PROPERTIES
It is important to note that the properties of petrol fuel are depended on one another.
For example, properties such as volatility, composition, density and distillation
parameters are all inter-related in such a way that when one property is changed then
the other properties are changed as well (Sapia, 2008). Typically a grade of petrol is
made from six to ten blend stocks which are produced by refinery or purchased
(Mathpro, 2011). The most common petrol blend stocks and properties are shown in
Table 2.4:
Table 2.4: Typical volume share and properties of Gasoline fuel (Mathpro, 2011)
The olefin content found in petrol depends on the refinery configurations and
feedstock, petrol fuel that is catalytically cracked tends to be higher in olefins. While
olefins are good octane component, they are thermally unstable and this can lead to
gum formation in the engine intake systems. (Sapia, 2008)
S RVP Aromatics Benzene Olefins
RON MON (ppm) (psi) (vol%) (vol%) (vol%)
Crude distillation Straight Run Naphtha 5.0-10 71 70 ~120 12 _ _ _
Isomerate 0-10 82 80 1 13 _ _ _
Alkylate 5.0-10 94 92 <10 3 _ _ _
Reformate 20-30 97 88 <4 5 60 5
FCC Naphtha 30-35 92 80 500-1500 5 25 1 30
Coker Naphtha 0-5 88 80 ~500 19 0.5 0.5 50
Hydrocraked Naphtha 5.0-15 78 76 <4 11 2 2
Natural Gas Liquids 0-5 73 71 ~150 13 3 1 1
MTBE 0-15 118 102 <5 8 _ _ _
Ethanol 0-10 123 103 <5 18 _ _ _
Conversion Units
Purchases
Source Blendstock
Typical
Share
(vol%)
Typical Properties
Octane
Upgrading units
Page 22
12
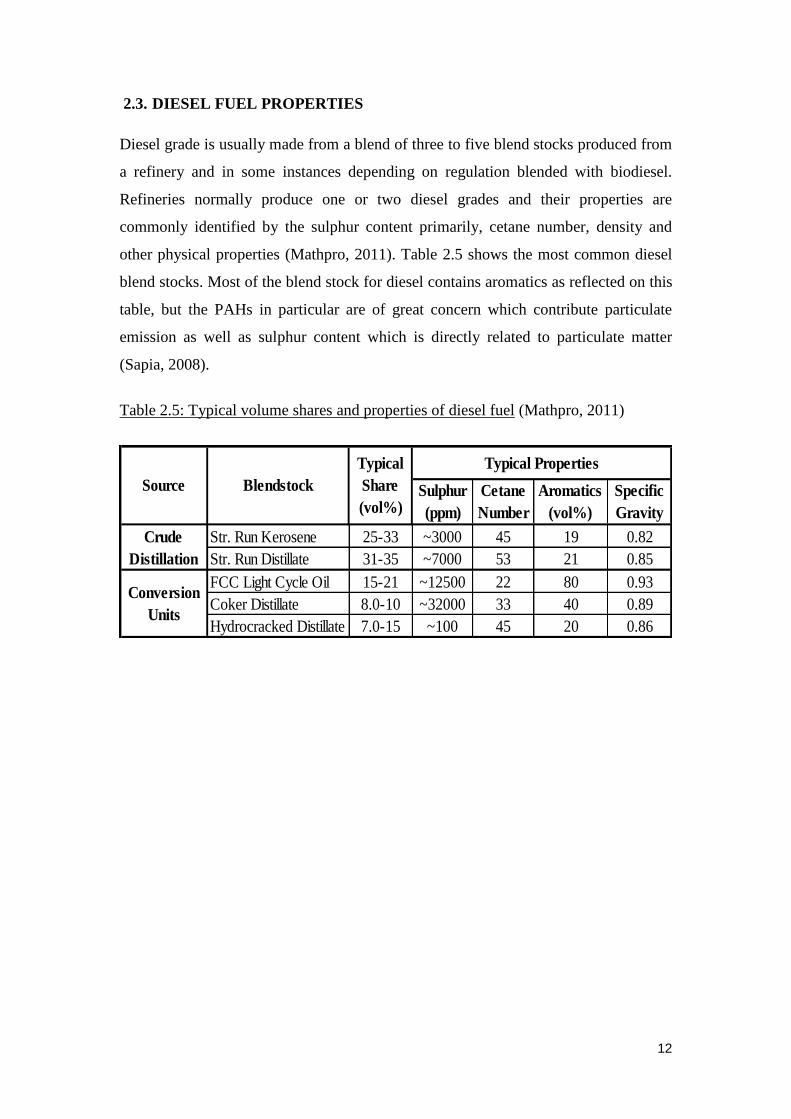
2.3. DIESEL FUEL PROPERTIES
Diesel grade is usually made from a blend of three to five blend stocks produced from
a refinery and in some instances depending on regulation blended with biodiesel.
Refineries normally produce one or two diesel grades and their properties are
commonly identified by the sulphur content primarily, cetane number, density and
other physical properties (Mathpro, 2011). Table 2.5 shows the most common diesel
blend stocks. Most of the blend stock for diesel contains aromatics as reflected on this
table, but the PAHs in particular are of great concern which contribute particulate
emission as well as sulphur content which is directly related to particulate matter
(Sapia, 2008).
Table 2.5: Typical volume shares and properties of diesel fuel (Mathpro, 2011)
Sulphur
(ppm)
Cetane
Number
Aromatics
(vol%)
Specific
Gravity
Str. Run Kerosene 25-33 ~3000 45 19 0.82
Str. Run Distillate 31-35 ~7000 53 21 0.85
FCC Light Cycle Oil 15-21 ~12500 22 80 0.93
Coker Distillate 8.0-10 ~32000 33 40 0.89
Hydrocracked Distillate 7.0-15 ~100 45 20 0.86
Typical
Share
(vol%)
Typical Properties
Conversion
Units
Crude
Distillation
Source Blendstock
Page 23
13
2.4. SARA ANALYSIS
There are four major classes of hydrocarbons found in crude oils, which include
saturates, aromatics, resins and asphaltenes. The SARA analysis determines the
content of each class hydrocarbons (Sinnathambi et al, 2012). Using this method
crude oil is separated into components according to their polarizability and polarity.
There are three main ways to separate crude oils by chromatography into saturate,
aromatics, resins and asphaltenes fractions: A clay-gel adsorption chromatography
method which manually samples a high volume of crude oil and large quantities of
solvents, this is based on the ASTM D2007 standard method of procedure. Secondly
high performance liquid chromatography methods are faster, more reproducible and
more readily automated than the first chromatography method. In both methods it is
very important to note that the asphaltenes fraction is removed before proceeding with
the chromatography since the asphaltenes are either irreversibly adsorbed or
precipitated in the saturate elution step. The third and fastest method uses thin layer
chromatography (TLC) with quartz rods with sintered silica particles, this method
uses very small amounts of samples and does not require asphaltenes to be removed
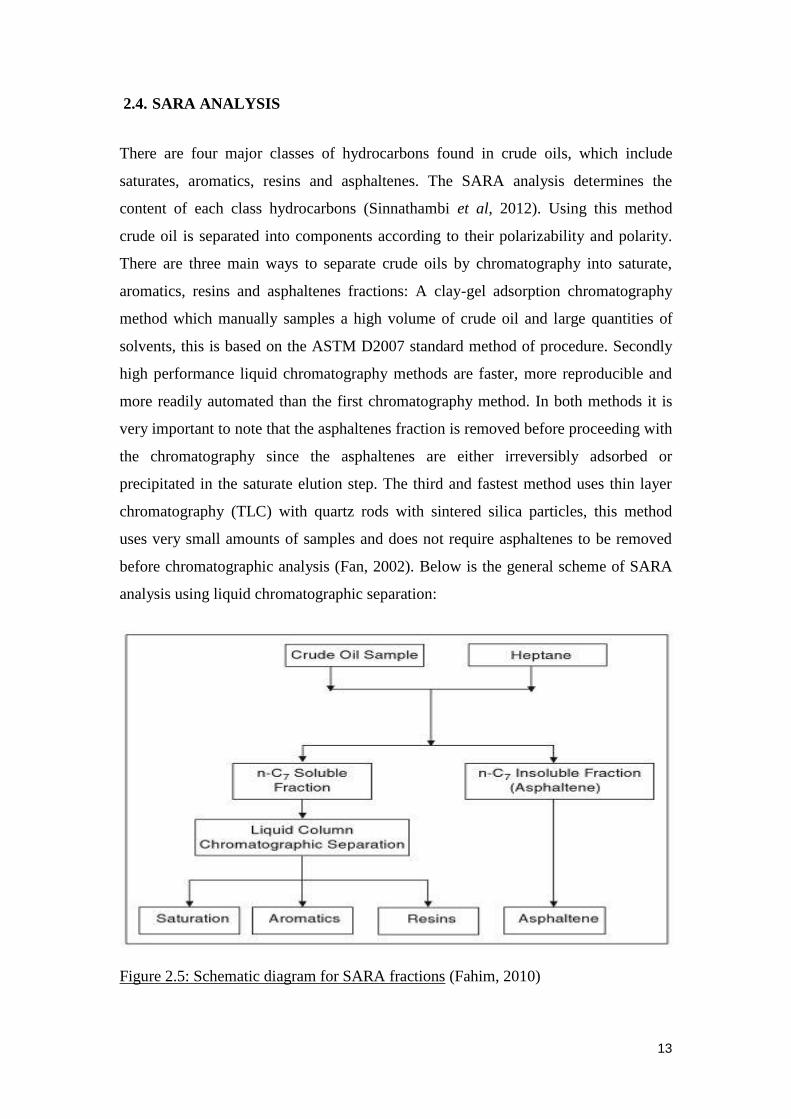
before chromatographic analysis (Fan, 2002). Below is the general scheme of SARA
analysis using liquid chromatographic separation:
Figure 2.5: Schematic diagram for SARA fractions (Fahim, 2010)
Page 24
14
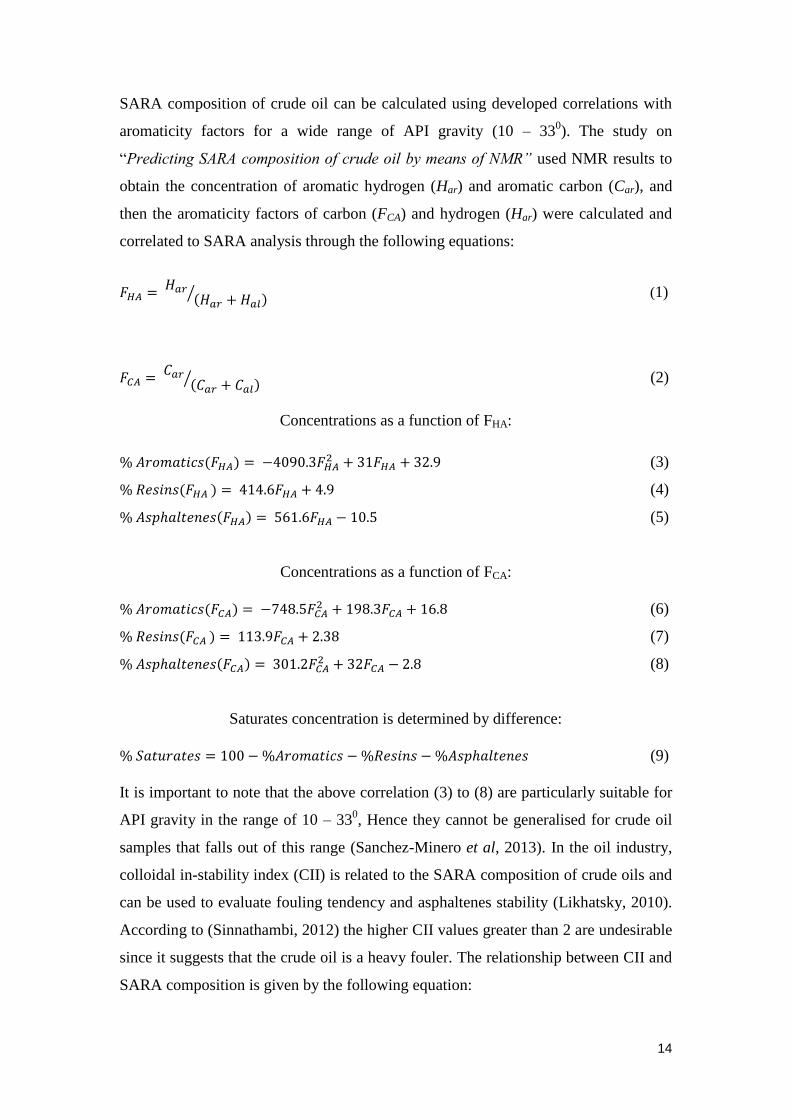
SARA composition of crude oil can be calculated using developed correlations with
aromaticity factors for a wide range of API gravity (10 – 330). The study on
“Predicting SARA composition of crude oil by means of NMR” used NMR results to
obtain the concentration of aromatic hydrogen (Har) and aromatic carbon (Car), and
then the aromaticity factors of carbon (FCA) and hydrogen (Har) were calculated and
correlated to SARA analysis through the following equations:
( )⁄ (1)
( )⁄ (2)
Concentrations as a function of FHA:
( ) (3)
( ) (4)
( ) (5)
Concentrations as a function of FCA:
( ) (6)
( ) (7)
( ) (8)
Saturates concentration is determined by difference:
(9)
It is important to note that the above correlation (3) to (8) are particularly suitable for
API gravity in the range of 10 – 330, Hence they cannot be generalised for crude oil
samples that falls out of this range (Sanchez-Minero et al, 2013). In the oil industry,
colloidal in-stability index (CII) is related to the SARA composition of crude oils and
can be used to evaluate fouling tendency and asphaltenes stability (Likhatsky, 2010).
According to (Sinnathambi, 2012) the higher CII values greater than 2 are undesirable
since it suggests that the crude oil is a heavy fouler. The relationship between CII and
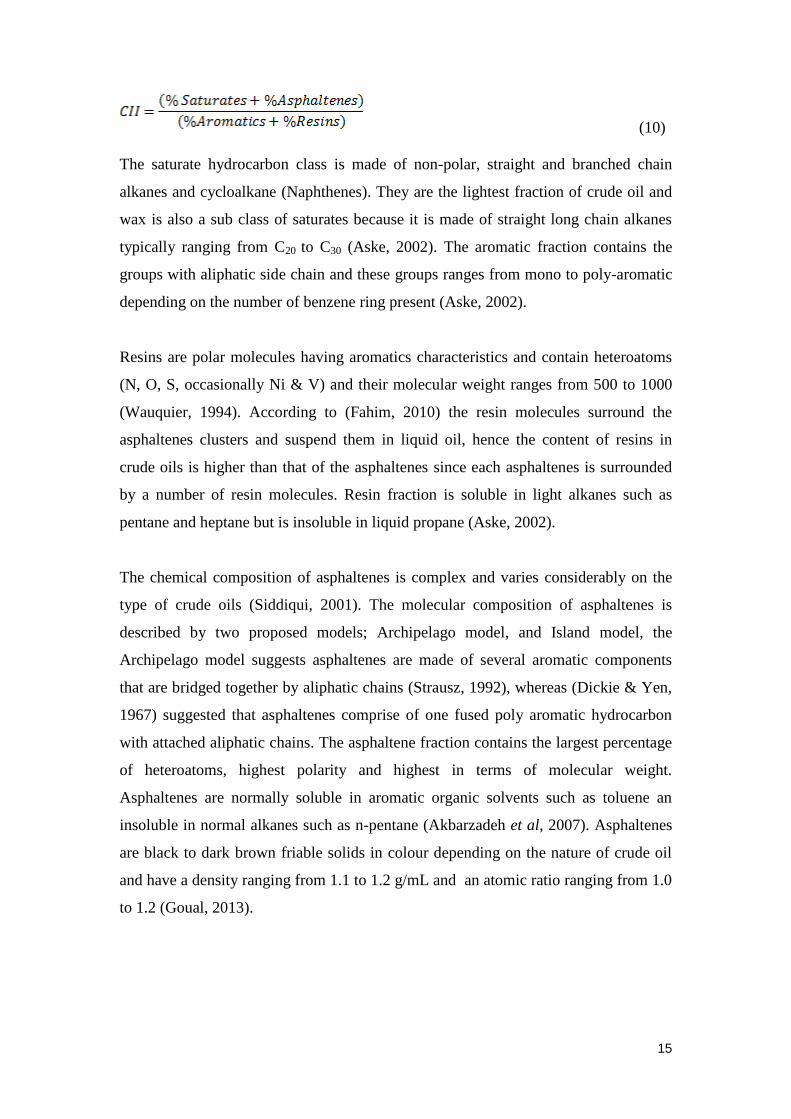
SARA composition is given by the following equation:
Page 25
15
(10)
The saturate hydrocarbon class is made of non-polar, straight and branched chain
alkanes and cycloalkane (Naphthenes). They are the lightest fraction of crude oil and
wax is also a sub class of saturates because it is made of straight long chain alkanes
typically ranging from C20 to C30 (Aske, 2002). The aromatic fraction contains the
groups with aliphatic side chain and these groups ranges from mono to poly-aromatic
depending on the number of benzene ring present (Aske, 2002).
Resins are polar molecules having aromatics characteristics and contain heteroatoms
(N, O, S, occasionally Ni & V) and their molecular weight ranges from 500 to 1000
(Wauquier, 1994). According to (Fahim, 2010) the resin molecules surround the
asphaltenes clusters and suspend them in liquid oil, hence the content of resins in
crude oils is higher than that of the asphaltenes since each asphaltenes is surrounded
by a number of resin molecules. Resin fraction is soluble in light alkanes such as
pentane and heptane but is insoluble in liquid propane (Aske, 2002).
The chemical composition of asphaltenes is complex and varies considerably on the
type of crude oils (Siddiqui, 2001). The molecular composition of asphaltenes is
described by two proposed models; Archipelago model, and Island model, the
Archipelago model suggests asphaltenes are made of several aromatic components
that are bridged together by aliphatic chains (Strausz, 1992), whereas (Dickie & Yen,
1967) suggested that asphaltenes comprise of one fused poly aromatic hydrocarbon
with attached aliphatic chains. The asphaltene fraction contains the largest percentage
of heteroatoms, highest polarity and highest in terms of molecular weight.
Asphaltenes are normally soluble in aromatic organic solvents such as toluene an
insoluble in normal alkanes such as n-pentane (Akbarzadeh et al, 2007). Asphaltenes
are black to dark brown friable solids in colour depending on the nature of crude oil
and have a density ranging from 1.1 to 1.2 g/mL and an atomic ratio ranging from 1.0
to 1.2 (Goual, 2013).
Page 26
16
2.5. ASPHALTENE PRECIPITATION
The process of precipitation of asphaltenes is a complex phenomenon which involves
the interaction of asphaltenes and resins since resins have a strong association with
asphaltenes in terms of their solubility in crude oil (Buenrostro-Gonzalez et al, 2004).
Asphaltene precipitation is promoted by pressure, temperature and composition
variations (Goual, 2013). However the effect of composition and pressure on
precipitation is mostly reported to have a stronger effect than the effect of
temperature. Both pressure and temperature are the main contributors of formation of
asphaltene phase during the oil production process and this behaviour can be
described by thermodynamic models in order to forecast or predict the onset points of
precipitation (Buenrostro-Gonzalez et al, 2004).
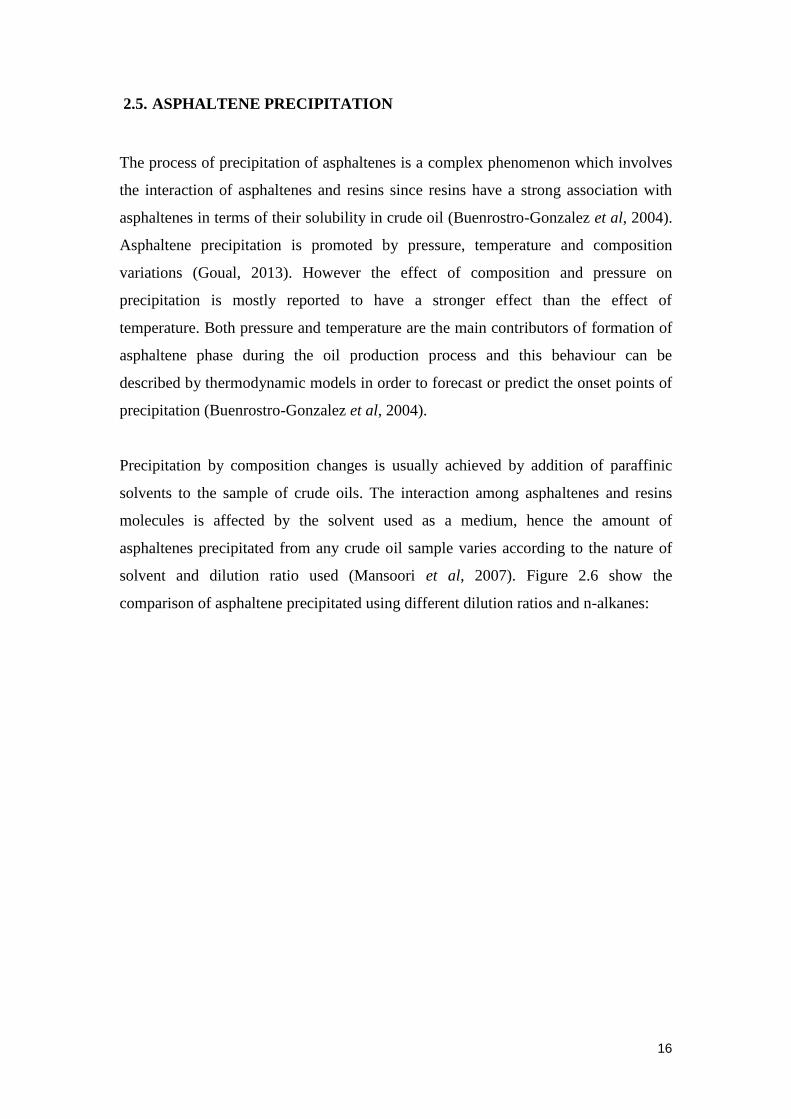
Precipitation by composition changes is usually achieved by addition of paraffinic
solvents to the sample of crude oils. The interaction among asphaltenes and resins
molecules is affected by the solvent used as a medium, hence the amount of
asphaltenes precipitated from any crude oil sample varies according to the nature of
solvent and dilution ratio used (Mansoori et al, 2007). Figure 2.6 show the
comparison of asphaltene precipitated using different dilution ratios and n-alkanes:
Page 27
17
Figure 2.6: Example of Asphaltene precipitation using three different solvents (Amin,
2010)
2.6. ASPHALTENE MOLECULAR STRUCTURE
The structural characteristics of asphaltenes are very significant in determining yields
from residual fraction of crude oil (Siddiqui et al, 1996). Asphaltenes are believed to
be suspended as micro colloid in the crude oil, consisting of particle of about 3nm
(Sheu and Mullins, 1996). X-Ray diffraction and NMR are two established techniques
for the determining the structural and crystallite characteristics of asphaltene
molecules.
Page 28
18
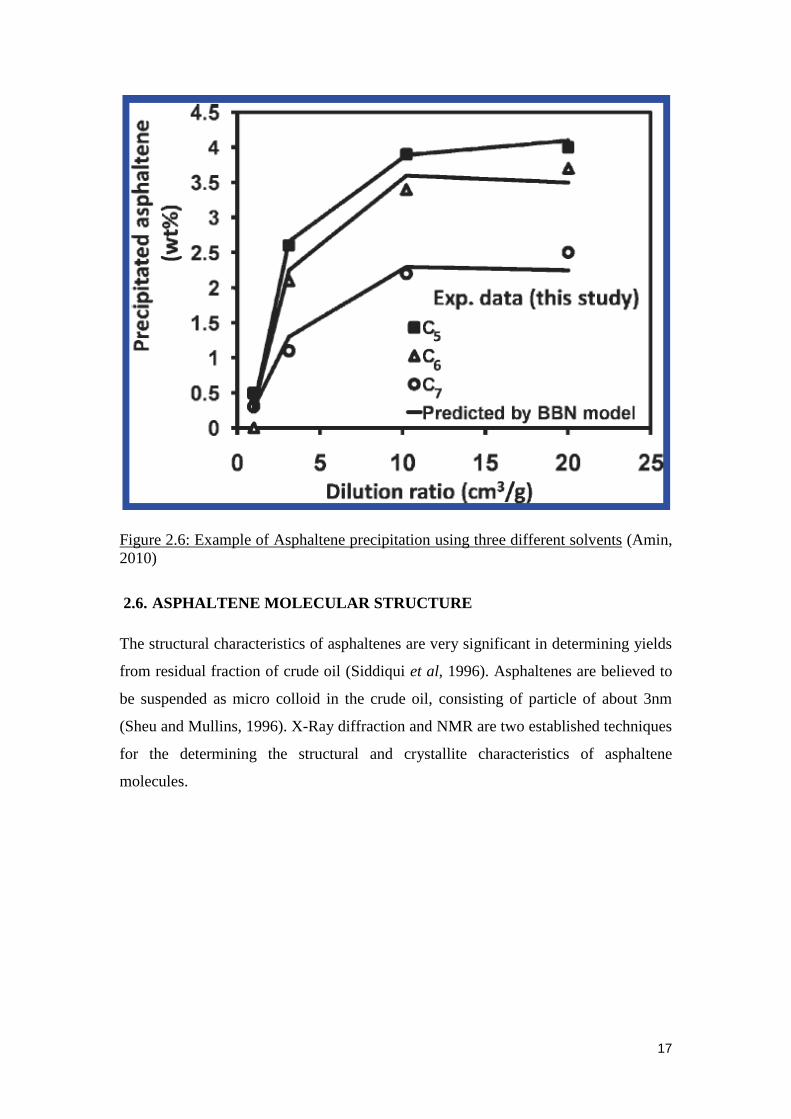
Figure 2.7: Cross-section of asphaltene model and group types that give rise to XRD
peaks (Yen, 1961)
The crystallite parameters shown by figure 2.7 are discussed by both Shirokoff et al
(1997) and Siddiqui et al (2002) by the following relation; the layer distance between
aromatic sheets is calculated by the Bragg relation:
(11)
And the interchain layer distance is given by the following equation:
(12)
The method used by Siddiqui et al (2002) to obtain to estimate of Aromaticity fa is
determined from the calculated areas A of the resolved peaks of γ and graphene bands
using the formula:
Page 29
19
⁄
( )⁄
( )( ( ) ( ))⁄ (13)
Where CS, CA and C are the number of saturated aromatic and total carbon atoms per
structural unit respectively.
Page 30
20
3. EXPERIMENTAL METHODS AND MATERIALS
3.1. ASPHALTENE PRECIPITATION METHODOLOGY
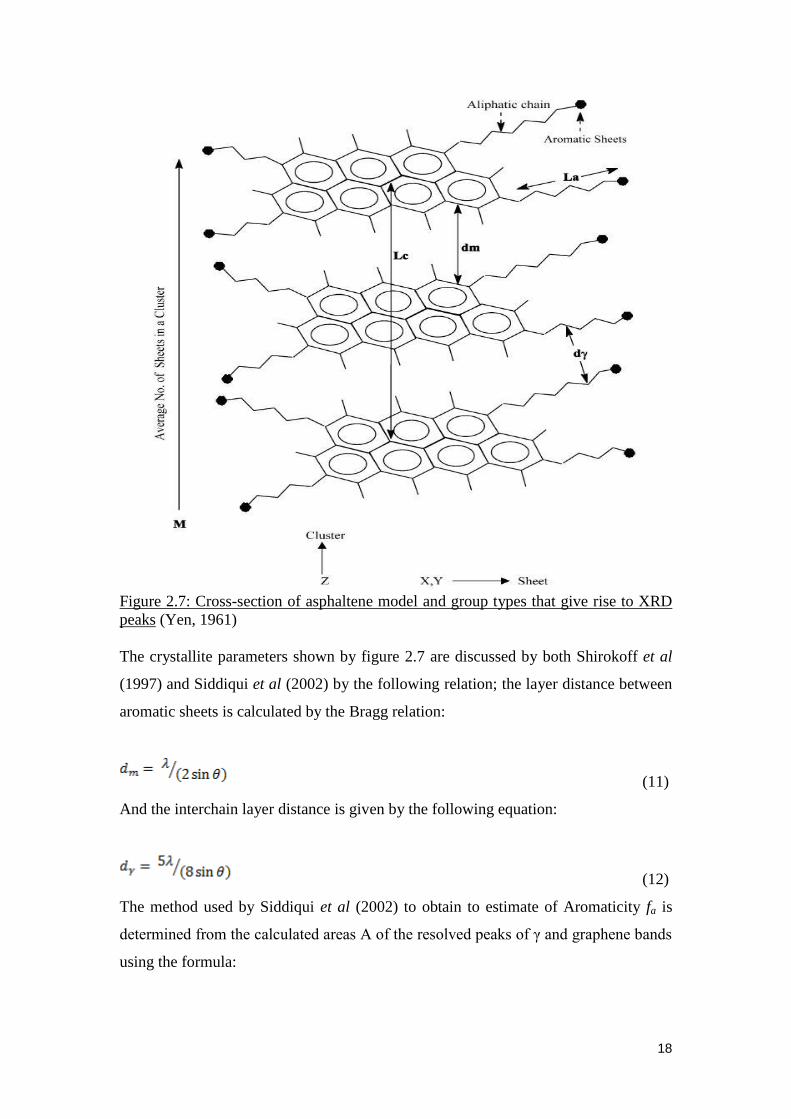
The aim of this analysis is to separate crude oil into asphaltene and maltenes fractions.
Maltenes are composed of the remaining saturates, aromatics and resins fractions,
Initially the treatment of crude oil with n-hexane provides the separation of
asphaltenes. Crude oil is added to n-hexane in a solvent ratio (cm3 of n-hexane per
5cm3 of crude oil) of 10, 15, 30, 40 and 50 into separate 250ml volumetric flasks. The
mixture is continuously stirred for 4 hours at room temperature and atmospheric
pressure. Then the solution is then left to stand overnight prior to filtering. Filtering is
achieved under vacuum with filter membrane of pore size 0.25 microns and normal
hexane is used to wash any presence of wax by further washing with hexane. The
asphaltenes precipitated are dried overnight in an oven at 600C to remove any volatile
material present. So finally the maltenes sample of each is collected by from the
filtrate and the samples are run in HPLC unit while the sample asphaltenes is further
subjected to X-ray diffraction to characterize its structure. Figure 3.1 shows a
summary of asphaltene precipitation method:
Figure 3.1: Summary of Asphaltene precipitation (Wu, 2004)
Page 31
21
3.2. X-RAY DIFFRACTION METHODOLOGY
The asphaltene examined in this study are samples collected from the asphaltene
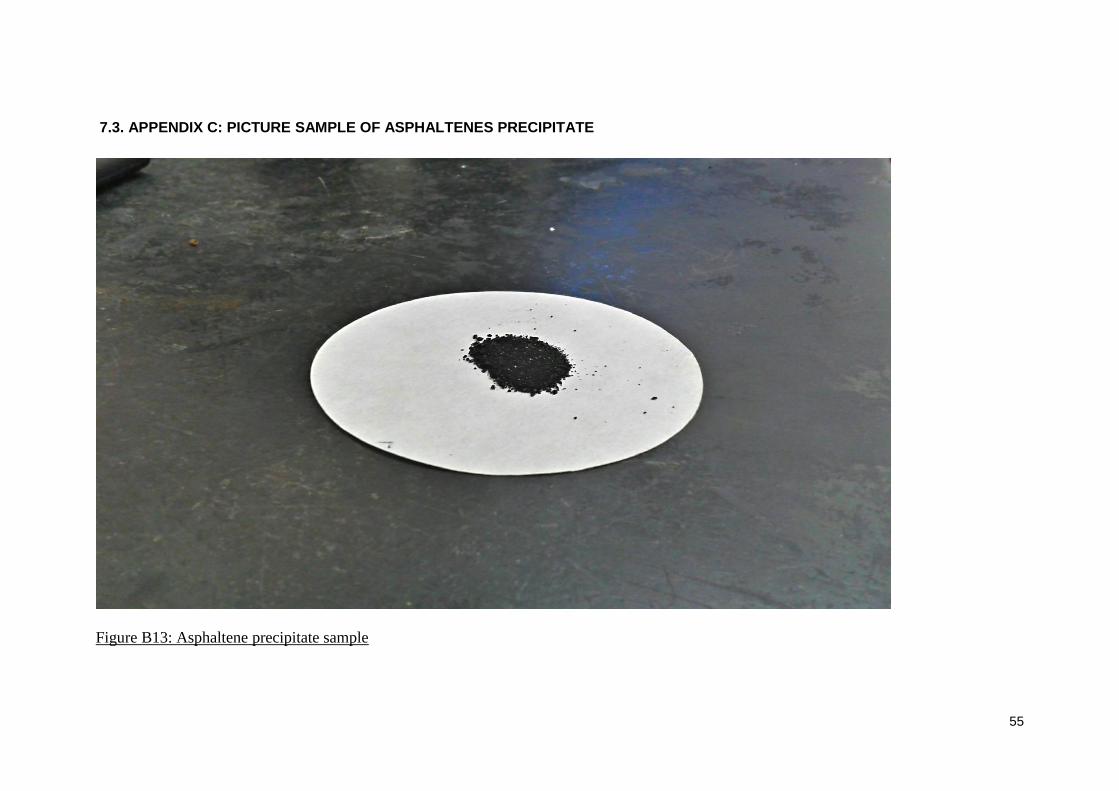
precipitation experiment. The asphaltene samples produced are shown in figure B13.
The sample were first grounded into fine powder particles, then XRD measurements
were performed on the prepared samples with an automated diffractometer using
cobalt radiation at a wavelength of 1.78897 Ǻ. The analysis is aided by computer
software to perform a peak profile analysis. The profile fitting used a Lorentzian mix-
mathematical model to obtain the area under γ and graphene peak, and also determine
the peak positions.
3.3. NMR ANALYSES METHODOLOGY
600µl crude oil sample is dissolved in 100µl deuterochloroform solvent and
tetramethylsilane is used as a chemical shift standard in both 1H-NMR and
13C-NMR
analysis performed on Bruker 500MHz spectrometer. The quantitative 13
C spectrum is
obtained by using a decoupling pulse delay sequence, with no relaxation agent and a
20 second pulse delay. Two spectra are obtained for the sample of crude oil, and the
integration for 1H spectra is expected to show peaks in the range 0 – 4 ppm and 6 – 9
ppm for aromatic hydrogen, While the 13
C spectra, it is expected that the aliphatic
carbon in the range 0 – 70 ppm and aromatic carbon in the range 100 – 170 ppm
chemical shifts.
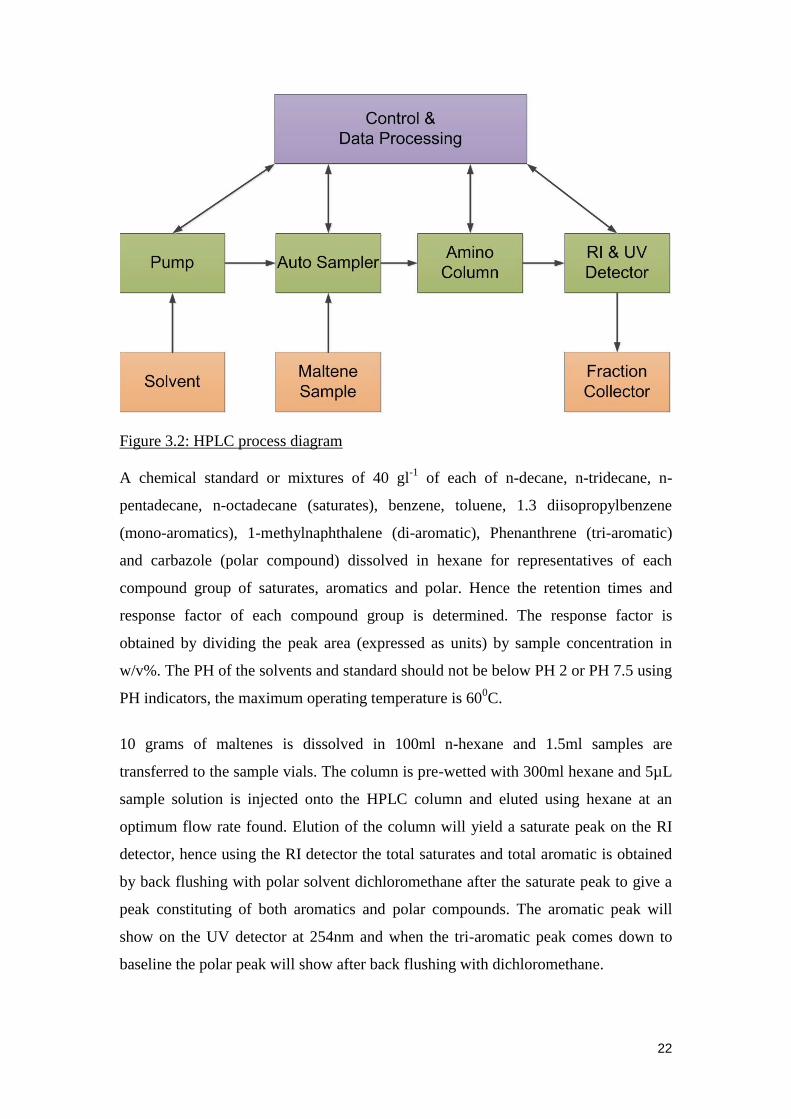
3.4. HPLC ANALYSIS METHODOLOGY
The HPLC chromatographic separation system utilized comprise of pump system,
auto-sampler injection system, ultra-violet (UV) detector and refractive index (RI)
detector. The column used is a 4.6x250mm amino (NH2) analytical column. The
HPLC unit will be calibrated under various condition to optimize solvent usage by
comparison of separation of components at different flow rates ranging from 0.5 to
1.5 ml min-1
, then the optimum peak resolution together with the least amount of
solvent is the target operating conditions. The aromatic and polar resins are measured
with UV detector at 254nm and the response of the saturate peak is obtained from the
RI detector. The figure below shows key units in the HPLC equipment:
Page 32
22
Figure 3.2: HPLC process diagram
A chemical standard or mixtures of 40 gl-1
of each of n-decane, n-tridecane, n-
pentadecane, n-octadecane (saturates), benzene, toluene, 1.3 diisopropylbenzene
(mono-aromatics), 1-methylnaphthalene (di-aromatic), Phenanthrene (tri-aromatic)
and carbazole (polar compound) dissolved in hexane for representatives of each
compound group of saturates, aromatics and polar. Hence the retention times and
response factor of each compound group is determined. The response factor is
obtained by dividing the peak area (expressed as units) by sample concentration in
w/v%. The PH of the solvents and standard should not be below PH 2 or PH 7.5 using
PH indicators, the maximum operating temperature is 600C.
10 grams of maltenes is dissolved in 100ml n-hexane and 1.5ml samples are
transferred to the sample vials. The column is pre-wetted with 300ml hexane and 5µL
sample solution is injected onto the HPLC column and eluted using hexane at an
optimum flow rate found. Elution of the column will yield a saturate peak on the RI
detector, hence using the RI detector the total saturates and total aromatic is obtained
by back flushing with polar solvent dichloromethane after the saturate peak to give a
peak constituting of both aromatics and polar compounds. The aromatic peak will
show on the UV detector at 254nm and when the tri-aromatic peak comes down to
baseline the polar peak will show after back flushing with dichloromethane.
Page 33
23
3.5. API DETERMINATION METHODOLOGY
The estimated API for the crude oil sample collected is carried out by measuring the
mass of the specific volume (10ml) of crude oil sample at different temperatures of
10, 20 and 300C since density is affected by temperature in such a way that density of
liquids tends decreases as temperature increases, then the density calculated at each
temperature is averaged to calculate the API using equation API = 141.5/SG – 131.5.
The results are reported in Table B8.
Page 34
24
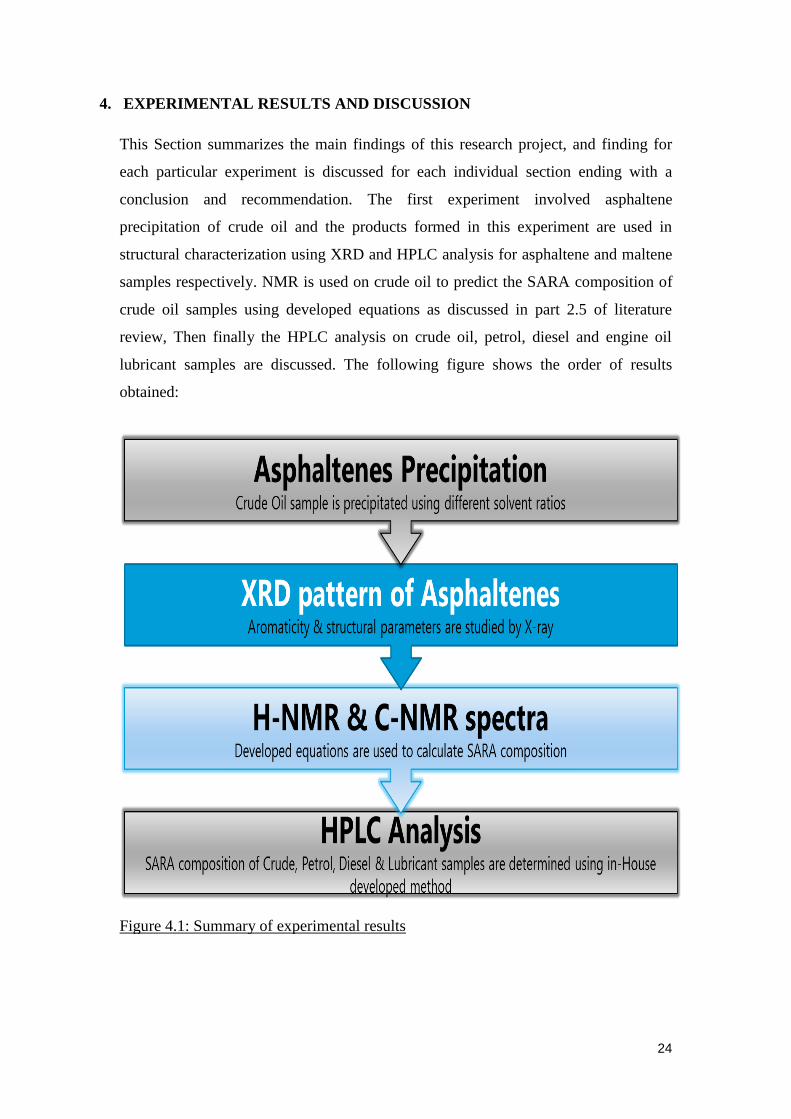
4. EXPERIMENTAL RESULTS AND DISCUSSION
This Section summarizes the main findings of this research project, and finding for
each particular experiment is discussed for each individual section ending with a
conclusion and recommendation. The first experiment involved asphaltene
precipitation of crude oil and the products formed in this experiment are used in
structural characterization using XRD and HPLC analysis for asphaltene and maltene
samples respectively. NMR is used on crude oil to predict the SARA composition of
crude oil samples using developed equations as discussed in part 2.5 of literature
review, Then finally the HPLC analysis on crude oil, petrol, diesel and engine oil
lubricant samples are discussed. The following figure shows the order of results
obtained:
Figure 4.1: Summary of experimental results
Page 35
25
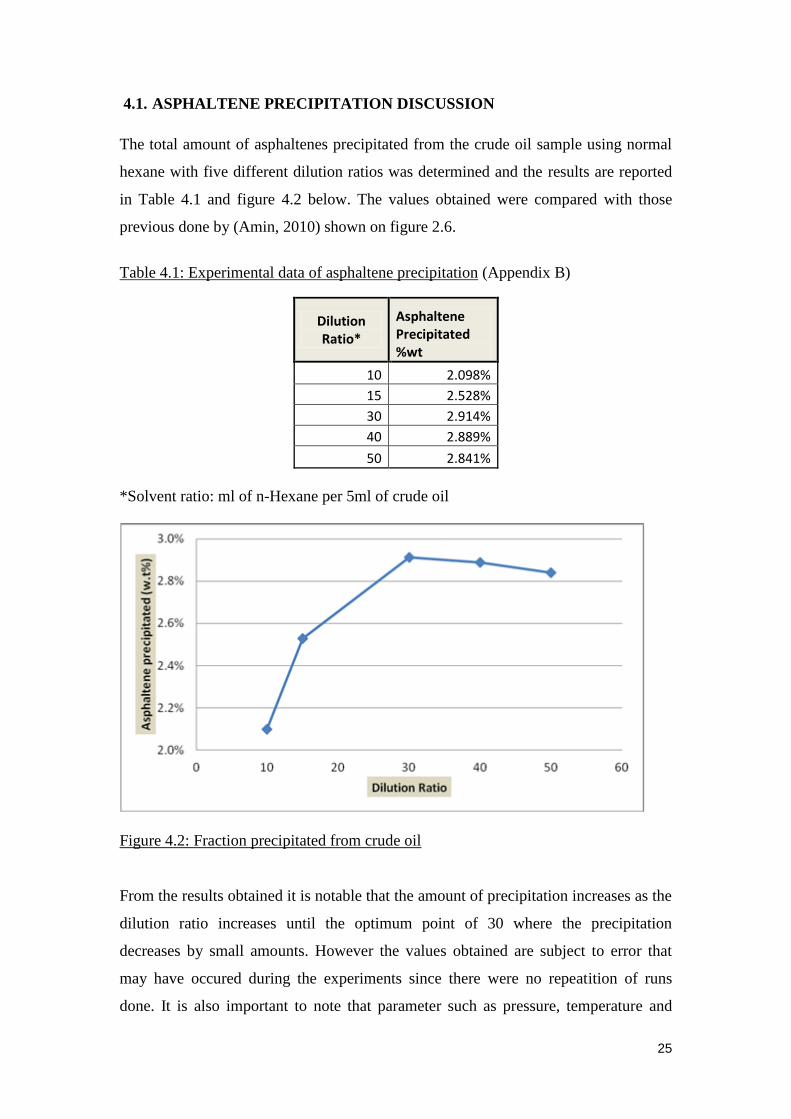
4.1. ASPHALTENE PRECIPITATION DISCUSSION
The total amount of asphaltenes precipitated from the crude oil sample using normal
hexane with five different dilution ratios was determined and the results are reported
in Table 4.1 and figure 4.2 below. The values obtained were compared with those
previous done by (Amin, 2010) shown on figure 2.6.
Table 4.1: Experimental data of asphaltene precipitation (Appendix B)
Dilution Ratio*
Asphaltene Precipitated %wt
10 2.098%
15 2.528%
30 2.914%
40 2.889%
50 2.841%
*Solvent ratio: ml of n-Hexane per 5ml of crude oil
Figure 4.2: Fraction precipitated from crude oil
From the results obtained it is notable that the amount of precipitation increases as the
dilution ratio increases until the optimum point of 30 where the precipitation
decreases by small amounts. However the values obtained are subject to error that
may have occured during the experiments since there were no repeatition of runs
done. It is also important to note that parameter such as pressure, temperature and
Page 36
26
different alkane solvents were not investigated due to the complexity of the
experiment. Hence the solvent used in this experiment at atmospheric pressure and
ambient temperature, does not necessarily precipitate all the asphaltene present in the
sample, but the extent to which the precipitation occurs will be compared with the
NMR results.
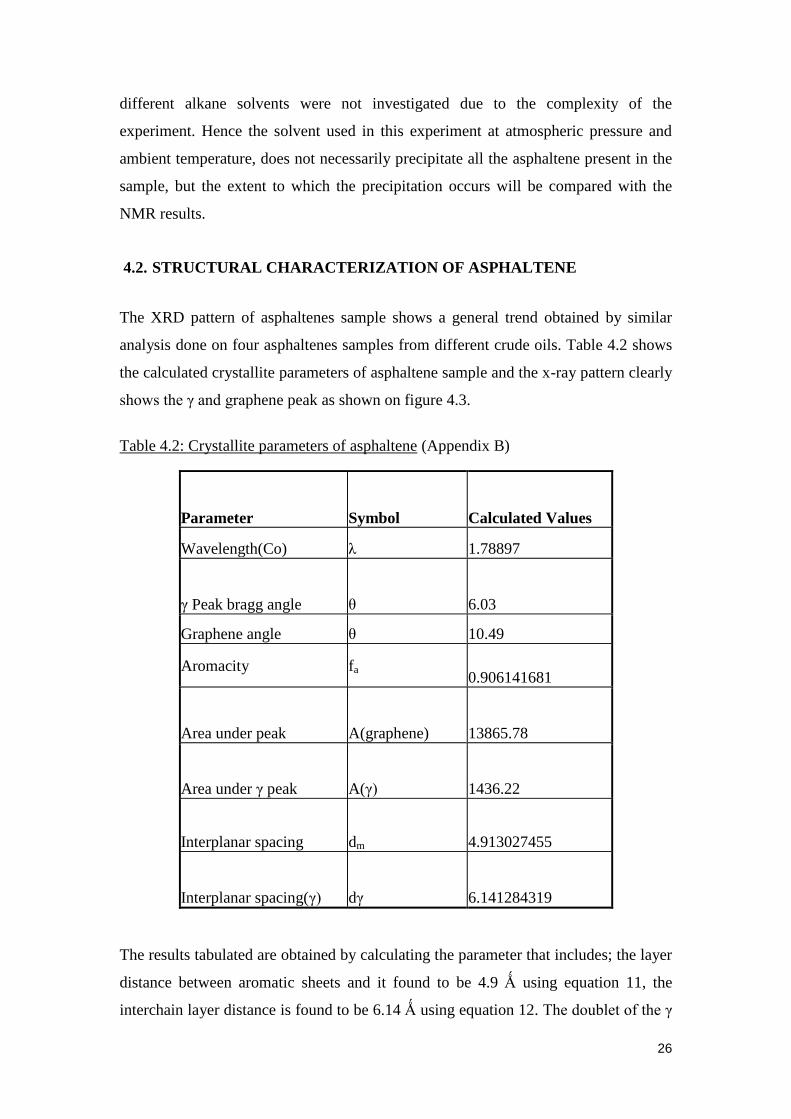
4.2. STRUCTURAL CHARACTERIZATION OF ASPHALTENE
The XRD pattern of asphaltenes sample shows a general trend obtained by similar
analysis done on four asphaltenes samples from different crude oils. Table 4.2 shows
the calculated crystallite parameters of asphaltene sample and the x-ray pattern clearly
shows the γ and graphene peak as shown on figure 4.3.
Table 4.2: Crystallite parameters of asphaltene (Appendix B)
Parameter Symbol Calculated Values
Wavelength(Co) λ 1.78897
γ Peak bragg angle θ 6.03
Graphene angle θ 10.49
Aromacity fa 0.906141681
Area under peak A(graphene) 13865.78
Area under γ peak A(γ) 1436.22
Interplanar spacing dm 4.913027455
Interplanar spacing(γ) dγ 6.141284319
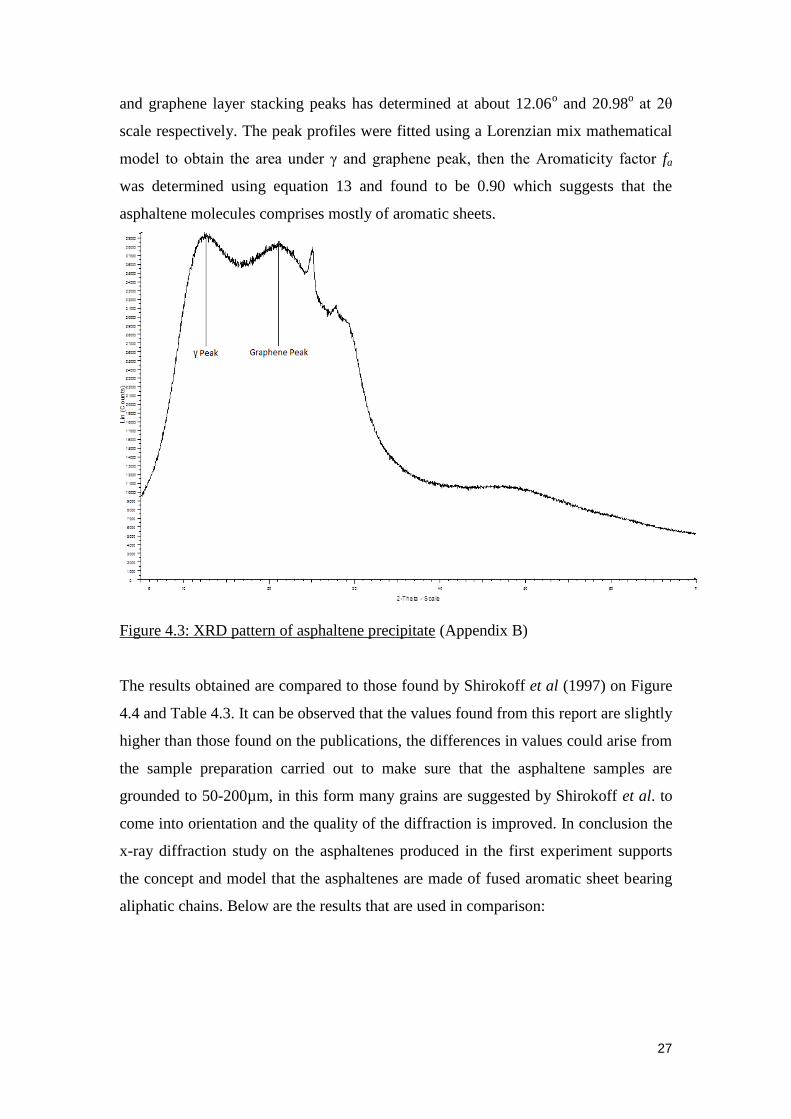
The results tabulated are obtained by calculating the parameter that includes; the layer
distance between aromatic sheets and it found to be 4.9 Ǻ using equation 11, the
interchain layer distance is found to be 6.14 Ǻ using equation 12. The doublet of the γ
Page 37
27
and graphene layer stacking peaks has determined at about 12.06o and 20.98
o at 2θ
scale respectively. The peak profiles were fitted using a Lorenzian mix mathematical
model to obtain the area under γ and graphene peak, then the Aromaticity factor fa
was determined using equation 13 and found to be 0.90 which suggests that the
asphaltene molecules comprises mostly of aromatic sheets.
Figure 4.3: XRD pattern of asphaltene precipitate (Appendix B)
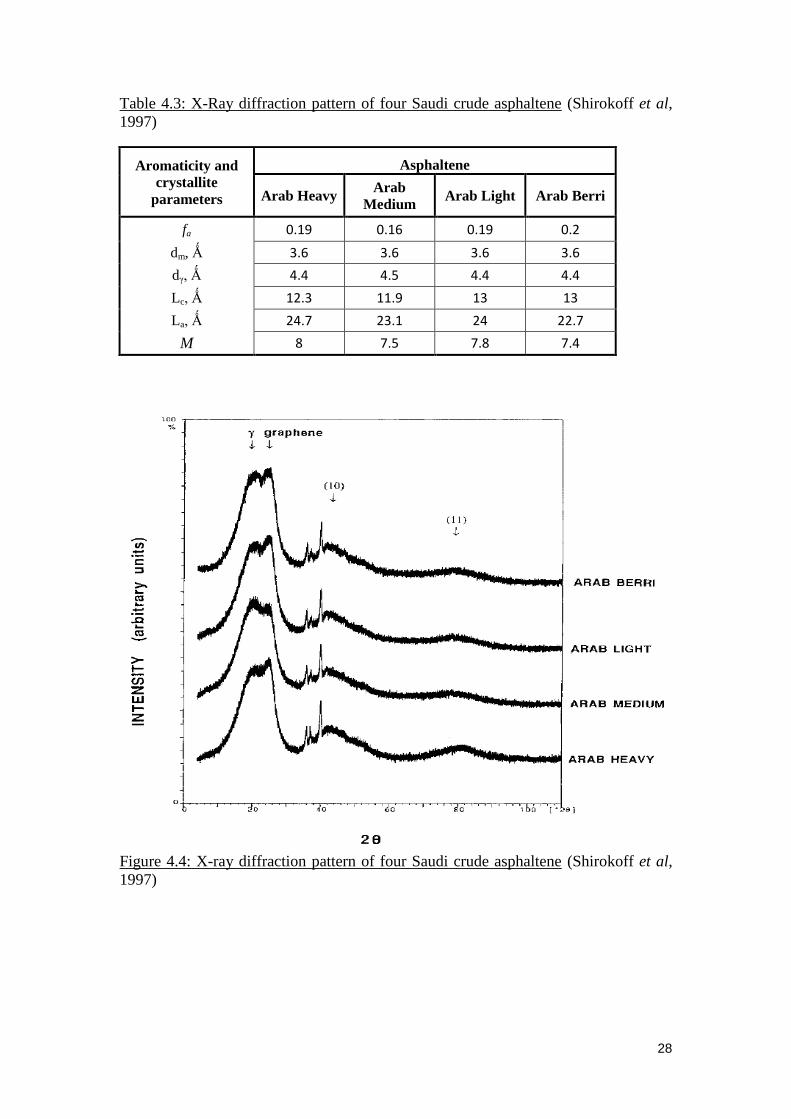
The results obtained are compared to those found by Shirokoff et al (1997) on Figure
4.4 and Table 4.3. It can be observed that the values found from this report are slightly
higher than those found on the publications, the differences in values could arise from
the sample preparation carried out to make sure that the asphaltene samples are
grounded to 50-200µm, in this form many grains are suggested by Shirokoff et al. to
come into orientation and the quality of the diffraction is improved. In conclusion the
x-ray diffraction study on the asphaltenes produced in the first experiment supports
the concept and model that the asphaltenes are made of fused aromatic sheet bearing
aliphatic chains. Below are the results that are used in comparison:
Page 38
28
Table 4.3: X-Ray diffraction pattern of four Saudi crude asphaltene (Shirokoff et al,
1997)
Aromaticity and
crystallite
parameters
Asphaltene
Arab Heavy Arab
Medium Arab Light Arab Berri
fa 0.19 0.16 0.19 0.2
dm, Ǻ 3.6 3.6 3.6 3.6
dγ, Ǻ 4.4 4.5 4.4 4.4
Lc, Ǻ 12.3 11.9 13 13
La, Ǻ 24.7 23.1 24 22.7
M 8 7.5 7.8 7.4
Figure 4.4: X-ray diffraction pattern of four Saudi crude asphaltene (Shirokoff et al,
1997)
Page 39
29
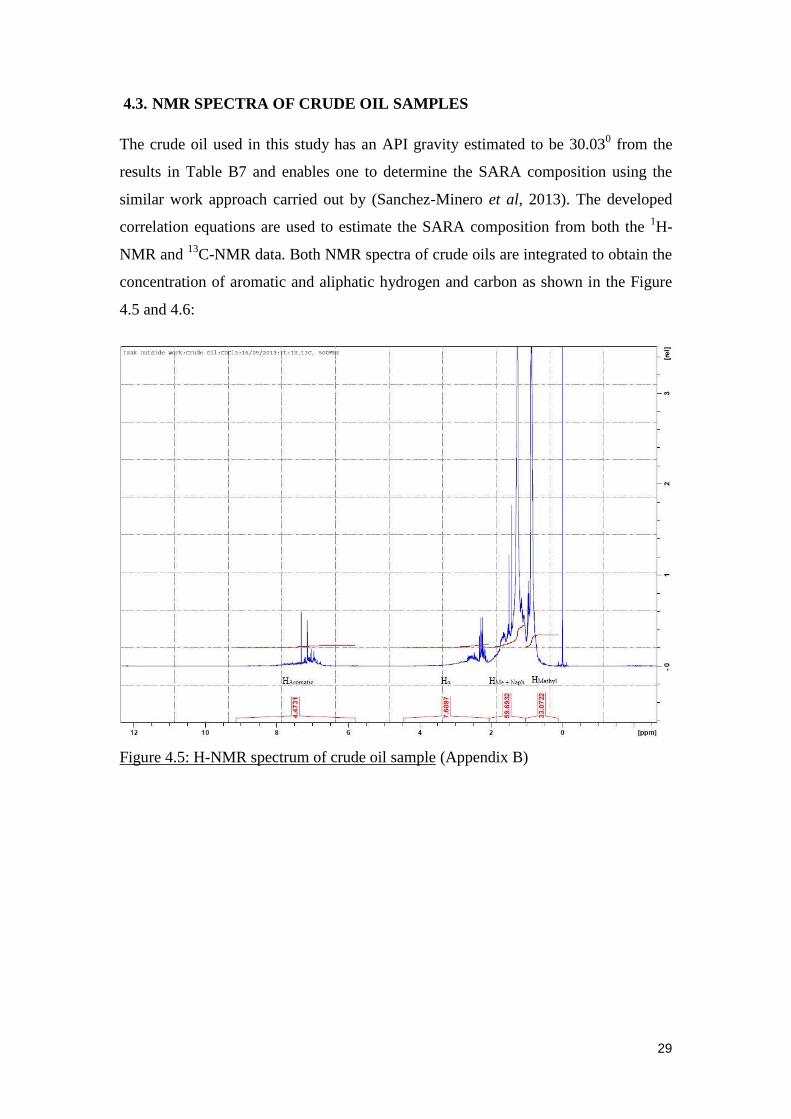
4.3. NMR SPECTRA OF CRUDE OIL SAMPLES
The crude oil used in this study has an API gravity estimated to be 30.030 from the
results in Table B7 and enables one to determine the SARA composition using the
similar work approach carried out by (Sanchez-Minero et al, 2013). The developed
correlation equations are used to estimate the SARA composition from both the 1H-
NMR and 13
C-NMR data. Both NMR spectra of crude oils are integrated to obtain the
concentration of aromatic and aliphatic hydrogen and carbon as shown in the Figure
4.5 and 4.6:
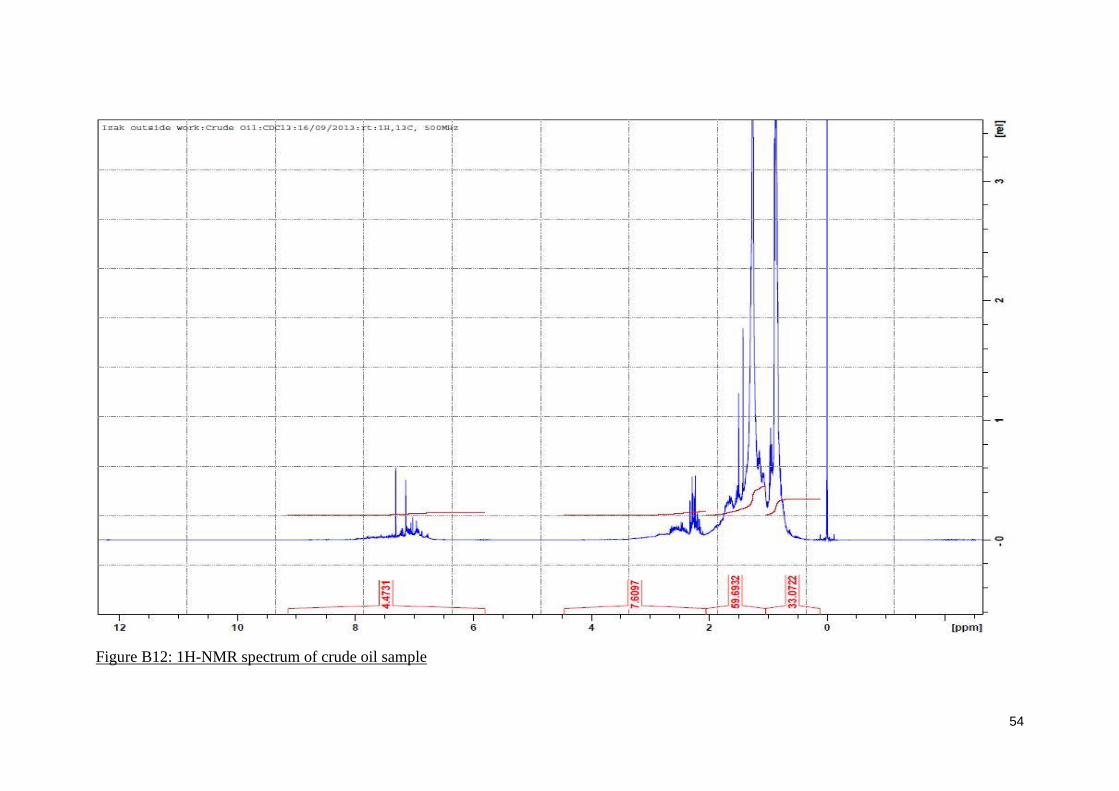
Figure 4.5: H-NMR spectrum of crude oil sample (Appendix B)
Page 40
30
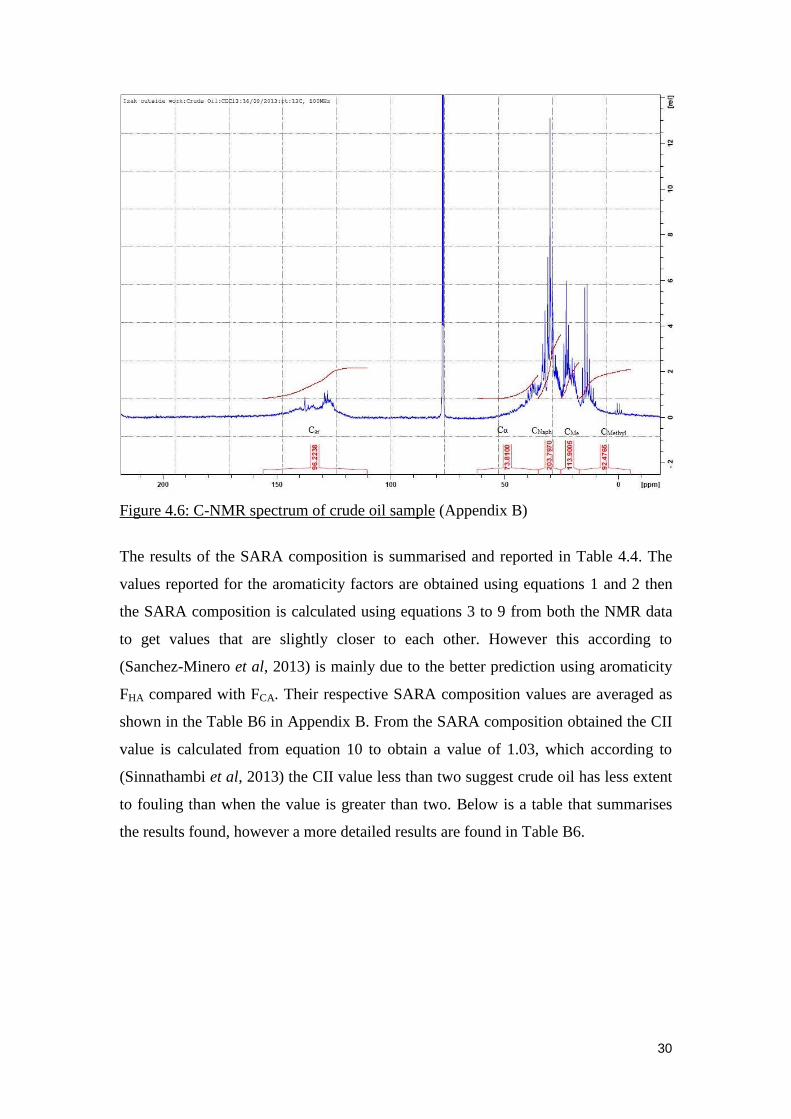
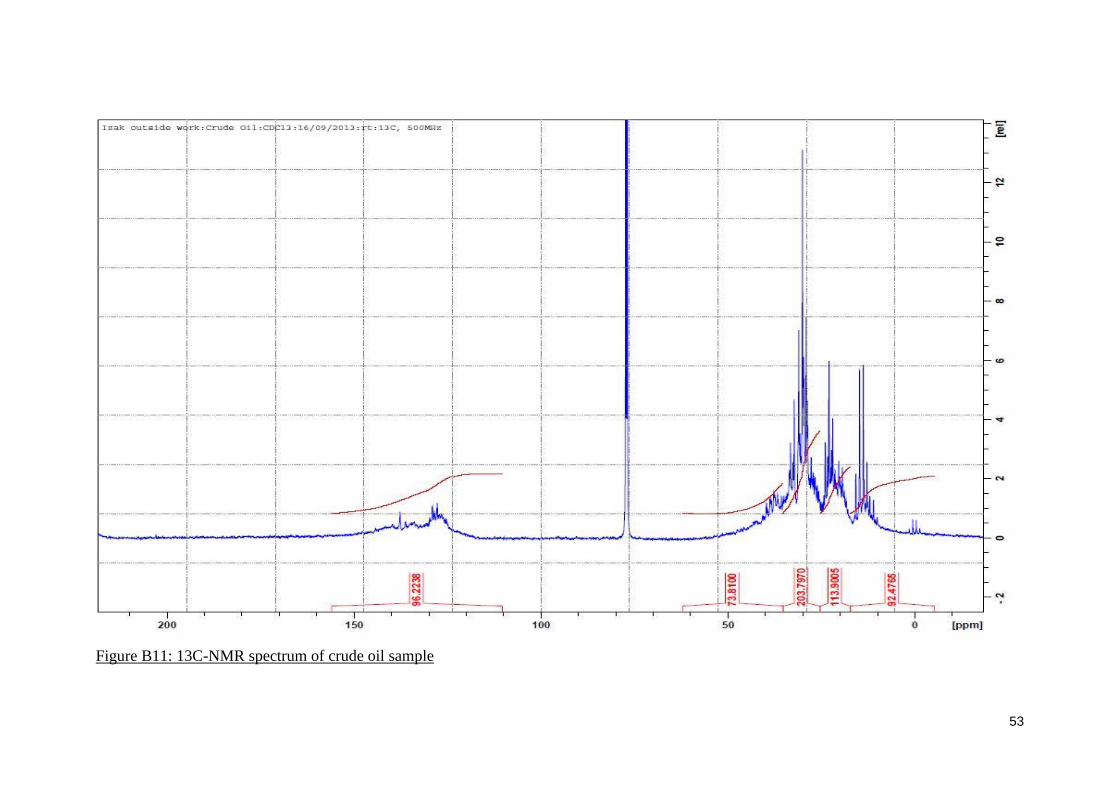
Figure 4.6: C-NMR spectrum of crude oil sample (Appendix B)
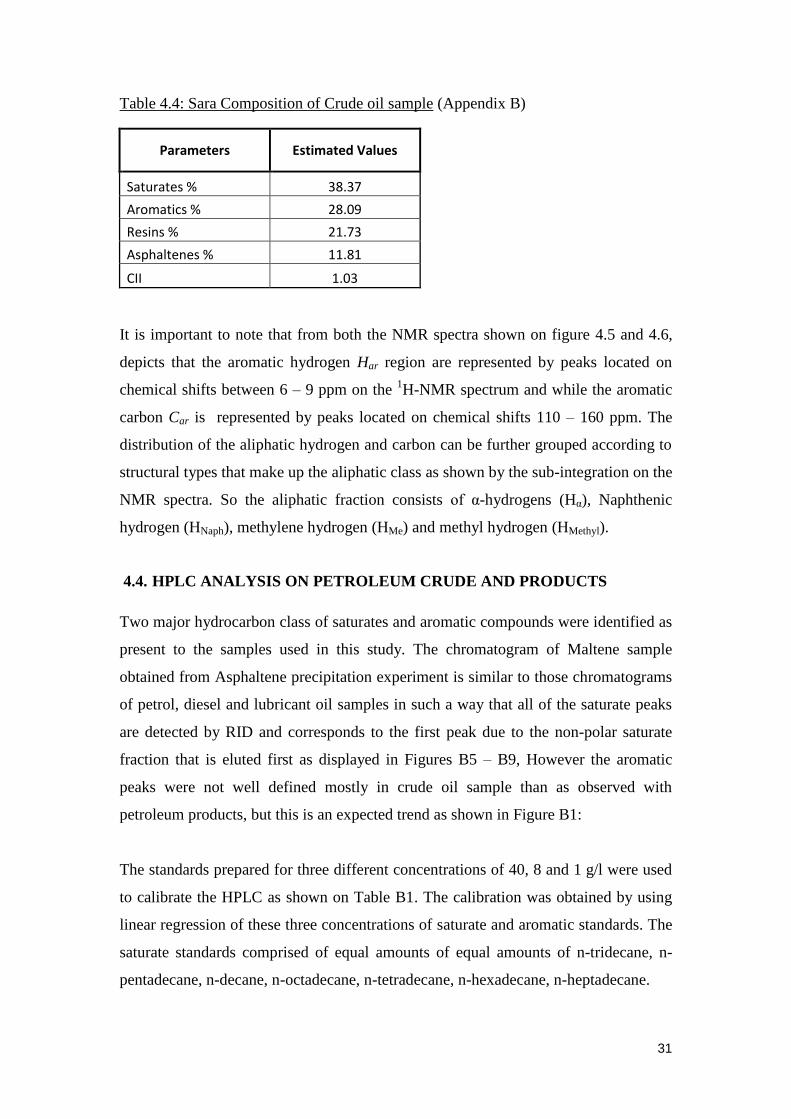
The results of the SARA composition is summarised and reported in Table 4.4. The
values reported for the aromaticity factors are obtained using equations 1 and 2 then
the SARA composition is calculated using equations 3 to 9 from both the NMR data
to get values that are slightly closer to each other. However this according to
(Sanchez-Minero et al, 2013) is mainly due to the better prediction using aromaticity
FHA compared with FCA. Their respective SARA composition values are averaged as
shown in the Table B6 in Appendix B. From the SARA composition obtained the CII
value is calculated from equation 10 to obtain a value of 1.03, which according to
(Sinnathambi et al, 2013) the CII value less than two suggest crude oil has less extent
to fouling than when the value is greater than two. Below is a table that summarises
the results found, however a more detailed results are found in Table B6.
Page 41
31
Table 4.4: Sara Composition of Crude oil sample (Appendix B)
Parameters Estimated Values
Saturates % 38.37
Aromatics % 28.09
Resins % 21.73
Asphaltenes % 11.81
CII 1.03
It is important to note that from both the NMR spectra shown on figure 4.5 and 4.6,
depicts that the aromatic hydrogen Har region are represented by peaks located on
chemical shifts between 6 – 9 ppm on the 1H-NMR spectrum and while the aromatic
carbon Car is represented by peaks located on chemical shifts 110 – 160 ppm. The
distribution of the aliphatic hydrogen and carbon can be further grouped according to
structural types that make up the aliphatic class as shown by the sub-integration on the
NMR spectra. So the aliphatic fraction consists of α-hydrogens (Hα), Naphthenic
hydrogen (HNaph), methylene hydrogen (HMe) and methyl hydrogen (HMethyl).
4.4. HPLC ANALYSIS ON PETROLEUM CRUDE AND PRODUCTS
Two major hydrocarbon class of saturates and aromatic compounds were identified as
present to the samples used in this study. The chromatogram of Maltene sample
obtained from Asphaltene precipitation experiment is similar to those chromatograms
of petrol, diesel and lubricant oil samples in such a way that all of the saturate peaks
are detected by RID and corresponds to the first peak due to the non-polar saturate
fraction that is eluted first as displayed in Figures B5 – B9, However the aromatic
peaks were not well defined mostly in crude oil sample than as observed with
petroleum products, but this is an expected trend as shown in Figure B1:
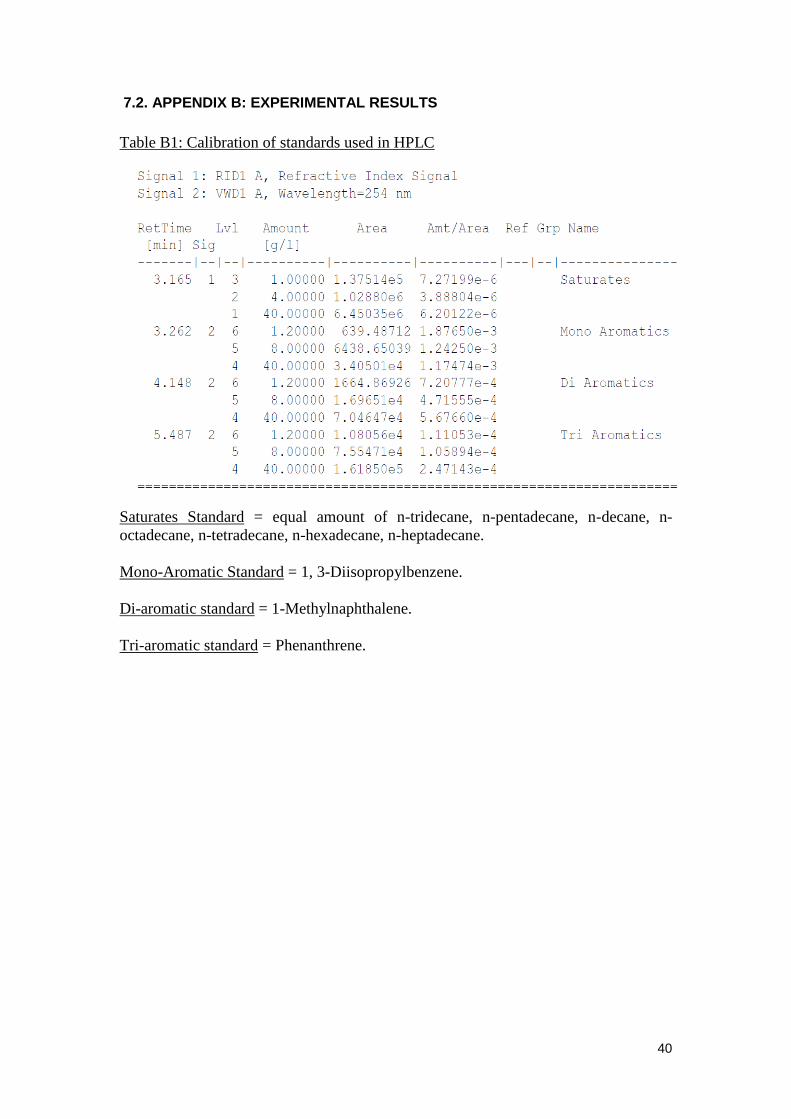
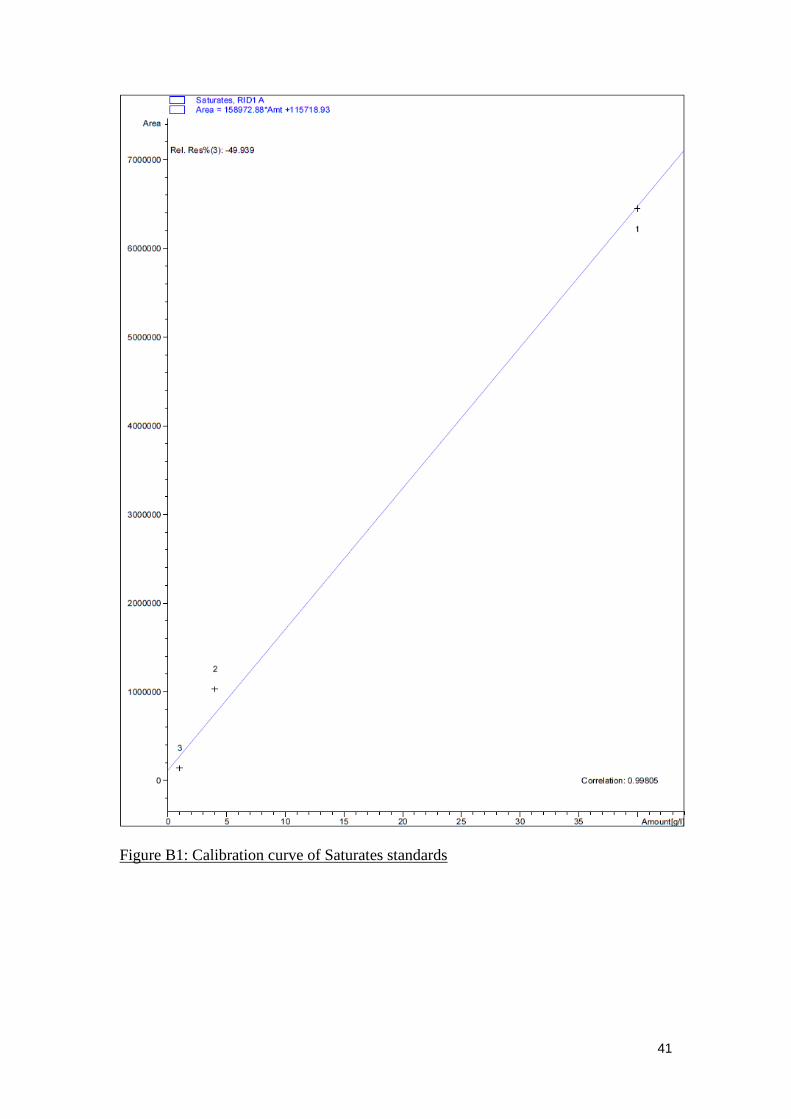
The standards prepared for three different concentrations of 40, 8 and 1 g/l were used
to calibrate the HPLC as shown on Table B1. The calibration was obtained by using
linear regression of these three concentrations of saturate and aromatic standards. The
saturate standards comprised of equal amounts of equal amounts of n-tridecane, n-
pentadecane, n-decane, n-octadecane, n-tetradecane, n-hexadecane, n-heptadecane.
Page 42
32
While the aromatics standards were further subdivided into mono-, di- and tri-
aromatics prepared from equal amount of 1, 3-Diisopropylbenzene, 1-
Methylnaphthalene and respectively. A good agreement was observed for the linear fit
as indicated in Figures B2-B4.
For all the samples analysed in this study, higher amounts of saturates and aromatics
were found using the HPLC method. While these two major hydrocarbon were
detected using RID and VWD, it is important to note that petroleum products that
includes petrol, diesel and lubricant oil are blended fuels from refinery feed stocks
that contains olefins and additives to meet the desired specifications. Hence
unidentified peaks of such components may be present on the chromatograms. For
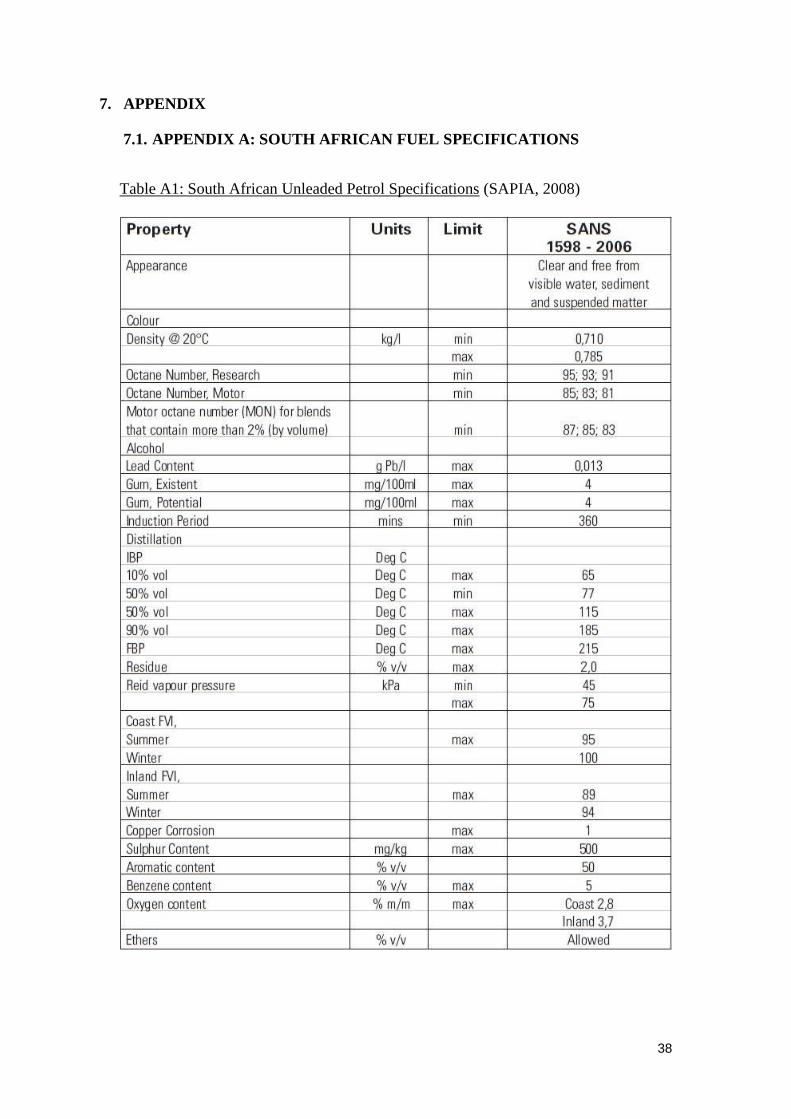
instance the presence of benzene in petrol fuel at maximum 5% v/v as indicated by
specification on Table A1 may be possibly regarded as one of the unidentified peaks
in the aromatic region which were not calibrated for.
Page 43
33
5. CONCLUSION AND RECOMMENDATION
5.1. CONCLUSION
An understanding of the composition of major hydrocarbon groups found in
petroleum crude oil and products was provided and highly depended on the
experimental procedures used in this study. Hydrocarbon group type analysis on
samples of crude oil, petrol fuel, diesel and lubricant oil was achieved by a
combination of experiments and analytical instrumentation that involved 13
C-NMR,
1H-NMR, XRD and HPLC. The results obtained were able to identify and quantify the
major hydrocarbon classes of compounds found in the studied samples. The
asphaltene precipitation experiment achieved the separation of dark black solid
asphaltene and maltene samples that were subsequently used in XRD and HPLC
analysis respectively. The amount of asphaltene precipitated was found to be over a
quarter of the content present as determined by both 13
C-NMR and 1H-NMR.
The XRD analysis provided insight into the chemical structure of Asphaltene
obtained; the high value of the aromaticity factor obtained suggested that the
compound is mostly aromatic as expected from literature and previous studies. The
use of correlations as a function of aromaticity factors calculated from NMR data
enabled for the determination SARA composition for crude oil and consequently a
colloidal instability index which takes into account the composition of crude oil. The
HPLC analysis on all samples investigated, was able to identify and quantify the
hydrocarbon class of saturates and specific aromatic compounds without identifying
the asphaltene and resin fraction. In conclusion the set of techniques and
instrumentation used in this study demonstrated to be useful in obtaining group type
composition of the petroleum crude and products samples but are not desirable for
daily refinery operations as they are time consuming and expensive. It is also
important to note that measurements of SARA composition is mostly depended on the
methodology of analysis and results from different methods may not be the same. The
overall results provide a good basis for determining the major hydrocarbon classes
present in crude oil and petroleum products, investigating asphalt precipitation,
calculating colloidal instability index and testing for aromatics fuel specifications.
Page 44
34
5.2. RECOMMENDATION
The results obtained in this study can be further enhanced and investigated by
comparing different samples of crude oils and petroleum products. Methods used in
asphaltene precipitation, obtaining density of crude oil, calculating colloidal
instability index, sample preparation for XRD and HPLC analysis can be further
improved to obtain a higher degree of certainty by; repeatability of runs for
Asphaltene precipitation and taking into consideration the effect of temperature,
pressure and solvent changes, the API of crude oil can be accurately obtained by using
a ASTM D287 standard procedure using a Hydrometer, appropriate values of CII can
be calculated based on SARA composition and polarity of components.
Asphaltene samples can be finely grounded about 50-200µm and checked on a
scanning electron microscope prior to XRD as it is shown by previous work that in
this form, many grains are well oriented and the quality of diffraction pattern is
improved. Lastly the HPLC analysis methodology can be improved by calibrating
with standards of olefins, benzene and toluene in order to identify these components
which are of greater importance to analyse.
Page 45
35
6. REFERENCES
Akmaz, S., Iscan, O., Gurkaynak, M. A. & Yasar, M. (2012). “The Structural
Characterization of Saturate, Aromatic, Resin, and Asphaltene Fractions of
Batiraman Crude Oil." Petroleum Science and Technology 29(2): 160-171.
Albahri, T. A. (2012). "Developing correlations for the properties of petroleum fuels
and their fractions." Fluid Phase Equilibria 315(0): 113-125.
Ali, M. A. & Hassan, A. (2002). "Hydrocarbon group types analysis of petroleum
products: a comparative evaluation of hplc and tlc analytical performance."
Petroleum Science and Technology 20(7-8): 751-762.
Amin, J. S., A. Alamdari, Mehranbod, N., Aytollahi, S. & Nikooee, E. (2010).
"Prediction of Asphaltene Precipitation: Learning from Data at Different
Conditions." Energy Fuels 24: 4046 - 4053.
Amorim, F. A. C., Welz, B. Costa, A. C. S., Lepri, F. G., Vale, M. G. R. & Ferreira,
S.L. C. (2007). "Determination of vanadium in petroleum and petroleum
products using atomic spectrometric techniques." Talanta 72(2): 349-359.
Aske, N. (2002). "Characterisation of Crude Oil Components, Asphaltene
Aggregation and Emulsion Stability by means of Near Infrared Spectroscopy
and Multivariate Analysis." Journal of Dispersion Science and Engineering: 2
- 14.
Bailey, S. J. & Baldini, N. C., Annual book of ASTM standards: Petroleum products,
lubricants and fossil fuels, ASTM international, volume 05.01, 2010: 923-928;
985-986.
Barman, B. N., Cebolla, V. L. & Membrado, L. (2000). "Chromatographic
Techniques for Petroleum and Related Products." Critical Reviews in
Analytical Chemistry 30(2-3): 75-120.
Behrenbruch, P. & T. Dedigama (2007). "Classification and characterisation of crude
oils based on distillation properties." Journal of Petroleum Science and
Engineering 57(1-2): 166-180.
Bollet, C., Escalier, J. C., Souteyrand, C., Caude, M. & Rosset, R. (1981). "Rapid
separation of heavy petroleum products by high-performance liquid
chromatography." Journal of Chromatography A 206(2): 289-300.
Brandao, G. P., de Campos, R. C., de Castro, E. V. R. & de Jesus, H. C. (2007).
"Determination of copper, iron and vanadium in petroleum by direct sampling
electrothermal atomic absorption spectrometry." Spectrochimica Acta Part B:
Atomic Spectroscopy 62(9): 962-969.
Page 46
36
Castro, A. T. (2006). "NMR and FTIR Characterization of Petroleum Residues:
Structural Parameters and Correlations." Journal of Brazil Chemical Society
17(6): 1181 - 1185.
Demirbas, A. (2008). "Distillation Properties of Various Diesel Oils." Energy
Sources, Part A: Recovery, Utilization, and Environmental Effects 30(16):
1484-1490.
Fan, T. & Buckley, J. S. (2002). "Rapid and Accurate SARA Analysis of Medium
Gravity Crude Oils." Energy & Fuels 16(6): 1571-1575.
Filgueiras, P. R., Sad, C. M. S., Loreiro, A. R., Santos, M. F. P., Castro, E. V. R.,
Dias, J. C. M. & Poppi, R. J. (2013). "Determination of API gravity, kinematic
viscosity and water content in petroleum by ATR-FTIR spectroscopy and
multivariate calibration." Fuel 116(0): 123-130.
John, W., Shirokoff, M. N. S. & Mohammad F. Ali (1997). "Characterization of the
Structure of Saudi Crude Asphaltenes by X-ray Diffraction." Energy & Fuels
11: 561-565.
Klein, G. C. (2005). "Petroleomics: Applications in the Fingerprinting of the Acidic
and Basic Crude Oil Components Detected by Electrospray Ionization Fourier
Transform Ion Cyclotron Resonance Mass Spectrometry." 4 - 11.
Leyva, C., Ancheyta, J. Berrueco, C. & Millan, M. (2012). "Chemical characterization
of asphaltenes from various crude oils." Fuel Processing Technology 106(0):
734-738.
Mansoori, G. A., Vazquez, D. & Shariaty-Niassar, M. (2007). "Polydispersity of
heavy organics in crude oils and their role in oil well fouling." Journal of
Petroleum Science and Engineering 58: 375-390.
Mathpro (2011). "An Introduction to Petroleum Refing and the Production of Ultra
low Sulfur Gasoline and diesel fuel." 27- 28.
Mello, P. A., Pereira, J. S. F., Mesko, M. F., Barin, J. S. & Flores, E. M. M. (2012).
"Sample preparation methods for subsequent determination of metals and non-
metals in crude oil”A review." Analytica Chimica Acta 746(0): 15-36.
Sanchez-Minero, F., Ancheyta, J., Silva-Oliver, G. & Flores-Valle, S. (2013).
"Predicting SARA composition of crude oil by means of NMR." Fuel 110(0):
318-321.
SAPIA (2008). "Petrol and diesel in South Africa and the impact on air quality." 64 -
124.
Sayyouh, M. H., Hemeida, A. M., Al-blehed, M. S. & Desouky, S. M. (1991). "Role
of polar compounds in crude oils on rock wettability." Journal of Petroleum
Science and Engineering 6(3): 225-233.
Page 47
37
Shahebrahimi, Y. & Zonnouri, A. (2013). "A new combinatorial thermodynamics
model for asphaltene precipitation." Journal of Petroleum Science and
Engineering 109(0): 63-69.
Siddiqui, M. N., Ali, M. F. & Shirokoff, J. (2002). "Use of X-ray diffraction in
assessing the aging pattern of asphalt fractions." Fuel 81(1): 51-58.
Silva, S. L., Silva, A. M. S., Ribeiro, J. C., Martins, F.G., Da Silva, F. A. & Silva, G.
M. (2011). "Chromatographic and spectroscopic analysis of heavy crude oil
mixtures with emphasis in nuclear magnetic resonance spectroscopy: A
review." Analytica Chimica Acta 707: 18-37.
Speight, J. G. (1980). The Chemistry and Terminology of Petroleum. New York:
Marcel Dekker. First edition
Speight, J. G. (1999), The Chemistry and Technology of Petroleum. New York:
Marcel Dekker Inc. Third edition
Speight, J. G. (2001). The Handbook of Petroleum Product Analysis. New Jersey:
JohnWiley & Sons.
Stanislaus, A., Marafi, A. & Rana, M. S. (2010). "Recent advances in the science and
technology of ultra-low sulfur diesel (ULSD) production." Catalysis Today
153: 1-68.
Wu, J. (2004). " Asphaltene precipitation in crude oils: Theory and Experiments. "
American Institute of Chemical Engineers Journal 50(10): 2555
Zhao, H. (2007). "Determination of Elemental Sulfur in Naphtha and Gasoline by Gas
Chromatography/Mass Spectrometry." Petroleum Science and Technology
25(5): 569-576.
Page 48
38
7. APPENDIX
7.1. APPENDIX A: SOUTH AFRICAN FUEL SPECIFICATIONS
Table A1: South African Unleaded Petrol Specifications (SAPIA, 2008)
Page 49
39
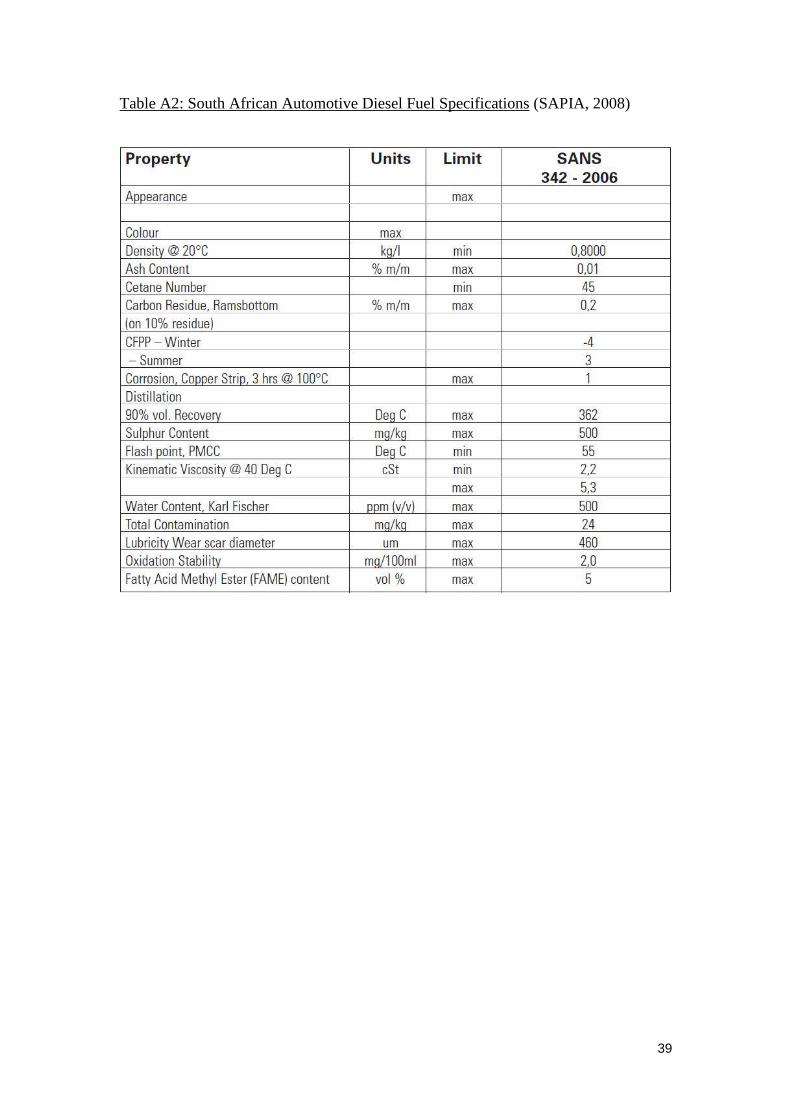
Table A2: South African Automotive Diesel Fuel Specifications (SAPIA, 2008)
Page 50
40
7.2. APPENDIX B: EXPERIMENTAL RESULTS
Table B1: Calibration of standards used in HPLC
Saturates Standard = equal amount of n-tridecane, n-pentadecane, n-decane, n-
octadecane, n-tetradecane, n-hexadecane, n-heptadecane.
Mono-Aromatic Standard = 1, 3-Diisopropylbenzene.
Di-aromatic standard = 1-Methylnaphthalene.
Tri-aromatic standard = Phenanthrene.
Page 51
41
Figure B1: Calibration curve of Saturates standards
Page 52
42
Figure B2: Calibration curve of mono-aromatic standard
Page 53
43
Figure B3: Calibration curve of Di-aromatic standard
Page 54
44
Figure B4: Calibration curve of Tri-aromatic standard
Page 55
45
Figure B5: Lubricant engine oil HPLC chromatograph
Table B2: Lubricant engine oil HPLC results
Page 56
46
Figure B6: ‟95 ULP fuel HPLC chromatograph
Table B3: ‟95 ULP fuel results
Page 57
47
Figure B7: ‟95 LRP fuel HPLC chromatograph
Table B4: ‟95 LRP fuel results
Page 58
48
Figure B8: Diesel 50 ppm fuel HPLC chromatograph
Table B5: Diesel 50ppm fuel results
Page 59
49
Figure B9: Crude oil sample HPLC chromatograph
Page 60
50
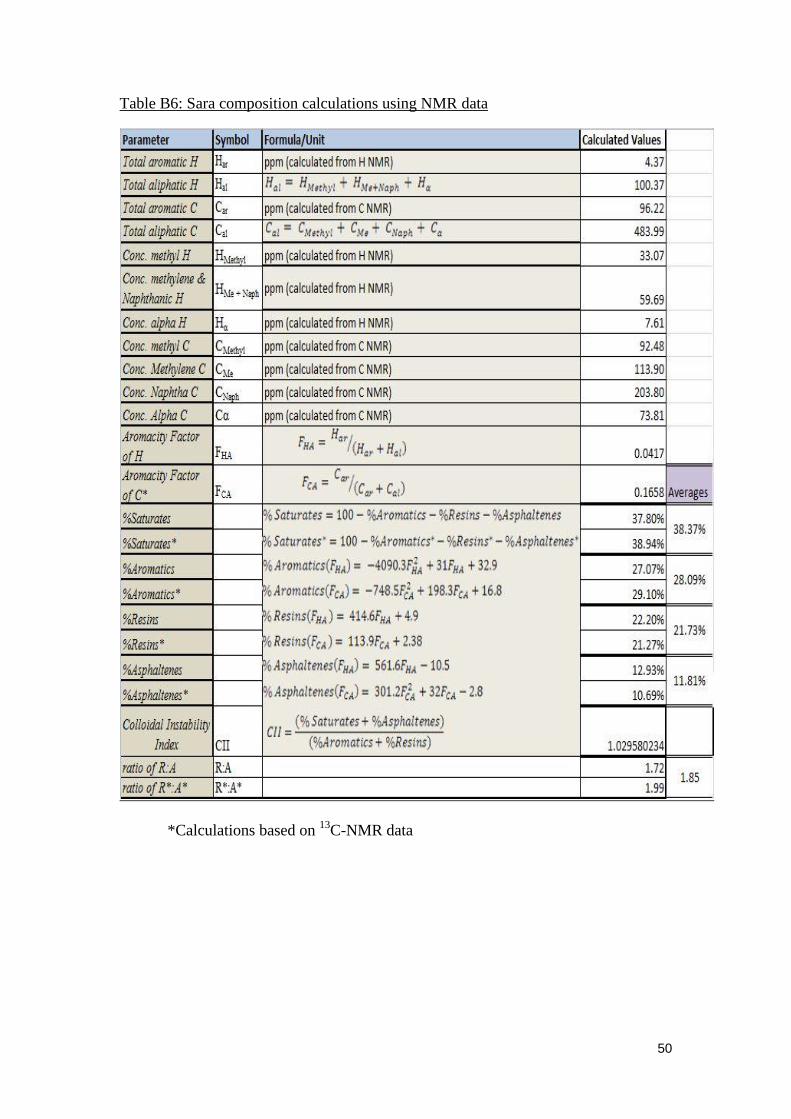
Table B6: Sara composition calculations using NMR data
*Calculations based on 13
C-NMR data
Page 61
51
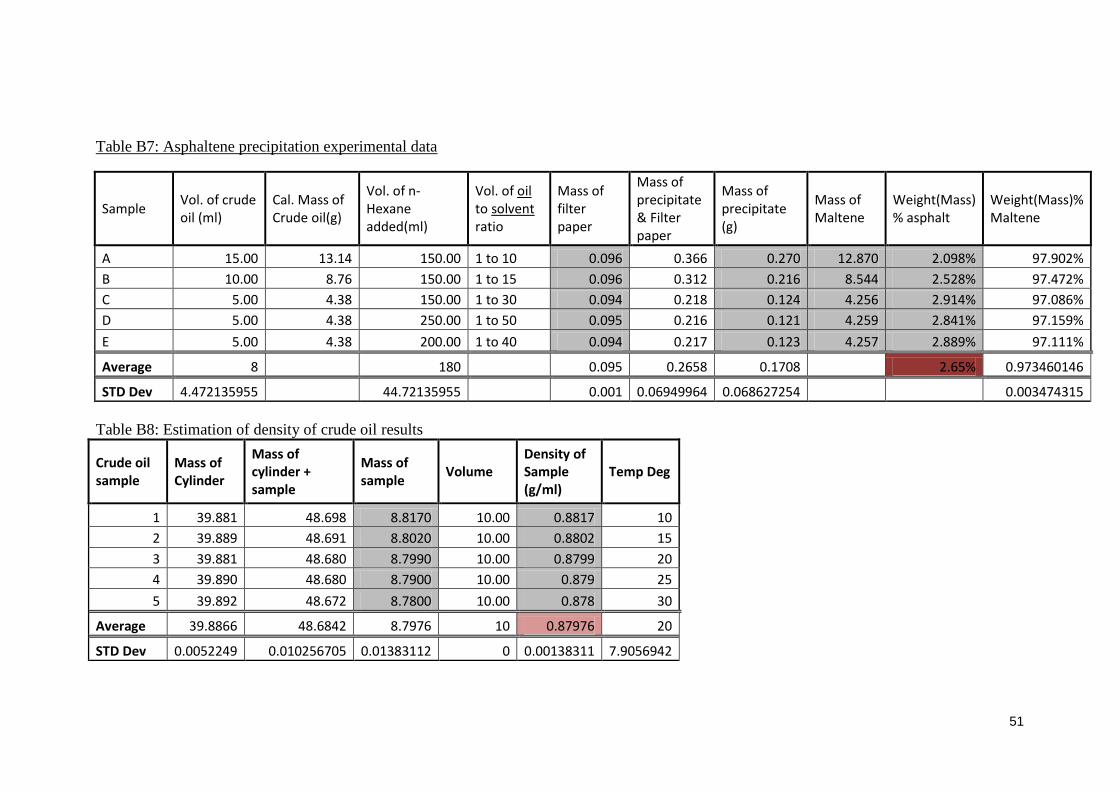
Table B7: Asphaltene precipitation experimental data
Sample Vol. of crude oil (ml)
Cal. Mass of Crude oil(g)
Vol. of n-Hexane added(ml)
Vol. of oil to solvent ratio
Mass of filter paper
Mass of precipitate & Filter paper
Mass of precipitate (g)
Mass of Maltene
Weight(Mass) % asphalt
Weight(Mass)% Maltene
A 15.00 13.14 150.00 1 to 10 0.096 0.366 0.270 12.870 2.098% 97.902%
B 10.00 8.76 150.00 1 to 15 0.096 0.312 0.216 8.544 2.528% 97.472%
C 5.00 4.38 150.00 1 to 30 0.094 0.218 0.124 4.256 2.914% 97.086%
D 5.00 4.38 250.00 1 to 50 0.095 0.216 0.121 4.259 2.841% 97.159%
E 5.00 4.38 200.00 1 to 40 0.094 0.217 0.123 4.257 2.889% 97.111%
Average 8 180 0.095 0.2658 0.1708 2.65% 0.973460146
STD Dev 4.472135955 44.72135955 0.001 0.06949964 0.068627254 0.003474315
Table B8: Estimation of density of crude oil results
Crude oil sample
Mass of Cylinder
Mass of cylinder + sample
Mass of sample
Volume Density of Sample (g/ml)
Temp Deg
1 39.881 48.698 8.8170 10.00 0.8817 10
2 39.889 48.691 8.8020 10.00 0.8802 15
3 39.881 48.680 8.7990 10.00 0.8799 20
4 39.890 48.680 8.7900 10.00 0.879 25
5 39.892 48.672 8.7800 10.00 0.878 30
Average 39.8866 48.6842 8.7976 10 0.87976 20
STD Dev 0.0052249 0.010256705 0.01383112 0 0.00138311 7.9056942
Page 62
52
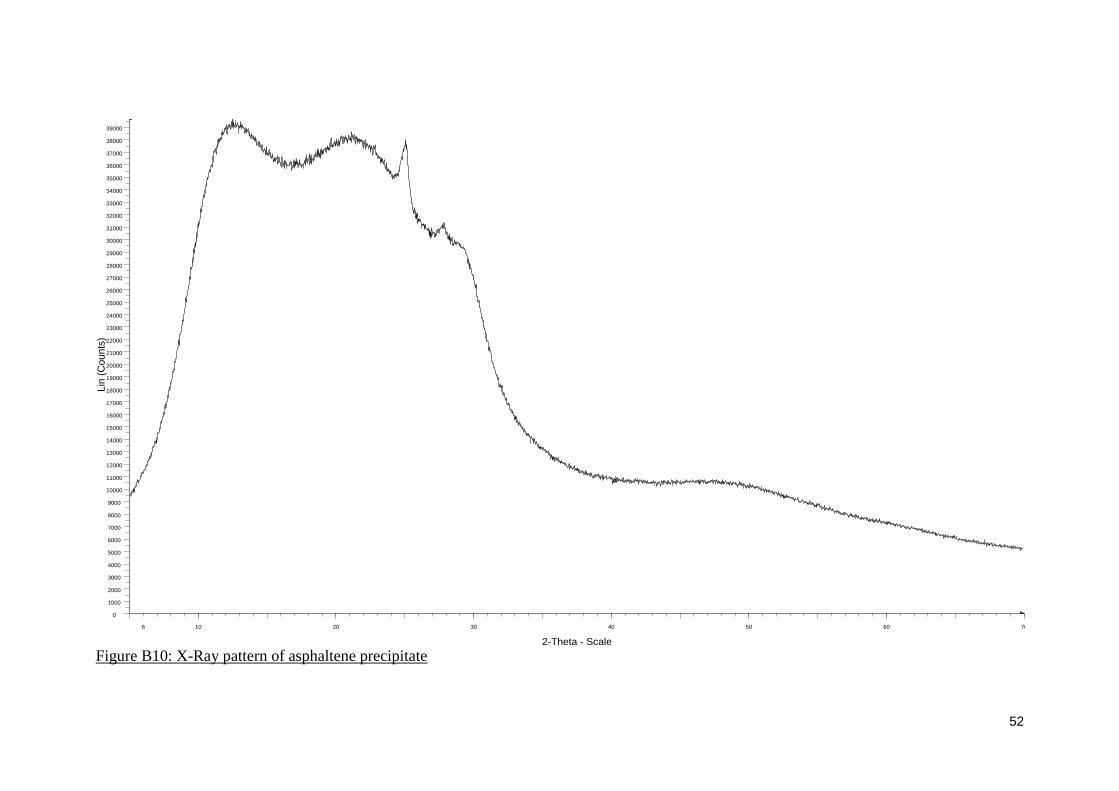
Figure B10: X-Ray pattern of asphaltene precipitate
Commander Sample ID
Operations: Import
Commander Sample ID - File: d2_13_1790.raw - Type: Locked Coupled - Start: 5.002 ° - End: 70.006 ° - Step: 0.026 ° - Step time: 940. s - Temp.: 25 °C (Room) - Time Started: 0 s - 2-Theta: 5.002 ° - Theta: 0.000 ° - Chi: 0.00 ° - Phi: 0.00 ° - X: 0.0 mm - Y: 0.0 mm - Z: 0.0 mm - Aux1: 0.0 - Aux2: 0.0 - Aux3: 0.0 - Displa
Lin
(C
ounts
)
0
1000
2000
3000
4000
5000
6000
7000
8000
9000
10000
11000
12000
13000
14000
15000
16000
17000
18000
19000
20000
21000
22000
23000
24000
25000
26000
27000
28000
29000
30000
31000
32000
33000
34000
35000
36000
37000
38000
39000
2-Theta - Scale
6 10 20 30 40 50 60 70
Page 63
53
Figure B11: 13C-NMR spectrum of crude oil sample
Page 64
54
Figure B12: 1H-NMR spectrum of crude oil sample
Page 65
55
7.3. APPENDIX C: PICTURE SAMPLE OF ASPHALTENES PRECIPITATE
Figure B13: Asphaltene precipitate sample