116
Characterization of Polymeric Materials by Thermal Analysis
| Date post: | 20-Mar-2018 |
| Category: |
Documents |
| Upload: | phungtuong |
| View: | 226 times |
| Download: | 7 times |

Characterization of Polymeric Materials byThermal Analysis
Topics
Introduction to DSCIntroduction to TGAApplications
Amorphous Structure and the Glass TransitionCrystalline StructureThermosetsThermal Stability and KineticsHeat Capacity
DSC: The Technique
Differential Scanning Calorimetry (DSC) measures heat flow associated with structure (amorphous and crystalline) and changes in structure (transitions) of materials as a function of time and temperature in a controlled atmosphere.
These measurements provide quantitative and qualitative information about physical and chemical changes in a material.
The utility of DSC comes from the fact that allchanges in structure involve the absorption or release of heat.
DSC: What DSC Can Measure
Transition TemperaturesGlass TransitionsMelting/Crystallinity (J/g not %)Crystallization Time and TemperaturePolymorphic Transformation/StabilityDrug-Excipient IncompatibilityProtein DenaturationMiscellaneous
Thermal/Oxidative StabilityBoiling PointsPurity
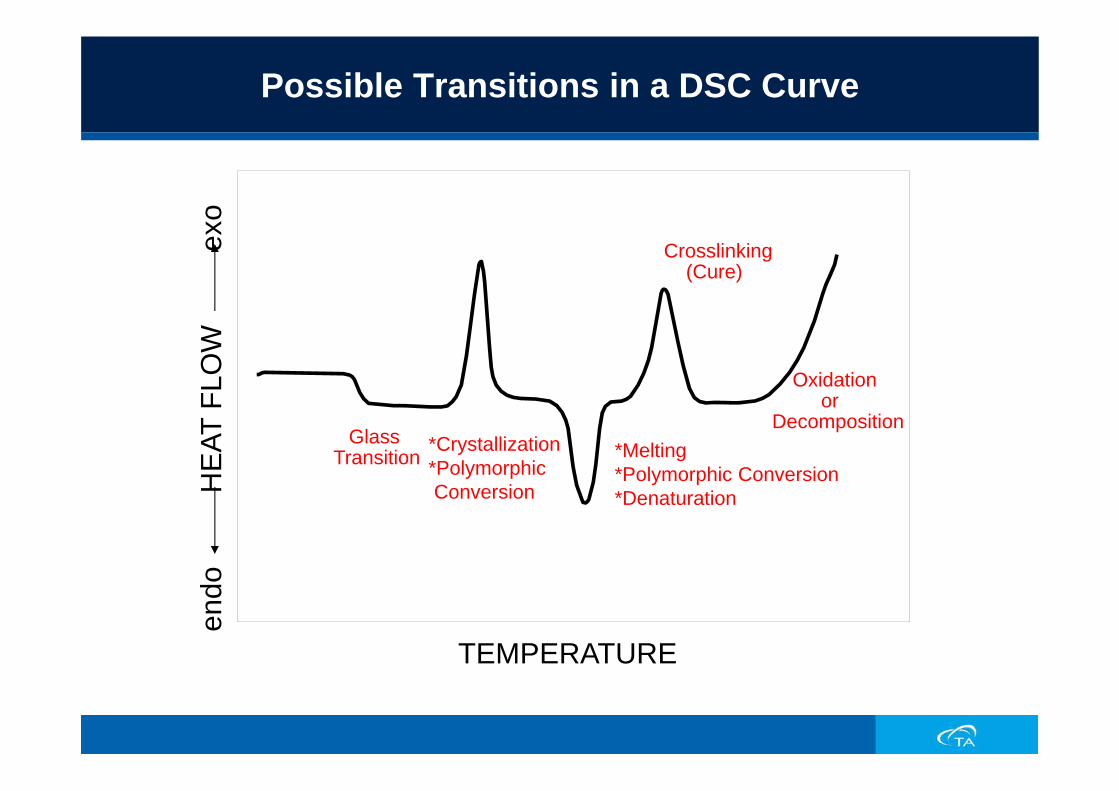
Possible Transitions in a DSC Curve
TEMPERATURE
GlassTransition
*Crystallization *Polymorphic Conversion
*Melting *Polymorphic Conversion *Denaturation
Oxidationor
Decomposition
Crosslinking(Cure)
endo
H
EAT
FLO
W
exo

DSC Cell
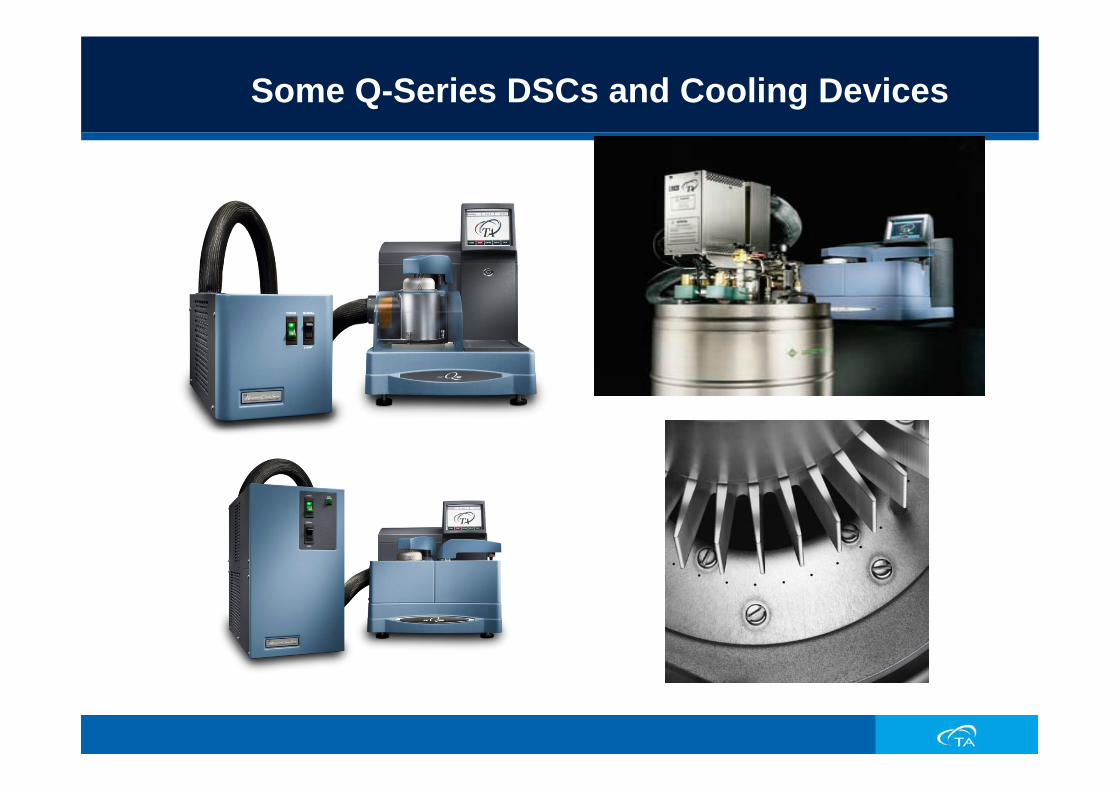
Some Q-Series DSCs and Cooling Devices

Tzero™ DSC Cell Schematic
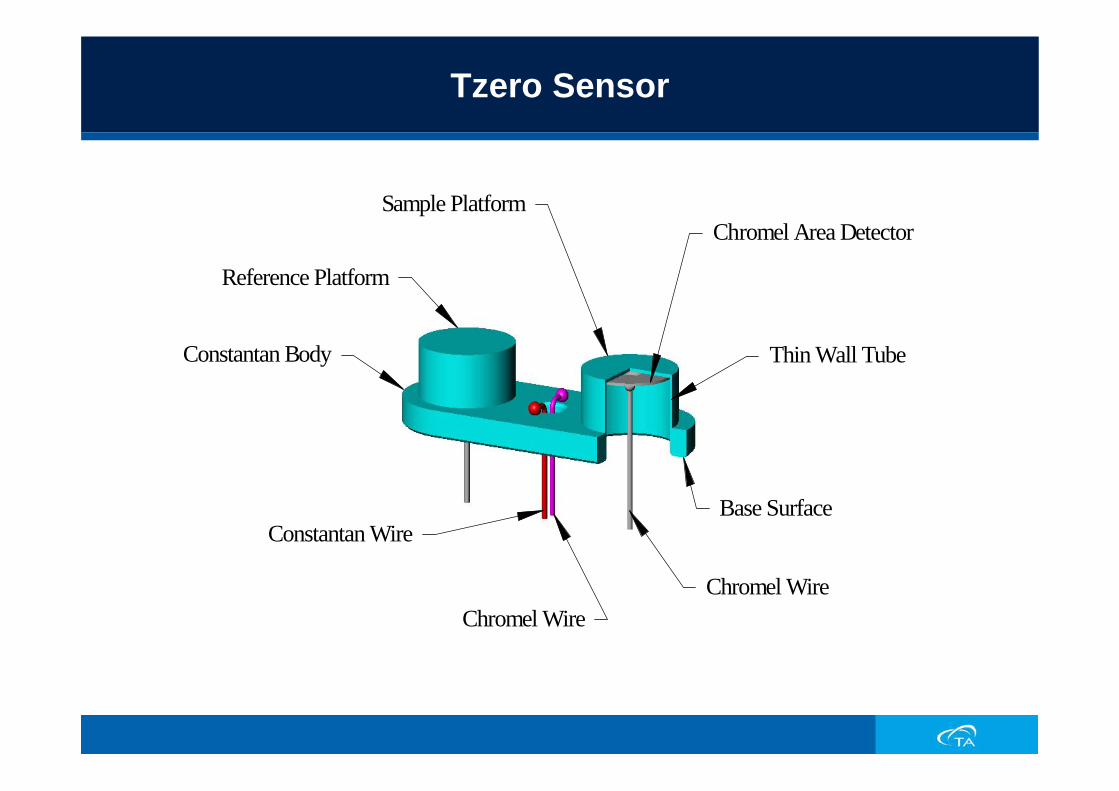
Tzero Sensor
Constantan Body
Chromel Wire
Chromel Area Detector
Constantan Wire
Chromel Wire
Base Surface
Thin Wall Tube
Sample Platform
Reference Platform

DISCOVERY DSC

New Sensor - Objectives
Improve sensor flatness to reduce pan/sensor contact resistance variations
Reduce distortion due to thermal expansion difference between chromel area thermocouples and constantan platformsRealize full benefit of Tzero sample pans – reduce pan contact resistance and variation
Optimize thermocouple locationThermocouple should not be in pan/sensor contact zone because inevitable variations in the magnitude and distribution of contact resistance reduces the repeatability of the differential temperature measurementsLocate thermocouple so that ΔT and ΔT0 measurements are unaffected by pan contact resistance variations
Diffusion Bonding Mechanism

Diffusion Bonded Transducer Construction Process
Why Diffusion Bonding ?
Optimum thermocouple placementImproved flatness of pan/sensor contact region by 6xNo alloying of thermocouple by welding
Result – improved repeatability of signals, allowing full realization of advantages of Tzero technique
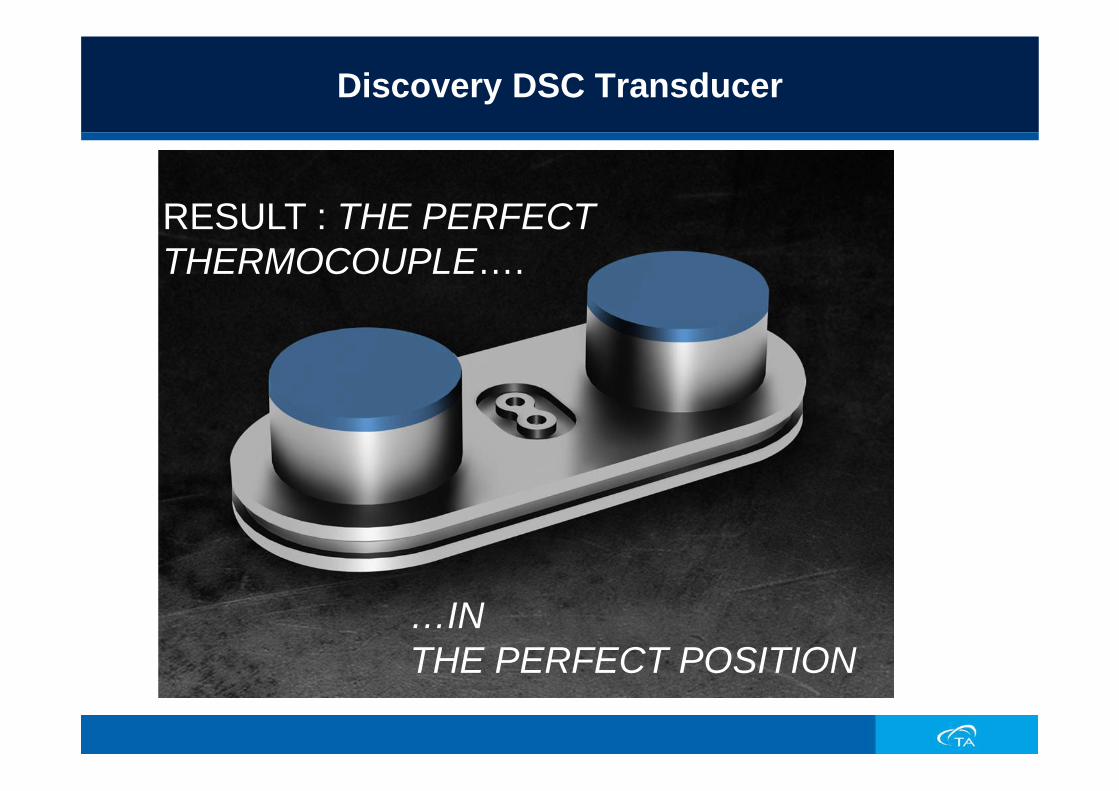
RESULT : THE PERFECT THERMOCOUPLE….
…IN THE PERFECT POSITION
Discovery DSC Transducer

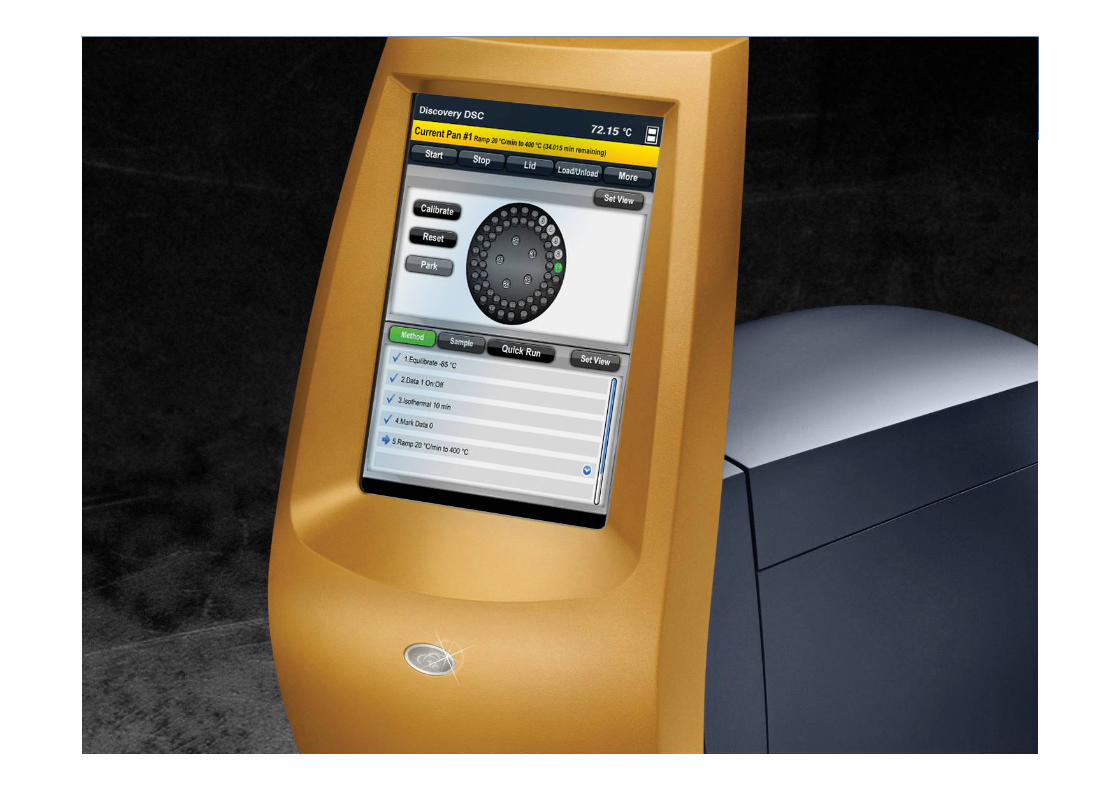

Discovery DSC: User Interface
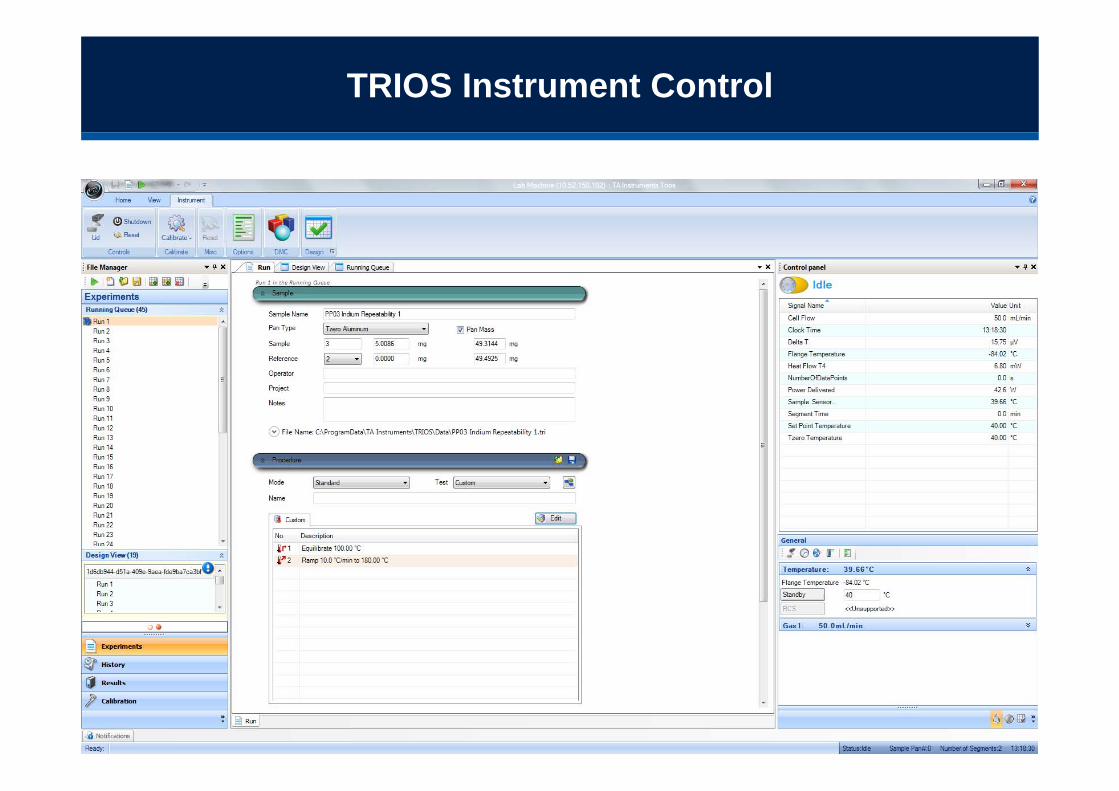
TRIOS Instrument Control
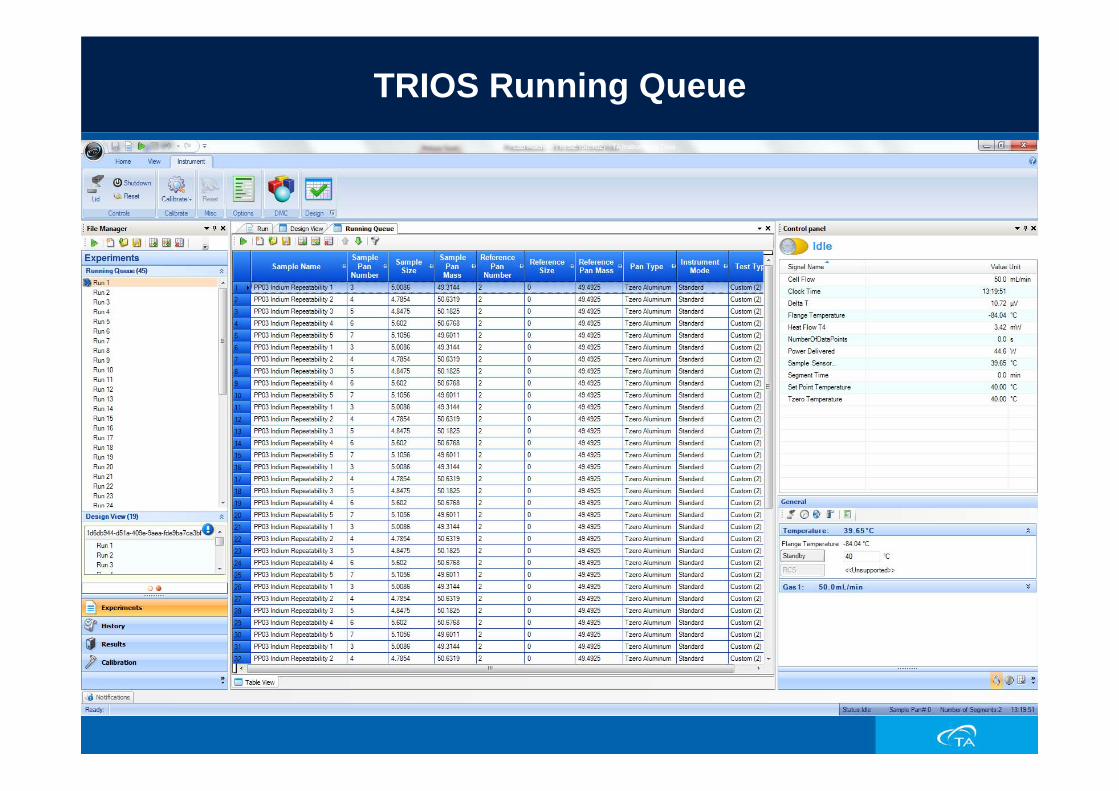
TRIOS Running Queue

TRIOS History View
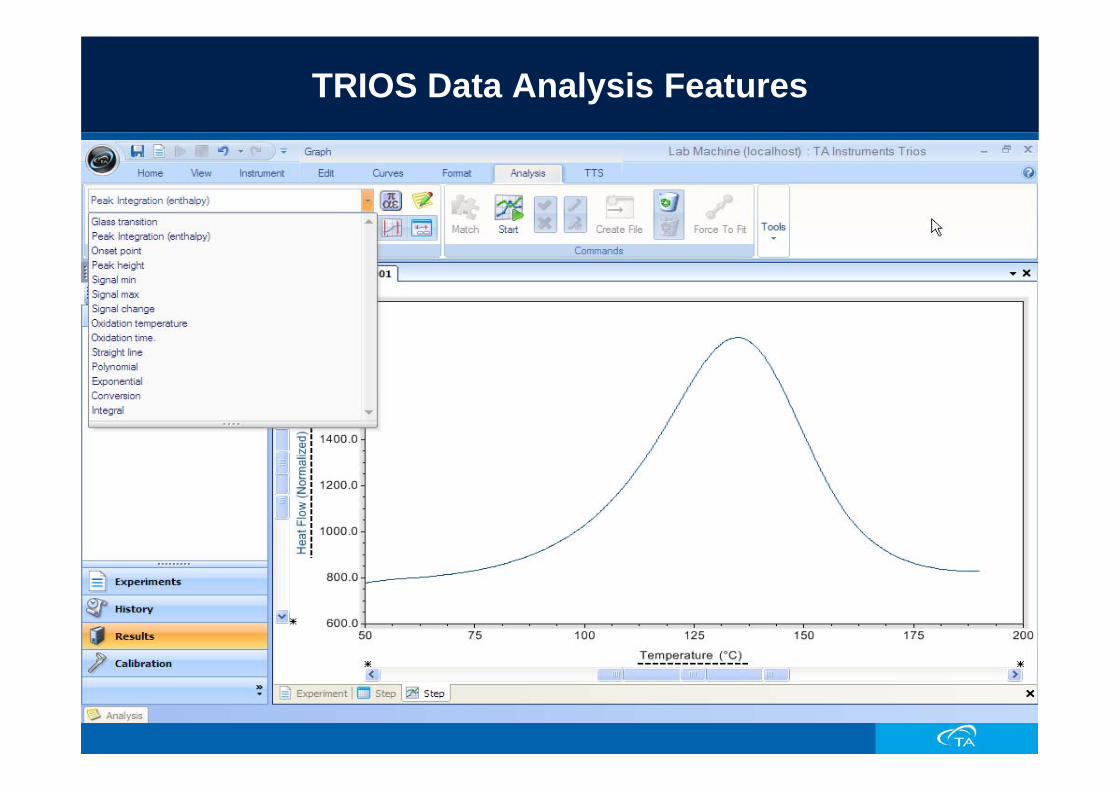
TRIOS Data Analysis Features
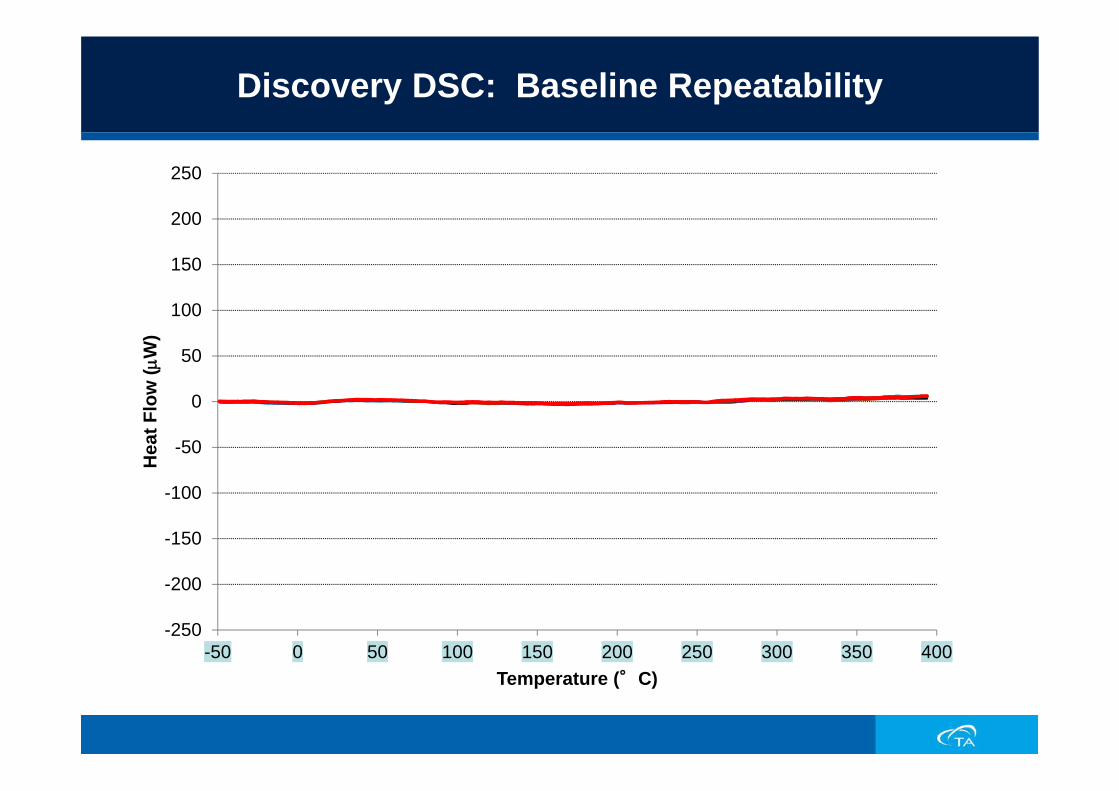
Discovery DSC: Baseline Repeatability
-250
-200
-150
-100
-50
0
50
100
150
200
250
-50 0 50 100 150 200 250 300 350 400
Hea
t Flo
w (μ
W)
Temperature (°C)
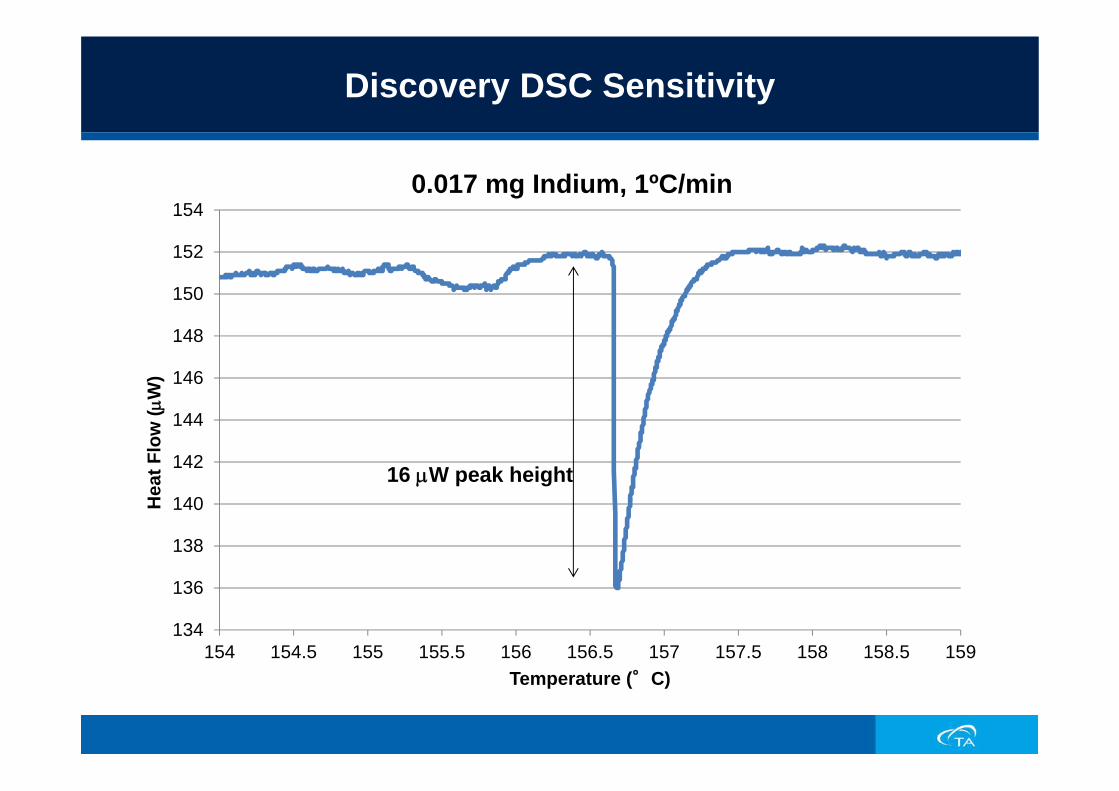
Discovery DSC Sensitivity
134
136
138
140
142
144
146
148
150
152
154
154 154.5 155 155.5 156 156.5 157 157.5 158 158.5 159
Hea
t Flo
w (μ
W)
Temperature (°C)
0.017 mg Indium, 1ºC/min
16 μW peak height
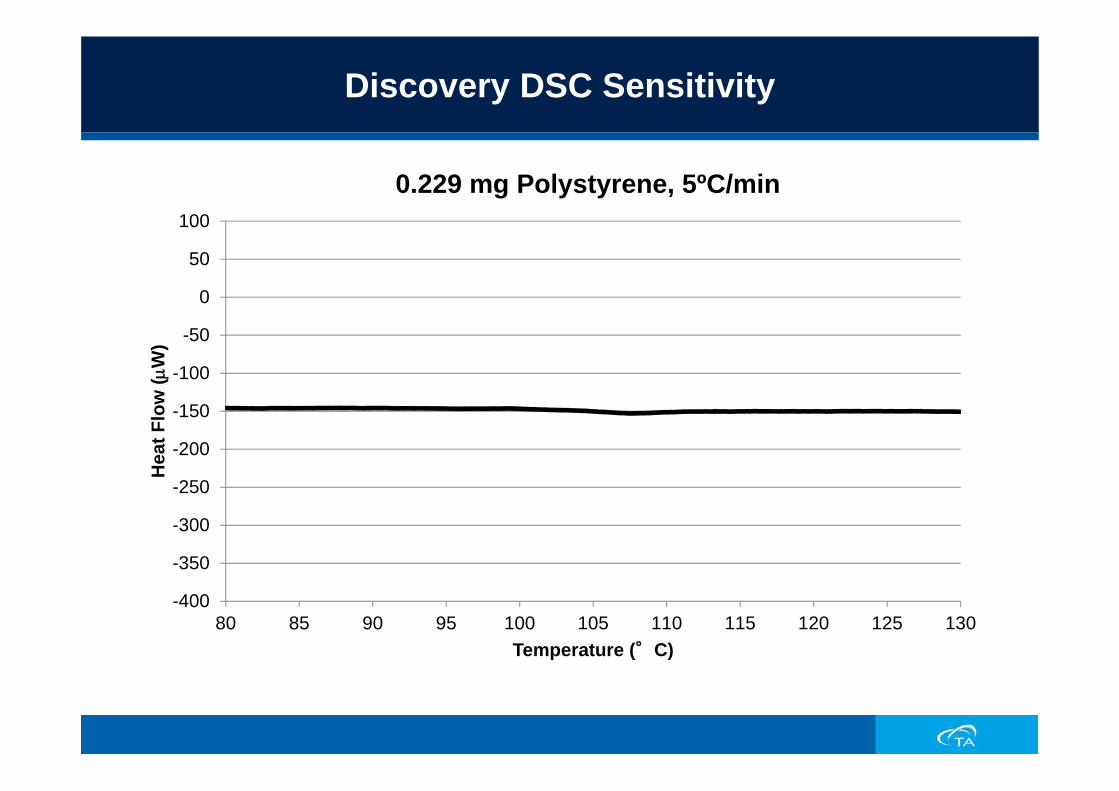
Discovery DSC Sensitivity
-400
-350
-300
-250
-200
-150
-100
-50
0
50
100
80 85 90 95 100 105 110 115 120 125 130
Hea
t Flo
w (μ
W)
Temperature (°C)
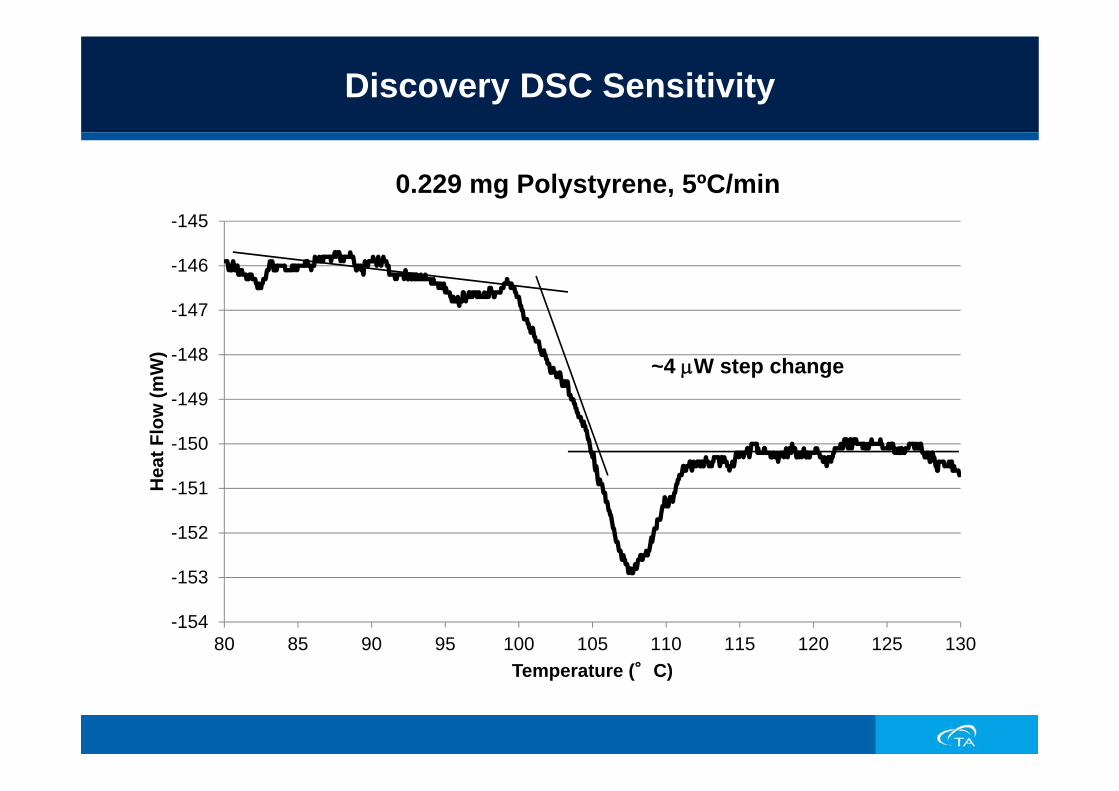
0.229 mg Polystyrene, 5ºC/min
-154
-153
-152
-151
-150
-149
-148
-147
-146
-145
80 85 90 95 100 105 110 115 120 125 130
Hea
t Flo
w (m
W)
Temperature (°C)
Discovery DSC Sensitivity
0.229 mg Polystyrene, 5ºC/min
~4 μW step change

Introduction to Thermogravimetric Analysis (TGA)

Topics
TGAThe Technique What TGA Can MeasureImportance of TGA in Materials Characterization Instrumentation
TGA: The Technique
Thermogravimetric Analysis (TGA) measures weight loss or gain as a function of temperature, time and atmosphere
TGA measurements are extremely useful in selecting experimental conditions for DSC experiments and for interpreting results
What TGA Can Measure
Temperatures of Weight ChangePercent Weight Loss or GainDecomposition Temperature(s)Decomposition Kinetics (MTGA™)Thermal/Oxidative StabilityUnbound water or solventBound water or solvent (hydrate or solvate)Moisture adsorption/desorption (Sorption Analysis)
Importance of TGA
Always start characterization of any new material with TGA. That data is often critical to the correct interpretation of DSC data. For example:
Is there unbound water or solvent?Evaporation can look like meltingWater/solvent plasticize amorphous material which lowers and broadens TgIf total volatile content (bound and unbound) exceeds 10% by weight, stainless steel hermetic pans will be required to heat above 130°C
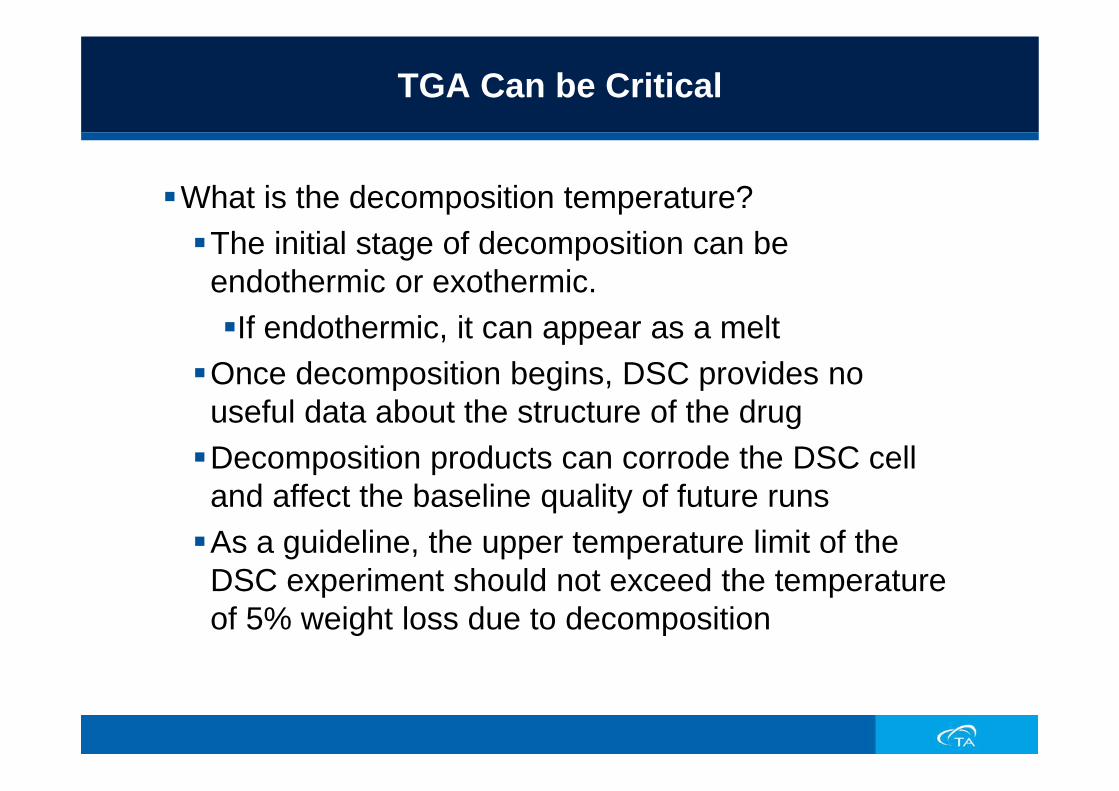
TGA Can be Critical
What is the decomposition temperature?The initial stage of decomposition can be endothermic or exothermic.
If endothermic, it can appear as a meltOnce decomposition begins, DSC provides no useful data about the structure of the drugDecomposition products can corrode the DSC cell and affect the baseline quality of future runsAs a guideline, the upper temperature limit of the DSC experiment should not exceed the temperature of 5% weight loss due to decomposition
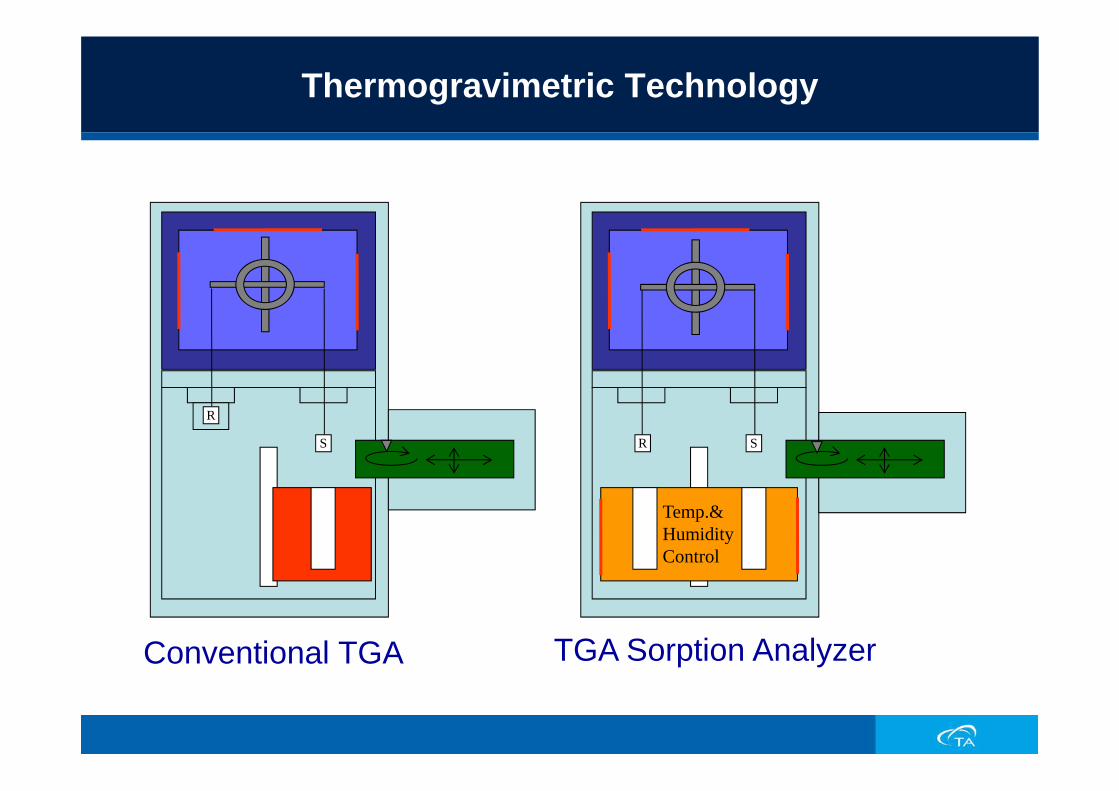
Thermogravimetric Technology
S
R
SR
Q5000 w/ IR furnace Q5000 w/ HumidityConventional TGA TGA Sorption Analyzer
Temp.& Humidity Control

Discovery TGA
The New Discovery TGA:Features TA Instruments:
Industry Leading Thermobalance Innovative IR Furnace Unmatched Autosampler
In Addition: A New Gas Delivery Module with either Standard 2-Gas or Optional 4-Gas for Switching/Blending CapabilitiesImproved Usability with the New Discovery User InterfaceNew TRIOS Software with Instrument Control/Data Analysis in One Package

High-Sensitivity Thermobalance
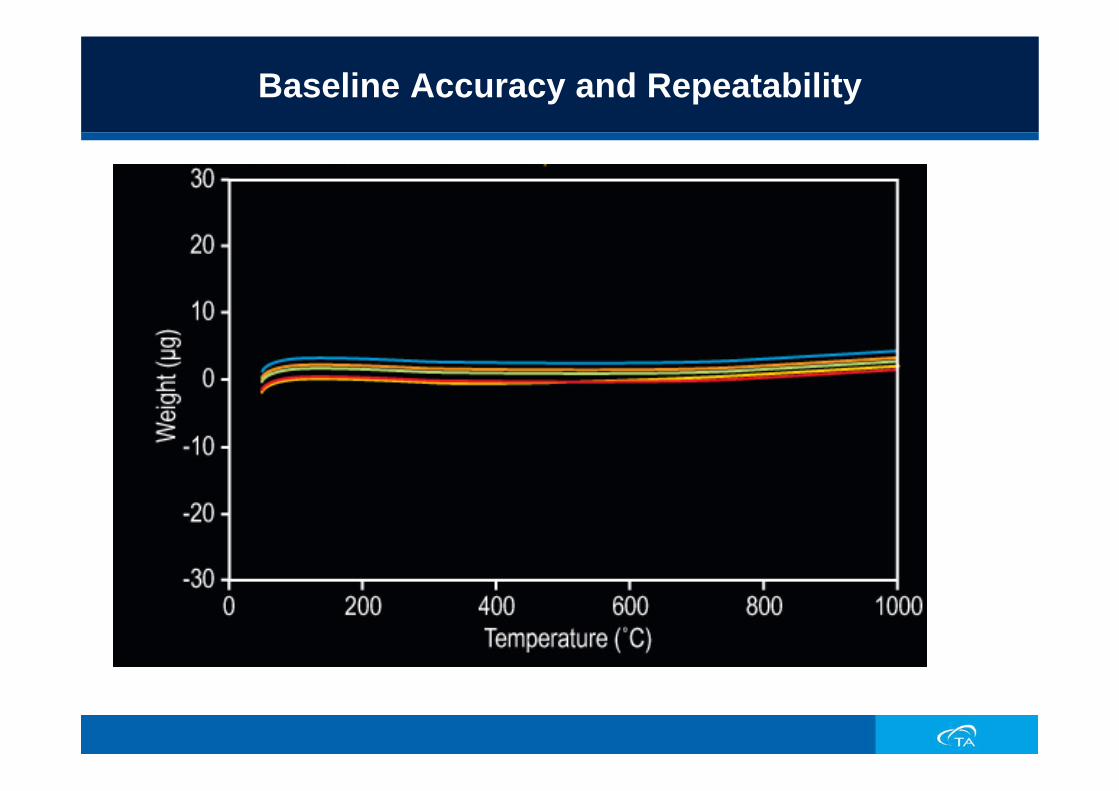
Baseline Accuracy and Repeatability

High Sensitivity for Small Weight Loss

Furnace Vertical Section
Sample panSilicon carbide absorber
Thermocouple
Lower heat shieldsOptional
Heated EGAadapter
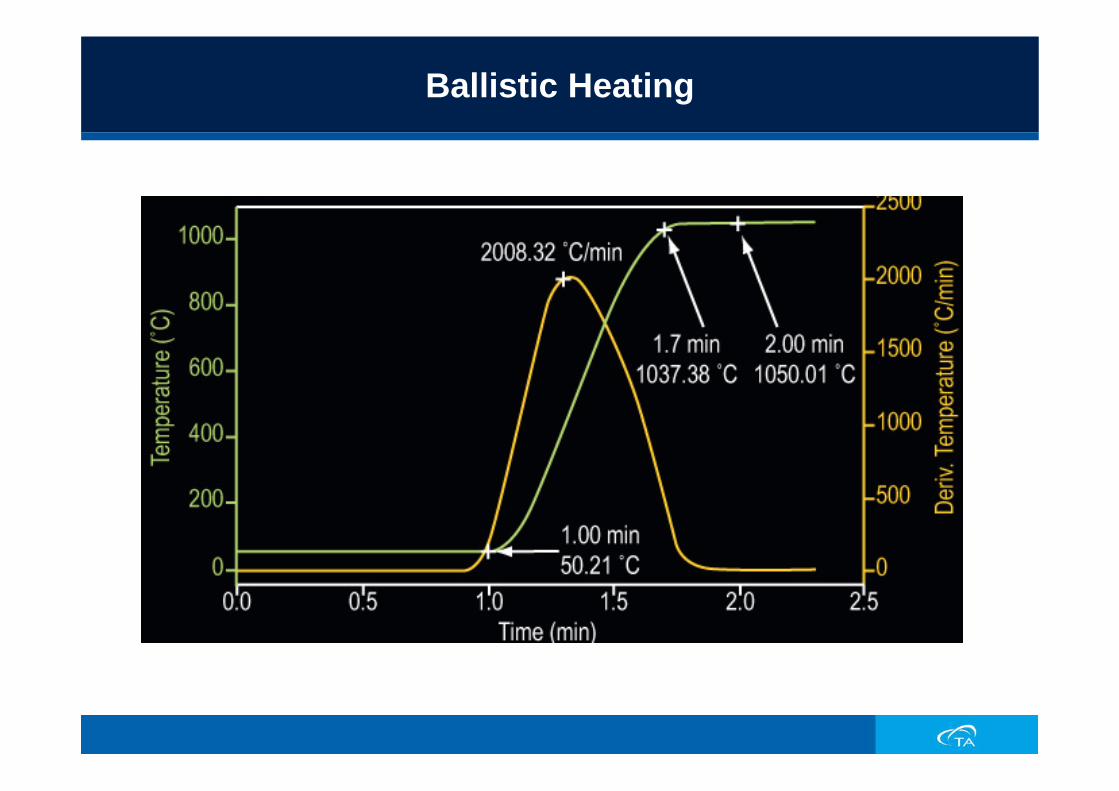
Ballistic Heating
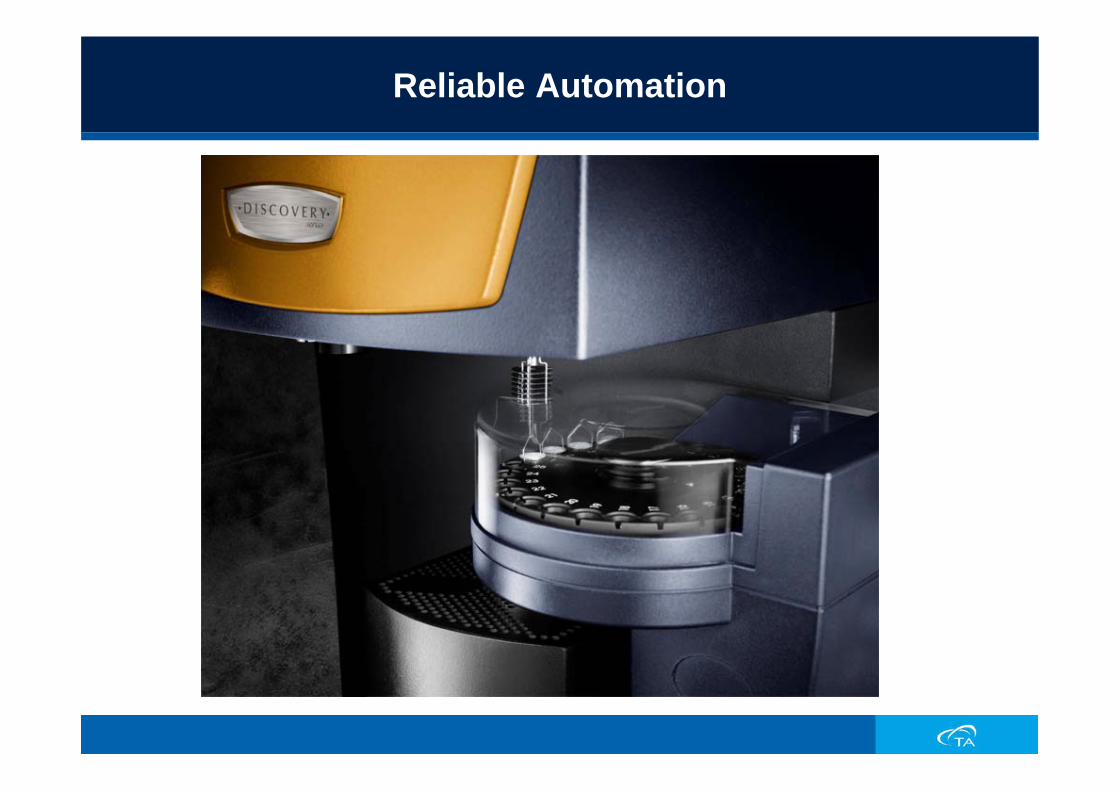
Reliable Automation
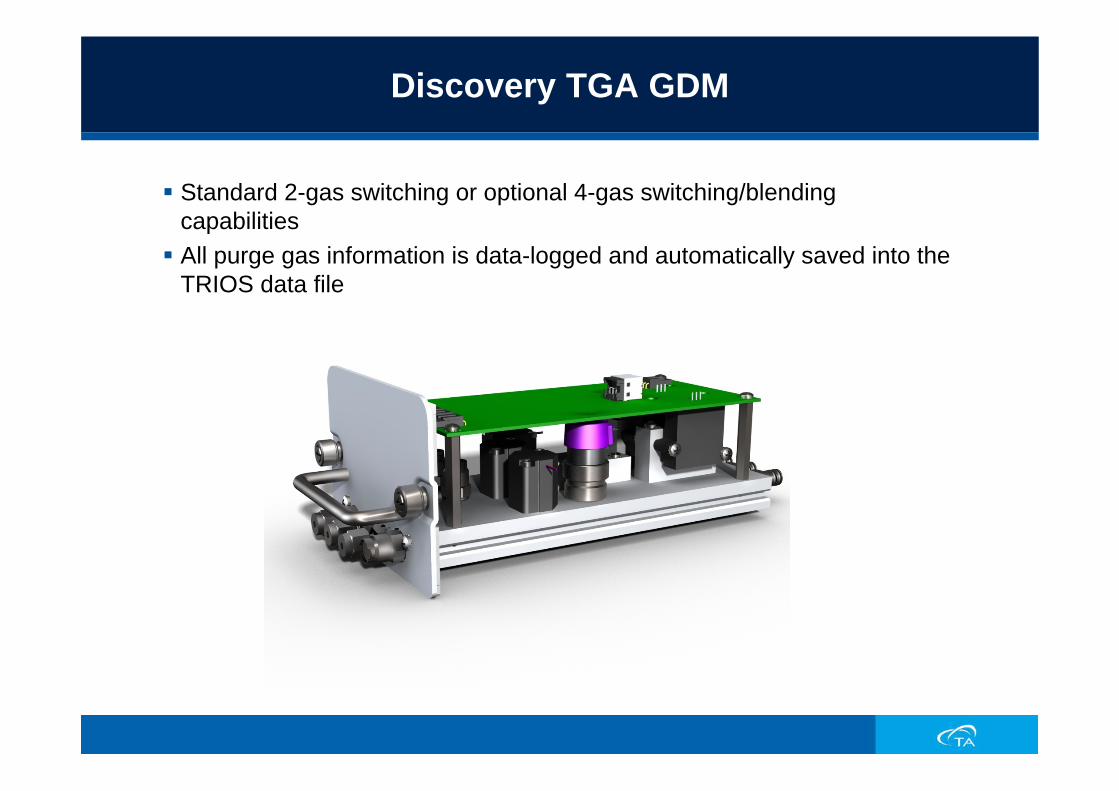
Discovery TGA GDM
Standard 2-gas switching or optional 4-gas switching/blending capabilitiesAll purge gas information is data-logged and automatically saved into the TRIOS data file
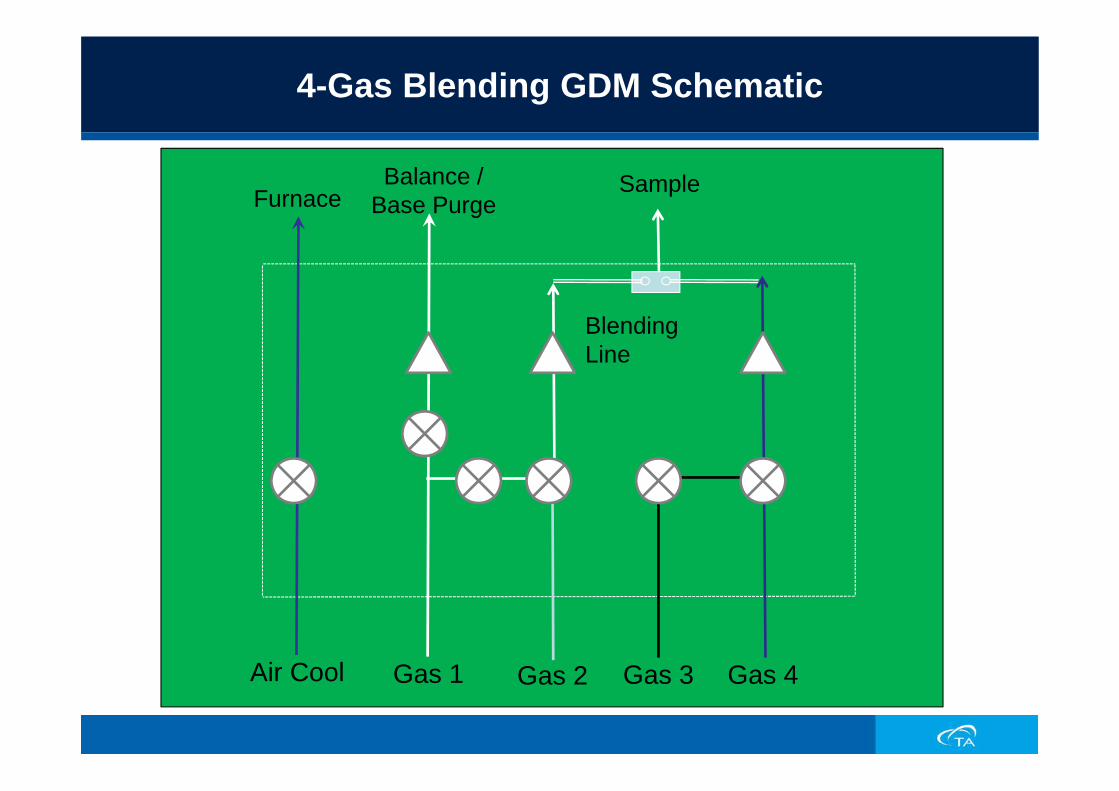
4-Gas Blending GDM Schematic
Balance / Base Purge
SampleFurnace
Gas 1 Gas 3 Gas 4Gas 2
Blending Line
Air Cool
Amorphous Structure &
Glass Transition Studies
Amorphous Materials
Amorphous Structure –Randomly oriented moleculesNo long-range orderLiquids, glassy or rubbery solidsMost polymers are either amorphous or semi-crystalline
Characterization of Amorphous Structure
Glass Transition (Tg)Due to amorphous (non-crystalline) structureDue to macro-molecular motion (translational); i.e., the entire molecule is free to move relative to adjacent molecules.Extremely important transition because the significant change in molecular mobility at Tg causes significant changes in physical and reactive properties.
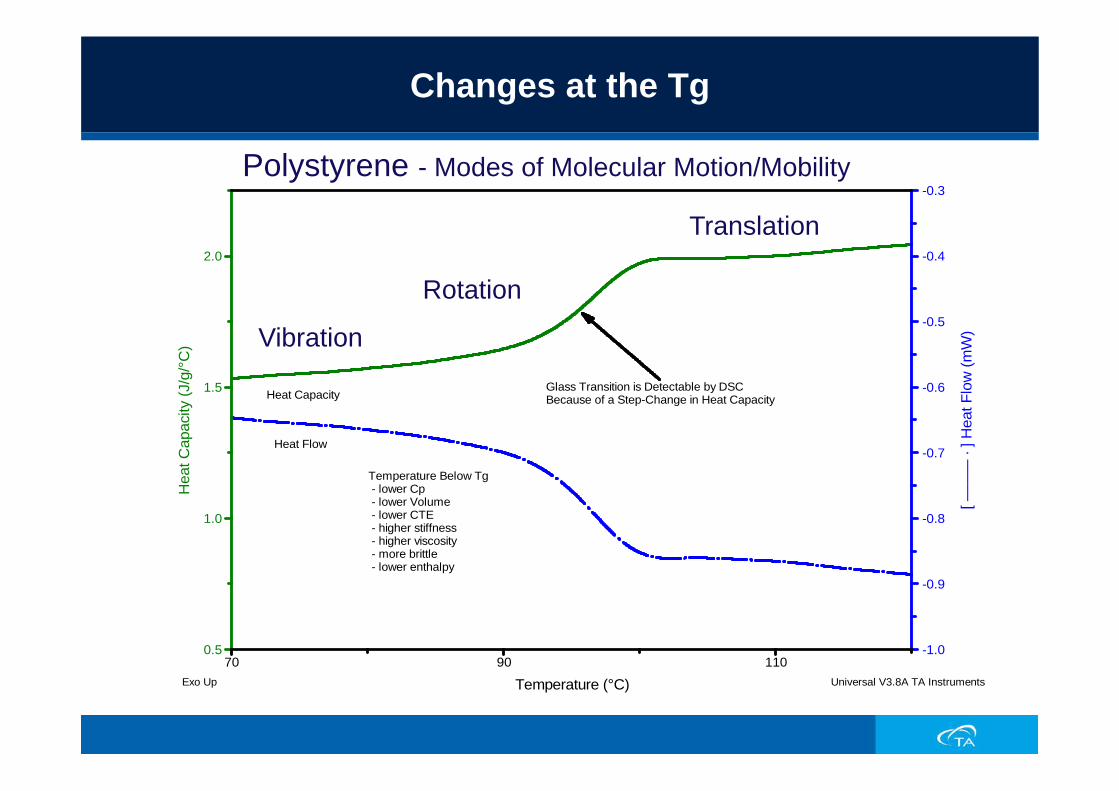
Changes at the Tg
Heat Flow
Heat Capacity
Temperature Below Tg - lower Cp - lower Volume - lower CTE - higher stiffness - higher viscosity - more brittle - lower enthalpy
Glass Transition is Detectable by DSCBecause of a Step-Change in Heat Capacity
-1.0
-0.9
-0.8
-0.7
-0.6
-0.5
-0.4
-0.3
[ –––
–– ·
] Hea
t Flo
w (m
W)
0.5
1.0
1.5
2.0
Hea
t Cap
acity
(J/g
/°C
)
70 90 110
Temperature (°C)Exo Up Universal V3.8A TA Instruments
Polystyrene - Modes of Molecular Motion/Mobility
Vibration
Rotation
Translation
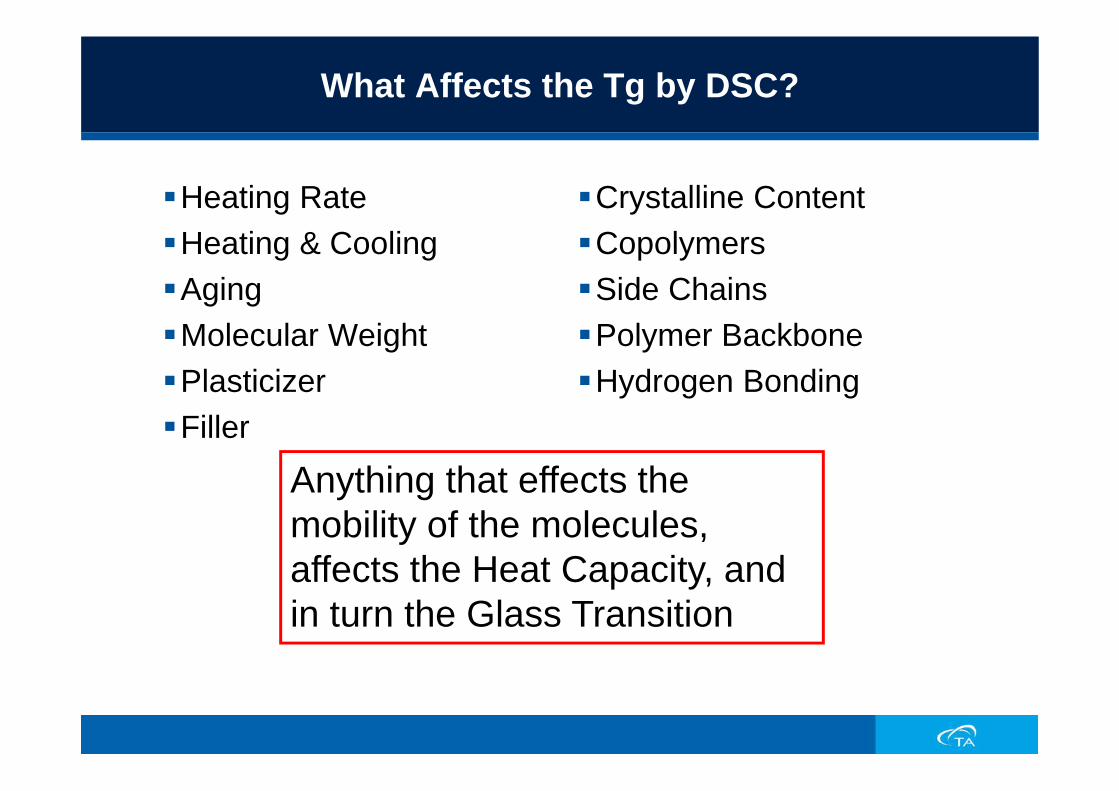
What Affects the Tg by DSC?
Heating RateHeating & CoolingAgingMolecular WeightPlasticizerFiller
Crystalline ContentCopolymersSide ChainsPolymer BackboneHydrogen Bonding
Anything that effects the mobility of the molecules, affects the Heat Capacity, and in turn the Glass Transition
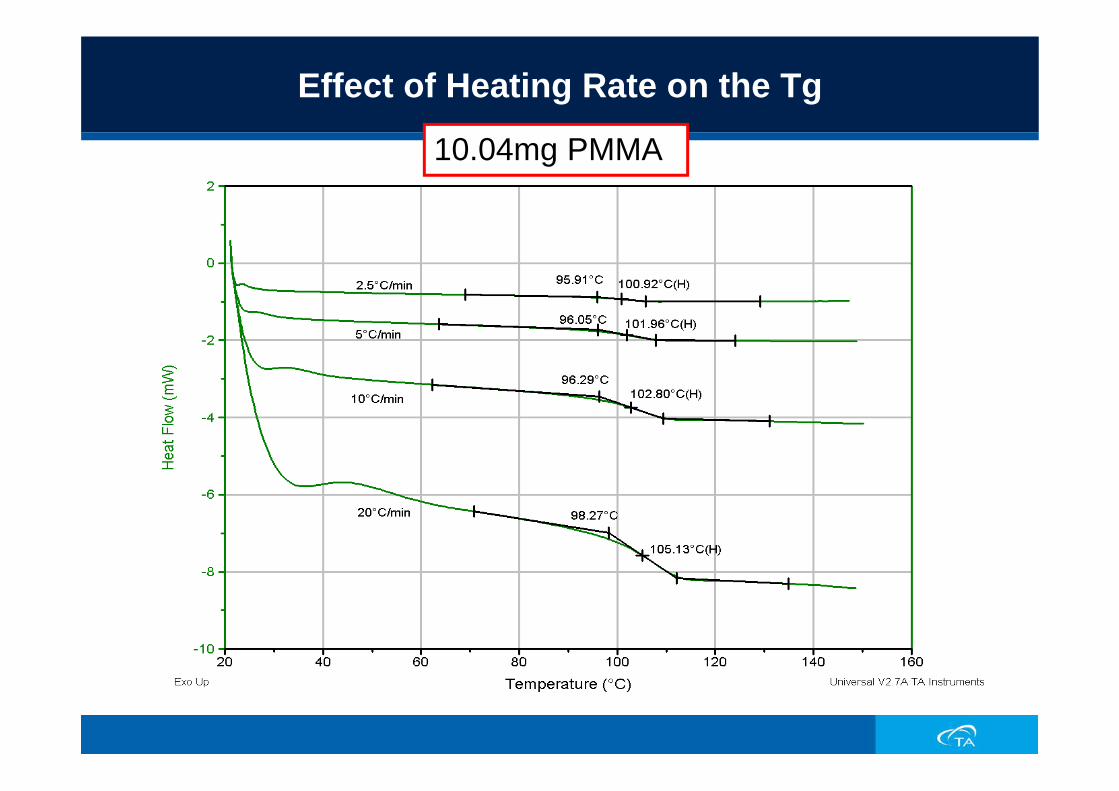
Effect of Heating Rate on the Tg
10.04mg PMMA

Is it a Tg?
If not sure if a transition is a TgRun Heat-Cool-Heat (H-C-H)
If transition is a Tg then it should be present on cooling curve and 2nd heat
Run MDSCA Tg will always show up in the Reversing Curve of a MDSC experiment
Run TMA or DMA
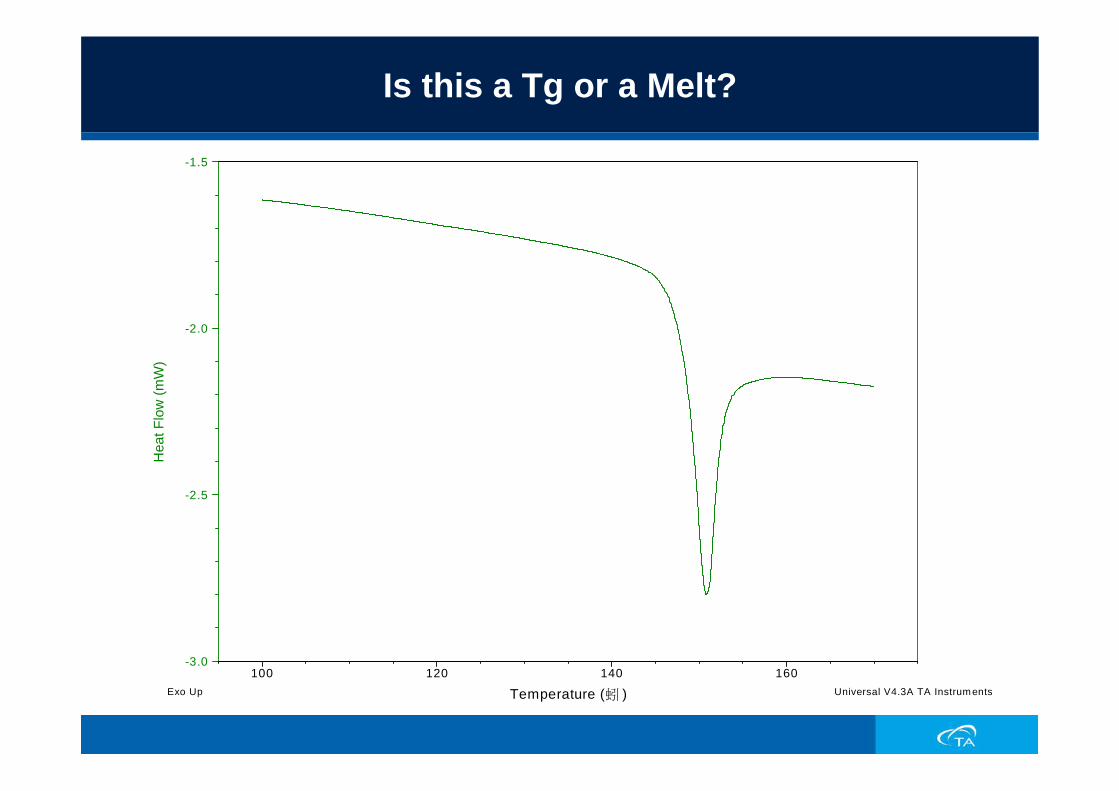
Is this a Tg or a Melt?
-3.0
-2.5
-2.0
-1.5H
eat F
low
(mW
)
100 120 140 160
Temperature (蚓 )Exo Up Universal V4.3A TA Instruments
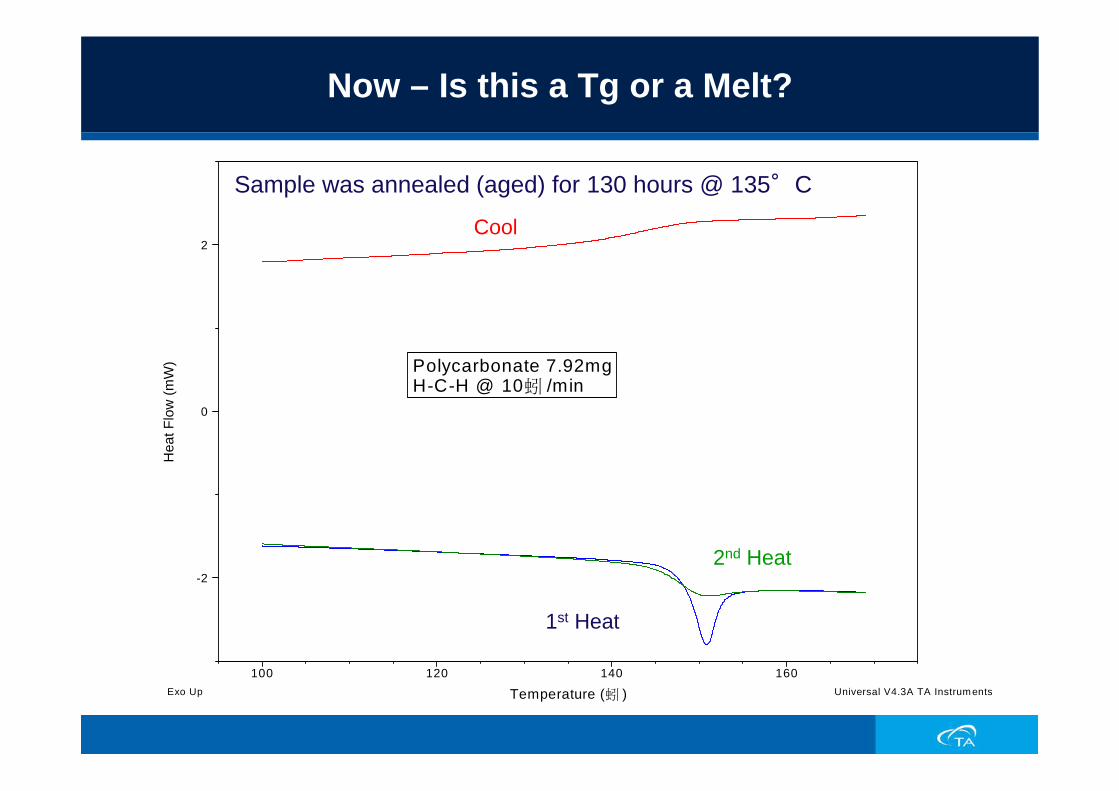
Now – Is this a Tg or a Melt?
Polycarbonate 7.92mgH-C-H @ 10蚓 /min
-2
0
2
Hea
t Flo
w (m
W)
100 120 140 160
Temperature (蚓 )Exo Up Universal V4.3A TA Instruments
Sample was annealed (aged) for 130 hours @ 135°C
Cool
1st Heat
2nd Heat
Measurement of Amorphous Structure
The size of the glass transition is linearly proportional to the amount of amorphous structure in the sampleFor small molecules, the glass transition is typically a sharp step and its size can be measured by standard DSC if the DSC has a straight baselineFor polymers, the glass transition is typically broader and becomes hard to measure as the crystalline content increases

Quantification of Amorphous Structure
% Amorphous = 0.145/0.353 = 41%
PET -- 9.43mg MDSC .531/40@5
Change in Cp @ Tg is a measure of amorphous structure
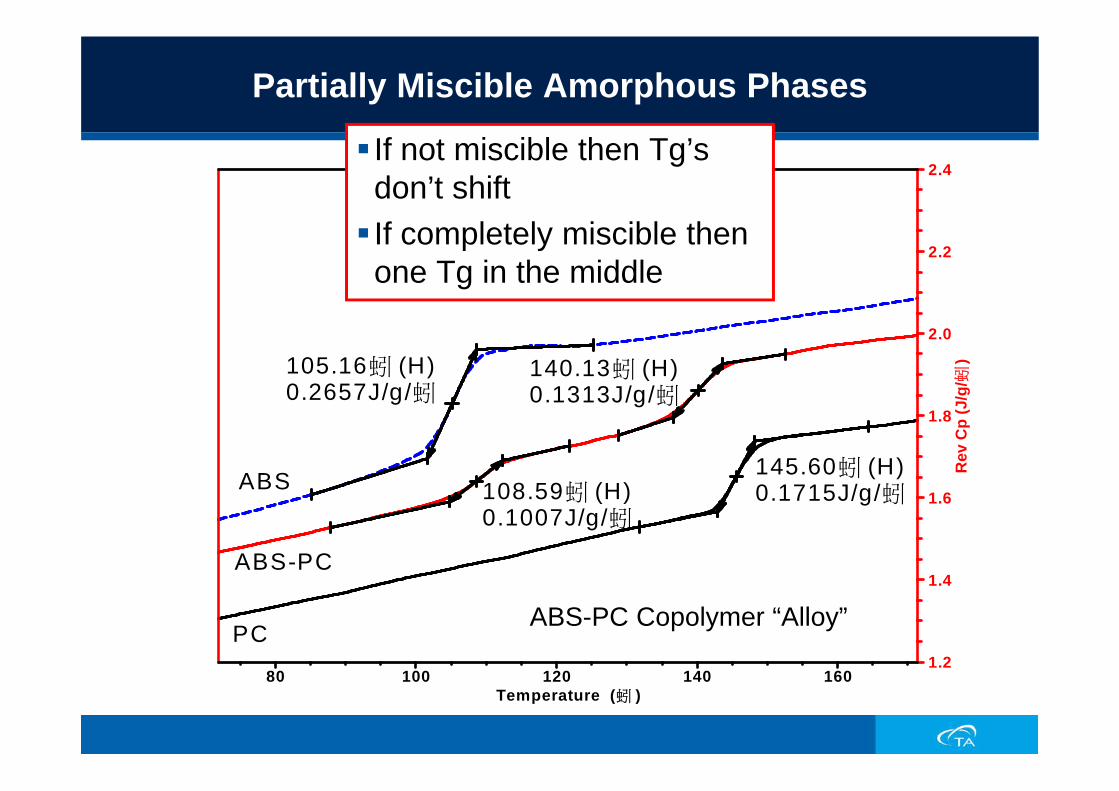
Partially Miscible Amorphous Phases
108.59蚓 (H)0.1007J/g/蚓
140.13蚓 (H)0.1313J/g/蚓
105.16蚓 (H)0.2657J/g/蚓
145.60蚓 (H)0.1715J/g/蚓
PC
ABS-PC
ABS
1.2
1.4
1.6
1.8
2.0
2.2
2.4
Rev
Cp
(J/g
/蚓)
80 100 120 140 160Temperature (蚓 )
If not miscible then Tg’s don’t shiftIf completely miscible then one Tg in the middle
ABS-PC Copolymer “Alloy”

Applications: Measuring Crystalline Structure
Semi-Crystalline Polymers
Crystalline Structure –Molecules arranged in well defined structuresConsists of repeating unitsPolymers can have crystalline phases
Length of molecules prevents complete crystallization
Semi-crystalline Polymers –Both amorphous & crystalline solid phasesExamples are most common thermoplastics
Polyethylene, Polypropylene, etc
Melting
Melting – The process of converting solid crystalline structure to liquid amorphous structure
Melting shows up as an endothermic peak in a DSC scanThe energy required to melt the crystalline phase is proportional to the amount of crystalline phase
In most cases sensitivity isn’t an issue with melting transitionsHeating rate doesn’t effect the onset of melting (much), but will effect resolution

Definitions (cont.)
Crystallization – The process of converting either solid amorphous structure (cold crystallization on heating) or liquid amorphous structure (cooling) to a more organized solid crystalline structure
Enthalpy of Melting/Crystallization - The heat energy required for melting or released upon crystallization. This is calculated by integrating the area of the DSC peak on a time basis.

Melting of Indium
157.01蚓
156.60蚓28.50J/g
Indium5.7mg10蚓 /min
-25
-20
-15
-10
-5
0H
eat F
low
(mW
)
150 155 160 165
Temperature (蚓)Exo Up Universal V4.0B TA Instruments
Peak Temperature
Extrapolated Onset Temperature
Heat of Fusion
For pure, low molecular weight materials (mw<500 g/mol) use Extrapolated Onset as Melting Temperature
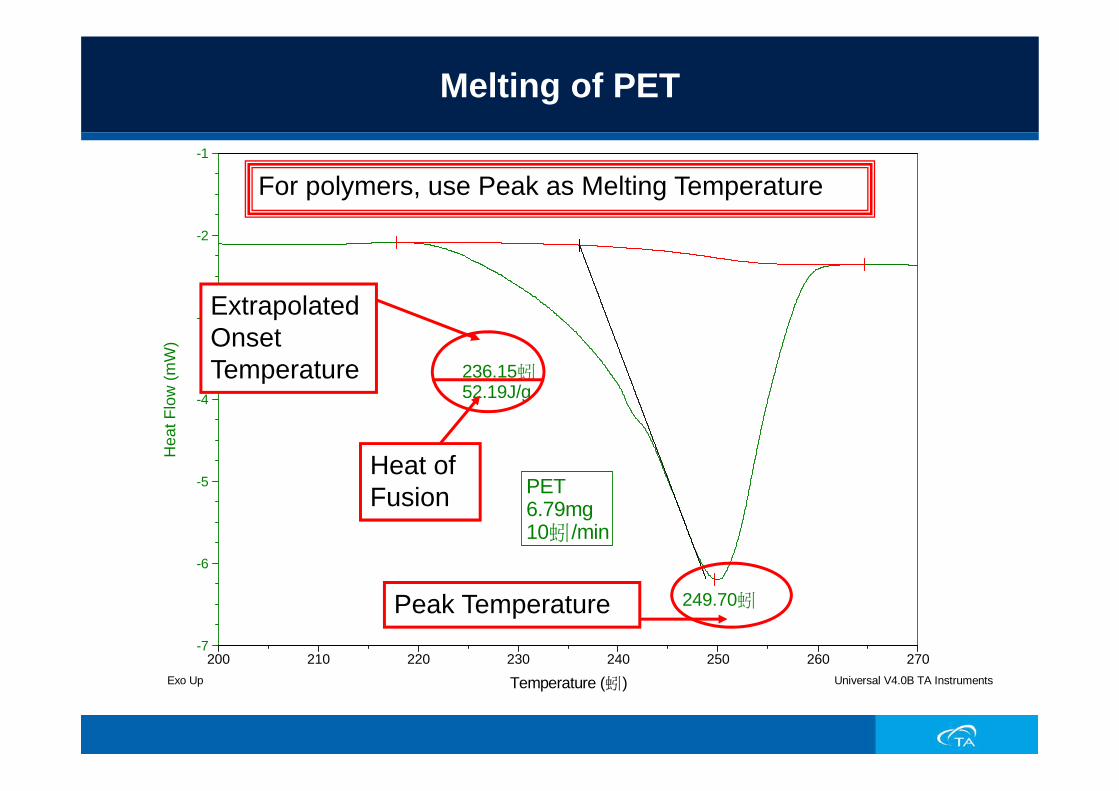
Melting of PET
249.70蚓
236.15蚓52.19J/g
PET6.79mg10蚓 /min
-7
-6
-5
-4
-3
-2
-1H
eat F
low
(mW
)
200 210 220 230 240 250 260 270
Temperature (蚓)Exo Up Universal V4.0B TA Instruments
Extrapolated Onset Temperature
Peak Temperature
Heat of Fusion
For polymers, use Peak as Melting Temperature
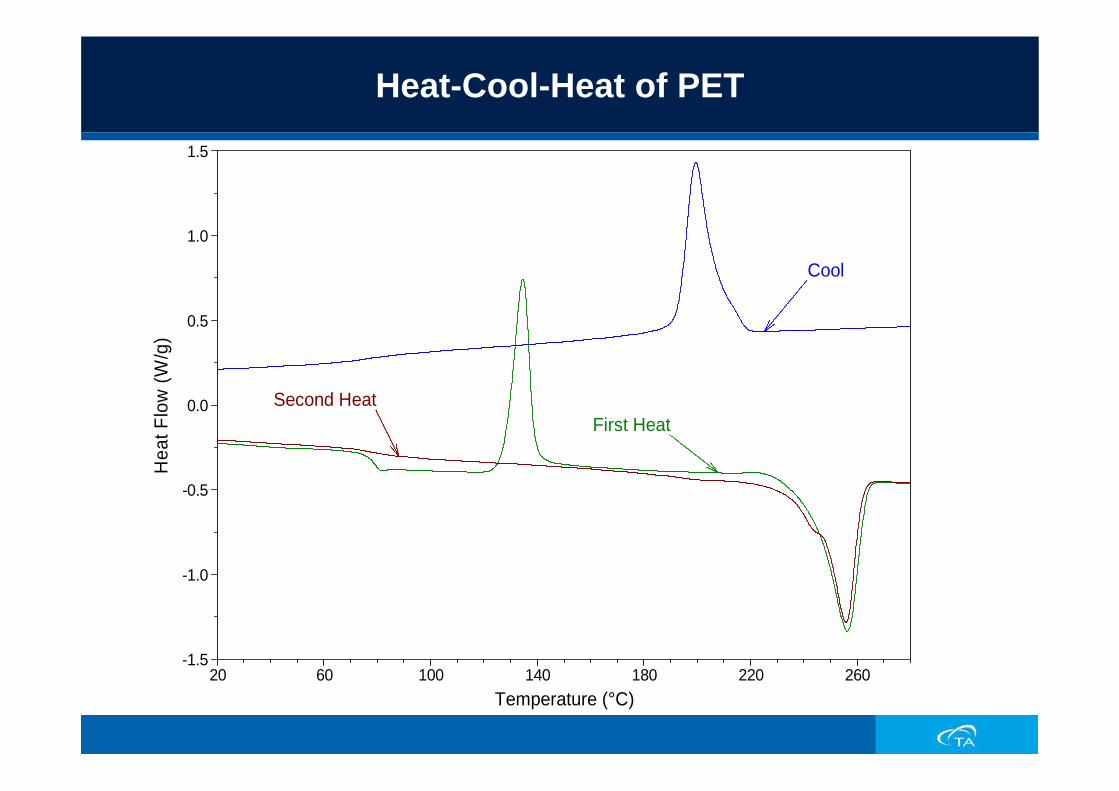
Heat-Cool-Heat of PET
Second HeatFirst Heat
Cool
-1.5
-1.0
-0.5
0.0
0.5
1.0
1.5H
eat F
low
(W/g
)
20 60 100 140 180 220 260Temperature (°C)

Baseline Type
Crystallization
Crystallization shows up as an exothermic peak in a DSC scanCrystallization is molten amorphous material changing to crystalline material upon coolingCold-Crystallization is solid amorphous material changing to crystalline material upon heatingSince crystallization is a kinetic transition, heating/cooling rate does effect the onset of crystallization, and will also effect resolution
Crystallization
Crystallization is a kinetic process which is typically studied either while cooling or isothermally, but can also be studied during heating (Cold-Crystallization)Differences in crystallization temperature or time (at a specific temperature) between samples can affect end-use properties as well as processing conditionsIsothermal crystallization is the most sensitive way to identify differences in crystallization rates

Effect of Cooling Rate on Crystallization
0.0
0.5
1.0
1.5
2.0H
eat F
low
(W/g
)
40 50 60 70 80 90 100 110 120 130 140 150 160Temperature (蚓 )Exo Up
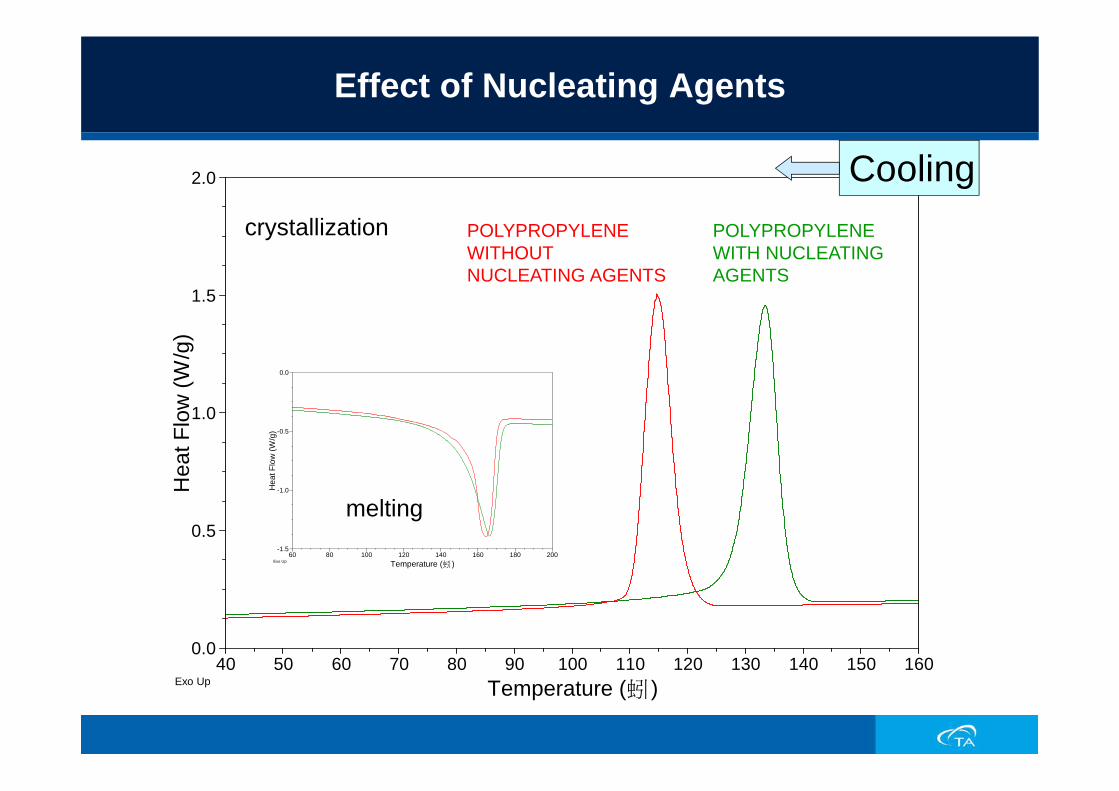
POLYPROPYLENEWITH NUCLEATING AGENTS
POLYPROPYLENEWITHOUT NUCLEATING AGENTS
-1.5
-1.0
-0.5
0.0
Hea
t Flo
w (W
/g)
60 80 100 120 140 160 180 200Temperature (蚓 )Exo Up
crystallization
melting
Effect of Nucleating Agents
Cooling
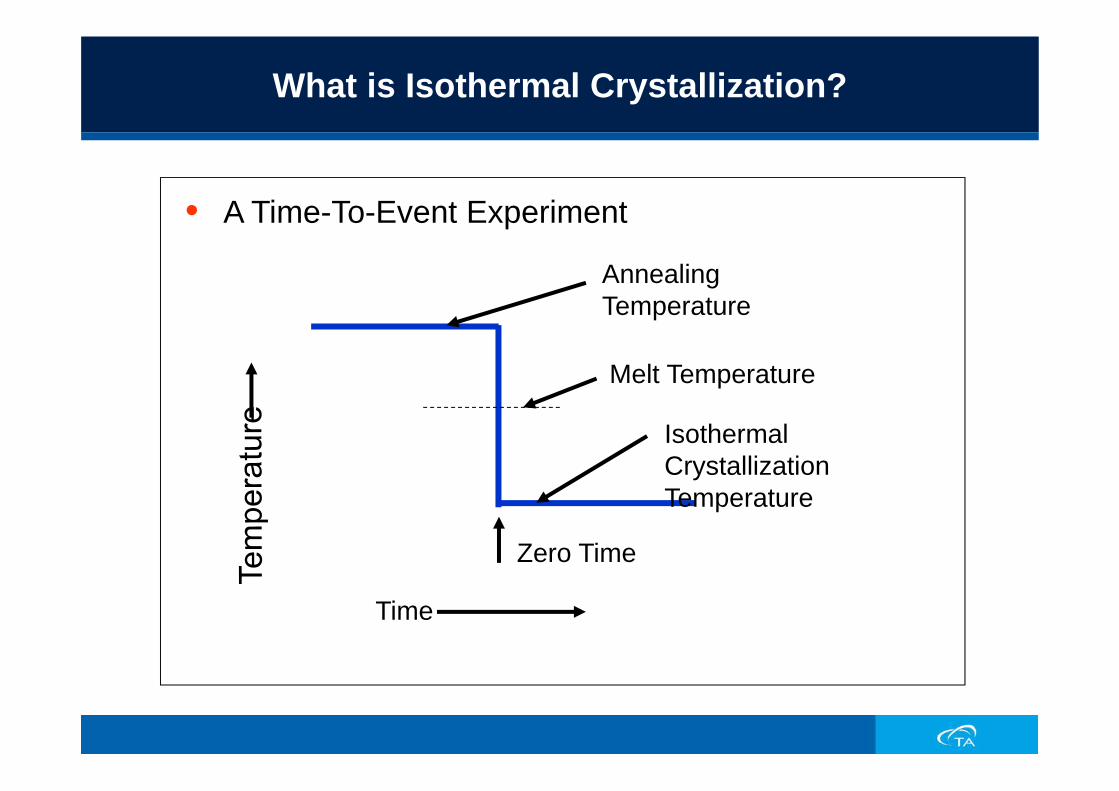
What is Isothermal Crystallization?
• A Time-To-Event Experiment
Annealing Temperature
Melt Temperature
Isothermal Crystallization Temperature
Time
Zero Time

Isothermal Crystallization
117.4 oC
117.8 oC
118.3 oC
118.8 oC
119.3 oC119.8 oC
120.3 oC
0
1
2
3
4
5H
eat F
low
(mW
)
-1 1 3 5 7 9Time (min)
Applications: Characterization of
Thermosets

Thermoset Materials
A “thermoset” is a cross-linked polymer formed by an irreversible exothermic chemical reaction
A common example is a 2 part epoxy adhesiveWith a DSC we can look at the curing of these materials, and the Tg of full or partially cured samples

Thermosetting Polymers
Curing reaction can be followed by monitoring a wide variety of physical properties including:
Heat of reactionHeat capacityViscosityModulusOthers
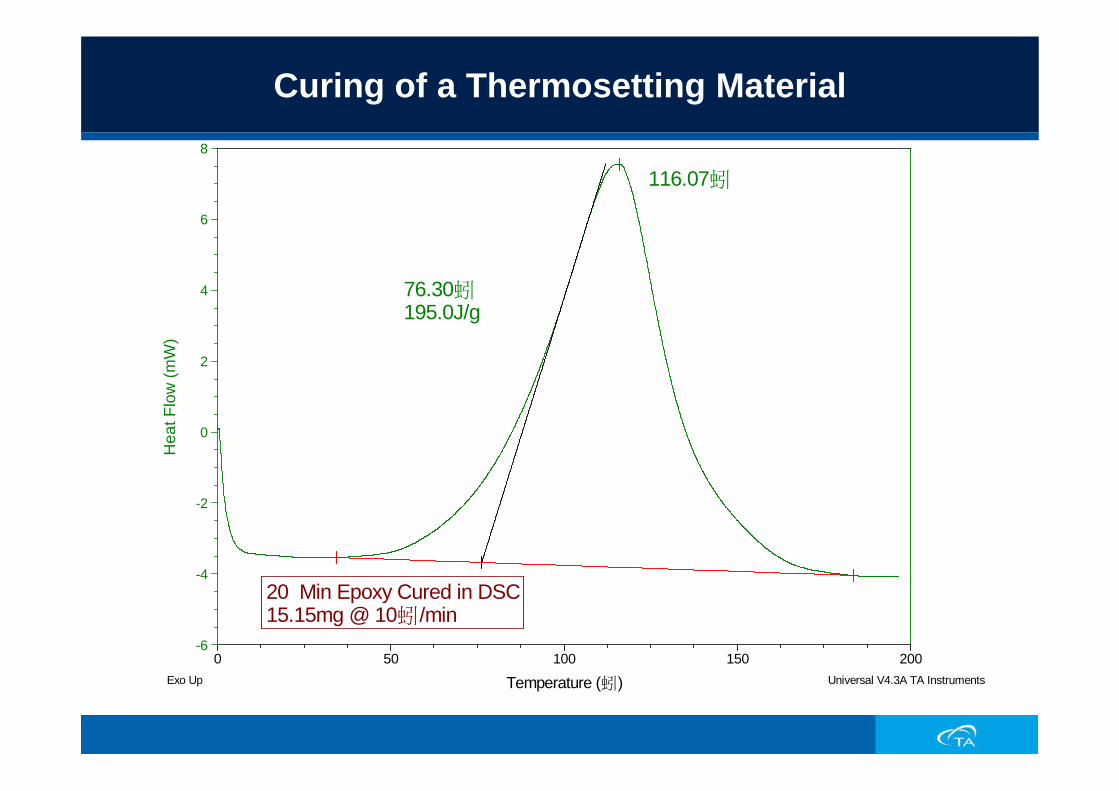
Curing of a Thermosetting Material
116.07蚓
76.30蚓195.0J/g
20 Min Epoxy Cured in DSC15.15mg @ 10蚓/min
-6
-4
-2
0
2
4
6
8H
eat F
low
(mW
)
0 50 100 150 200
Temperature (蚓)Exo Up Universal V4.3A TA Instruments
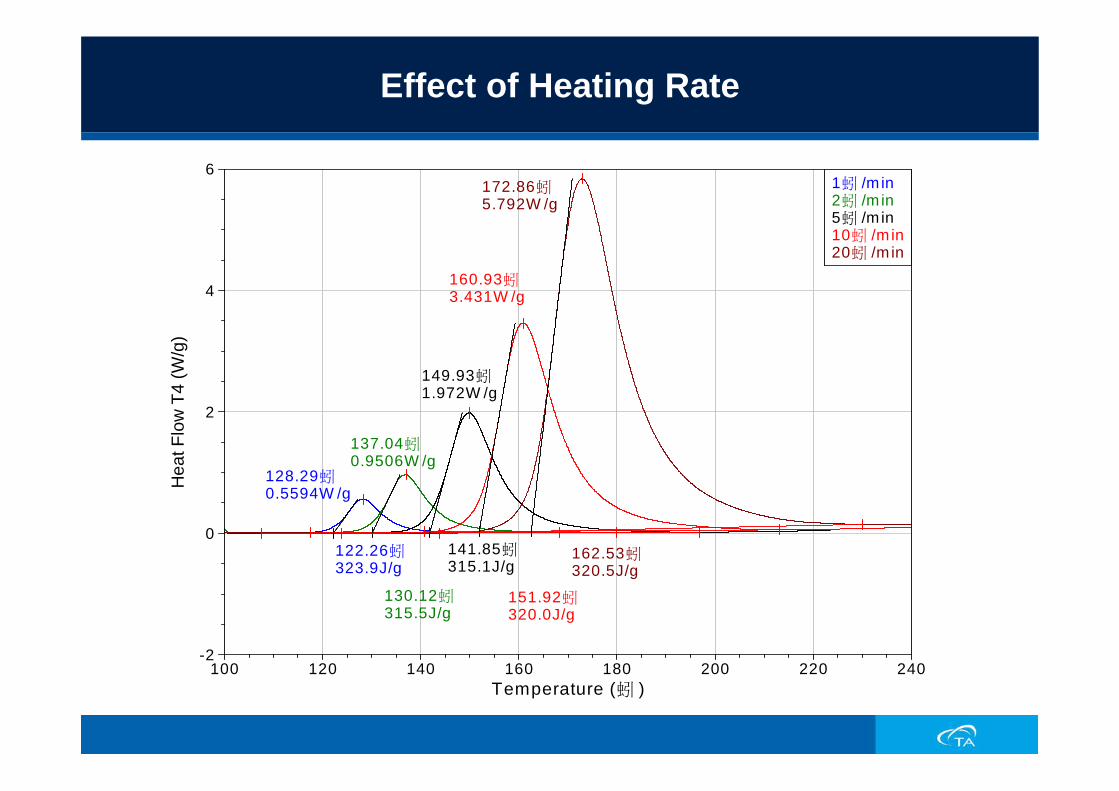
Effect of Heating Rate
128.29蚓0.5594W /g
122.26蚓323.9J/g
137.04蚓0.9506W /g
130.12蚓315.5J/g
149.93蚓1.972W /g
141.85蚓315.1J/g
160.93蚓3.431W /g
151.92蚓320.0J/g
172.86蚓5.792W /g
162.53蚓320.5J/g
-2
0
2
4
6H
eat F
low
T4
(W/g
)
100 120 140 160 180 200 220 240Temperature (蚓 )
1蚓 /m in2蚓 /m in5蚓 /m in10蚓 /m in20蚓 /m in
% Cure by DSC
Need Heat of Reaction (Enthalpy) of unreactedmaterial curing
Typically run uncured material in DSCRun cured (partially cured sample) in DSC
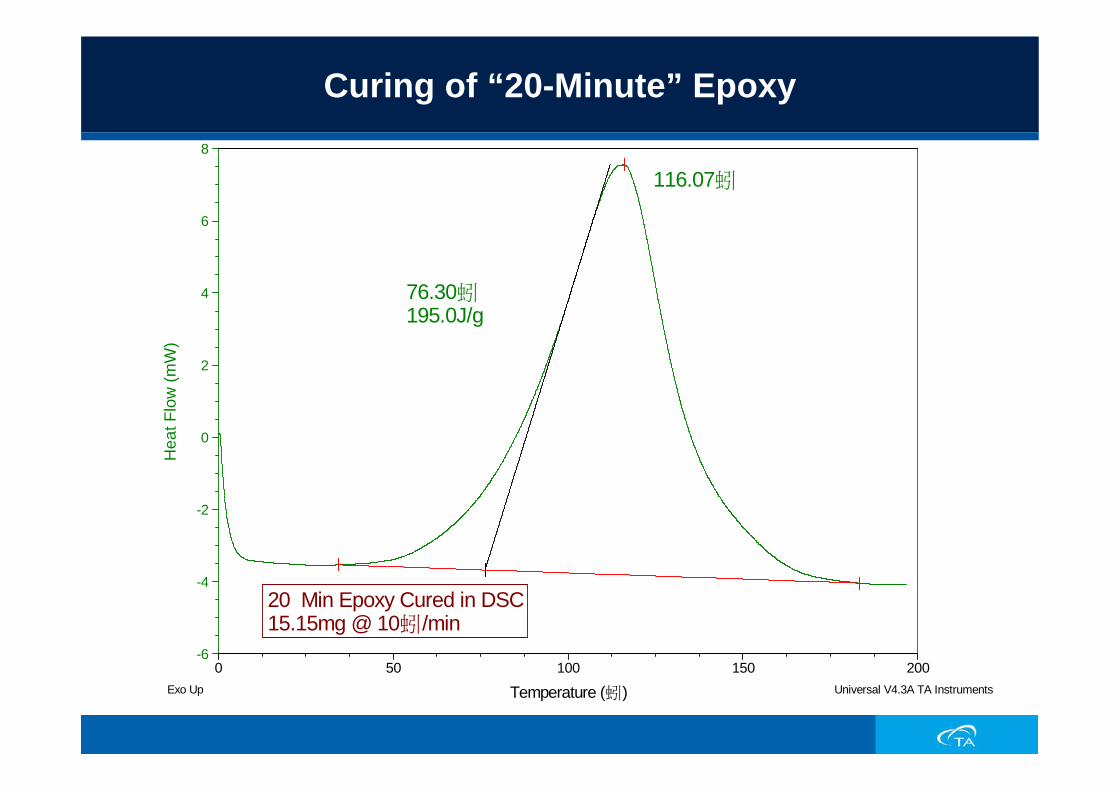
Curing of “20-Minute” Epoxy
116.07蚓
76.30蚓195.0J/g
20 Min Epoxy Cured in DSC15.15mg @ 10蚓/min
-6
-4
-2
0
2
4
6
8H
eat F
low
(mW
)
0 50 100 150 200
Temperature (蚓)Exo Up Universal V4.3A TA Instruments
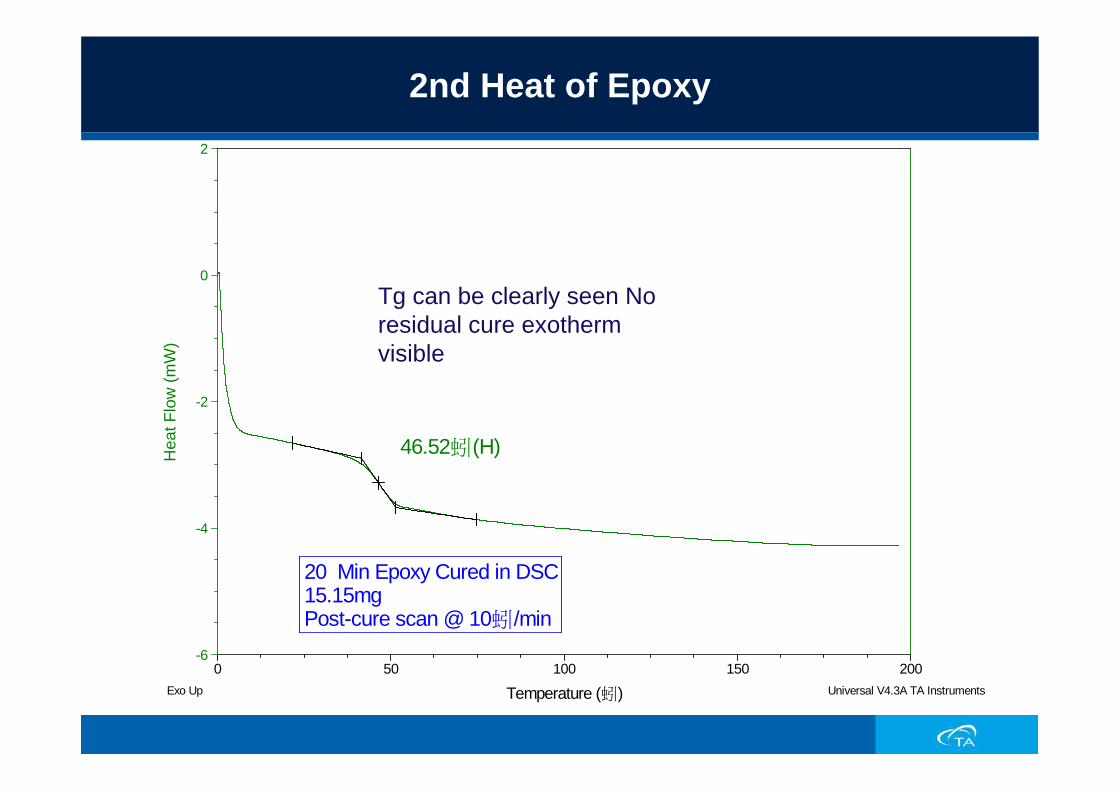
2nd Heat of Epoxy
46.52蚓(H)
20 Min Epoxy Cured in DSC15.15mg Post-cure scan @ 10蚓/min
-6
-4
-2
0
2H
eat F
low
(mW
)
0 50 100 150 200
Temperature (蚓)Exo Up Universal V4.3A TA Instruments
Tg can be clearly seen No residual cure exotherm visible
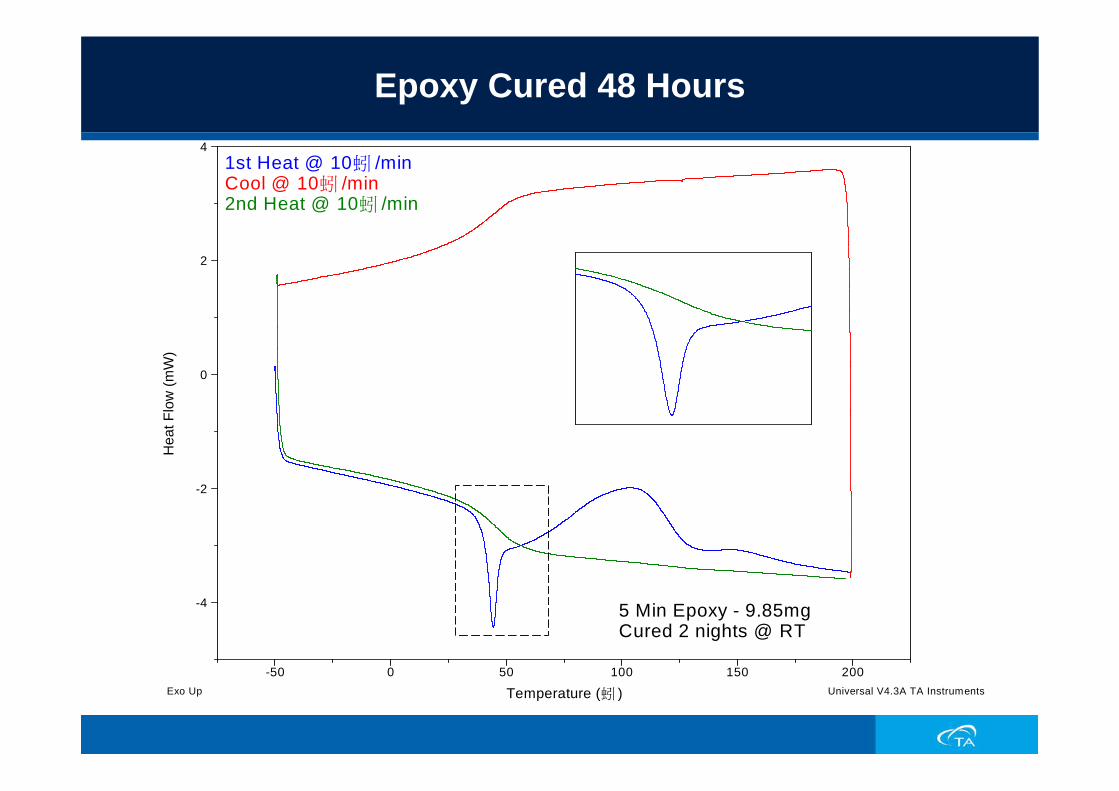
Epoxy Cured 48 Hours
5 Min Epoxy - 9.85mgCured 2 nights @ RT
-4
-2
0
2
4
Hea
t Flo
w (m
W)
-50 0 50 100 150 200
Temperature (蚓 )
1st Heat @ 10蚓 /minCool @ 10蚓 /min2nd Heat @ 10蚓 /min
Exo Up Universal V4.3A TA Instruments

Reaction Kinetics
The rate of reaction between the components is a function of time, temperature and formulationDSC can be used to measure how a formulation responds to time and temperatureData from DSC experiments can be applied to reaction models to predict reaction rates and required processing conditions
Borchardt & Daniels, single heat rateASTM E698, multiple heat ratesIsothermal, time to peak reaction rate
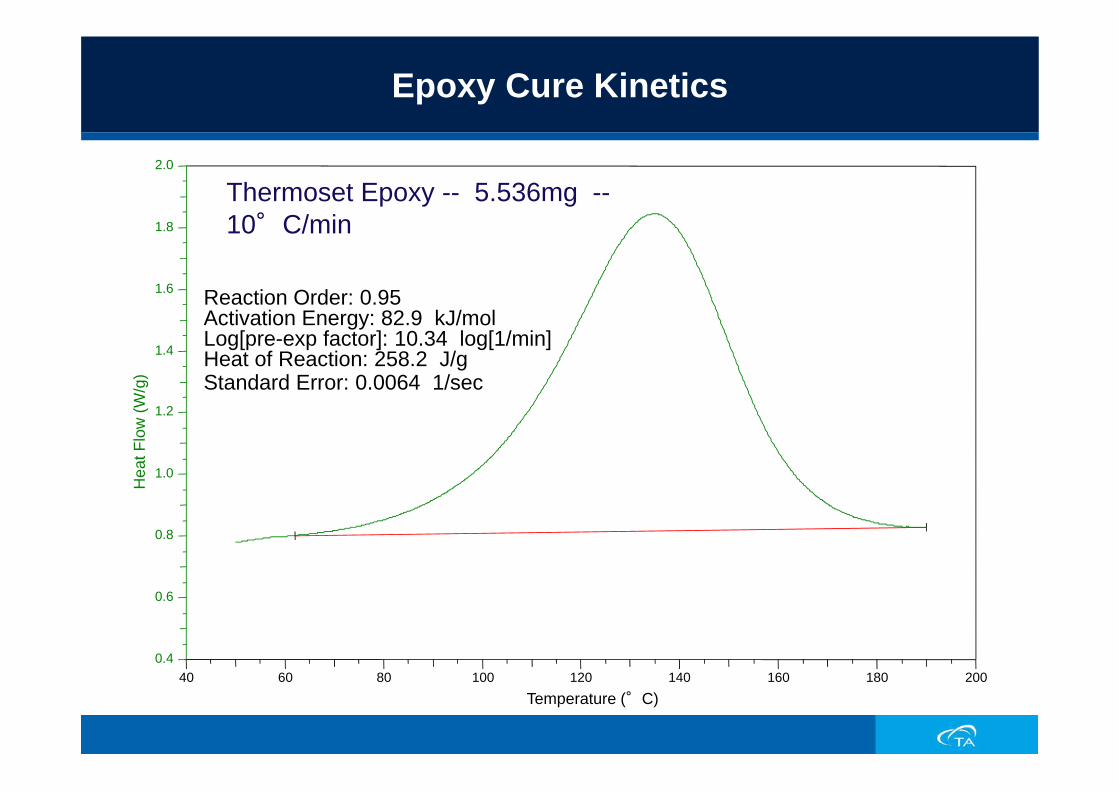
Epoxy Cure Kinetics
0.4
0.6
0.8
1.0
1.2
1.4
1.6
1.8
2.0
Hea
t Flo
w (W
/g)
40 60 80 100 120 140 160 180 200 Temperature (°C)
Reaction Order: 0.95Activation Energy: 82.9 kJ/molLog[pre-exp factor]: 10.34 log[1/min]Heat of Reaction: 258.2 J/gStandard Error: 0.0064 1/sec
Thermoset Epoxy -- 5.536mg --10°C/min
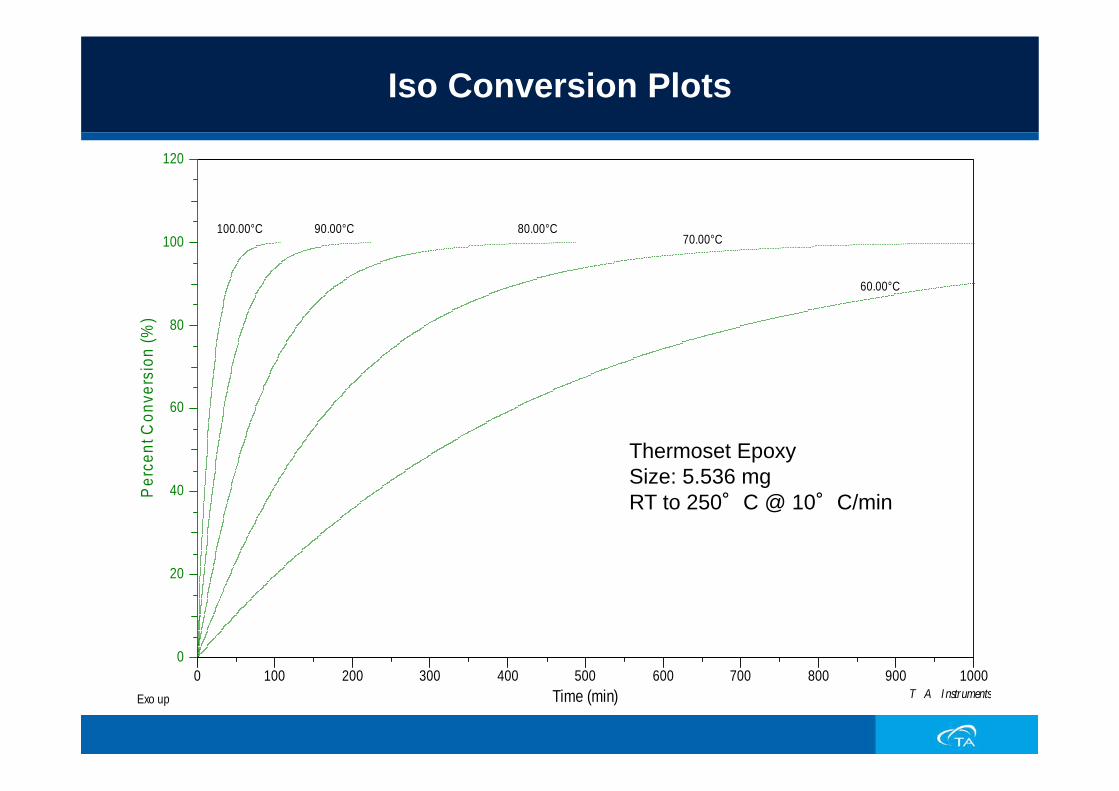
Iso Conversion Plots
0
20
40
60
80
100
120 P
erce
nt C
onve
rsio
n (%
)
0 100 200 300 400 500 600 700 800 900 1000 Time (min)Exo up T A I nstruments
60.00°C
70.00°C80.00°C90.00°C100.00°C
Thermoset EpoxySize: 5.536 mgRT to 250°C @ 10°C/min
Applications: Thermal Stability
&Kinetics

Thermal Stability
Thermal StabilityCan be studied by multiple techniquesMay be studied w/ inert or oxidizing atmospheresTGA – Best choice
Weight lossDSC
Change in heat flow (typically exothermic)DSC cell can be contaminated
Can also see the effect in other techniques like DMA & TMA
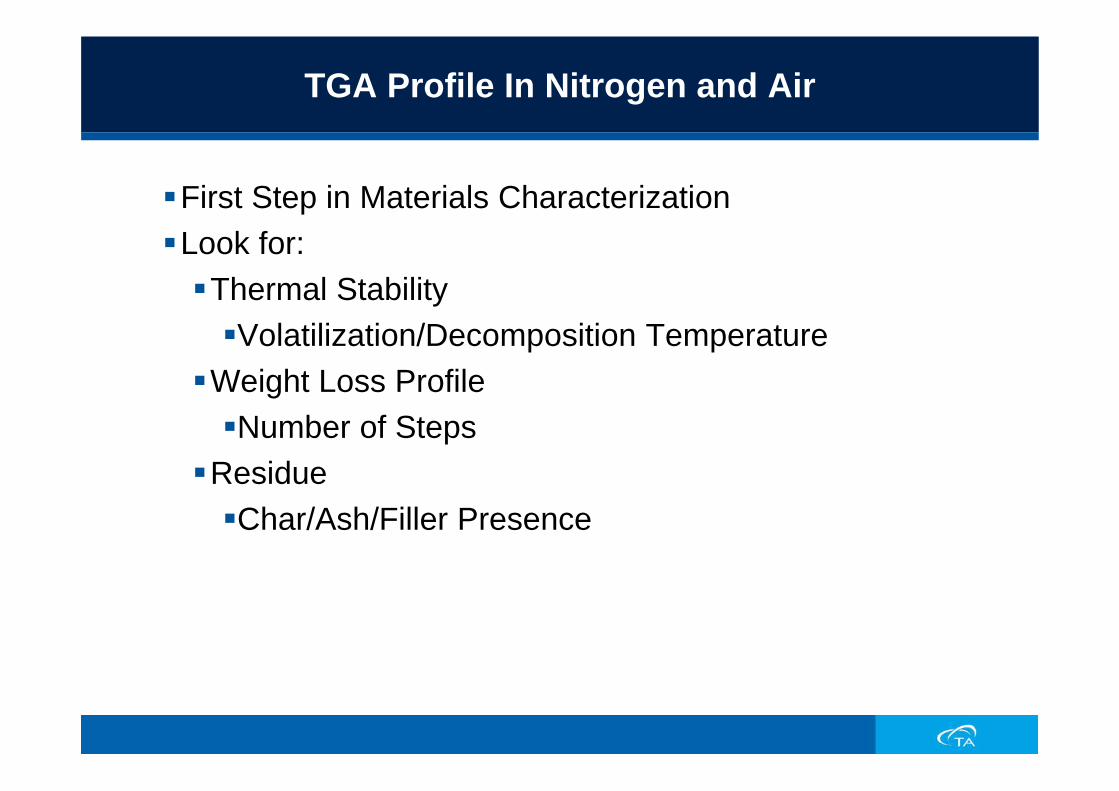
TGA Profile In Nitrogen and Air
First Step in Materials CharacterizationLook for:
Thermal StabilityVolatilization/Decomposition Temperature
Weight Loss ProfileNumber of Steps
ResidueChar/Ash/Filler Presence
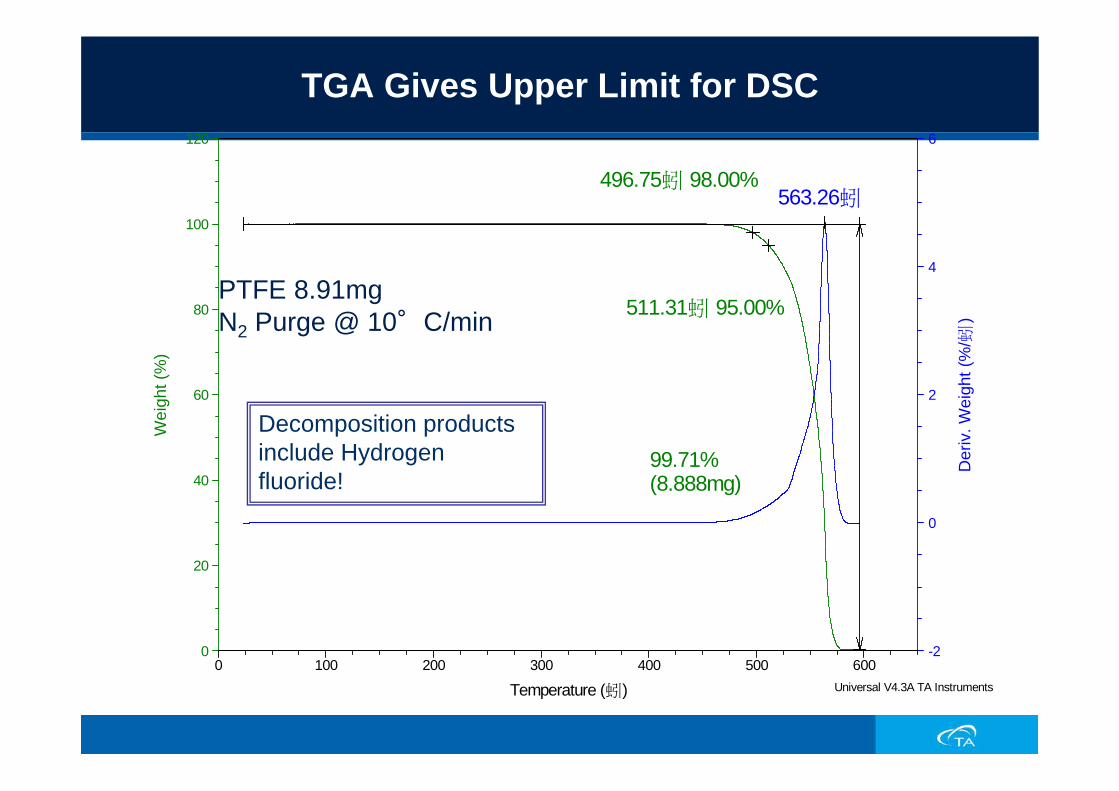
TGA Gives Upper Limit for DSC
496.75蚓 98.00%
511.31蚓 95.00%
99.71%(8.888mg)
563.26蚓
-2
0
2
4
6
Der
iv. W
eigh
t (%
/蚓)
0
20
40
60
80
100
120W
eigh
t (%
)
0 100 200 300 400 500 600
Temperature (蚓) Universal V4.3A TA Instruments
PTFE 8.91mg N2 Purge @ 10°C/min
Decomposition products include Hydrogen fluoride!

Thermal Stability of Polymers
Method Log: 1:Select gas: 1 - N21: Ramp 20.00 蚓 /m in to 650.00 蚓2: Select gas: 2 - Air3: Ramp 20.00 蚓 /m in to 1000.00 蚓
PVC
PMMA
PET
650.00蚓55.59%
650.00蚓5.928%
LDPEPEEK
650.00蚓14.32%
0
20
40
60
80
100
Wei
ght (
%)
50 250 450 650 850 1050
Temperature (蚓 )
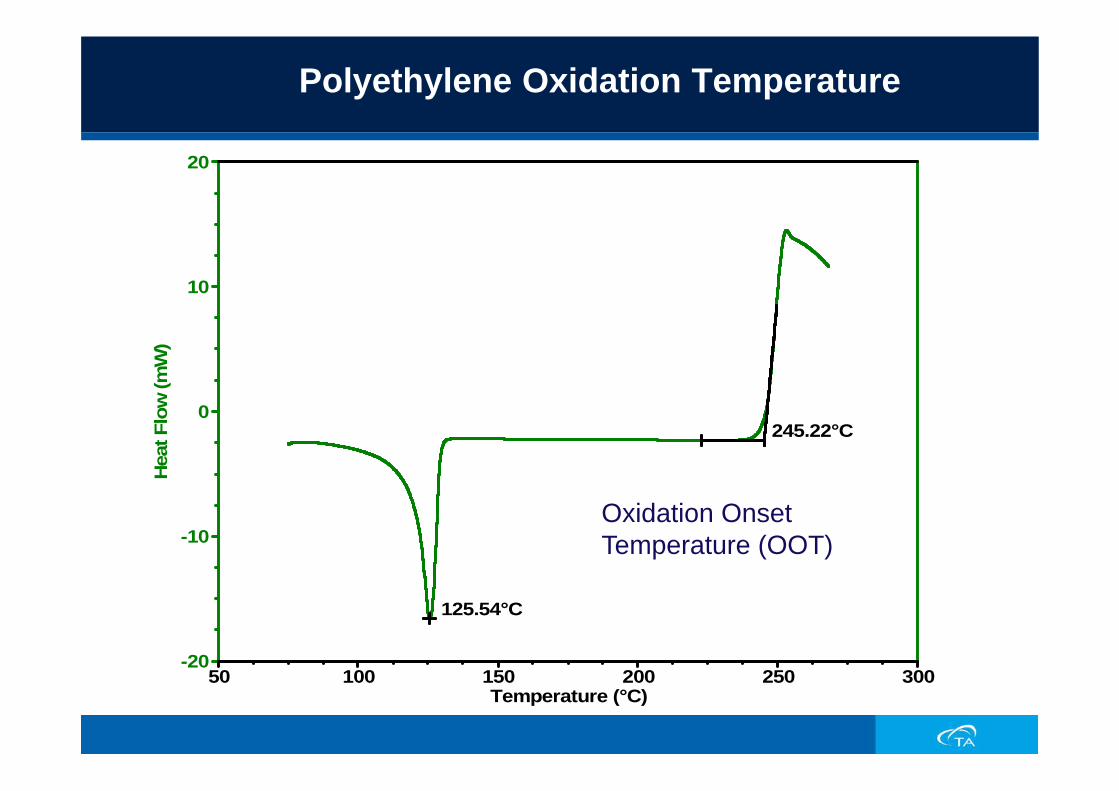
Polyethylene Oxidation Temperature
245.22°C
125.54°C
-20
-10
0
10
20H
eat F
low
(mW
)
50 100 150 200 250 300Temperature (°C)
Oxidation Onset Temperature (OOT)
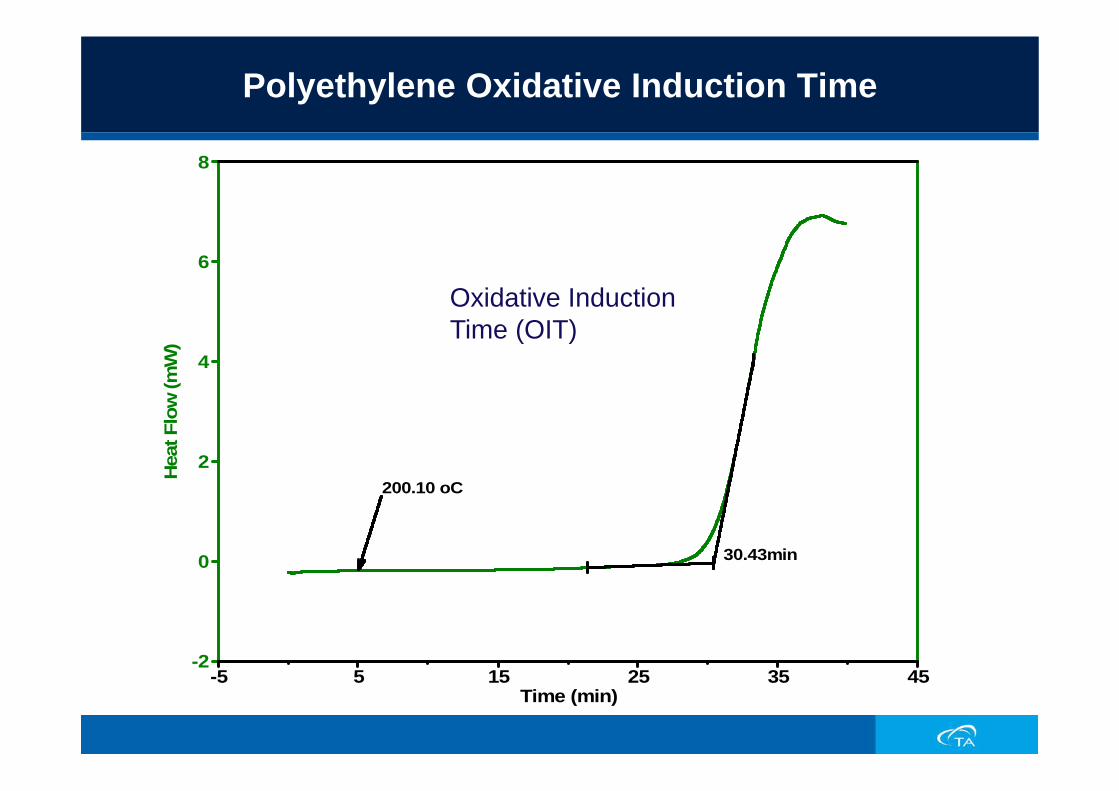
Polyethylene Oxidative Induction Time
200.10 oC
30.43min
-2
0
2
4
6
8H
eat F
low
(mW
)
-5 5 15 25 35 45Time (min)
Oxidative Induction Time (OIT)
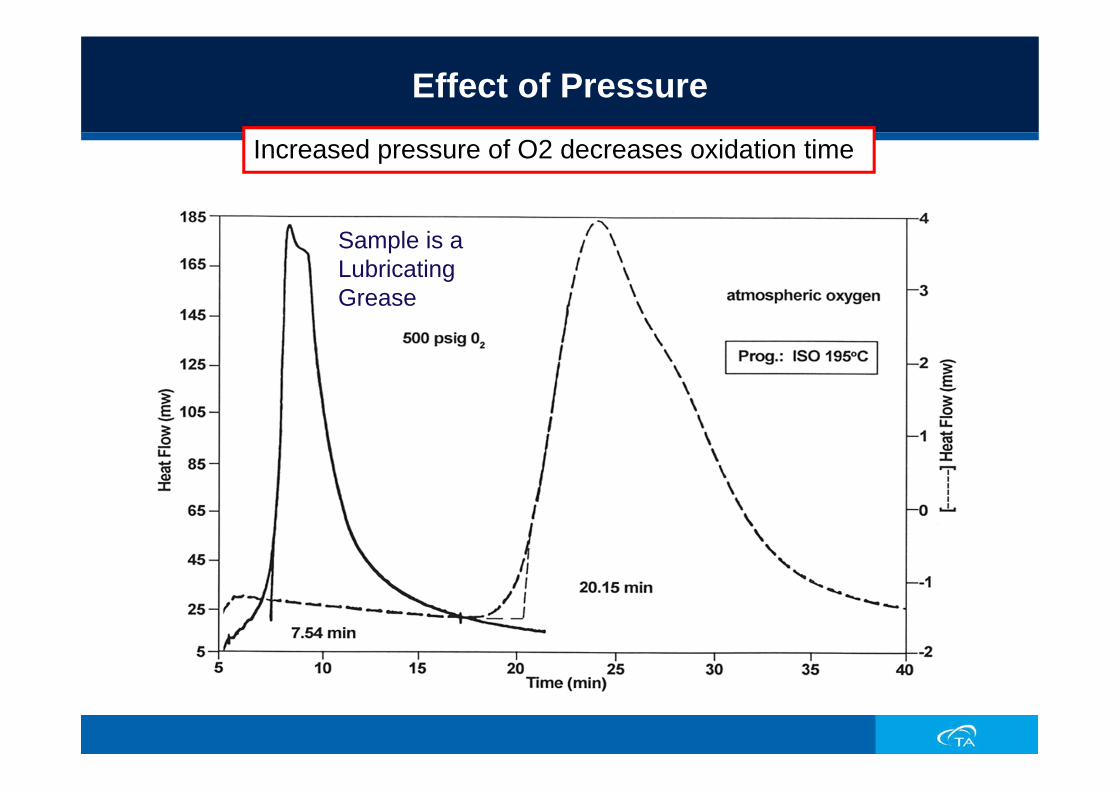
Effect of Pressure
Increased pressure of O2 decreases oxidation time
Sample is a Lubricating Grease
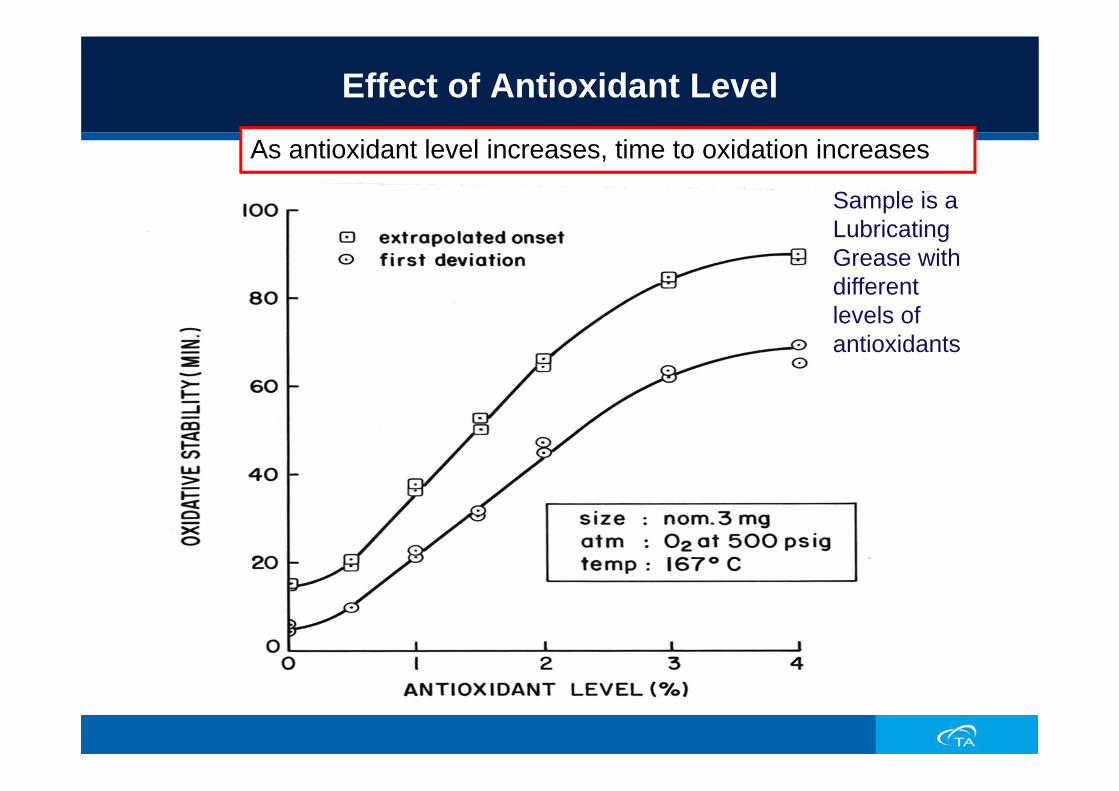
Effect of Antioxidant Level
As antioxidant level increases, time to oxidation increases
Sample is a Lubricating Grease with different levels of antioxidants

Paint Drying
Latex paint @ various humidity’s and temperatures
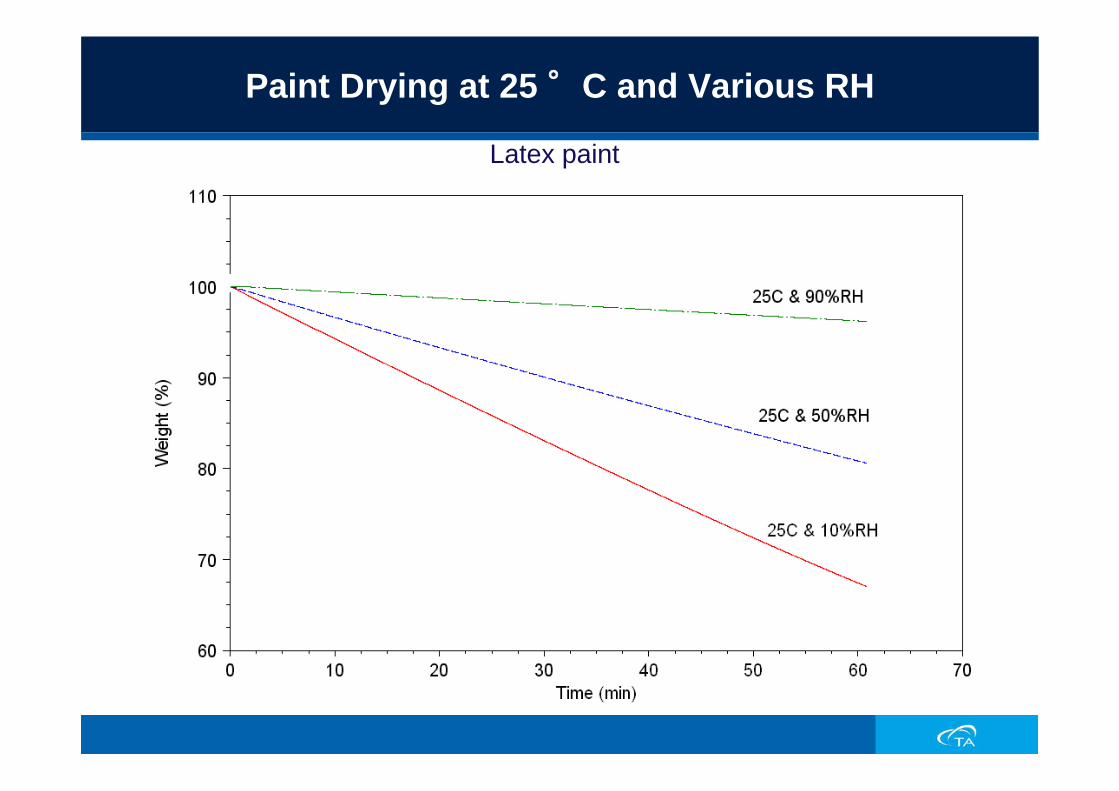
Latex paint
Paint Drying at 25 °C and Various RH
Kinetic Analysis
The rate at which a kinetic process proceeds depends not only on the temperature the specimen is at, but also the time it has spent at that temperature.
Typically kinetic analysis is concerned with obtaining parameters such as activation energy (Ea), reaction order (k), etc. and/or with generating predictive curves.

TGA Kinetics
1st Order Kinetics based on Flynn and Wall methodLifetime Estimation based on Toops and Toops methodPTFE tested at 1, 5, 10 and 20 deg/minSample sizes constantNitrogen purgeConversion levels selected at 1, 2.5, 5, 10 and 20%
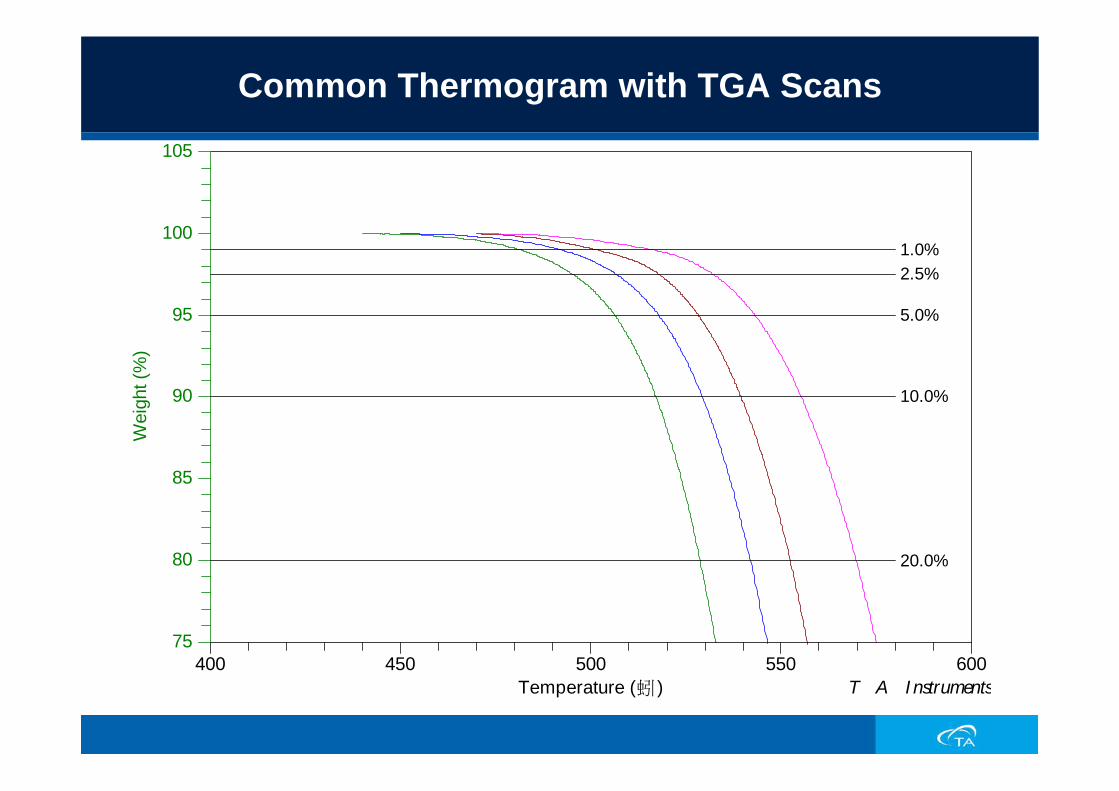
Common Thermogram with TGA Scans
75
80
85
90
95
100
105 W
eigh
t (%
)
400 450 500 550 600 Temperature (蚓 ) T A I nstruments
1.0%2.5%
5.0%
10.0%
20.0%
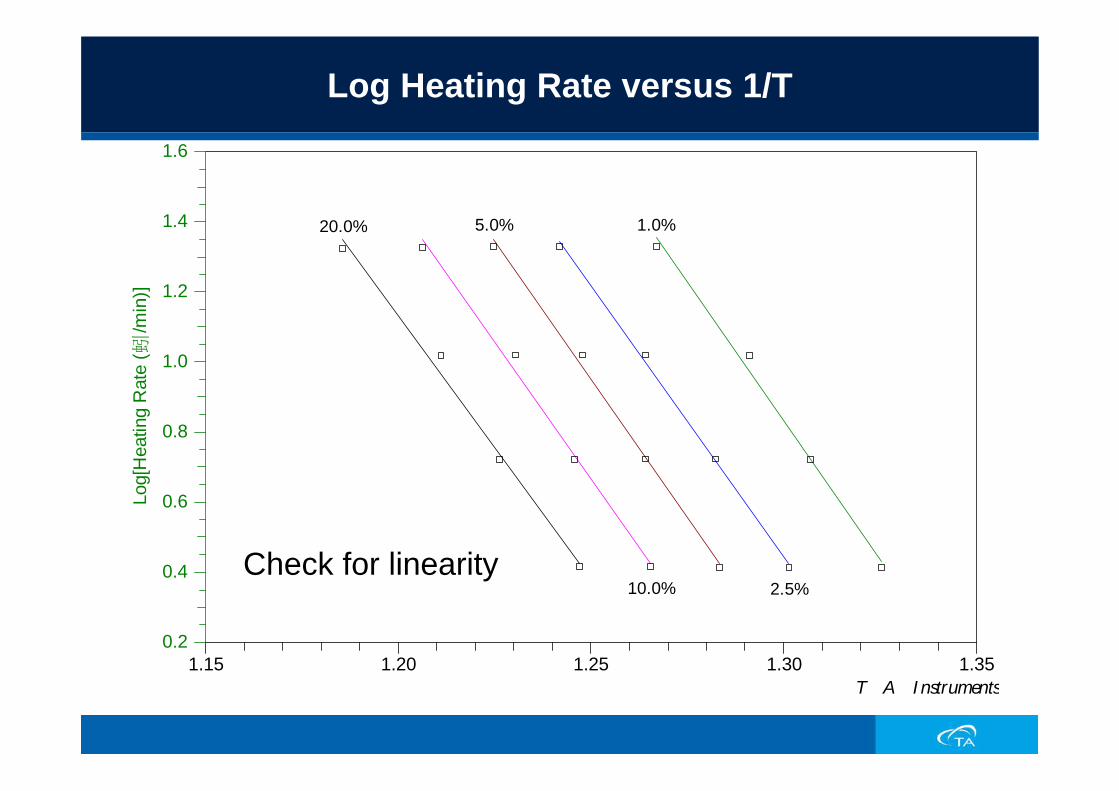
Log Heating Rate versus 1/T
0.2
0.4
0.6
0.8
1.0
1.2
1.4
1.6 Lo
g[H
eatin
g R
ate
(蚓/m
in)]
1.15 1.20 1.25 1.30 1.35 T A I nstruments
1.0%
2.5%
5.0%
10.0%
20.0%
Check for linearity
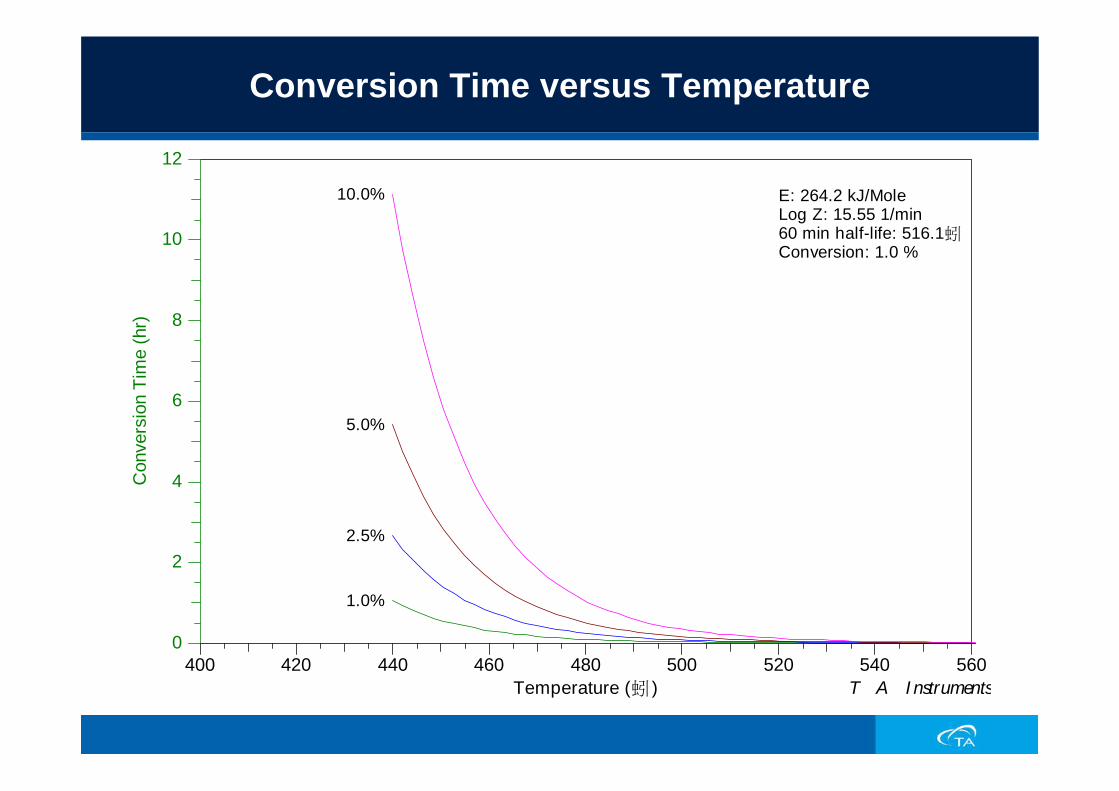
Conversion Time versus Temperature
0
2
4
6
8
10
12 C
onve
rsio
n Ti
me
(hr)
400 420 440 460 480 500 520 540 560 Temperature (蚓 ) T A I nstruments
1.0%
2.5%
5.0%
10.0% E: 264.2 kJ/MoleLog Z: 15.55 1/min60 min half-life: 516.1蚓Conversion: 1.0 %

Percent Conversion versus Time
0
20
40
60
80
100
120 Pe
rcen
t Con
vers
ion
(%)
-0.0 0.5 1.0 1.5 2.0 Time (day) T A I nstruments
450.00蚓
460.00蚓
470.00蚓
480.00蚓
490.00蚓
E: 264.2 kJ/MoleLog Z: 15.55 1/min60 min half-life: 516.1蚓Conversion: 1.0 %

Lifetime Plot
Can be adjusted to known value
0.1
1.
10.
100.
1000.
10000.
1E5
1E6
1E7 Li
fetim
e (h
r)
1.3 1.4 1.5 1.6 1.7 1.8 1.9 (1000/K) T A I nstruments
E: 264.2 kJ/MoleLog Z: 15.55 1/min60 min half-life: 516.1蚓Conversion: 1.0 %
275.325.375.425.475.
Temperature (蚓 )
hour
day
week
month
year
decade
century
Heat Capacity

DSC Heat Flow
t)(T,dtdT Cp
dtdH f+=
signal flowheat DSC dtdH
= Weight SampleHeat x Specific Sample CapacityHeat Sample Cp
==
Rate Heating dtdT
=(kinetic) re temperatuabsolutean at
timeoffunction is that flowHeat t)(T, =f

What is Heat Capacity (Cp)?
Heat capacity is the amount of heat required to raise or lower the temperature of a materialCp is the absolute value of heat flow divided by heating rate (times a calibration factor)Most DSC’s do not measure absolute heat flow or heat capacityBaseline subtraction is required on most DSC’s when measuring CpQ1000/Q2000 can measure Cp without baseline subtraction

Heat Flow Due to Heat Capacity
10.04 mg PMMA
Why is Heat Capacity Important?
Thermodynamic property of material (heat flow isn’t)Heat capacity is a measure of molecular motion. Heat capacity increases as molecular motion increases.
Vibration – occurs below and above Tg Rotation – polymer backbone and sidechains (in and above Tg)Translation – entire polymer molecule (above Tg)
Provides useful information about physical properties of the material as a function of temperature

Measuring Heat Capacity
ASTM Method E1269Requires 3 runs
Run Empty pans for baselineRun calibrate (typically sapphire)Run sample
Typical MethodIso for 10 minHeat @ 10°C/minIso for 10 min
Generally considered to be accurate & repeatable to within 5%

Conventional DSC Cp Measurement
x wtRateHeat HF? HFK x Cp MTS
=
HF
endo
0HFMT
HFS
Temp.
Where:K = Calibration constantHFS = Differential heat flow
with sampleHFMT = Differential heat flow
with empty panswt = weight of sample

Conventional Heat Capacity of PET
Baseline
Sample
Calibration
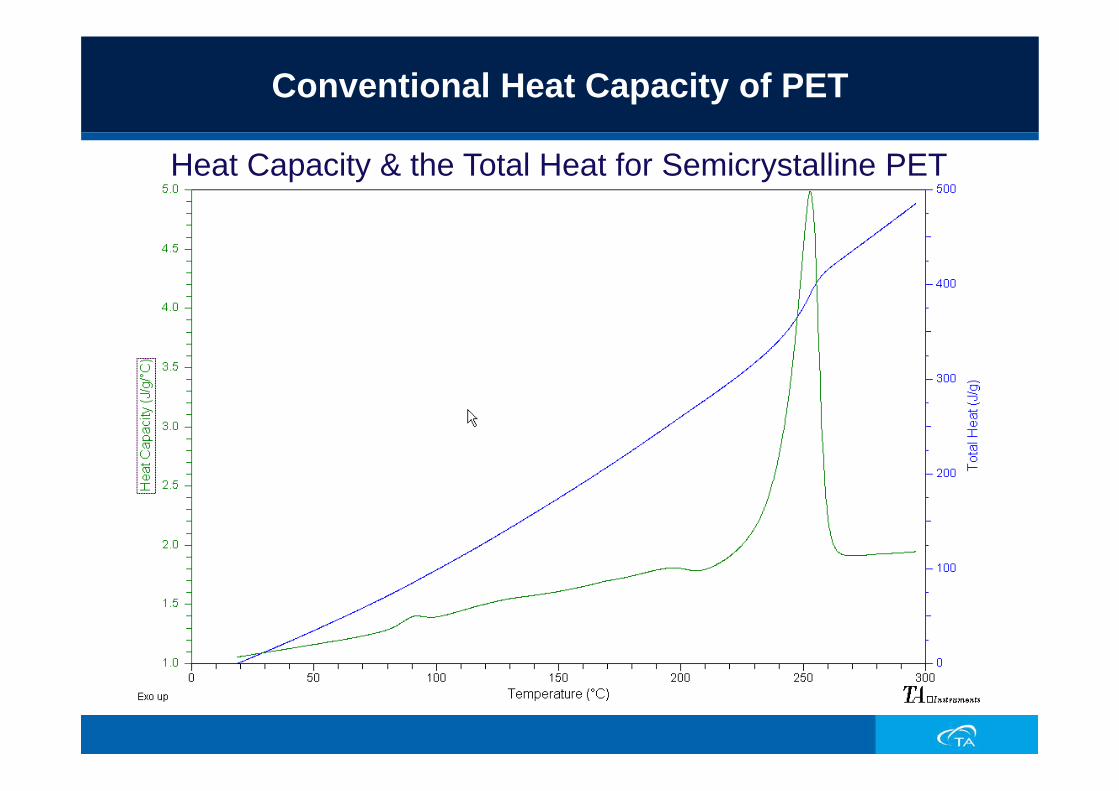
Conventional Heat Capacity of PET
Heat Capacity & the Total Heat for Semicrystalline PET

Direct Cp Measurement –Q2000/Q1000
DSC’s with advanced Tzero™ technology measure absolute heat flow:Baseline is flatAbsolute zero heat flow value established as
part of methodBy knowing absolute values of the heat flow and heating rate, heat capacity is calculated in real time and stored in data fileAccuracy and precision is generally ± 2% with just single run measurements
Direct Cp Measurement
Typical MethodHeat @10°C/min
Sample Size ~10mg
Lowest mass pans possible
Generally considered to be accurate & repeatable to within 2-3%
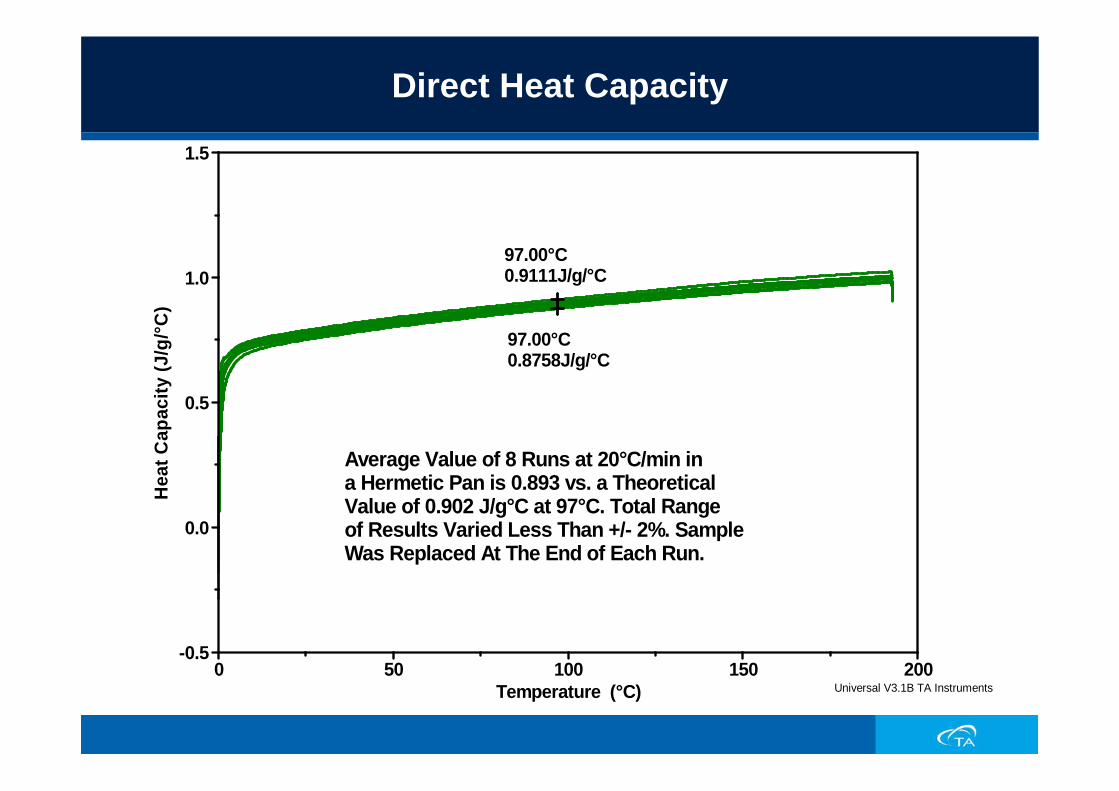
Direct Heat Capacity
Average Value of 8 Runs at 20°C/min in a Hermetic Pan is 0.893 vs. a TheoreticalValue of 0.902 J/g°C at 97°C. Total Rangeof Results Varied Less Than +/- 2%. SampleWas Replaced At The End of Each Run.
97.00°C0.9111J/g/°C
97.00°C0.8758J/g/°C
-0.5
0.0
0.5
1.0
1.5H
eat C
apac
ity (J
/g/°C
)
0 50 100 150 200Temperature (°C) Universal V3.1B TA Instruments
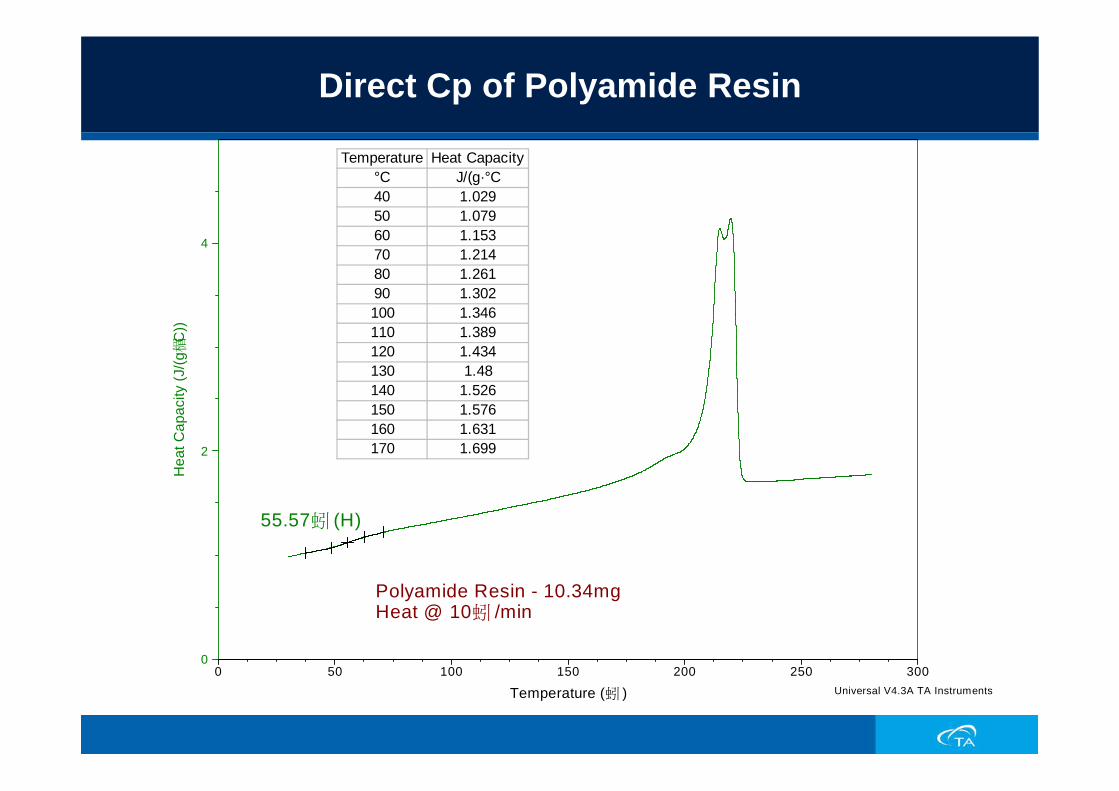
Direct Cp of Polyamide Resin
55.57蚓 (H)
Polyamide Resin - 10.34mgHeat @ 10蚓 /min
0
2
4
Hea
t Cap
acity
(J/(g
楣C
))
0 50 100 150 200 250 300
Temperature (蚓 ) Universal V4.3A TA Instruments
Temperature Heat Capacity°C J/(g·°C40 1.02950 1.07960 1.15370 1.21480 1.26190 1.302100 1.346110 1.389120 1.434130 1.48140 1.526150 1.576160 1.631170 1.699
Cp by MDSC
Cp can be measured directly in a single runIn MDSC, while you can look at 3 Cp signals, the Reversing Heat Capacity (Rev Cp) is the quantitative CpLong periods will give more accurate measurementsThe Rev Cp constant should be calculated at the same period of the testsGenerally considered to be accurate & repeatable to within 1-2% (or better)
MDSC Conditions for Heat Capacity
Heating Rate; isothermal up to 5ºC/min
Modulation Period120 seconds
Modulation Amplitude; 0.5ºC to 1.0°C
Sample Size; 10-15mg

Epoxy Potting Compound - 42.53mgMDSC 0.8/120@3蚓 /min
0.44
0.46
0.48
0.50
0.52
0.54
0.56
Rev
Cp
(J/(g
楣C
))
0 20 40 60 80 100 120
Temperature (蚓 ) Universal V4.3A TA Instruments
Heat Capacity by MDSC
Temperature Rev Cp°C J/(g·°C10 0.457420 0.468630 0.478740 0.488850 0.499560 0.509870 0.51980 0.527690 0.5358100 0.543110 0.5492
What Affects Heat Capacity?
Anything that effects the mobility of the molecules, affects the Heat Capacity
Amorphous contentAgingSide chainsPolymer backbone Copolymer composition
Effect of Amorphous Content on Cp
Amorphous Cp is greater than Crystalline Cp
Amorphous Content increases Specific Heat Capacity
Crystalline polymers contain more order and thus fewer degrees of molecular motion. Less molecular motion results in lower specific heat capacity.


