CHARACTERIZING AND MODELING PENETRATION OF CERAMIC ARMOR Final Report Donald A. Shockey, Associate Director Donald R. Curran, Scientific Director Richard W. Klopp, Research Engineer III Lynn Seaman, Senior Research Engineer Christine H. Kanazawa, Materials Scientist Joseph T. McGinn, Visiting Scientist Poulter Laboratory February 1995 U.S. ARMY RESEARCH OFFICE Contract Number DAAL03-92-K-0004 SRI International 333 Ravenswood Avenue Menlo Park, CA 94025-3493 APPROVED FOR PUBLIC RELEASE; DISTRIBUTION UNLIMITED. 19950327 186 H ^m&^^ !mmym)l
Transcript
CHARACTERIZING AND MODELING PENETRATION OF CERAMIC ARMOR
Final Report
Donald A. Shockey, Associate Director Donald R. Curran, Scientific Director
Richard W. Klopp, Research Engineer III Lynn Seaman, Senior Research Engineer Christine H. Kanazawa, Materials Scientist
Joseph T. McGinn, Visiting Scientist Poulter Laboratory
February 1995
U.S. ARMY RESEARCH OFFICE
Contract Number DAAL03-92-K-0004
SRI International 333 Ravenswood Avenue
Menlo Park, CA 94025-3493
APPROVED FOR PUBLIC RELEASE; DISTRIBUTION UNLIMITED.
19950327 186 H ̂ m&^^!mmym)l
1
THE VIEW, OPINIONS, AND/OR FINDINGS CONTAINED IN THIS REPORT ARE THOSE OF THE AUTHOR(S) AND SHOULD NOT BE CONSTRUED AS AN OFFICIAL DEPARTMENT OF THE ARMY POSITION, POLICY, OR DECISION, UNLESS SO DESIGNATED BY OTHER DOCUMENTATION.
REPORT DOCUMENTATION PAGE Form Approved OMB No. 0704-0188
Public reporting burden of this collection of information is estimated to average 1 hour per response, including the time for reviewing instructions, searching existing data sources, gathering and maintaining the data needed, and completing and reviewing the collection of information. Send comments regarding this burden estimate of any other aspect of this collection of information, including suggestions for reducing this burden, to Washington Headquarters Services, Directorated for Information Operations and Reports, 1215 Jefferson Davis Highway, Suite 1204, Arlington, VA 22202-4302, and to the Office of Management and Budget, Paperwork Reduction Project (0704-0188), Washington, DC 20503.
1. AGENCY USE ONLY (Leave Blank) 2. REPORT DATE
February 1995 3. REPORT TYPE AND DATES COVERED
Final Report - 920617 - 950216
4. TITLE AND SUBTITLE
Characterizing and Modeling Penetration of Ceramic Armor
5. FUNDING NUMBERS
6. AUTHOR(S)
Donald A. Shockey, Donald R. Curran, Richard W. Klopp, Lynn Seaman, Christine H. Kanazawa, and Joseph T. McGinn
7. PERFORMING ORGANIZATION NAME(S) AND ADDRESS(ES)
SRI International 333 Ravenswood Avenue Menlo Park, CA 94025-3493
8. PERFORMING ORGANIZATION REPORT NUMBER
PYU-3673
9. SPONSORING / MONITORING AGENCY NAME(S) AND ADDRESS(ES)
U.S. Army Research Office P.O. Box 12211 Research Triangle Park, NC 27709-2211
10. SPONSORING / MONITORING AGENCY REPORT NUMBER
11. SUPPLEMENTARY NOTES
The view, opinions, and/or findings contained in this report are those of the author(s) and should not be construed as an official Department of the Army position, policy, or decision, unless so designated by other documentation.
12a. DISTRIBUTION / AVAILABILITY STATEMENT
Approved for public release; distribution unlimited.
12b. DISTRIBUTION CODE
13. ABSTRACT (Maximum 200 words)
To assist in the design of ceramic armor, a micromechanical model of the penetration of a long tungsten alloy rod was developed. An understanding of ceramic comminution and fragment flow at the tip of the advancing penetrator was obtained by examining in detail the damage in ballistically tested ceramic targets and measuring the high-strain- rate behavior of ceramics in pressure-shear impact experiments and dynamic spherical cavity expansion experiments. A mathematical description of the results was constructed from the observations and measurements. The model was tested by implementing it into the DYNA code and performing computational simulations of ballistic tests.
14. SUBJECT TERMS „ .. Cavrty expansion Mescall zone
Ceramic armor Ballistic damage Long rod penetration Micromechanical model Divergent flow
A Granulated Material Model for Quasibrittle Solids A Spherical Cavity Expansion Experiment for Characterizing Penetration
Resistance of Armor Ceramics Deformation and Comminution of Shock Loaded Alpha-Al203 in the
Mescall Zone of Ceramic Armor Fragmentation of Ceramic Materials Under Shock Wave Loading
LIST OF PARTICIPATING PERSONNEL.
FUTURE WORK.
v
vii
1
3 3 3 7
9
11
25
45 51
83
85
APPENDICES:
A Damage Evaluation of Ballistically Tested Ceramic Targets B Pressure/Shear Experiments
A-l B-l
Accesion For
NTIS CRA&I DTIC TAB Unannounced Justification
D
By _ Distribution/
Availability Codes
Dist
m Avail and/or
Special
in
IV
ILLUSTRATIONS
Figure Page
1 Projectile penetrating a block of ceramic armor showing cracking pattern and comminution zone 4
2 Cross section near Mescall zone of a ballistically tested AD-90 alumina target 5
3 Spherical cavity expansion experiment 6
4 Deformation and fracture damage in a confined ceramic armor element as computed by the SRI comminution/granular flow model 8
A-l Polished cross section through the shotline of a confined B4C target A-4
A-2 Micrographs of a cross section in a partially penetrated sample of A1N, 1 cm below the impacted surface A-5
A-3 Micrographs of a cross section in a partially penetrated sample of AD-90, 1 cm below the impacted surface and 1 mm away from the penetrator A-6
A-4 Damage in the titanium diboride target A-8
A-5 Detail of damage as a function of lateral distance from penetration terminus in a TiB2 specimen A-9
A-6 Cumulative fragment length distributions at various distances from the shotline for a ballistically tested T1B2 target A-10
A-7 Cumulative fragment width distributions at various distances from the shotline for a ballistically tested TiB2 target A-ll
A-8 Cumulative fragment length distributions at various distances from the shotline for a ballistically tested B4C target A-13
A-9 Cumulative fragment width distributions at various distances from the shotline for a ballistically tested B4C target A-14
A-10 Cumulative fragment length distributions at various distances from the shotline for a ballistically tested A1N target A-15
A-l 1 Cumulative fragment width distributions at various distances from the shotline for a ballistically tested A1N target A-16
A-12 Cumulative fragment length distributions at various distances from the shotline for a ballistically tested AD90 target A-17
A-13 Cumulative fragment width distributions at various distances from the shotline for a ballistically tested AD90 target A-18
A-14 Number density parameter, A, as a function of distance from the shotline for ballistically tested A1N, AD90, B4C, and TiB2 targets A-19
A-15 Fragment length parameter, B -1, as a function of distance from the shotline for ballistically tested A1N, AD90, B4C, and TiB2 targets A-20
A-16 Average fragment length as a function of distance from the shotline for ballistically tested A1N, AD90, B4C, and TiB2 targets A-21
A-17 Fragment aspect ratio as a function of distance from the shotline for ballistically tested A1N, AD90, B4C, and T1B2 targets, with exponential least squares fits to the data A-22
B-l The symmetric pressure/shear experiment B-2
B-2 Pressure/shear experiment to detect slip B-4
B-3 Measured (solid) and predicted (dashed) particle velocity histories B-6
VI
ACKNOWLEDGMENTS
The authors are grateful to Dr. Kailasam Iyer and Dr. Andrew Crowson of the Army
Research Office for their support and encouragement throughout this project. Helpful
discussions were held with Dr. S. R. Skaggs, formerly of Los Alamos National Laboratory,
Dr. A. M. Rajendran and Mr. Patrick Woolsey of the Army Research Laboratory, and Dr. Dennis
Grady at Sandia National Laboratories.
Valuable contributions were made by the following people at SRI: A. L. Florence,
T. Cooper, D. F. Walter, J. J. Regnere, T. Ehinger, T. S. Lovelace, D. C. Erlich, G. R. Greenfield,
N. J. Berryman, M. A. Merritt, C. Holland, E. Turner, and S. Chhokkar. Valuable contributions
were also made by Visiting International Fellow Thibaut de Resseguier from Poitiers University,
Poitiers, France, and Marc Lichtenberger, co-op student from the University of Metz, Metz,
France. We are grateful to SRI International for granting support to one of us (J. T. McGinn) as
Visiting Scientist on leave from David Sarnoff Research Center.
vn
INTRODUCTION
Advanced ceramic armor holds great promise for defeating long rod penetrators. The
armor must be designed to exploit favorable characteristics of the ceramic that contribute to
penetration resistance. Gaps in our understanding of the physics of the penetration process have
hindered efforts to optimize both penetrator and ceramic armor designs. Under Army Research
Office sponsorship, significant progress has been made by researchers in improving our
understanding of the penetration process, thereby bringing the community much closer to
improved design guidelines.
In the effort described here, careful experiments and observations produced a significant
insight, namely, that the ultimate factor governing resistance to long rod penetration is the
comminution of ceramic material and the subsequent flow of the resulting fragments in the
Mescall zone around the nose of the eroding penetrator. That is, even after careful attention has
been given to removing ceramic porosity and emplacing the ceramic in a "confinement" package,
the penetrator can still advance into the ceramic, but not without pushing pulverized ceramic
material out of the way.
Thus, it is the resistance to pulverization and the flow properties of the pulverized
material that ultimately govern penetration resistance. This resistance is strongly affected by
tradeoffs between the tendency of the particles to ride over each other, thereby causing
"bulking," and the tendency for the particles to break and further comminute, thereby causing
compaction. Furthermore, the friction between particles is obviously important. The average
size of the particles is important, because both computer modeling and intuition show that
smaller particles offer less resistance to flow. Thus, understanding the pulverization and flow
processes are key to understanding how to improve ceramic armor or penetrator performance.
The goal of the three-year effort reported here was to understand and mathematically
describe ceramic comminution and fragment flow to develop a computational model of the
penetration process that can serve as a guide in ceramic armor design. Our approach was to (1)
examine in detail the damage in ballistically tested ceramic targets, (2) measure the high-strain-
rate comminution and granular flow behavior of ceramics, and (3) construct models for ceramic
comminution and granular flow from our observations and measurements.
This report documents the procedures and findings of our effort. A summary of our
accomplishments is provided in the next section followed by four journal articles that describe in
detail the laboratory experiments, the examination by transmission electron microscopy of
comminuted material, and the computational models for ceramic comminution and granular
flow. The appendices contain descriptions of damage observations in recovered targets and
pressure shear experiments.
ACCOMPLISHMENTS
PENETRATION PHENOMENOLOGY
We improved our understanding of the penetration of ceramic armor by examining targets
recovered from ballistic tests using optical, scanning electron, and transmission electron
microscopes. We established that penetration resistance is governed by comminution and
granular flow of a small volume of ceramic immediately in advance of the tip of the penetrator
(the Mescall zone), as shown in Figure 1. Our examinations revealed a steep gradient in
fragment size at the Mescall zone boundary and showed that fragment size does not
monotonically increase with distance from the penetrator. Instead, there are islands of large
fragments embedded within a matrix of fine fragments (Figure 2). Apparently, the finer
fragments are eroded from the edges of the bigger fragments as deformation proceeds, rather
than the larger fragments breaking into more-or-less uniform-sized pieces. Details of our
examinations are reported in Appendix A.
LABORATORY EXPERIMENTS
Additional information on microfailure physics in the Mescall zone is needed for model
development, but is difficult to obtain from ballistic tests. Therefore, we performed pressure-
shear plate impact tests (Appendix B) and we designed and demonstrated a new laboratory test
that facilitates recovery of Mescall zone material and allows the failed material to be observed in
detail and quantified. The new experiment (Figure 3) uses a spherical explosive charge to
generate, in a heavily confined ceramic specimen, the stress and strain rate conditions produced
by a long rod penetrator and allows these conditions to be measured (with electromagnetic
particle velocity gages) and the Mescall zone to be recovered in place. Details are given in the
journal article provided in the List of Publications section.
MICROSTRUCTURAL DAMAGE ASSESSMENT
Microstructural damage in the ceramic (microcracking, twinning, dislocation bands, void
collapse, and the like) was observed and quantified by means of optical, scanning electron, and
transmission electron microscopy as a function of distance from the explosive charge, and hence
Long Rod Penetrator
Ejected Mescall Zone Material
Block of Armor Ceramic
CAM-3673-41
Figure 1. Projectile penetrating a block of ceramic armor showing cracking pattern and comminution zone.
. **»;vi
■Hal»* ■EH irr- j
Gj:.. | 6r t |
t I ir
■it-:-.-:
Biiill
•*.i
f k i
• ■ • • V ■ * I [-'He :" ■ i"
I . •'_/_.•_.__ ..: • I.:- * J
130 (im
CP-3673-23
Figure 2. Cross section near Mescall zone of a ballistically tested AD90 alumina target.
m
a. Ü
■o "5 > ■a c as CO c
u n u o
c <u E u. 0 Q. X Q) c o
'to c co a. x a> >>
'i o
"tö y
a> .c a.
CO
co CD
load history. The damage results were correlated with measured and computed stress histories
and used to further develop penetration models. The procedures and results are reported in the
technical paper provided in the List of Publications section.
COMMINUTION AND GRANULAR FLOW MODELING
We developed models for comminution and granular flow, based on observations in and
around the Mescall zone in penetration and spherical charge experiments. These models are
described more fully in the two journal articles reproduced in the List of Publications section.
We used these models to simulate ballistic tests in which we examined the relative importance of
various properties of the pulverized material. Figure 4 shows the result of one such calculation.
Although the combined models predict the qualitative features of penetration, the
quantitative features (such as fragment size distribution) are not reliably predicted. Furthermore,
the models do not contain a description of fragment formation in which smaller fragments are
eroded from the edges of larger fragments. Thus, the models require considerably more
development to be useful to armor materials designers. The program of research on which we
are embarking to address current model shortcomings is described in the Future Work section.
N
7.5
2.5
5
0
-2.5
-5
-7.5
-10
■12.5 H
15
Tungsten Rod
Steel Cover Plate
-7.5 -5 -2.5 0 2.5 5 7.5 R(cm)
RM-6795-22
2.5
0
-2.5
? "5
N -7.5 ]
-10
-12.5-
-15-
Geometry of ceramic armor package used in parametric penetration calculations.
-7.5 -5 -2.5 0 2.5 5 7.5 R(cm)
RM-6795-24
Overall deformation produced by impact at 1.6 km/s.
m'" Fuiiy JäÄ fp.;> Fragmented •%&■'?£ ;.;/yVv Zone J'$i||
Fractured vf^vÄMaterial
^••.Intact Material
-3 -4-5 0 1 R(cm)
RNI-6795-25B
Fractured and comminuted regions produced by impact at 1.6 km/s.
Figure 4. Deformation and fracture damage in a confined ceramic armor element as computed by the SRI comminution/granular flow model.
LIST OF PUBLICATIONS
"A Granulated Material Model for Quasibrittle Solids," by D. R. Curran, L. Seaman, R. W. Klopp, T. de Resseguier, and C. Kanazawa, in Fracture and Damage in Quasibrittle Structures, Z. P. Bazant, Z. Bittnar, M. Jiräsek, and J. Mazars, Eds. (London, E. & F. N. Spon, 1994), pp. 245-257.
"A Spherical Cavity Expansion Experiment for Characterizing Penetration Resistance of Armor Ceramics," by R. W. Klopp, D. A. Shockey, L. Seaman, D. R. Curran, J. T. McGinn, and T. de Resseguier, in Mechanical Testing of Ceramics and Ceramic Composites, AMD-Vol. 197 (New York, ASME, 1994).
"Deformation and Comminution of Shock Loaded (X-AI2O3 in the Mescall Zone of Ceramic Armor," by J. T. McGinn, R. W. Klopp, and D. A. Shockey, Proceedings of the Fall Meeting of the Materials Research Society, Symposium on Grain Size and Mechanical Properties—Fundamentals and Applications, N. J. Grant, R. W. Armstrong, M. A. Otooni, T. N. Baker, and K. Ishizaki, Eds. (Pittsburgh, Materials Research Society, 1995).
"Fragmentation of Ceramic Materials Under Shock Wave Loading," by T. de Resseguier, R. W. Klopp, L. Seaman, C. Kanazawa, and D. R. Curran, submitted for publication in the International Journal of Impact Engineering, October 28, 1994.
Copies of these articles follow.
10
21 A GRANULATED MATERIAL MODEL FOR QUASIBRITTLE SOLIDS
D.R. CURRAN, L. SEAMAN, R.W. KLOPP, T. DE RESSEGUIER and C. KANAZAWA SRI International, Menlo Park, California, USA
Abstract
Penetrating weapons or explosive charges in quasibrittle materials such as ce- ramics or concrete can cause crushing and subsequent large shear deformation and flow of granulated material under confining pressures that range from many GPa to zero. Under these conditions the material can exhibit both dilatancy and compaction. Furthermore, the grains can undergo comminution with a resultant reduction in average granule size.
This paper presents a mesomechanical model of these processes that is based on an analogy with atomic dislocation theory. That is, the model focuses on a description of the flux of lines of holes (dislocations) across the boundaries of a control volume, and on the nucleation of new dislocations inside the control volume by comminution of granules. Outward flux causes compaction whereas inward flux causes dilatancy. The control volume introduces a scale size into the constitutive relations: its size must be large enough to contain many granules.
The model is cast in the form of a multiplane plasticity model in which granule sliding on interfaces is restricted to a finite number of surfaces with specified initial orientations. The resulting constitutive relations are rate-dependent, and it is shown that when they are combined with the equations of conservation of mass and momentum, the system has solutions that are unique and stable.
Comparisons are reported of model correlations with data from instrumented experiments in which explosive charges were detonated inside ceramic specimens. In the experiments, magnetic gauges measured particle velocity histories at sev- eral distances from the charge. Post test measurements were made of the degree and extent of comminution. Preliminary comparisons of these data with the mod- el calculations are encouraging. Keywords: Fracture, fragmentation, granulated bed, penetration, constitutive relations.
nu mre and DamaSe 'n Quasibrittle Structures. Edited by Z P Bazant, Z Bittnar, M Jiräsek and Mazars. a 1994 E&FN Spon, 2-6 Boundary Row, London SEI 8HN. ISBN 0 419 192S0 8.
11
246 Curran, Seaman, Klopp, De Resseguier and Kanazawa
1 Introduction
In a prior paper [1], hereafter referred to as I, we presented a granulated material model for use in finite element «hydrocodes" applied to penetration of ceramic armors The model is named FRAGBED, and includes a micromechanical de- scription of shear flow and associated dilatancy. It is a non-local, mu tiplane plasticity model (see, for example, Batdorf and Budianski [2], Curran et al [3], Bazant et al [4,5]). FRAGBED proved to be useful in computational simula- tions and associated interpretations of penetration experiments in which ceramic
armors were attacked by long rod penetrators [1]. However a drawback to FRAGBED is that whereas the shear flow and associ-
ated dilatancy is treated from a micromechanical viewpoint, the pore compaction is handled from a continuum viewpoint. In fact, as discussed in the present pa- per both dilatancy and pore compaction can be considered to arise from the same micromechanical processes. Furthermore, the important process of granule
comminution was not treated in FRAGBED. The goal of the present paper is thus to expand the FRAGBED model to be
a complete micromodel for the fracture, fragmentation, comminution shear flow, dilatancy, and pore compaction processes in ceramic. We w,ll hereafter callUh.s expanded model FRAGBED2, and the original model will be called FRAGBLD1.
2 Approach
As described in I, the FRAGBED approach to modeling the flow of granulated material is to focus not on the granules themselves, but rather on the holes between the granules. A schematic view of this picture is shown in Figure 1,
taken from I.
ZZ^Z4
Internal Dislocation
Dislocation Paths
Figure 1: Dislocation model of granular flow
By analogy to atomic dislocation theory, a hole large enough to allow sliding of a granule into it is called a "vacancy", and strings of such holes are called "dislocations". Just as for the atomic case, the dislocations can be mob.le
12
A granulated material model 247
"pinned", will have edge and screw components, and can glide or climb. The dislocations can become "pinned" when obstacles stop their motion, and can later become "unpinned" by granule rearrangement. As discussed in I, this analogy is useful because it allows us to easily relate non-elastic slip in the granular bed to macroscopic "plastic" strain rate. Furthermore, by casting the model in the framework of multiplane plasticity theory, the analogy between granular flow and slip in single crystals is direct, and many of the techniques and results of the community engaged in modeling crystalline plasticity can be applied.
In the remainder of the present paper, we will thus use terms commonly associated with atomic dislocation theory to refer to granular flow processes.
The analogy does not extend automatically to describing the process of granule "ride-up" and associated dilatancy, but we will show that dilatancy in a granular bed is a natural consequence of dislocation climb and associated pinning.
Before the dislocation analogy-can be applied, the material must first be converted from an intact material to a fragmented bed. FRAGBED1 currently uses a very simple damage evolution algorithm that is based on a combination of tensile and shear strains. When the damage function attains a critical value, the material cohesion and tensile strength reach zero, and the material element is declared "fragmented". Thereafter the fragmented bed model is used, with the average fragment size and dislocation densitiy specified as input constants.
In FRAGBED2 we will introduce three changes. First, we replace the old fracture and fragmentation algorithm with BFRACT,
a micromechanical model that describes the nucleation, growth, and coalescence of microcracks to form a fragment size distribution [3]. When a cell is fragmented, the algorithm will switch to the comminuted material portion of FRAGBED2. Since BFRACT calculates the cumulative crack opening strain, it will also calcu- late the initial porosity in the fragmented bed. BFRACT will thus produce the needed initial conditions in the fragmented bed.
The second change is to introduce evolution equations for the average fragment size and the dislocation density.
The third change is to introduce a micromechanical model for pore com- paction. This model will replace the continuum model currently used in FRAG- BED1. In fact, as discussed below, the dilatancy and pore compaction can be considered to be both a consequence of dislocation flux across the boundary of a material element; dilatancy is caused by dislocations flowing into the element whereas compaction is caused by dislocations flowing out of the element.
In the remainder of this paper we describe these changes in detail.
3 Description of FRAGBED2
3.1 Fracture and fragmentation process
As mentioned above, the BFRACT model described by some of the present au- thors [3] will be used to produce the initial fragmented bed in subsequent finite element calculations of penetration. In the remainder of this paper, we concen- trate on modeling the subsequent comminution and flow of this bed.
13
248 Curran, Seaman, Klopp, De Resseguier and Kanazawa
3.2 Comminution process
We return to the simplified picture of the fragmented bed discussed in I, as shown in Figure 2. We assume that crack interaction has produced an initial size distribution of fragments, idealized here as equisized square blocks. We will discuss later how we account for a distribution of block sizes.
Potential Fracture
Figure 2: Idealized picture of fragment comminution
We assume that the intersecting tensile cracks that produce the fragmented bed can open enough to form initially present dislocations which, combined with dislocation flux from nearby free boundaries, produce an initial non-zero dislo- cation density and associated initial porosity (see Figures 1 and 2). This is an important point. If there are no initial dislocations or free boundaries that can send dislocations into the material, then -no non-elastic shear flow of the frag- mented bed will be possible. Furthermore, initial porosity is required for the comminution and dislocation nucleation processes discussed next.
A key result of confinement is thus that dislocation flux across material ele- ment boundaries is decreased, thereby inhibiting non-elastic flow of the frag- mented bed. Perfect confinement would in fact prevent long rod penetration of a ceramic target because even though the fragmented bed could flow slightly into the initial porosity, it would ultimately have no place to go.
We next consider the further comminution of the initial fragment bed of Fig- ure 2. We assume that the comminution process mainly consists of blocks pushing on each other to produce local shear and tensile stresses that in turn cause the blocks to fracture.
Figure 2 shows that fracture of a single block to form the two blocks (C and D) causes the small holes above and to the right of C to become a single dislocation (a dislocation is a line of holes big enough to allow non-elastic block motion) because as block A moves it produces a hole twice as big to its left, thereby
14
A granulated material model 249
allowing the full-sized blocks to move. Of course, blocks D and E move to the left at the same ,me to to form a right-moving dislocation. Thus, the fracture of block C-D nucleates a pair of edge dislocations, and the dislocation nu S L rate is directly tied to the comminution rate. Note that the nucleation proems as such does not cause increased porosity (the hole area to volume ratio remS the same). A generalization of this process will be discussed later
Note that, as discussed above, initial porosity is required before comminution can occur.
3.3 Pore compaction process
The new dislocations in Figure 2 move up and left and down and right to the spec- imen (cell) boundary and result in the hole closures. Thus, the pore compaction process ma material element (cell) is due to comminution-induced nucleation of internal dislocations, or to "unpinning" of previously pinned dislocations, and their subsequent migration to the cell boundaries.
3.4 Evolution equations for non-elastic slip, porosity, dislocation density, and fragment size
Non-elastic slip
As discussed in I, the Orowon equation is used on each slip plane. That is on tne z-tn slip plane,
-fa = 9i-VdibiBiVdi = giNnBiVa ,^
where «j> is the non-elastic ("plastic") slip strain on the i-th plane, Ndi is the mobile dislocation density on that plane, B{ is the block (granule) size in the di- rection of slip, biBi is the size of the dislocation hole in the direction of slip (a sort of macro Burger's vector), „„• is the dislocation velocity, vbi is the corresponding block velocity, and 9i ,s a variable coefficient that depends on granule geometry A. detailed discussion is given in I.
To simplify the notation, the i subscript will be dropped in further equations
As in I, the total strain rate on a slip plane is the sum of the elastic and non-elastic rates:
dt 2Gdt+~dt (2)
where 7 is the total shear strain on a plane, r is the resolved macroscopic shear stress across the plane, and G is the shear modulus.
15
250 Curran, Seaman, Klopp, De Resseguier and Kanazawa
Porosity
We define the porosity <j> associated with each plane (<?!>,■) as the ratio of void volume to total volume. Thus, the value of porosity on each slip plane associated with Ni dislocations per unit area is
4> = NdbB2 (3)
where we have approximated the individual dislocation area as bB2. If bB is the "jog distance", then the dislocation in Figure 1 is seen to be somewhat larger than bB2. However, we will absorb such variations in the adjustible parameter 6.
The porosity can change only by hole migration across a material element boundary (dislocation flux). That is, as discussed in I, the non-local nature of FRAGBED arises from the choice of a control volume (material element) that contains many granules and associated dislocations. Applying the divergence theorem to the dislocation density for this control volume yields (on a single slip plane):
dNd _ dNin d(Ndvd) (4) dt dt dx
where the first term on the right refers to the nucleation rate of new dislocations, and the second term on the right refers to the net flux of dislocations across the surface of the material element. As seen in Figure 2, the nucleation process does not change the porosity. Thus, only the second term on the right of (4) is used to obtain the evolution relation for the porosity:
d®_ 2d{Ndvd)
m ~ ~bB ~lx~ (°) where x is in the direction of slip on the i-th plane.
Block motion
We also need an equation for the dislocation velocity, which is in turn related to the granule velocity (see Eq. (1)). As shown in I,
Vi_ = bVi = 2(7 -fi(Tn)
B B p,BC ( '
where \i is the coefficient of intergranular friction, an is the compressive normal stress across the interface between granules, p, is the solid density, and C is the transverse sound speed.
Dislocation "jog" parameter b
The parameter b is important because it helps determine the porosity through Eq. (5). Its value is determined physically by the granule geometries and config- urations. In the current form of FRAGBED2, however, the value of b is simply taken to be an adjustable constant with magnitude between zero and unity. (A value larger than unity would mean that the dislocation jog would be greater than the granule size.)
16
A granulated material model 251
Dislocation nucleation and comminution rate
As discussed above, and illustrated schematically in Figure 2 frart,,«. of ,
with a commonly observed Poisson granule size distribution: S
1 (7)
tWhaenreA(Ä) ItthC Drber °f granul6S Per unit vo1«™ with "radii" neater
Eq We now reinterpret the Ss in the previous equations as applying to the B in
8 J™hndUCh a diStribUti0n' Jt Can be Sh°wn P] that average granule volume is
8T53 (g)
^„(newJccZOz*), and g^jn _ ß(l - 6) dB B dt ß3 "äT (9)
!£rJ in ^Sl^r^65 '' bUt "~ *"*" «*»« —ns *£^££LX :educ:rinution rate'Le-the -at wh-b *■
Our model for the comminution rate is presented in detail elsewhere f91 and
aw why
osSeTmanZed here' ,We firSt aSSUme that Cach °™ule -tain a Lest
shols that "• a °Ten fraCti°n (ab°Ut 10%) of B- InsP-tion of Figur°e 2
«™est s ITTZ TaCr0SC°PiC -0mPreSSi0n Sh°Uld ProduCe ^ s^ and that h.fl . -f iSSUme m M aPProach similar to that of Costin f6l Si:5 ^ l0aded ^ locaI '-sue stresses proportional to the mSlm
* .Ä^^:zL-(Ircontrast'Costin related the iocai— activated flr;not°onorat: " ^ ^ * ^^^ the time re<>uired *» 'he » - simplffTat 1 7 Sa aCr°SS ^ granUlC' ""^ a "^ vdodty for™l* that .s mphficahon of an express.on due to Freund [7]. This simplified expression
(10)
17
252 Curran, Seaman, Klopp, De Resseguier and Kanazawa
where Kjc is the fracture toughness, a is the maximum macroscopic compressive stress, n characterizes the flaw size (size = nB), and A is an adjustable parameter related to the granule fracture geometry that is less than or equal to unity.
An interesting feature of Eq. (10) is that the comminution ceases at a given stress level when the granule size and the associated flaw size become so small that the flaw becomes inactive. Thus, there is a critical value of B (Berit) for each stress level, and comminution ceases during the stress history when B drops below Bern.
The evolution equation for the mobile dislocation density not only contains the comminution-generated increase in N4 expressed by Eqs. (9) and (10), but also must contain a term for the decrease in Nd as mobile dislocations are pinned. For example, examination of Figure 1 shows that as the dislocation in the figure climbs to the left it will emerge at the left of the element, but if the dislocation had been closer to the top of the element it would be blocked by the confinement at the top, and would remain trapped in the material element. In fact, the increase in the void volume (dilatancy) is caused by such pinned dislocations.
In the idealized material element of Figure 1, the only pinning mechanism is the rigid confinement at the top and bottom of the element. In actual granulated beds, other pinning mechanisms arising from granule interference can be expected, e.g. when a dislocation runs into a region where the "slip planes" have grossly different orientations. In the absence of a detailed model, we simply assume an average propagation distance, nB, between pinning sites, so the pinning rate is:
dt nB dt gnbB2 ( '
Granule rearrangement during the shear flow can conceivably also cause unpin- ning of previously pinned dislocations. Although it may become desirable in the future to describe pinning and unpinning separately, for now we lump both processes together in (11) to give a net effect.
Thus, the total mobile dislocation evolution equation is obtained by combining Eqs. (4) and (9) - (11):
NjVj d{Ndvd)
nB dx { "'
Eqs. (1) - (12) are used on each slip plane of the multiplane model. However, the pressure-volume portion of the equation of state requires knowledge of the volume porosity, not just the porosities calculated above for the individual slip planes. We somewhat arbitrarily choose the total porosity to be the sum of the <t>i-s:
4 Implementation of FRAGBED2
The numerical implementation of FRAGBED2 parallels that for FRAGBED1, as described in I. We briefly summarize the solution procedure next.
18
A granulated material model 253
On each slip plane of the multiplane model, Eqs. (1), (2), (5), (6) (10) and (12) are solved simultaneously for the seven unknowns 7p, Nd, B vb''vd r and *. (Eq (6) is really two equations.) In addition, the volumetric strain is' partitioned between elastic strain of the solid material and the porosity and the stress components are obtained in the usual way from the elastic strain tensor Finally, the conservation equations for mass and momentum are needed to solve for the particle velocities and strain rates.
In a Lagrangian finite element code with an explicit solution scheme at the beginnmg of a new time step the increment in total tensor strain is an input A first estimate of the increments in the stresses is obtained by assuming that the stram increment is elastic. The stresses so obtained are resolved on the slip planes of the multiplane model, and used in the above equation set to get a first estimate of the increments in the dependent variables. The first estimates of the increment in the non-elastic strains are used to update the increment in elastic strains and to correct the stress estimates (see Eq. (2), for example) This iteration procedure is followed until convergence occurs, typically in only a few cycles. The stresses are then used to generate the next increment in total strain via the equations for conservation of momentum.
5 Uniqueness and stability
Eqs. (1) and (6) combine to give a relation for the plastic strain rate on a slip plane that is a function of the shear stress on that plane, but not on higher derivatives of stress_It has been shown elsewhere that when one combines such an expression with Eq. (2) and the equations for conservation of mass and momentum the resulting equation set is unique and stable [8]. The underlying reasons are'that the equation set .s hyperbolic and properly posed, and the non-elastic flow is dissipative.
6 Comparison with experimental data
The only comparisons with experimental data yet obtained with FRAGBED2 are for the comminution algorithm (Eq. (10)). In work reported elsewhere [9] experiments were performed in which small explosive charges were detonated inside blocks of ceramic that were instrumented with magnetic particle velocity gauges, and the samples were recovered and examined micrographicallv to obtain the particle sizes of the comminuted material as a function of the distance from 'he charge.
Three grades of alumina (AD-85, AD-90 and AD-995) obtained from Coors technical Ceramics Corporation have been tested.
The dynamic cavity experiments were performed by detonating an explosive narge within a spherical cavity machined in a ceramic specimen confined in n impedance-matching bronze container (see Figure 3). The resulting loading
tne material (stress, strain, strain rate) is well-characterized, nominally one- »mensional, and it is analogous, to a certain extent, to the conditions occuring
19
254 Curran, Seaman, Klopp, De Resseguier and Kanazawa
Explosive
Ceramic
Aluminum-bronze
Velocity Gages
Figure 3: Schematic description of the experimental setup for the spherical cavity
expansion tests
near the tip of a rod projectile during a penetration event. Moreover, the test is well-instrumented, the particle velocity histories induced by the detonation have been measured at several radii from the charge, using electro-magnetic velocity gages. Post-test microscopic examination of the recovered samples has revealed an overall damage less severe than in typical penetration experiments, and has allowed a more detailed description of the fracture processes.
Figures 4 and 5 show the progression of the comminution from about 30 ^m fragments about 100 ^m from the cavity wall to about 3 pm granules at the
cavity wall. We have therefore applied the comminution model with an initial value B0 =
30 /im and the stress history computed near the interface with the explosive. The model parameter A was taken as 1. The characteristic parameters for AD-85 were taken as K,c = 4 MPa m1/2, which is consistent with the static value reported for this material, and T? = 0.08. The results of the calculation are presented in Figure 6, as a decrease of the average block size B versus time. The dotted line is the variation of ßcrl(, directly associated with the stress history, which shows a peak at about 0.6 /is. The block size B remains constant before B„it drops down to B0, then it decreases following B„it, until a minimum size is reached under the peak loading stress. This final size of 2.9 /zm is consistent with the measured
order of magnitude shown in Figure 5. Similar agreement with observations was attained for experiments with the
AD-995 material.
20
A granulated material model 255
40 (im
Figure 4: Scanning electron microscope (SEM) picture of a cross section in an explosively-loaded sample of AD-85 about 100 /im below the cavity wall
10^ Figure ö: SEM picture of AD-S5 sample 50 ^m away from the cavity wall
21
256 Curran, Seaman, Klopp, De Resseguier and Kanazawa
40 c T
i i I i i„ * ' 10 15
TIME (sec x10"7)
20
Figure 6: Model simulation of comminution of AD-85, near the interface with the explosive. The solid line shows the decrease of the fragment size; the dotted line is the variation of the critical block size.
7 Discussion
A defect of FRAGBED2 is that it does not allow pore compaction under pure triaxial compression; some shear flow is required. This defect will not be appar- ent in applications to ceramic armor penetration because in such cases there is always significant shear flow. However, as discussed above in connection with the comminution model, a possible way to improve the model is to use a variation of the approach of Costin [6] to allow macroscopic compressive stresses to produce local shear stresses and associated strains.
The overall usefulness of FRAGBED2 must await the results of parametric penetration calculations with finite element codes.
22
A granulated material model 257
Acknowledgements
This work was supported by the U. S. Army Research Office, Contract No. DAALO3-92-K-0004, under the supervision of K. Iyer. Thanks are due to Dr. Iyer
for his encouragement in this effort.
References
[1] Curran, D. R., Seaman, L., Cooper, T. and Shockey, D. A. (1993) Interna- tional Journal of Impact Engineering, 13, 53-83.
[2] Batdorf, S. B. and Budianski, B. (1949) A Mathematical Theory of Plasticity Based on the Concept of Slip, Tech. Note No. 1871 of the National Advisory
Committee for Aeronautics, Washington, D. C. [3] Curran, D. R., Seaman, L. and Shockey, D. A. (1987) Physics Reports, 147,
Nos. 5 & 6. [4] Bazant, Z. P. and Prat, P. C. (1988) Journal of Engineering Mechanics, ASCE,
114, No. 10. [5] Bazant, Z. P. and Murphy, W. P. (1991) in Constitutive Laws for Engineering
Materials, C. S. Desai, E. Krempl, G. Frantziskonis, and H. Saadatmanesh, eds., pp. 377-384. ASME Press, New York.
[6] Costin, L. S. (1985) Mechanics of Materials, 4, 149-160. [7] Freund, L. B. (1990) Dynamic Fracture Mechanics, Cambridge University
Press, Cambridge, England. [8] Curran, D. R. and Seaman, L. (1992) in Shock Compression of Condensed
Matter 1991, S. C. Schmidt, R. D. Dick, J. W. Forbes, and D. G. Tasker, eds., Elsevier Science Publishers B. V., 395-398.
[9] de Resseguier. T., Klopp, R. W., Kanazawa, C, Seaman, L. and Curran, D. R. (1994) Dynamic fragmentation of ceramic materials under shock wave
loading, in preparation.
23
24
AMD-Vol. 197, Mechanical Testing of Ceramics and Ceramic Composites
ASME 1994
A SPHERICAL CAVITY EXPANSION EXPERIMENT FOR CHARACTERIZING PENETRATION RESISTANCE
OF ARMOR CERAMICS
Richard W. Klopp, Donald A. Shockey, Lynn Seaman, Donald R. Curran, Joseph T. McGinn/ and Thibaut de Resseguier"
Poulter Laboratory SRI International
Menlo.Park, California
ABSTRACT A spherical cavity expansion experiment was designed and applied to two grades of alumina to
provide high rate failure data for developing ceramic armor penetration models. An explosive charge is detonated within a cavity machined in the ceramic, generating a triangular pulse that moves radially outward. The particle velocity at several radii out from the charge is measured, and the deformed and fractured ceramic is recovered lor posttest microscopy. From the particle velocity histories are derived displacement histories, circumferential strain histories, and reduced velocity potentials. From the recovered ceramic are obtained radial distributions of microfracture and other damage. A single experiment provides data and recovered ceramic from a wide range of well-characterized loading conditions. The experimental data are used to support development of models for ceramic comminution under penetration conditions.
INTRODUCTION Armors consisting of confined ceramic blocks or plates outperform their metallic counterparts when
attacked by long rod projectiles. This finding has motivated ceramic armor designers to seek structural configurations and microstructural conditions that improve performance still further. An important tool in this endeavor is a model of penetration that can be used to simulate the response of an armor design to long rod attack. By performing iterative simulations in which material, structural, and threat parameters are varied parametrically, armor designers can produce promising armor designs with a minimum of testing.
Several models exist for the penetration of targets by long rods. Each has particular strengths and weaknesses and hence is more or less suited to any given penetration situation. Most models can be classified into two broad categories. In one category are finite element and finite difference models in which the target is discretized and the modeling effort consists largely of obtaining the coiTect material response physics for the discrete elements. These models provide sufficient detail to be of
'Permanent address: David Saraoff Research Center, Princeton, New Jersey "Permanent address: ENSMA, L.E.D., Site du Futuroscope, France
41
25
use in design. In the other category lie models in which the penetration geometry and material response are simplified and treated analytically. The models in the second category generally provide results with much less effort but also with much less detail. A spherical cavity expansion model from this second category suggested our spherical cavity expansion experiment, and that experiment has in turn suggested improvements in a finite element model belonging to the first category.
The cavity expansion analytical model first proposed by Bishop et al. (1945) has been used with substantial success in modeling the penetration of thick targets. This model treats the region at the nose of an advancing penetrator as an expanding spherical cavity. In the model the work done by the penetrator when it is more than about five diameters deep within the target is the same as the work done to expand a spherical cavity about the penetrator tip starting from zero radius. Tate's famous penetration model (Täte, 1967), which successfully predicts penetration into ductile targets and erosion of penetrators. makes implicit use of the cavity expansion model. Other researchers have modified and applied the spherical cavity expansion model to other penetration situations. Hopkins (1960) and Luk et al. (1991) provide references to the early literature on penetration in metals, and Yew and Stirbis (1978) provide references to the literature on penetration in geologic materials. To our knowledge, Florence et al. (1992) are the only researchers to develop a cavity expansion analysis explicitly for ceramic materials. The Florence et al. (1992) model, in which spherical expansion occurs in a zone of comminuted ceramic surrounded by a zone of radially-cracked ceramic, successfully predicted penetration and erosion histories for alumina, boron carbide, and titanium diboride.
The success of the cavity expansion models suggests that a cavity expansion experiment might be useful for evaluating armor ceramics, and that it might also be useful for evaluating detailed finite element and finite difference models, particularly those that treat damage explicitly.
The fractographic observations of Shockey et al. (1990) provided physical evidence for a damage zone in ceramics and showed that, in a confined thick block of ceramic, penetration occurred by the comminution of material in that zone and the subsequent granular flow of the fragments out of the penetrator path and opposite the direction of attack. Shockey et al. (1990) also noted the difficulty of measuring stress or strain histories close to the tip of an advancing penetrator and recovering comminuted material for examination; however, this information is needed to confirm the reliability of the details provided by the finite element and finite difference models.
One way to overcome this difficulty is to perform experiments that do not involve ballistic impact, but correspond directly to the geometry and loading conditions. These experiments should provide dynamic time histories of a kinematic variable in a well-characterized geometry and also allow posttest examination of specimen material that has been subjected to a single well-characterized loading event. The work of Larson (1982) and Florence et al. (1984) in which buried explosive charges were detonated in rocks and rock simulants suggested an experiment for armor ceramics that would allow loading histories to be measured and fracture damage to be assessed, thereby providing the information needed to critically examine and quantify the models.
To obtain this information, we performed cavity expansion experiments on two armor ceramics. The following sections describe the test setup, the strain histories derived from particle velocity measurements and the resulting fracture damage. The results are then compared with the predictions of a physically based treatment of comminution (de Resseguier et al., 1994) intended for eventual use in a finite element model.
EXPERIMENTS Two ceramics were tested: Coors AD-85 and AD-995 (Coors Technical Ceramics Co.. Oak Ridge,
TN). AD-85 contains 85% alumina and 15% glass phase between the alumina grains. AD-995 contains 99.5% alumina. Most of the alumina is in the alpha, hexagonal-close-packed, phase. Previous plate impact experiments (Gust and Royce, 1971; Rosenberg and Yeshurun, 1985; Klopp and Shockey, 1992; Grady and Wise, 1993) have shown AD-995 to be only marginally stronger than AD-85 in uniaxial strain compression. Similarly, residual penetration tests have shown AD-995 to be marginally more resistant to long rod penetration than Coors' AD-90 (Woolsey et al., 1990), which is
42
26
in cum expected to be marginally more resistant than AD-85. Selected properties of AD-85 and AD- 995 are shown in Table 1.
The specimen geometry is shown in Figure 1. The specimens are constructed by stacking two cylinders of ceramic 73.7 mm in diameter and 38.1 mm high that have 1-cm-radius hemispherical cavmes machined in their adjoining faces. The upper cylinder has a 3.2-mm-diameter axial hole for the mild detonating fuse that detonates the charge. The lower cylinder has copper particle velocity gage loops vapor-deposited on the upper surface concentric with the hemispherical cavity To conserve ceramic, extend recording times, and enable posttest recovery, we press-fit the specimen cylinders into impedance-matching bronze rings 254 mm in diameter and 127 mm high (AMPCOLOY M-4. AMPCO Metal, Inc.. Milwaukee. WI). Bronze plugs of 73.7 mm diameter are situated against the ends of the specimen cylinders. Physical properties of the bronze are shown in Table 2.
I1tT^Tib00kr01 2l 1979> MetaU Pa*- °H- ASM k"™^) value5 for C95500 cast copper alloy. T AMPCO data. # From times of arrival of spherical wavefronts.
The press fit between the cylindrical sides of the ceramic and the holes in the bronze rings is relatively light. The fit vanes from a few micrometers interference at the ends of the cylinders remotest from the gage plane to gaps of about 25 urn near the gage plane. The gaps arise because repeated shots yield the bronze, expanding the hole slightly each time. The gaps were filled with anaerobic adhesive during assembly.
We fabricate the charges by pressing Du Pont EL506D Detasheet explosive between hemispherical dies. We take particular care to ensure that the charges are uniformly dense, spherical, and that the fuse hole IS centered, thus providing for a spherically symmetric loading wave. In the AD-85 experiment, the charge mass was 5.7 g and in the AD-995 experiment it was 6.0 g.
Once the specimen and bronze assembly is pressed together and stacked with the spherical charge inside, the assembly is coated with epoxy and a liquid rubber membrane to waterproof it. The assembly is then inserted into a large pressure vessel filled with water, shown schematically in Figure 2. where a 13.8-MPa overburden pressure is applied. The overburden pressure helps to clamp the upper and lower halves of the assembly together and probably helps inhibit cracking of the bronze even though the pressure is small relative to the tensile strength of the bronze and small relative to the pressure from the explosion. Florence (1994) has found that rocks tested with an overburden of about 10% of the unconfined compressive strength fracture much less than rocks tested without overburden
A large solenoid coil within the pressure vessel surrounds the test assembly. The solenoid coil generates a magnetic field that has a uniform amplitude of 0.181 T over the gage plane of the ceramic
43
27
B-FIELD
2-cm-DIA EL506D
CHARGE
AMPCOLOY M-4
25.4 cm
CERAMIC SPECIMEN
PARTICLE VELOCITY
LOOPS SECTION A-A
FIGURE 1. SCHEMATIC OF THE CERAMIC SPECIMEN AND M-4 BRONZE CONTAINMENT.
When the charge detonates and the ceramic and particle velocity gage loops move radially outward, an electromotive force E is generated in the loops. This EMF is given by Faraday's Law:
£ = KvxB)dl 0)
where v is the particle velocity, B is the magnetic vector field, and dl is the gage line element. For our case of circular gage elements centered about the charge,
E = vBR8 (2)
where v is the radial particle velocity, B is the magnetic field strength, R is the radius of the gage, and 9 is the angle subtended by the gage. The gages' radial leads do not contribute to the measured signal since, along them, (vxB)-dI = 0. Equation (1) is valid until the bronze starts to move. Once the bronze starts to move, the magnetic field within it moves, too, since the characteristic time for diffusion of the magnetic field through the bronze is nearly four orders of magnitude longer than the experiment duration (Jackson. 1962). Thus, once the shock wave reaches the ceramic-bronze interface, the magnetic field no longer has a known amplitude. The Lagrangian diagram for the experiments. Figure 3. shows that, except for .the outermost gage, the positive phase of the pulse is over before the shock wave arrives at the bronze. The negative phase at any gage is perturbed by the motion of the bronze. Any potentially perturbed portion of a pulse is not considered in comparisons
with analysis. Figure 3 shows that the pulse duration is short enough thai most of the loading is over before any
reflections arrive from the ceramic/bronze interface. Thus, impedance matching between the bronze and ceramic is more important for posttest recovery of the ceramic than for success of the particle
velocity measurements. Particle velocity gage output voltages are fed through differential amplifiers to minimize common
mode noise and then recorded at 250 x 106 samples/s on a four-channel Tektronix RTD-720A transient digitizer at 8-bit resolution. The digitizer is triggered by a pulse from the electronic detonator unit that initiates the fuse leading to the charge.
RESULTS Particle velocity and displacement records for the two ceramics are shown in Figure 4. Similarly to
AD-85 plate impact results (Rosenberg and Yeshurun. 1985), the particle velocity records do not show a two-wave structure, although in the present case the wavefront signal could be temporally dispersed because of eccentricity of the wavefront with respect to the gages. In both the AD-85 and AD-995 tests, the records from the innermost gage are terminated early, because the gage loops apparently broke free from the ceramic and accelerated to very high velocities. The velocity record from the fourth AD-85 gage. R = 22.5 mm. was clipped because the gage polarity was reversed. The dotted portion of the record is a cubic spline estimate of the peak, with spline parameters chosen so that amplitudes and slopes matched at the two endpoints of the clipped interval. The displacements were obtained by integrating the velocity records.
Circumferential strains. £#, shown in Figure 5. are calculated from the displacement records:
e =- (3) » R
Reduced velocity potentials (RVPs). /. defined as
a • ci y(t)=CRe * \e R v(%)dq (4)
46
30
12-1
10-
10 a.
LU
BRONZE
RADIUS (mm)
10 20 30
RADIUS (mm)
BRONZE
40 50
FIGURE 3. LAGRANGIAN DIAGRAMS FOR SPHERICAL WAVES EXPERIMENTS.
47
31
>-
ü O _i ui >
-50-4.
TIME (ps)
150-
E a.
w 100
LU O
a. en 50
i i i i I i i i i I i ■ i i I ■ ■ i i I i i i i I
AD-85
*| i i i i pri iri'*| i i i i | i i i i | i i i i
1 2 3 4 5 6
TIME (ps)
FIGURE 4. PARTICLE VELOCITIES (a) AND DISPLACEMENTS (b) FROM GAGES AT RADII 12.5, 15.0, 17.5, AND 22.5 mm.
48
32
rrr'| i i i i i i i i i i i i i i
3 4 5 TIME (MS)
12-
10-
E 8
x 6
4-
AD-85 AD-995
•*| i I'I irp ' ' ' I i i i i | i i i i | i i i i |
3 4
TIME (ps)
FIGURE 5. CIRCUMFERENTIAL STRAINS (a) AND REDUCED VELOCITY POTENTIALS (b) FROM GAGES AT RADII 12.5,15.0, 17.5, AND 22.5 mm.
49
33
where C is the longitudinal wavespeed, are also shown in Figure 5. RVPs are calculated numerically using the trapezoidal rule. If the ceramic were responding linearly elastically, the history of y would be the same at each gage location. In essence, for an elastic response, computing 7 reveals the canonical pulse stripped of its dependence upon radius. Since the RVPs are not the same at each gage, the ceramic is responding nonlinearly to a radius at least as large as that of the third gage, 173 mm.
Posttest photographs of the specimen gage planes taken in the vicinity of the charge cavity are shown in Figure 6. The photographs show extensive radial cracking from the charge cavlCy to the outer boundary. The number of cracks per unit angle (the angular density) is greater near the cavity, especially within the radius of the first velocity gage. At a given radius, the angular density appears to be relatively uniform around the circumference. Many of the radial cracks terminate at the outer edges of the velocity gages. At the outer edge of the first and second velocity gages m the AD-85 specimen, at radii of about 13 mm and 15-5 mm, respectively, circumferential cracks extend part way around the charge cavity. Few. if any, circumferential cracks appear in the AD-995 specimen.
Posttest photographs of the charge cavity walls. Figure 7, show a relatively random, finely spaced crack pattern that is Isotropie with respect to the azimuthal and declinational directions. See the AD- 995 specimen. Figure 7c. in particular. These patterns suggest that the radial crack pattern seen on the gage plane exists on orthogonal meridional planes as well. Superimposed on the fine pattern is a coarse pattern of open, circular cracks relatively evenly spaced in the declinational direction. The latter crack pattern is particularly evident in the AD-85 specimen. Figure 7a and 7b. These cracks appear to extend not in the radial direction but closer to parallel to the gage plane, suggestive of a
laminar structure. Figure 8 shows higher magnification micrographs of sections parallel to and approximately 1 mm
below the gage plane, taken with a scanning electron microscope (SEM). The AD-85 micrograph. Figure 8a, shows a distinct gradient in the microstructure from the charge cavity wall outward. There is more grain pullout remote from the charge cavity. The AD-995 micrograph. Figure 8b. shows no gradient. Early in the preparation of the AD-995 sections, however, during the coarse grinding stage, a distinct radial gradient was evident. There appeared to be significantly more grain pullout close to the charge caviry. suggesting that the grain boundaries there were greatly weakened by the shock.
A transmission electron microscope (TEM) micrograph of an AD-995 sample recovered 1 mm from the charge caviry wall. Figure 9a, shows the prevalence of intergranular fracture, suggesting that the initial shock produces a fragment bed whose characteristic fragment size is the initial gram size. Individual grains are heavily twinned, with twinned regions aligned with the grains' basal plane. A single transgranular crack is visible that is branched, kinked, and curved and therefore appears to have no preferred crystallographic orientation. Similar transgranular cracks are observed in other micrographs. The orientations of the cracks and twins appear to be independent of the loading direction. A micrograph of a sample recovered 8 mm from the charge caviry. Figure 9b, shows
virtually no damage. A TEM micrograph of an AD-85 sample recovered li mm from the charge cavity wall Figure 10a,
shows widespread intergranular and transgranular fracture. The density of transgranular fracture appears to be higher than in AD-995. There are also more voids between the grains. Grams with multiple slip traces, which preliminary x-ray diffraction analysis suggests are not alpha alumina, are more heavily fractured than neighboring alpha alumina grains. Transgranular cracks extend across grain boundaries between both types of grains. The cracks in the non-alpha grams form an orthogonal pattern seemingly independent of the grain structure. The glassy intergranular phase and more open suueture of AD-85 appears to significantly increase its ability to compact and otherwtse alters its failure mechanics relative to AD-995. Again, there appears to be no preferred orientation to the damage. A micrograph of virgin AD-85 is shown in Figure 10b.
MODEL j# . u The spherical wave experiment we have designed provides significant understanding of the response
of ceramics to ballistic penetration. In particular, strain histories derived from the particle velocity
50
34
2 cm
(a) AD-85TOP
(b) AD-85 BOTTOM
FIGURE 6. SPECIMEN GAGE PLANES POSTTEST.
51
CPM-3673-15A
35
(c) AD-995TOP
(d) AD-995 BOTTOM
FIGURE 6. SPECIMEN GAGE PLANES POSTTEST.
52
CPM-3673-16A
36
(a)AD-85TOP ~5 mm
.
(b) AD-85 BOTTOM
iGURE 7. CAVITY WALLS POSTTEST.
53
CPM-3673-17A
37
c) AD-995 TOP 5 mm
(d) AD-995 BOTTOM
FIGURE 7. CAVITY WALLS POSTTEST.
54
CPM-3673-18A
38
CD
Q <
111 Z < _i Q.
LU
O < o LU I
5 o _l LU m E E
Q Z < o
LU —I _l < < a. CO z o f- o LU CO
Q LU I CO _l
O 0- U. O CO I 0. < (3 O cr o
LU CO
CO
LU cr ü LL
55
39
0> CO o r-
£ °? LU ID 0.
o C3
< X o LU X 1-
2
n O x Li.
E E
LO
"(0
Q LU
>i LU u
LT LU «a LU X —1 < CL X 2 O < LU CO — c UJ J_ ^ IT! H-
in
öS
si X O Q. cd < _ *-~* X X3
CO
8|
LU < 1- O
ai LU X 3 O u_
> x * X < o < d < Q 3 cr Z 5 o 3 < o X ca CD
X LU I-
56
40
E 3.
CO
(D CO
□L Ü
E
CO
> < O ill o x < X o UJ X H- 2 o X u_ E E m
a UJ x UJ > o Ü UJ X CO UJ
< en m 00
Q < U. O en x < X o o X o
29 UJ Z 1- <
UJ X
U.
57
41
histories can be correlated with damage levels at given radii, thereby establishing a link between strain path and damage. However, since particle velocity, and not stress, are measured, a direct link between stress and damage is not obtainable from the measurements. Much more understanding can be obtained by modeling the experiment. Models, when verified using particle velocity records and fracture distributions obtained in the experiments, can be used to predict the response of ceramics to different spherical wave loadings and can be used to predict penetration response.
The experiment can be modeled starting with the explosive burn. However, uncertainties in the constitutive behavior of the explosive render resulting comparisons between computed and measured particle velocities in the ceramic equivocal. The experiment is better modeled by applying the particle velocity history from the innermost gage to the inside of a fictitious cavity with that gage's radius. Then, although one less channel of data is available for comparison, the uncertainties in the explosive burn are removed from the problem.
We have taken a two-step approach to modeling the experiment. First, we model the experiment using the one-dimensional PUFF hydrocode (Seaman and Curran, 1978). We assume a Von Mises elastic-plastic description and associated flow, using the panicle velocity history from the innermost gage as input, and we adjust the parameters "until reasonable agreement is obtained with the outer velocity histories. For the AD-85, a Carrol and Holt (1972) description of compaction is also included. We then use the stress histories determined from these simulations at a given radius to drive single-element comminution models and compare predicted comminution with that observed in micrographs at a given radius.
The comminution model, fully described in de Resseguier et al. (1994), assumes an initial fragment size and predicts the fragment size reduction as loading progresses. Briefly.
i«=_AC.Jl-^IJL (5) dt y 2cry qB
where Ais a material constant embodying both the initial flaw size relative to the current fragment size 3 and the characteristic decrement in fragment size relative to the current fragment size, C» is the shear wave speed, Ki< is the material's fracture toughness, <7 is the absolute value of the extremum of the applied principal stress, and 17 is the current intrinsic flaw size relative to the current fragment size. Essentially, fragment size is assumed to decrease in fractional steps at a rate determined by the Rayleigh wavespeed (approximated by the shear wavespeed) when the local stress intensity (approximated using the global applied stress and current fragment size) exceeds the toughness. For AD-995. assuming the initial fragment size to be the grain size, 5 u.m, Ku-A.5 MPaVm , A = l, and 77= 11%. we obtain final fragment sizes of 2.1 u,m 2 mm away from the explosive and 1.28 u,m right
at the interface with the explosive. For AD-85. assuming the initial fragment size to be 30 u.m. Kic - 4 MPaVm , A = 1, and 7] = 8%. we obtain final fragment sizes of 2.9 |im. in this case relatively independently of the initial fragment size. In both cases, calculated final fragment sizes are consistent with those measured.
FUTURE WORK We suggest that several enhancements could be made to the experiment. First, overburden pressures
could be varied to study the effects of confinement on material performance. The size and composition of the charge could be changed to provide more severe loadings representative of higher velocity impacts. The size of the ceramic pieces would need to be increased to lower the amplitude of the stress wave that arrives at the bronze containment. Containment alloys could be found that would be good impedance matches to other ceramics of interest, such as boron carbide, titanium diboride, and silicon carbide, although the conductivity of the last two ceramics may preclude magnetic particle velocity measurements. Magnetic particle velocity measurements might be made in conductive ceramics by having the gage loops remain stationary in loose grooves while the magnetic field is swept along by
58
42
the ceramic, effectively frozen within it because of the long magnetic diffusion times (Jackson, 1962).
Significant development of the model is required to make it useful for predicting comminution. First, the model must be incorporated within a finite element code so that simulations can proceed directly from kinematic input, eliminating the two-step process of calculating the stresses using an ad hoc plasticity model then applying the stresses to a one-element version of the comminution model. Second, the model must be verified against a larger range of stress and comminution levels than presented here. Third, some micrographs of comminuted ceramic show there to be a bimodal distribution of fragment sizes, in which large fragments are surrounded by a sea of much smaller fragments, suggesting that fragments comminute by erosion from their surfaces rather than simply fracturing into more-or-less equal-sized pieces. The model does not reflect such a comminution mechanism.
CONCLUSIONS The spherical cavity expansion experiment we have designed provides a well-characterized,
nominally one-dimensional loading that is an analog of the process occurring near the tip of a long rod penetrator as the penetrator approaches a material point. More important, however, and unlike plate impact and ballistic penetration experiments, we readily are able to recover the specimen for posttesl characterizatiun. We conclude that
• Particle velocity measurements coupled with posttest microscopy provide a direct link between strain path and damage.
• The attenuation of peak stress or strain and damage with radius implies that a single experiment can provide data from a broad range of well-characterized conditions.
• AD-995 alumina ceramic is comminuted primarily via grain boundary fracture, although many branched, noncrystallographic transgranular cracks are observed, as are numerous twinned regions.
• AD-85 alumina ceramic is comminuted by compaction and fracture of the intergranular glassy phase, as well as by fracture of grains of non-alpha alumina exhibiting multiple slip, and by fracture of alpha grains.
• A simple model of comminution in which fragments are assumed to contain initial flaws of a fixed relative size and are assumed to fracture according to elementary fracture mechanics theory at a rate governed by the Rayleigh wavespeed is able to reasonably predict fragment sizes at various distances from the charge.
ACKNOWLEDGMENT This work was sponsored by the U. S. Army Research Office. Dr. Kailasam Iyer was the Program
Manager. We thank our colleague Dr. Alexander Florence for his generous guidance during this work.
REFERENCES Bishop, R. F.. Hill. R.. and Mott, N. F., 1945. "The Theory of Indentation and Hardness Tests,"
Proc. Phys. Soc. Vol. 57. pp. 147-159. Carroll, M. M.. and Holt. A. C. 1972. "Static and Dynamic Pore Collapse Relations for Ductile
Porous Materials," J. Appl. Phys., Vol.43, pp. 1626-1636. de Resseguier, T.. Klopp, R. W., Seaman, L., and Curran, D. R., 1994, "Dynamic Fragmentation of
Ceramic Materials under Shock Wave Loading," Int. J. Impact Engineering, to be submitted. Florence, A. L., 1994, Private communication. Florence, A. L., Cizek. J. C, and Keller, C. E., 1984, "Laboratory Experiments on Explosions in
Geologic Materials," in Shock Waves in Condensed Matter - 1983. J. R. Asay, R. A. Graham, and G. K. Straub, eds., Amsterdam. Elsevier, pp. 521-524
59
43
Florence, A. L., Gefken, P. R., Seaman, L., Curran, D. R. and Shockey, D. A., 1992, "Computational Models for Armor Penetration," SRI Technical Report on Project PYD-8521 prepared for Alliant Techsystems, Inc., Minnetonka, MN, on P.O. No. 635848-FN.
Grady, D. E., and Wise, J. L.. 1993, "Dynamic Properties of Ceramic Materials," Sandia Report SAND93-0610, September.
Gust, W. H., and Royce, E. B., 1971, "Dynamic Yield Strengths of B4C, BeO, and AI2O3 Ceramics," J. AppL Phys., Vol. 42, pp. 276-295.
Hopkins, H. G., I960, "Dynamic Expansion of Spherical Cavities in Metals," Progress in Solid Mechanics • 1, I. N. Sneddon and R. Hill, eds.. North Holland, Amsterdam, Chapter 3.
Jackson, J. D., 1962, Classical Electrodynamics, John Wiley & Sons, New York, p. 313. We believe Jackson's calculation of a 1-s characteristic time for magnetic diffusion in a 1-cm copper sphere is erroneous. Our calculation shows it to be more like 7 ms, which is nevertheless several orders of magnitude slower than the duration of our experiment. One must be careful with units when making the calculation.
Klopp, R. W., and Shockey, D. A., 1992, "Tests for Determining Failure Criteria of Ceramics under Ballistic Impact," SRI International Final Technical Report to Army Research Office, Contract No. DAAL03-88-K-0200. June.
Larson, D. B., 1982, "Explosive Energy Coupling in Geologic Materials," Int. J. Rock Mech. Min. Sei. & Geomech. Abstr., Vol. 19, pp. 157-166.
Luk, V. K.. Forrestal. M. J., and Amos. D. E., 1991, "Dynamic Spherical Cavity Expansion of Strain-Hardening Materials." / AppL Mech., Vol. 58, pp. 1-6.
Rosenberg, Z.. and Yeshurun, Y., 1985, "Determination of the Dynamic Response of AD-85 Alumina with In-Material Manganin Gages," J. AppL Phys., Vol. 58, pp. 3077-3080.
Seaman. L.. and Curran. D. R.. 1978. "SRI PUFF 8 Computer Program for One-Dimensional Stress Wave Propagation," Final Report, Volume II. on Contract No. DAAK11-77-C-0083 to U. S. Army Ballistics Research Laboratory. August.
Shockey. D. A., Marchand. A. H.. Skaggs, S. R.. Cort. G. E., Burkett. M. W.. and Parker. R., 1990. "Failure Phenomenology of Confined Ceramic Targets and Impacting Rods," Int. J. Impact Engng, Vol. 9. pp. 263-275.
Täte. A.. 1967, "A Theory for the Deceleration of Long Rods after Impact," J. Mech. Phys. Solids, Vol. 15, pp. 387-399.
Woolsey. P., Kokidko, D.. and Mariano. S.. 1990. "Progress Report on Ballistic Test Methodology for Armor Ceramics." Proc. 6th U. S. Army TACOM Combat Vehicle Survivability Symposium, March.
Yew. C. H.. and Stirbis. P. P., 1978. "Penetration of Projectile into Terrestrial Target," Journal of the Engineering Mechanics Div ASCE, Vol. EM2, pp. 273-286.
60
44
DEFORMATION AND COMMINUTION OF SHOCK LOADED a-AL203 IN THE MESCALL ZONE OF CERAMIC ARMOR
J. T. McGINN,* R. W. KLOPP,** AND D. A. SHOCKEY** *David Sarnoff Research Center, CN 5300, Princeton, NJ 08540 **SRI International, 333 Ravenswood Avenue, Menlo Park, CA 94025
ABSTRACT
Incursion of high density penetrators into ceramic armor is preceded by the formation of a finely comminuted rubble bed at the penetrator tip, the Mescall zone. The deformation and failure processes that result in the Mescall zone are critical to understanding penetration resistance and to modeling penetration behavior. Transmission electron microscopy (TEM) was used to examine shock loaded material in the vicinity of an explosive detonation in a-Al203 and to infer the phe- nomenology of plasticity and fracture occurring at the tip of an advancing penetrator in ceramic armor. Comminution proceeds by intergranular fracture until the fragment size approaches the grain size. Further fragmentation proceeds by transgranular cracks, which nucleate at preexisting microvoids and at intersections of basal twins and primary and secondary slip bands.
INTRODUCTION
Long Rod Penetrator
When a high velocity, long rod projectile shock loads an armor ceramic, it creates a highly comminuted zone just ahead of the penetrator tip. The comminuted material then flows laterally and opposite to the direction of attack to allow the penetrator to advance,1 Fig. 1. Thus, the mech- anism of comminution and the flow behavior of the comminuted material importantly influence the rate and extent of penetration. An understanding of these processes and the microscopic failure mechanisms that occur in armor ceramics under shock loads would assist in developing improved armor ceramics and more reliable predictive models for armor penetration.
Fragmentation of alumina under shock loads has been investigated by many researchers. Espinosa2 examined damage generated under planar shock compression produced by gas-gun- launched-plate impact experiments and found fragmentation resulted from Y cracks that formed at triple grain junctions. Such cracking was assisted by the presence of a glassy phase at grain boundaries. Espinosa2 did not look at the dislocation substructure within grains, but Howitt and Kelsey3 using TEM determined that shock loads produced pyramidal, prismatic and basal slip in single grains, and that these slip systems were sufficient to satisfy the Von Mises criterion. Cagnoux4 examined the deformation structures under divergent spherical shock waves and found that plastic deformation in fine grained (4.7 micron) alumina occurred by slip and that no cracks occurred under compression, whereas in coarse grained (10-20 micron) material plastic deformation occurred by twins and that cracks nucleated at twin boundaries under compression. Lerne Louro and Meyers5 attempted to develop a model for shock wave induced fragmentation based on nucleation, growth and coalescence of microcracks.
This paper describes an investigation of the deformation/failure microstructure of CC-AI2O3 that was shock loaded by detonating an explosive charge. The experiment was designed to produce a
Impact Surface Ejecta
Block of Armor Ceramic
Comminuted Material in Mescall Zone
Fig. 1. Projectile penetrating a block of ceramic armor showing cracking pattern and comminution zone.
J. T. McGinn. Page I of 6
45
dynamic load condition similar to that produced by a penetrating projectile and to prevent granular flow of the comminuted material. The observations of the crystal substructure with the transmission electron microscope were used to infer behavior in the Mescall zone.
EXPERIMENTAL
Fig. 2. A microvoid in as-received AD-85. The distinct facets imply that the void formed during high temperature processing when the (X-AI2O3 grains can form low energy surfaces.
A confined explosive charge experiment was designed and performed to simulate the stress and strain rate conditions produced by a long rod penetrator striking ceramic armor and to allow highly fragmented material to be recovered in place.6 A 1-cm-radius spherical charge (Du Pont EL506D Detasheet) was embedded in the center of a cylinder of (X-AI2O3, 73.7 mm in diameter and 76.2 mm high, heavily confined in an impedance- matched bronze housing. Detonation of the charge produced a radially symmetric, divergent shock wave that propagated outward. The particle velocities at several distances from the charge were
measured with electromagnetic gauges that had been vapor-deposited in the ceramic specimen on a plane containing the equator. From these records, we derived displacement histories, strain histories, and reduced velocity potentials. After the experiment and removal of the specimen from the bronze housing, specimens for TEM examination could be taken at desired distances from the shock source.
Experiments were performed on two ceramics obtained from Coors Technical Ceramics Co., Oak Ridge, TN: AD-995 consisting of 99.5% alumina in the alpha, hexagonal-close-packed phase, and AD-85 consisting of about 85% alpha alumina and 15% glass phase, present predomi- nantly at the boundaries of the alumina grains.
Specimens for TEM were prepared by removing fragments from the explosively shocked sample at known distances from the charge cavity wall. Fragments were vacuum impregnated with Buehler's Epo-Thin to stabilize the fragments, and faces perpendicular to the propagation direction of the shock wave were polished flat. Disks 3 mm in diameter, cut from the polished faces, were back-side dimpled to a thickness of 20 11m and then argon ion milled at 5 kV until perforated. Edges of the perforation were examined by TEM. For comparison, specimens of virgin AD-85 and AD-995 were similarly prepared, omitting the vacuum impregnation step.
A Philips EM 400 transmission electron microscope at Stanford University's Center for Materials Research and a Philips EM 420 instrument at the David Sarnoff Research Center in Princeton, New Jersey, were used to analyze the specimens.
OBSERVATIONS
Microstructure of Virgin Aluminas Fig. 3. An overview of the defect structure in
The baseline microstructures of virgin AD-85 AD-995 2 mm from the edge of the explosive and AD-995 were evaluated to compare with cavity.
J. T. McGinn. Page 2 of 6.
46
Fig. 4. Crack in AD-995 emanating from regions associated with restricted dislocation motion. This effect was particularly true of dislocations moving on secondary slip systems.
Neither slip bands nor twins were observed.
shock-loaded microstructures. Unshocked mate- rials showed microstructures composed of well- formed CC-AI2O3 grains separated by amorphous layers varying widely in thickness. Microvoids contained within individual AD-85 and AD-995 grains are the dominant defect. Clusters of these voids are commonly observed. Void facets, as seen in Fig. 2, imply that void formation occurred during a high temperature phase of fabrication. The voids are entirely contained within the OC-AI2O3 grains.
AD-995 8.05 mm from Explosive Cavity Wall
The density of defects 8 mm from the explosive cavity edge is below TEM detection limits (~105/cm2); no signs of shock induced defects were detected. The microstructure is similar to the virgin AD-995 material. Most notice- ably, grain boundaries are intact, and intergranular voids show no signs of dislocation nucleation.
AD-995 2 mm from Cavity Wall
An overview of the AD-995 microstructure 2 mm from the edge of the explosive cavity is shown in Fig. 3. The wavy lines crossing individual grains are bend contours and thickness fringes (i.e., diffraction artifacts). They indicate that extensive residual stress remains in the samples but do not in themselves represent discrete defects. Dislocation slip bands are the domi- nant defect. These bands form parallel traces within an individual grain and lie parallel to the (0001) basal plane. Dislocations forming the slip bands are confined to the (0001) plane and typically run along <1l20> directions. Their Burgers vectors are parallel to the <1100> directions. Although the slip bands typically extend across entire grains, bands occasionally terminate within a grain. Strain contrast is observed at the bands' leading edges. Further examination indicates that the bands separate twinned regions. The dislo- cation density in twin boundaries is 109/cm2. Cagnoux4 observed similar twin structures in shock-loaded samples of 99.7% alumina with 10-20 u,m grain size. On the other hand, Cagnoux4
and Louro and Meyers7 noted few twin structures in their investigations of aluminas with finer, 3-5 jim grain size.
Fracture occurs by intergranular as well as transgranular modes. Individual cracks will often change modes. Most transgranular cracks extend over a single grain and then join an intergranular crack along a grain boundary. Several cracks observed in Fig. 4 emanate from a dislocation pileup along a slip band. Figure 5 shows what had been a single grain as indicated by the series of parallel slip bands. This grain has been fragmented by cracks that cross those preexisting slip bands.
Fig. 5. AD-995 grain with parallel twin faults has undergone fragmentation. The twin faults are replicated across the cracks.
J. T. McGinn. Page 3 of 6
47
Fig. 6. Network of dislocations in AD-995 grain emanating from a native void. The dislocations move along a secondary slip system.
sample taken 2 mm from the cavity wall.
Although transgranular fracture is not crystallo- graphic (that is, the cracks follow no well defined single plane), crack planes are typically approx- imately normal to the (0001) slip plane. Slip along a secondary system is also observed approximately perpendicular to the (0001) plane. The dislocation network emanating from the void in Fig. 6 is a typical example.
AD-995 1 mm from Cavity Wall
1 mm from the edge of the explosive cavity, the predominant fragmentation mode is inter- granular fracture. Fragments ranging from 2 |im to well above 20 |im reflect the material's intrinsic grain size. Most grains are highly deformed. Major deformation mechanisms again consist of dislocation slip bands and associated microtwins, both occurring on a single slip system within individual grains. The density of slip bands and microtwins is approximately the same as in the
Defect Microstructure of AD-85
Shock-loaded microstructures in AD-85 were similar to those in AD-995. We compared an AD-85 sample 1.5 mm from the explosive cavity wall with AD-995 samples taken 1 mm and 2 mm from the cavity wall. Although the predominant fragmentation mechanism of both materials is intergranular, the transgranular fracture density in AD-85 is higher than that in AD-995.
Deformation features within individual AD-85 grains are also similar to those found in AD- 995. In both samples, a single slip system dominates. Dislocations are confined predominantly to that system's slip planes. Occasionally in AD-85 multiple systems are active. Diffraction evidence indicates that these grains are not OC-AI2O3.
Figure 7 shows extensive, transgranular frag- mentation of a-Ah03 grains in AD-85. The jagged transgranular fracture paths do not follow the slip planes; rather, they lie on ill-defined planes approximately perpendicular to the major slip system. Thus, noncrystallographic fracture occurs during fragmentation. Slip traces and microtwins commonly continue across fracture surfaces as shown in Fig. 7.
INTERACTION BETWEEN PROPAGATING CRACKS AND (0001) PLANAR DEFECTS
The noncrystallographic fracture path cuts across existing twin boundaries and slip planes. Since twins and slip planes are replicated across fracture surfaces, as shown in Fig. 7, transgran- ular fracture follows the twinning process. Existing twins often deflect cracks äs cracks traverse a grain, as shown in Fig. 8. This behavior
Fig. 7. Extensive transgranular fragmentation in AD-85. Jagged fracture paths follow ill-defined planes approximately perpendicular to the major slip plane.
J. T. McGinn, Page 4 of 6
48
Fig. 8. Advancing crack in AD-85 deflected by previously formed twins.
is additional evidence for twin formation preceding cracking. Wang and Mikkola8 found that cracks in OC-AI2O3 polycrystals usually nucleated at the intersections of bundles of twins with grain boundaries, with most cracks propagating along grain boundaries.
In both AD-85 and AD-995, numerous instances of intergranular fracture have occurred. Figure 9 shows a meandering crack traversing an AD-995 OC-AI2O3 grain 1 mm from the explosive cavity. Notice the several small branches extend- ing from this fracture.
Numerous examples of crack tips coinciding with twin or slip bands have been observed, as in Fig. 4. Figure 10 shows a grain 1.5 mm from the cavity as in sample AD-85. This grain has been fractured into several fragments. The fractures are approximately perpendicular to a central twin, and the end of one of the cracks coincides with the twin.
DISCUSSION
The phenomenology of damage can be inferred from these TEM results. Initially, the dynamic load generates dislocations within individual grains. These dislocations move easily along the (0001)/<ll00> easy-glide-system of <x-Al203 and eventually form slip bands and microtwins. The large number of dislocations suggests that they are nucleated not just at the microvoids found within the as-received OC-AI2O3, but also at the surfaces of individual grains. As deformation continues, work hardening slowly develops and stresses that cannot be relieved by a single slip system increase and initiate dislocation motion on unfavorable slip systems. The high incidence of such dislocations associated with voids suggests these native defects act as nucleation sites for these secondary deformation modes. Secondary dislocation motion is impeded by microtwins and dislocations on the (0001) plane. Work hardening increases rapidly and stress relief is further limited. Eventually cracks are nucleated where secondary slip intersects a slip band or microtwin on the (0001) plane and transgranular fracture occurs. As these cracks propagate through a grain, they intersect other microtwins and slip bands, which deflect their motion and result in a rough noncrystallographic fracture surface.
ENERGY CONSIDERATIONS
The energy of twin boundaries can be roughly calculated knowing the mechanical constants for CX-AI2O3, the Burgers vector of the boundary dislocations, and their density. This calculation gives an energy density of 0.15 MJ/m3. For comparison, the kinetic energy lost from the shock wave between 15 mm and 17 mm from the cavity wall, assuming uniform deposition, is about 8 MJ/m3. The loss was calculated from the electromagnetic particle velocity gauge data with stresses given by Hooke's law. This suggests that twin boundary energy is only a small fraction of the total strain energy imparted to the specimen by
Fig. 9. Crack meandering through AD-995 OC-AI2O3 grain with several small branches extending from the main path.
J. T. McGinn. Page 5 of 6
49
the explosion. Likewise, the energy absorbed by bulk twin formation, secondary slip, and fracture is assumed to be small relative to the total absorbed energy.
In armor penetration, we expect that much greater energy is absorbed by the flow of the com- minuted ceramic out of the path of the advancing penetrator. Because this latter energy depends strongly on fragment size and shape, the mech- anisms of microstructural deformation and fracture that control grain fragmentation below the native grain size of a ceramic are important issues in developing improved armor ceramics.
CONCLUSIONS
• Comminution in the Mescall zone of AI2O3 occurs in two stages: first, intergranular fracture produces coarse fragments; then, transgranular fracture produces finer (than the grain size) fragments.
• Slip bands, twins, and inherent microvoids are the nucleation sites for transgranular cracks.
• The energy absorbed by deformation and fracture in the Mescall zone is probably a very small portion of the total absorbed energy in a penetration event.
In summary, the microdeformation processes and how they lead to fracture and comminution in dynamically loaded OC-AI2O3 have been clarified. Although these processes absorb relatively little energy during projectile penetration of ceramic armor, they control the size and shape of Mescall zone fragments, which strongly influence the energy absorbed by the flow of material from the path of the penetrator. Therefore, the findings reported here should be useful to workers attempting to develop improved ceramics for armor applications and to researchers constructing mechanistic models for predicting penetration behavior in ceramic armor.
This work was sponsored by the U.S. Army Research Office. Dr. Kailasam Iyer was the Program Manager.
Fig. 10. Grain fragmentation. A grain in AD-85 has several cracks running approximately perpendicular to the single internal twin. One crack appears to have been initiated on the twin.
REFERENCES
1.
2.
3. 4.
D. A. Shockey, A. H. Marchand, S. R. Skaggs, G. E. Cort, M. W. Burkett, and R. Parker, Int. J. Impact Engng., 9, 263-275 (1990). H. D. Espinosa, G. Raiser, R. J. Clifton, and M. Ortiz, J. Hard Materials, 3, (3-4), 285-313 (1992). D. G. Howitt and P. V. Kelsey, Deutsche Gesselschaft für Metallkunde, 1, 249-256 (1988). J. Cagnoux, Shock Compression of Condensed Matter - 1989, S. C. Schmidt, J. N. Johnson, L. W. Davison, Eds. (Elsevier Science Publishers B.V., 1990), pp. 445-448.
5. L. H. L. Louro and M. A. Meyers, Shock Compression of Condensed Matter, 1989, S. C. Schmidt, J. N. Johnson, L. W. Davison, Eds. (Elsevier Science Publishers B.V., 1990), pp. 465-468.
6. R. W. Klopp, D. A. Shockey, L. Seaman, D. R. Curran, J. T. McGinn, T. de Resseguier, AMD-Vol. 197, Mechanical Testing of Ceramics and Ceramic Composites (ASME 1994), pp. 41-60.
7. L. H. L. Louro and M. A. Meyers, J. Mater. Sei., 24, 2516, (1989). 8. Y. Wang and D. E. Mikkola, in Shock Wave and High-Strain-Rate Phenomena in Materials,
M. A. Meyers, L. E. Murr, and K. P. Staudhammer, Eds. (Marcel Dekker, Inc., 1992) pp. 1031-1040.
J. T. McGinn. Page 6_ of 6
50
Submitted for publication in the International Journal of Impact Engineering. 10-28-94.
FRAGMENTATION OF CERAMIC MATERIALS UNDER SHOCK WAVE LOADING
T. de Resseguier,* R. W. Klopp, L. Seaman, C. Kanazawa, and D. R. Curran
SRI International, 333 Ravenswood Avenue, Menlo Park, CA 94025, U.S.A.
* ENSMA, L. E. D., Site du Futuroscope, BP 109, 86960 Futuroscope Cedex, France.
Summary Two types of shock experiments were carried out in four
different ceramics, to characterize and model their fragmentation and
comminution under ballistic impact. In the first type of test, a high-velocity
rod penetrator was impacted into a confined ceramic target In the second
type, a small spherical explosive charge was detonated inside a ceramic
sample and particle velocity histories were measured at several radial
positions from the charge. In both types of tests, the damaged specimens
were recovered, sectioned and polished and detailed examinations of the
cross sections were made to observe features of the fragmentation and
comminution process. The characteristic size of the comminuted ceramic
fragments varied from about 1 micrometer close to the penetrator or
explosive cavity wall to many micrometers farther away. Two types of
comminution morphology were observed. In one, the comminuted ceramic
fragments exhibited a single size distribution form, whereas in the other
type a bimodal distribution was observed in which larger fragments floated
in a sea of smaller fragments. A simple numerical model of the comminution
process is proposed that allows prediction of the evolution of the average
fragment size during a given load history. The model is shown to provide a
51
fair description of the comminution observed under spherical explosive
loading.
NOTATION
a i Fraction of B that the crack runs during fracture of a fragment
(X2 Proportionality constant relating the comminution rate to the current
fragment size
A Proportionality constant relating the comminution rate to the crack speed
B Fragment size
B0 Initial fragment size
Berit Minimum fragment size for a given macroscopic stress state
Cs, CL, CR Shear, dilatational, and Rayleigh wave speeds, respectively
Vc Crack speed
D', y Functions of Vc in expression for Ki
Ki Dynamic stress intensity factor for a crack tip running with the speed Vc
Kio Static stress intensity factor
Kic Fracture toughness
R Penny-shaped crack radius
r| Proportionality constant relating the initial crack size to the fragment size
<J Local maximum tensile stress
1. INTRODUCTION
The expanding use of ceramic materials in applications involving shock waves has led to
vigorous research on their dynamic behavior [1-8]. Because of their brittleness, most
ceramics pulverize upon strong shock loading, which limits the possibility of post-test
measurements. Still, such measurements are key in understanding the specific failure
properties of solid materials. To investigate these properties under ballistic impact, we
52
performed two types of shock experiments in several ceramics. Post-test analysis of
recovered specimens revealed a two-step fracture process. The obtained data provided a
basis for a quantitative description of this process, information that is needed to implement
a more complete constitutive model for ceramics. This paper reports the main experimental
observations, proposes a comminution model, and discusses its ability to predict the
observed phenomena.
2. MATERIALS
Three grades of alumina (AD-85, AD-90, and AD-995) obtained from Coors Technical
Ceramics Co. and one aluminum nitride (A1N) manufactured by Dow Chemical were
tested. Selected properties of these materials as given by the manufacturers are listed in
Table 1.
TABLE 1. SELECTED PROPERTIES OF TESTED CERAMICS
AD-85 AD-90 AD-995 A IN
As-received density (g/cm3) 3.41 3.60 3.89 3.26
Theoretical density (g/cm3) 3.66 - - -
Longitudinal wavespeed (km/s) 8.52 8.8 10.08 10.8
Shear wavespeed (km/s) 5.5 5.0 6.2 6.2
Hugoniot elastic limit (GPa) 6.0 - 6.2 -
Bulk modulus (GPa) 109 158 196 -
Fracture toughness (MPa/m)* 3-4 3-4 4-5 -
* From notched beam tests.
AD-85 contains 85% alumina (A1203) and 15% glass phase between the alumina
grains. Its Hugoniot elastic limit has been measured as 6.0 GPa [1], and a Hugoniot curve
53
has been determined in a stress-volume plane [2]. Permanent densification is expected to
occur above the elastic limit at a stress of about 30 GPa. The theoretical density for the fully
densified ceramic has been calculated as 3.66 g/cm3, and this value has been confirmed
experimentally [2]. AD-90 contains 90% AI2O3 and 10% glass phase between the alumina
grains. AD-995 contains 99.5% AI2O3, and its Hugoniot elastic limit has been measured as
6.2 GPa [3]. A1N is designated by the manufacturer as carbothermally reduced, hot-
pressed Roklite 500.
3. LONG ROD PENETRATION EXPERIMENTS
Rod impact tests were performed with A1N and AD-90 samples. In these tests, 6-mm-
diameter, 60-mm-long tungsten alloy (W-Ni-Fe) rods with hemispherical tips were shot at
impact velocities of about 850 ms"1 into ceramic samples confined in steel. To ensure good
confinement, the targets were constructed with shrink-fit and bolted steel around the
ceramic cores to produce modest compressive prestresses in the ceramic (see Figure 1).
Details of the experimental setup can be found elsewhere [4]. The partially penetrated
ceramic specimens were recovered, sectioned through a plane containing the axis of the
penetrator, polished, and examined in a scanning electron microscope (SEM).
Figure 2a is a view of such a cross section in A1N, showing a portion of the highly
eroded penetrator (white areas in the picture) adjacent to fragmented ceramic, at a depth of
about 1 cm below the impacted surface. Figure 2b is a detail of this view, located in the
ceramic. It shows a finely pulverized layer (pale grey) with small pores (black dots),
between three fragments (dark grey) that exhibit the original granular microstructure of
A1N. Figure 2c is a view of the same cross section but about 1 mm away from the
penetrator, where the imposed strains were smaller. It reveals cracks running through the
ceramic and intersecting to form adjacent fragments of characteristic size -20 urn. Unlike
those in Figure 2a, these fragments are still closely packed together. Nevertheless, the
shapes and dimensions of the fragments seem similar in both views.
54
Figure 3a is a cross section of a partially penetrated sample of AD-90, also 1 cm below
the impact surface and 1 mm away from the penetrator. It shows the same basic features as
Figure 2a, i.e., large fragments lying in a granular bed of finer particles. The size range of
these fragments is extremely wide. Figure 3b is a detail showing that the small particles
between the large fragments are the result of comminution of the ceramic into sub-
micrometer-sized pieces. In both micrographs, the ceramic fragments lay on a dark
background formed by the epoxy injected into the recovered targets to freeze the fractured
material in position before sectioning.
4. SPHERICAL CAVITY EXPERIMENTS
The penetration tests described above provide qualitative information on ceramic failure
under high pressures and very large deformations. However, in such tests the loading path
for a material element is complex and not controlled. To acquire more quantitative data,
dynamic cavity expansion experiments were performed by detonating an explosive charge
within a spherical cavity machined in a ceramic specimen confined in an impedance-
matching bronze container (see Figure 4).
The resulting loading of the material (stress, strain, strain rate) is well-characterized,
nominally one-dimensional, and similar to the conditions occurring near the tip of a rod
projectile during a penetration event [5,6,7]. Moreover, the test was instrumented with
electromagnetic gages that measure particle velocity histories induced by the detonation at
several radii from the charge. Experimental details are given elsewhere [8].
This test was applied to AD-85 and AD-995 aluminas. Post-test microscopic
examination of the recovered samples revealed that the overall damage was less severe than
in the penetration experiments and allowed a more detailed description of the fracture
processes.
Figure 5a shows a SEM micrograph of a cross section of a recovered sample of AD-85
in a region located a few micrometers from the charge cavity wall, where the compressive
55
Stresses are estimated to reach 7.5 GPa. It shows macroscopic cracks whose orientations
do not seem clearly related to the direction of wave propagation. They intersect to form
separated fragments of average size -30 jam. The fragments farther from the explosive are
larger.
Figure 5b is a closer view, 1.5 mm from the cavity wall, where the compressive
stresses are highly attenuated. It shows intact grains of alumina embedded in a glass phase,
with one crack running both between and through them.
Figure 5c is at the same scale, in a region about 0.5 mm from the cavity wall. In this
region there are larger fragments surrounded by smaller ones, and the arrangement of the
grains in the glass is more compact than in Figure 5b; this situation can probably be
interpreted as permanent densification due to strong dynamic compression. Figure 5c
shows a region with smaller fragments between the larger fragments. Numerous
microscopic cracks are present, both intergranular and transgranular. They define small
fragments averaging about 3 urn in size. The crack pattern appears relatively random and is
isotropic with respect to the azimuthal and declinational directions.
Figure 6 shows cross sections at different locations in the recovered sample of AD-995.
Figure 6a shows the original microstructure far from the explosive; it contains a few pores,
and grains significantly bigger and much more densely packed than in AD-85.
Figure 6b is a similar view 4 mm away from the cavity wall, where higher strains have
led to the decohesion of the grains, which are separated by thin cracks. A broader view in
that region would reveal a few nonintersecting macrocracks.
Figure 6c is located 1 mm away from the explosive. The grain decohesion is more
obvious, and transgranular fracture is present near the original pores. The prevalence of
transgranular fracture increases closer to the cavity, but it is confined to the vicinity of
pores or macrocracks.
In Figure 6d, 0.3 mm from the cavity wall, the load history produced small fragments
of average size -1 urn. Unlike the case for the AD-85 material, the packing of the highly
56
compressed grains is not tighter, and no density gradient was observed. However, there
appears to be significantly more grain pullout close to the charge cavity, an observation
confirming that the grain boundaries there are very weak, if not completely fractured.
The above observations are summarized in Table 2.
Material
A1N
TABLE 2. OBSERVED FRAGMENT MORPHOLOGY
Test
AD-90 AI2O3 Penetration
Penetration
Fragment Size Range
(m) Comments
< 1 -600 Larger fragments in sea of smaller fragments (bimodal distribution)
<l-20 Bimodal distribution
AD-85AI2O3 Spherical cavity =3-30 Bimodal distribution
AD-995AI2O3 Spherical cavity =1-5 Relatively uniform fragment size distribution
5. FRACTURE PHENOMENOLOGY
Similar features observed in specimens from the long rod penetration tests (described in
Section 3) and the cavity expansion tests (described in Section 4) support the computational
result that cavity expansion tests force the material through strain paths similar to those
experienced during the early part of a penetration event [7]. Note that the fragments were
smaller for the penetration experiments, in which the specimens experienced larger late-time
shear strains. Also note that all the experiments except those for AD-995 AI2O3 showed
bimodal fragment size distributions, with larger fragments floating in a sea of smaller
fragments.
57
The different ceramics appear to have different mechanisms for comminution and
postcomminution flow.
In AD-85, the macroscopic compression during the spherical expansion experiment
produced internal rearrangements of the AI2O3 grains in the glass phase, which resulted in
permanent densification of the ceramic. Meanwhile, the local stresses broke the specimen
into relatively large fragments. Then comminution eroded the surfaces of those fragments,
so that the larger fragments ended up flowing in a fine granular bed. These smaller granules
are likely to play the role of a lubricant in the fragmenting bed, inhibiting the larger
fragments from fracturing further.
The penetration experiments in A1N and AD-90 also showed this bimodal fragment size
distribution. For these two-phase ceramics, this highly localized comminution is likely to
enhance the mobility of the larger fragments and thus make further penetration easier.
In AD-995, whose original microstructure clearly differs from the others, no
compaction was observed. Instead, the early macroscopic fracturing seemed to result in
grain decohesion, leading to a granular bed composed of well-packed, separated grains of
alumina. Then, under further strains, transgranular fracture occurred locally, near
macrocracks or pores, where the local stresses applied to the grains were concentrated.
Thus, in this dense ceramic, internal rearrangement or significant flow cannot occur
without fracturing the alumina grains, which requires high local stresses. Indeed, AD-995
has been shown to be marginally stronger than AD-85 under uniaxial strain compression
[1,2,3,4] and slightly more resistant to long rod penetration than AD-90 [9].
The above observations suggest that dynamic failure of shock-loaded ceramics occurs
through a two-step process: First, divergent compressive loading produces local tensile
strains due to a combination of the divergence, stress field interactions with free surfaces,
microstructural inhomogeneities, and grain anisotropy. These tensions cause macrocracks
that coalesce to form relatively large fragments, and porosity is increased as a result of
58
crack opening. Owing to divergence and attenuation of the incident shock wave, the
fragments are smaller with decreasing distance from the loaded surface.
Then, in Step 2, when further shear strains are imposed, these fragments are further
comminuted. In some cases (AD-995 AI2O3), the further comminution simply produces
uniformly smaller fragments, but in other cases the fragments are abraded on their edges,
leading to the observed larger fragments in a sea of finer fragments.
In the case of a rod impact, this comminution process occurs at the leading edge of the
projectile, and the finely broken ceramic flows towards the free surfaces, opposite to the
direction of attack and out of the path of the advancing projectile, allowing further
penetration. In the case of a spherical compressive pulse, the symmetry conditions make
this granular flow more difficult, and the fragments do not undergo such large
displacements. Thus, one can consider that the situation around the expanding spherical
cavity described in Section 4 represents an intermediate state in the penetration event, after
microscopic fragmentation has started but before significant shear flow with subsequent
further comminution occurs.
6. COMMINUTION MODEL
6.1 Approach
Following the interpretation proposed above, we took a two-step approach to modeling
the post-yield fragmentation of ceramics under ballistic impact.
(1) Under high compressive and shear loading exceeding the yield strength, a material
element undergoes progressive fracture until macroscopic cracks intersect to form
individual fragments. This early fragmentation can be handled using a classical model
for brittle fracture [10], which involves a strain-dependent scalar damage function,
and a "multiple-plane" configuration [7]. When the damage reaches a preassigned
level on a preselected plane in a material element, that element is declared to be
fragmented along that plane. This calculation leads to an "initial bed" composed of
59
fragments of various dimensions, with an average size Bo and a porosity due to the
presence of voids and cracks between the fragments.
(2) The subsequent behavior of this fragmented bed has been previously described by a
specific model called FRAGBED [7], which is based on a micromechanical
description of a granular bed deforming nonelastically by sliding and ride-up of
fragments, with accompanying competition between dilatancy and pore compaction.
In FRAGBED, for simplicity the characteristic fragment size Bo was assumed to
remain constant. However, Ref. [7] points out the need to include a numerical
algorithm for comminution (microscopic fracture of the fragments into more
fragments of smaller size B). Such a description is proposed next, as a stress-driven
microcracking process ruled by fracture mechanics principles.
6.2 General assumptions for the comminution model
Under macroscopic compressive and shear stresses, local tensions exist within the
fragmented bed because of its heterogeneous nature. For instance, local tensions can arise
from the presence of holes and pores, which act as stress concentrators. This feature has
been experimentally observed in other brittle granular materials like concrete [11]. The local
tensions give rise to the nucleation and growth of microcracks, leading to further
fragmentation of the bed. An attempt to account for these local tensile stresses has been
reported by Costin [12], who assumed that the magnitude of the local tensile stress acting
on a microcrack is proportional to the absolute value of the applied (macroscopic) deviatoric
stress and that the principal directions coincide with those of the applied macroscopic
stress. (Thus, in Costin's model, pure applied triaxial compression would not produce
local tensions, although in fact such local tensions are expected.)
We take a similar approach but assume that the local tensile stress experienced by the
microcracks is proportional to the absolute value of the maximum principal macroscopic
stress imposed on the material element, rather than proportional to the macroscopic deviator
10
60
stress. We further assume that there are flaws or cracks of radius r\B (T| is a small fraction,
on the order of 0.1) within each fragment of size B. Thus, there will be a potential for
comminution under local tensile stresses for any macroscopic stress state.
When these internal microcracks grow and coalesce, the fragments are broken into
smaller pieces, and the average size B progressively decreases.
6.3 Comminution rate
The incremental rate of change of B is SB/St, where SB is the difference between the
new size of the smaller fragments and the size B of the original fragment, and St is the time
for the crack to run across the original fragment, over a distance (l-ri)B = cqB, with the
crack velocity Vc. We assume that SB is proportional to B, SB = - o^B. That is, we
assume that comminution proceeds in a self-similar (fractal) manner.
Therefore,
dB SB (X2B
*"!T-^ = -AV< (1)
where A = ct^lo-l is a model constant.
In an analytical description of dynamic elastic crack growth, Freund [13] provides an
expression of the stress intensity factor Kj for a penny-shaped crack growing with velocity
5. V. K. LUK, M. J. FORRESTAL, and D. E. AMOS, J. Appl. Mech. 58(1), 1-6 (1991).
6. A. L. FLORENCE, P. R. GEFKEN, L. SEAMAN, D. R. CURRAN, and D. A.
SHOCKEY, Computational models for armor penetration. SRI International Technical
Report to Alliant Techsystems, Inc., Contract No. PO-635848-FN (1992).
7. D. R. CURRAN, L. SEAMAN, T. COOPER, and D. A. SHOCKEY, Int. J. Impact
Engng. 13(1), 53-83 (1993).
8. R. W. KLOPP, D. A. SHOCKEY, L. SEAMAN, D. R. CURRAN, and J. T. McGlNN, A
spherical cavity expansion experiment for characterizing penetration resistance of
armor ceramics. Proceedings of the ASME1994 Winter Annual Meeting Symposium
on the Mechanical Testing of Ceramics & Ceramic Composites, Chicago, EL
(November 6-11, 1994).
9. P. WOOLSEY, D. KOKIDKO, and S. MARIANO, Proceedings of the 6th U.S. Army
TACOM Symposium (1990).
10. D. R. CURRAN, L. SEAMAN, and D. A. SHOCKEY, Phys. Reports 147 (5 & 6),
(1987).
11. S. MINDESS and J. YOUNG, Concrete, Prentice Hall, Englewood Cliffs, NJ (1981).
12. L. S. COSTIN, Mechanics of Materials 4,149-160 (1985).
18
68
13. L. B. FREUND, Dynamic Fracture Mechanics, pp. 338-339, Cambridge University
Press, Cambridge, England (1990).
14. M. M. CARROLL and A. C. HOLT, / Appl. Phys. 43, 1626 (1972).
15. L. SEAMAN, SRI PUFF 8 computer program for one-dimensional stress wave
propagation. U.S. Army Ballistic Research Laboratory Contract Report ARBRL CR-
00420 (March 1980).
APPENDIX. COMMINUTION CALCULATIONS
The rate of change of B is given by the following equation (see Section 6):
dB
\ 2CT \ TiB i-AC^i-^£-AcVTö7vT (AD
where A and r\ are material constants, Cs is the transverse sound velocity, Kprj is the
dynamic fracture toughness in mode I, CT is the absolute value of the maximum principal
stress, and
D^V- CA2) 2a \ r]
To integrate this relation over time, let x4 = B, so
4*3£=f=-AcsVT~r5^=-^V^~~F (A3)
Hence,
. x4dx ._, , 4 -==== - ACS dt (A4)
Vx2 - D
19
69
4 Integrating this expression from the initial size B[ = x; to the final size B = x4, we
obtain
ACs(t-ti) =-^[xVx2-D + D In (x + V X2 - D)] X
-[x3 Vx2 - D] X (A5) xi
The computation uses a known time increment At and an initial value of block size B;.
We proceed by first finding the time required to reach the final size B = Bent = D2 (where
dB/dt = 0). This time is given by
AQAtcrit = -^Y~ ln(VD) + j [3Dxi-\/x2-D + 3 D2
xln(xi + y x2- Dj+8xf^x2-D ] (A6)
Thus we know the time at which the comminution is completed for a given stress state
and initial size. Then, if the imposed time step is shorter than this time, we must interpolate
to find the appropriate block size.
Plots of B versus t showed that the relation is nearly linear; only near B = Bent does the
relation depart from linear. Hence, the relation can be easily approximated by
At = AtcritRBi~R
B, (A7)
or
B = B; -(Bj- Berit) -^- (A8) Atcrit
where B; is the initial size for any time, Bent is the critical size for the current stress, and
Atcrit is the time to reach that size from the current size [Eq. (A6)].
20
70
Copper Sabot
Tungsten Penetrator
Ceramic Steel
Yzzzzzzzzzzzzzzzm 6 mm
^^mm.
w»B»3^«i
-60 mm-
CAM-3673-34
Rgure 1. Schematic of the experimental setup for the penetration tests.
71
50 um
(b) 10 um
40|im
CPM-3673-24
Figure 2. Micrographs of a cross section in a partially penetrated sample of AIN, 1 cm below the impacted surface, (a) and (b) close to the penetrator; (c) 1 mm away from the penetrator.
72
(a) Overview 130 |im
(b) Detail 3 urn
CP-3673-23A
Figure 3. Micrographs of a cross section in a partially penetrated sample of AD-90,1 cm below the impacted surface and 1 mm away from the penetrator.
73
2-cm-dia EL506O Charge B-field
AMPCOLOY M
25.4 cm
Ceramic Specimen
Particle Velocity Loops
Section A-A
CAM-3673-9
Figure 4. Schematic of the spherical cavity expansion tests.
74
-1
!»&*■
■•.<<>■:«■
(a) 40 urn
(b) 10 jim
(c) 10 urn
CPM-3673-26
Figure 5. Micrographs of a cross section in an explosively loaded sample of AD-85; (a) 0.1 mm from the cavity wall; (b) 1.5 mm from the cavity wall; (c) 0.5 mm from the cavity wall.
75
(a) 10 um
(b) 20 um
CPM-3673-27
Figure 6. Micrographs of a cross section in an explosively loaded sample of AD-995. (a) Far from the cavity wall; (b) 4 mm from the cavity wall.
76
(c) 10 um
(d) 20|im
CPM-3673-28
Figure 6. Micrographs of a cross section in an explosively loaded sample of AD-995. (c) 1.5 mm from the cavity wall; (d) 0.3 mm from the cavity wall.
77
1 2 3
TIME (sec X10"6)
(a) AD-995
Og PIT I >l I H I | I I 1 I I ITT t| I II H I rnpTTItl HHMIIIH ri-f
20 r
% 15
£ 10
8 5 LU >
'I '"IH'IIIIIIIL ''' 11' 111
0.5 1.0 1.5 2.0 2.5 3.0
TIME (sec X10"6)
(b) AD-85 CAM-3673-35
Figure 7. Comparison between the calculated (dotted lines) and measured (solid lines) particle velocities in AD-995 (a), and AD-85 (b) at radii of 15,17.5, and 22.5 mm (5.0, 7.5, and 12.5 mm from the cavity wall).
78
1,11 ,
8 -
: o 6 ■
o ■ *~ ■
X - \ ; CM * t \
F ' • V .0 4 ' » \ - a> * • \ ■
c >s
■a * \l • CO LU 2 : 1; \ - CO " 1 / \ ^"Y"*-^ CO ■ /« \ ^^ — ■*"*—-..
HI ■/•* \ -" a. /' * . £ 0 \
\ ;
-? 10 15 20 25 30
TIME(sx10"7)
7 fc 11 in mi,! ,,,, ,, ■ 11111 ■ 111111
1,1 ' ' 10 15 20 25 30
TIME(sx10-7)
CAM-3673-36
Figure 8. Radial (solid lines) and circumferential (dotted lines) stress histories calculated in AD-995 (a) and AD-85 (b) 2.5 mm away from the cavity wall.
79
40
35 r
3U 1- : o ; T— ■ . F 2b u
LU N CO 20 h- Z L1.I ? u 15 < EC LL
10
5 r
i i i i i i
AD-85, Gage 0
' 10
TIME(sx10'7)
15 20
CAM-3673-37
Figure 9. Model simulation of comminution of AD-85 near the interface with the explosive. The solid line shows the decrease in the fragment size; the dotted line is the variation in the critical fragment size..
80
Ill
Z Ul
< cc u.
Bcrit t
\ —i V-'"
« B
TIME
(a) Small B0 or low stress loading rate
B B,
tu N W I- z in 2 O < CC LL
crit
TIME
(b) High B0 or high stress loading rate
CAM-3673-38
Figure 10. Schematic illustration of the combined influences of the stress history o(t) and initial fragment size B0 for model simulation of comminution.
81
The preceding article was submitted to the International Journal of Impact Engineering.
The reviewers pointed out a number of important issues. We need to show how ballistic tests on
aluminum nitride and AD-90 alumina relate to spherical cavity expansion tests on AD-85 and
AD-995. We also need to justify our use of Freund's (1990) crack growth analysis, which
assumes that a single crack is growing in an unbounded, homogenous, isotropic material under
uniform far-field tension, whereas any crack we are considering is growing in a bounded,
anisotropic, inhomogeneous material, possibly under far-field compression. Indeed, we need to
justify our claim that quasi-static linear elastic fracture toughness controls the growth of such
cracks. Finally, we need to study how changes in the various parameters effect the predicted
fragment sizes.
We will address these issues in our continuing ceramic armor modeling effort. In
addition to the above issues, we will consider how a bimodal distribution of fragment sizes, in
which large fragments are found immersed in a sea of much smaller fragments, might develop,
and how porosity, compaction, and fragment flow interrelate. We expect to submit a revised
manuscript that addresses these issues.
82
LIST OF PARTICIPATING SCIENTIFIC PERSONNEL
Donald A. Shockey, Associate Director and Principal Investigator
Richard W. Klopp, Research Engineer III
Lynn Seaman, Senior Research Engineer
Donald R. Curran, Scientific Director
Christine H. Kanazawa, Materials Scientist Poulter Laboratory SRI International Menlo Park, CA
and
Joseph T. McGinn, Visiting Scientist on leave from David Sarnoff Research Center
Princeton, NJ
Thibaut de Resseguier, Visiting Scientist ENSMA, L.E.D.
Site du Furoscope France
Marc Lichtenberger, Co-op Student University of Metz
France
83
84
FUTURE WORK
Based on the research results described above, SRI International has proposed to conduct
experiments and perform analyses to improve the penetration modeling capability in a follow-on
three-year effort. In Year 1, we will perform experiments in which we detonate a spherical
charge in confined Coors AD-85 and AD-995 ceramic and measure particle velocity at several
radii out from the charge using electromagnetic techniques. We will then characterize the
Mescall zone fragments as a function of radius from the charge using optical, scanning electron,
and transmission electron microscopy. We will emphasize measurement of fragment size
distributions and establishment of the microstructural deformation mechanisms leading to
fragmentation. In parallel, we will develop the computational model so that it will properly
reproduce the measured velocity histories and size distributions. The computational model will
be developed from separate models for brittle fracture (BFRACT), comminution, compaction,
and fragment flow (FRAGBED). Since the spherical wave experiment is one-dimensional in
spherical coordinates centered on the charge, the model will be implemented in a one-
dimensional hydrocode. In Year 2, we will implement the model in a fully three-dimensional
finite element code, DYNA3D, and use it to simulate spherical charge experiments. We will also
develop a tapered charge experiment to produce measurable, controlled granular flow, and then
characterize the resulting fragments and flow patterns using optical, scanning electron, and
transmission electron microscopy. We expect these comparisons will suggest modifications that
will improve the model. In Year 3, we will verify and, if necessary, modify the model by
simulating the tapered charge experiments.
85
APPENDICES
A. DAMAGE EVALUATION OF BALLISTICALLY TESTED CERAMIC TARGETS
B. PRESSURE/SHEAR EXPERIMENTS
Appendix A
DAMAGE EVALUATION OF BALLISTICALLY TESTED CERAMIC TARGETS
Recent work performed at Los Alamos National Laboratory (LANL) and SRI
International involving the examination of confined ceramic targets after attack by kinetic energy
warheads (KEWs) has led to an understanding of the micromechanisms of penetration.1 These
posttest target evaluations suggest that penetration, if the confinement is adequately maintained,
is controlled by the comminution and granular flow of ceramic material at the tip of the
penetrator. (This area is called the Mescall zone, in honor of John Mescall, who deduced its
presence and importance from results of his computational simulations of metal target
penetration.)2'3 Penetration resistance is controlled by the comminution and granular flow
properties of the ceramic material. These conclusions are supported by unsuccessful efforts to
correlate penetration resistance with conventional mechanical properties, such as fracture
toughness and tensile strength.4-5
An important next step is to characterize quantitatively the fracture damage and fragment
size distribution in and around the Mescall zone of ballistically tested ceramic armor packages.
The observations and data will be used to guide development of computational models of
ceramic pulverization and granular flow. This appendix describes the procedures and results of
quantitative damage evaluations in ballistically tested targets.
PROCEDURE
Ceramic targets were obtained from various sources as shown in Table A-l. Seven
targets had been impacted at zero degree obliguity with a tungsten alloy penetrator having a
length of 77.5 mm and a diameter of 7.75 mm. An eighth target, designated A4977-5-1, had
been impacted by a shaped charge jet and was received from Los Alamos toward the end of the
project. It was not sectioned.
To allow sectioning without crumbling or loss of material from the section surface, we
stabilized impacted targets by placing the target in a vacuum chamber, pumping to a partial
vacuum, pouring a two-component thermosetting epoxy into the evacuated cracks, and allowing
the epoxy to harden. On occasion the target was heated slightly to speed the hardening process
A-l
and to obtain stronger bonding between ceramic and epoxy. Several of the targets from Los
Alamos were received already stabilized with a two-component epoxy.
Table A-1
CERAMIC TARGET SOURCES
Velocity Target Source Ceramic (km/s)
TiB2 Los Alamos TiB2 9
4-1137 Sandia via UDRI AIN Classified 4-1139 Sandia via UDRI AIN Classified AL-SPARE-02 Los Alamos Al203 1.58 F6501 Los Alamos B4C 1.829 F6497 Los Alamos AD90 1.946 F6499 Los Alamos SiC 1.855 A4977-5-1 Los Alamos SiC Shaped charge jet
Sectioning of the targets was performed on a plane containing the direction of the
shotline. A band saw was used first to cut through the steel encasement. Sectioning of the
ceramic was done with a 1/16-inch-thick rotating diamond blade with a reciprocating target
holder. The wheel had to be redressed periodically to maintain cutting speed and the cutting
wheels wore rapidly, but the technique even allowed wafers to be cut. Workers at LANL
produced high quality surfaces of section using ion milling. Both procedures encounter little
difficulty cutting through the tungsten material embedded in the ceramic.
The sectioned surfaces, usually taken so as to contain the line of penetration, were then
lapped and polished to reveal the cracking pattern in the ceramic and the distribution of tungsten
penetrator particles in the target. Ceramic sections were ground plane on a 125 |im diamond pad.
Rough polishing was performed with a 20 Jim diamond pad, 15 |im diamond suspension, 9 Jim
diamond suspension, and 3 |im diamond suspension. Final polishing, when necessary, was
performed with 1 |iim alumina and 0.05 (xm colloidal silica. The in-situ fragments were usually
not readily discernable, but by applying a thin coating of silver, the fragment boundaries
contrasted in color with the fragments, and the fragment distribution and cracking pattern became
more easily recognized.
Polished sections were examined under various microscopes, depending on the extent of
fragmentation. The Wild Macroscope was used when magnifications of 1 Ox - 40x were needed
A-2
for areas far from the penetrator, the Zeiss metallograph was used for magnifications of 50x -
200x, and the scanning electron microscope (SEM) was used for magnifications of up to 20 kx in
the area near the penetrator.
Fragment sizes at various locations were determined from the macroscope, metallograph,
and SEM photographs. The lengths and widths of fragments were measured by hand or on a
LECO image analyzer. The highly polished samples were directly analyzed on the metallograph
by the image analyzer.
RESULTS
Below is a summary of the targets we chose for examination. All were confined and
impacted normal to their front surface with 77.5 mm long by 7.75 mm diameter tungsten alloy
rods at 1600 m/s. Several targets (4-1137 and AL-SPARE-02) had numerous splinters and
pullouts and were not salvageable; however, when other targets (4-1139 and A4977-5-1) began
to splinter, they were reepoxied and were sectioned successfully.
Figure A-l shows an overall view of a cross section through a boron carbide target. The
penetrator entered from above: only a small portion of the penetrator remains (the white area
near the rear of the target). The path of penetration is filled with densely packed ceramic
fragments that presumably originated in the Mescall zone. Classical Hertzian cone cracks and
lateral cracks (as described by Lawn et al.6) are evident on either side of the penetrator path.
Perpendicular sections reveal radial and median cracks. These macrocracks, however, are
thought to influence penetration behavior only indirectly by relaxing the confinement of the
ceramic block. The principal resistance to penetration derives from the comminution and flow of
material in the Mescall zone at the tip of the advancing penetrator. Thus we concentrated our
damage evaluation in and around this region.
For the polished samples, fragment lengths and widths were measured as previously
described. In several samples (4-1139, F6501, and F6497), Mescall zone fragments were trapped
and preserved in the tungsten penetrator and, isolated in this manner, could be photographed and
measured, as shown in Figures A-2 and A-3. These submicron particles were embedded in the
penetrator matrix, which contained large amounts of alloying additions such as iron, copper, and
nickel and was therefore softer than the primarily tungsten grains.
A-3
Penetrator Impact Site
1 cm
Hertzian Cone Cracks and Lateral Cracks
Refilled Penetrator Path
Penetrator Remnant
Rear of Target
CPM-3673-22B
Figure A-1. Polished cross section through the shotline of a confined B4C target.
A-4
50 (im
10 um
i es-;1
(c) 40 um
CPM-3673-24
Figure A-2. Micrographs of a cross section in a partially penetrated sample of AIN, 1 cm below the impacted surface. (a) and (b) close to the penetrator; (c) 1 mm away from the penetrator.
A-5
(a) Overview 130 um
(b) Detail 3|im
CP-3673-23A
Figure A-3. Micrographs of a cross section in a partially penetrated sample of AD90,1 cm deep below the impacted surface, 1 mm away from the penetrator.
A-6
Figure A-4 shows the damage in the titanium diboride target below the remnant of the
arrested penetrator. The Mescall zone is not well developed and fragments in the Mescall zone
are more prominent at the sides of the remnant, where they have undergone some granular flow.
Damage in the titanium diboride (TiB 2) target was quantified by counting cracks and
fragments on the polished cross section at distances of 1, 10, 25, 35, and 45 mm from the edge of
the penetrator, as shown in Figure A-5 (the outer radius of the target was about 50 mm). Most of
the fragmented material remained in place after being broken; only at the innermost radius was
there noticeable particle rearrangement. Fragment size distributions were determined in a small
region at each of these distances. Plots of cumulative number/area versus length and width were
constructed from these data (Figures A-6 and A-7). The mean dimension of the particles ranged
from approximately 1 urn adjacent to the penetrator to 2 mm at the largest radius.
To aid in comparing the fragment size distributions from several materials, we fitted the
length and width distributions to the following exponential form:
NLG = NL exp (-BLL) and NWg = Nw exp (-BWW) (A-l)
Here NLG is me number of fragments per unit area with lengths greater than L, NL is the total
number of fragments per unit area, L is the fragment length, and BL is the reciprocal of the mean
fragment length. Similar definitions pertain to the fragment width quantities Nwg, Nw, W, and
B\v- For convenience in the discussion, we further define the mean size quantities:
Lm = g£ and Wm = g^ (A-2)
Now let us reexamine Figures A-6 and A-7, which show the fragment size distributions for TiB 2,
and the fitted lines representing Equation (A-l). The exponential equations appear to fit these
data well at all ranges. Each curve extends over some small range of sizes: the large end is
determined by the maximum size seen in the cross section, the small end by the size that could be
clearly distinguished and counted at the magnification used. These curves emphasize that there
are many more particles, and much smaller ones, near the edge of the penetrator than there are a
few penetrator diameters away. The width distributions in Figure A-7 show a similar form to the
length distributions, suggesting that the particle shapes or aspect ratios do not change with
particle size or distance from the shotline.
A-7
s! rJ
! 1- V *'
-Jh>-. XT:
a#rvi:
5 mm
CP-3673-6
Figure A-4. Damage in the titanium diboride target.
A-8
Q. O
E o in
c CD E
"o CD Q. CO
CM m i-
en
'E
c: o
E ü in CO
CD
0 Q.
E o
CJ
TO oo
T3
75 0 -»—• co
■?:.' ' E o in CJ
c o
"■*—» o c **— CC CO CC CD D) CC E cc
■o
C^
CO
CD Q
E o
i euoz ||B0S9l/\|
i
< CD
A-9
10£
<V 10
E
< LU CC . < 104
CC LU Q.
DC LU CO
1 102
LU > < _J
= 10° Ü
~i 1—i i I I 111 1 1—i i i 1111 1 1—i i i I 111 1 1—i Mill) 1 1—i i i i 111 1 r
10
5 mm from Shotline
Distance From Shotline 10 mm 25 mm 35 mm 45 mm ■?"-"£> v P.,
*-1 i i i i 11111 _i i i i 111it _i i i i i 11
0.0001 0.001 0.01 0.1
LENGTH, L (mm)
_! I I I I I I I
100
CAM-3673-42
A-6. Cumulative fragment length distributions at various distances from the shotline for a ballistically tested TiB2 target.
A-10
10c
E E
< HI
< LU Q.
OC LU m
10c
10"
1 102
LU >
3 2 o 10U r
10"
~\—I I I I 11 ] 1—I—I I I 1111 1—I—I I II111 -1—I I I 11II 1—I—I I l(l>; 1—I—I I I 11 b
Distance From Shotline 10 mm ■v r 25 mm v r 35 mm "v ̂ 45 mm ■v ̂
_J I I I I I III Mil
-^ A--A-A-A
J i i i i i 11 l l i i i _! 'I I I I I I I I I
0.0001 0.001 0.01 0.1 1 WIDTH, W (mm)
10 100
CAM-3673-43
A-7. Cumulative fragment width distributions at various distances from the shotline for a ballistically tested TiB2 target.
A-ll
Similar size distribution plots are made for B4C, A1N, and AD90 in Figures A-8 through
A-13. In some of these plots, especially those for B4C, the data do not fit the exponential form
well. However, the data are also not linear in these log-log figures, so a simple power-law form
would also not work well. In spite of the fact that the equation does not fit the data well, the
parameters in the fit do give a rough indication of the mean size of the fragments and the
numbers of those fragments. Therefore, we used these fitted parameters to compare the results
from several target materials. In all these figures, the same trends toward larger and fewer
fragments occur as we move away from the shotline.
With the foregoing analysis of the fragment size distribution from ballistic tests on four
materials, we can now compare these distributions to attempt to understand the differences
between the responses of these materials. Figures A-14 and A-15 show plots of AL and Lm for
all four shots and all distances from the shotline. Let us especially examine Figure A-15
showing the variation of mean particle length Lm = BL"1- The fragment sizes for T1B2, AD90,
and A1N appear to be about the same for distances greater than one penetrator diameter from the
shotline. But the fragment sizes for B4C at these distances are about one order of magnitude
smaller. At the edge of the penetrator (the smallest distances shown in the figure), the materials
T1B2, AD90, and B4C give mean fragment lengths of 10 to 50 |im, whereas A1N gives a mean
length of 2 (im.
These differences in the mean fragment length suggest that the mechanisms for
fragmentation and comminution in the Mescall zone are somewhat different than the mechanisms
outside this zone. For example, the fragmentation outside the Mescall zone may correspond
more closely to traditional fracture mechanics processes and be related to the Kj.c value. But
within the Mescall zone, the inherent grain size of the material may play a larger role.
Figure A-16 shows a plot of the average fragment length, rather than the fitted length Lm
= BL~1, as shown in Figure A-15. The curves in Figure A-15 and A-16 are similar, suggesting
that the particular fitting function used is not critical in describing the fragment size distributions.
Figure A-17 shows the length-to-width ratios for all the materials at all ranges from the
shotline. Despite considerable scatter in the data, some general trends can be found. Most of the
aspect ratios fall in the range of 2 to 2.5, indicating a rectangular fragment size is typical. The
smallest aspect ratios occur in the Mescall zone, where the aspect ratio approaches 1.5. There is
also some trend toward different aspect ratios depending on the target material.
A-12
10c
■E 10c
E
< LU
S104
LU a. cc LU m 2
10' LU > I- < _J 3
ü10ür
i 11111 1—i—i i 11111 1—i— ii -1—| I I I I I I 1 1—I I I I I I | 1 1—I I I I I b
*• •,
10 -2
Mescall Zone
Distance From Shotline ♦
♦
--■■-■**«^.:
20 mm > ■ -
30 mm > '♦
40 mm
-> "Wvm, 50 mm >:"♦•.
»V •"
I I I I I 11 ll I I I I I 11 ll Ill I I I I I 1111 I—I—I I I 11 ll 1—I—I I I 11II
0.0001 0.001 0.01 0.1 1 10 100 LENGTH, L (mm)
CAM-3673-44
A-8. Cumulative fragment length distributions at various distances from the shotline for a ballistically tested B4C target.
A-13
■|0 i—i—i—i i 11111
^E 106
E
< LU DC
< 104
UJ a. cc HI m
I 102
LU >
Z5 2
10 0 _
10
-I—I I I I 111 -I—I I I 1111 1—I—I I I I III 1—I—I I I 11II 1—I—I I I I It
Mescall Zone
Distance From Shotline 20 mm 30 mm 40 mm 50 mm
V \
-2 I i i i i i i 111 i i i i i i 111 i 111 i i i Mini 1 1—i i i i i il 1 1—i i i I
0.0001 0.001 0.01 0.1 1 10 100 WIDTH, W (mm)
CAM-3673-45
A-9. Cumulative fragment width distributions at various distances from the shotline for a ballisttcally tested B4C target.
A-14
1 0 E 1 1 1 I I I I I I 1 1 1 I I I I l| 1 1 | 1 1 1 I I I I l| 1 1 1 I I I I l| I I c
Mescall Zone
< HI £T < 104
LU CL
CC LU CO
Z 10* LU > < _l
=> in0 ü 10
Distance From Shotline 4.5 mm 7 mm
11.5 mm 19 mm 24 mm 31 mm 40 mm
10" 0.0001
i i i i 111ii i i i i i 11111 i i i i 111ii i—i—i i 111ii 1—i—I i 1111
0.001 0.01 0.1 LENGTH, L (mm)
10 100
CAM-3673-46
A-10. Cumulative fragment length distributions at various distances from the shotline for a ballistically tested AIN target.
A-15
10£
< LU DC
til D. □C LU CO
LU >
3
| 10°
H I I ! I I I I -m 1 1—I I I I TT] 1 1 1 I I I I I | 1 1 1 I I I I I | 1 1 1 I I I I b
Mescall Zone
10 -2
Distance From Shotline
*r ■ _■
A
4.5 mm 7 mm
11.5 mm 19 mm 24 mm "---^ ♦ 31 mm ~-^. ö
40 mm
.\
' »in i i l l i i 111 i i i i i 111 i i i i i i i i i i i i i i J I I I M I I
0.0001 0.001 0.01 0.1 WIDTH, W (mm)
10 100
CAM-3673-47
A-11. Cumulative fragment width distributions at various distances from the shotline for a ballistically tested AIN target.
A-16
10° F
^ io6
< LU <r
UJ 0. CC LU m
iio2
LU >
3
|io°
~i—i—i i 11111 1—i—i i 11111 1—i—i i 11111 -i—i i 11111 1—i—i i 11111 1—i—i i 111H
'-*-M^
Distance From Shotline 10 mm 20 mm
Mescall Zone
1 o I 1—i—i i 111il 1—i—i i 111il 1—i—i i 11111 i i i i i ii i i i i 111H
0.0001 0.001 0.01 0.1 1 10 100 LENGTH, L (mm)
CAM-3673-48
A-12. Cumulative fragment length distributions at various distances from the shotline for a ballistically tested AD90 target.
A-17
1 0 E 1 1—I I I I I I | 1 1—I I I I I I |
'<■•*
CM
< ill cc < cc LU 0_
CC LU 00 :s Z LU >
10c
10"
10'
3
I 10° t
10"
I I 1111 1—I—I I I I 111 -I—I—I I I I 111 1—I—I I I 11 fcj
Mescall Zone
Distance From Shotline 10 mm >
20 mm
0.0001 0.001
I I I I I I 111 I I I I I I 111 I I I I I I 111 I I I I I I I I [ I 111 I I I I I I 11
0.01 0.1 WIDTH, W (mm)
10 100
CAM-3673-49
A-13. Cumulative fragment width distributions at various distances from the shotline for a ballistically tested AD90 target.
A-18
10e
cjT 106
E E
cc UJ
< cc < a.
g 10' LU Q
CL LU CO
10u r
10"
E 1 T 1 | 1 1
f
1 ' ' ' 1 i i ' i ■ ' ■ =
r\x^ -_
;bs\^""\^ '-
- ~~* ^~~-~~^ z
- '• \ ^^-^ I :
AIN — : ;
\\"^ ~— B4C _
r \ N
AD90 —
: , \ \ TiB2 -
■ \\*~^C :
_ •' I *>- __ ■ •• I -
■ \ \ " ""^ ;
\ - ~ "» x \ 1
'*■• \
:
*»\ r A \--_ "I ■ ^-5i- z
i i i 1 i i i l i i i 1 1 1 1 1 1 1 1
20 40 60
DISTANCE FROM SHOTLINE (mm)
80 100
CAM-3673-50
A-14. Number density parameter, A, as a function of distance from the shotline for bailistically tested AIN, AD90, B4C and TiB2 targets.
A-19
10 T 1 1 r -| 1 1 1 1 1 p 1 1 1 1 1 1 1 1 1 1 1 1 1 1 1 1 1 1—:
0.0001 -J I 1 I I 1_ _l I 1_ J I I I l_ _L _J i i i i_
10 20 30 40 DISTANCE FROM SHOTLINE, D (mm)
50 60
CAM-3673-51
A-15. Fragment length parameter, B'1, as a function of distance from the shotline for ballistically tested AIN, AD90, B4C, and TiB2 targets.
A-20
1 o c—i—i—i—i—i—i—i—i—i—r
E E
O) > CO
0.1 X H o z LU _J I- z LU
g 0.01 cc LL LU Ü < CC LU
< 0.001
0.0001 I—i—i
n 1 1 1 1 1 1 1 r
[■■
'\
/
L
' I I I I I I I 1 I I I I I I l_
10 20 30 40 DISTANCE FROM SHOTLINE, D (mm)
50 60
CAM-3673-52
A-16. Average fragment length as a function of distance from the shotline for ballistically tested AIN, AD90, B4C, and TiB2 targets.
A-21
3.5
> CO
"o 2.5 > CO
<
•- 2 O UJ CL CO <
1.5 it-
T
1 —i 1 1 1 1 1 1 r— i | i 1 i 1 i i i
-
A
-
-
■ ' " A ^—
-
- " '"' ^^~^^ - TiB2
A
■ ■
■ .^£—^1 AIN
-
B,,C
AD90
- ' / ; 1
h -
i ' 1 I 1 1 1 1 1 1 1 1 1 ' i i i i
20 40 60 DISTANCE FROM SHOTLINE (mm)
80 100
CAM-3673-53
A-17. Fragment aspect ratio as a function of distance from the shotline for ballistically tested AIN, AD90, B4C, and TiB2 targets, with exponential least squares fits to the data.
A-22
REFERENCES
1. D. A. Shockey, A. H. Marchand, S. R. Skaggs, G. E. Cort, M. W. Burkett, and R. Parker, "Failure Phenomenology of Confined Ceramic Targets and Impacting Rods," Int. J. Impact Engng., 9, 263-275 (1990). Printed in Great Britain.
2. J. Mescall and C. Tracy, "Improved Modeling of Fracture in Ceramic Armor," Proceedings of the 1986 Army Science Conference, U.S. Military Academy, West Point, 17-20 June 1986.
3. J. Mescall and V. Weiss, "Materials Behavior Under High Stress and Ultrahigh Loading Rates—Part II," Proceedings of the 29th Sagamore Army Conference, Army Materials and Mechanics Research Center, Watertown, Massachusetts, U.S.A. (1984).
4. D. Viechnicki, W. Blumenthal, M. Slavin, C. Tracy, and H. Skeele, "Armor Ceramic— 1987," Proceedings of the Third TACOM Armor Coordinating Conference, 17-19 February 1987, Monterey, California, U.S.A.
5. W. Rafianello, B. Brubaker, and R. Hoffman, "Evaluation of a New Low-Cost Aluminum Nitride Armor," Proceedings of the Fifth TACOM Armor Coordinating Conference, 7-9 March 1989, Monterey, California, U.S.A.
6. B. Lawn and T. R. Wilshaw, "Review of Indentation Fracture: Principles and Applications," J. Mater. Sei 10, 1049-1081 (1975).
A-23
Appendix B
PRESSURE/SHEAR EXPERIMENTS
Because the pressure/shear plate impact experiment can controllably reproduce the stress,
strain, and loading rate conditions that exist ahead of a long rod penetrating armor ceramic, the
experiment could provide a way to examine the behavior of ceramic material in the Mescall
zone. However, if slip or failure of the impacting plates occurs, instrumentation records will not
accurately provide a material response. Thus, we performed pressure shear experiments to
determine whether slip or failure occurs, and thereby determine the usefulness of the technique.
BACKGROUND
In the pressure/shear experiment, two parallel plates are impacted at an oblique angle
with respect to the direction of approach (Figure B-l), creating conditions of both compression
and shear in the plate material.1 By varying the obliquity and velocity, the relative amounts of
compression and shear can be, to some degree at least, independently controlled. Usually,
impact velocity and particle velocity at location(s) along the axis normal to the plate and running
through the center are measured. The experiment is ideally one-dimensional until release waves
from the plates' periphery arrive at the measurement location(s). If the impact faces do not slip
relative to each other, the experiment can be analyzed by considering solely the target plate and
applying a step function, velocity boundary condition to the impact face. Constitutive behavior
is inferred from the analysis.
Pressure/shear experiments have been applied to deduce the constitutive behavior of
several ceramics, including aluminum nitride,2 silicon carbide,3 and Coors AD-85 and AD-99.5
aluminas.2 In the experiments described by Klopp and Shockey,2»3 the measured shear strengths
have been significantly lower at a given mean stress than strengths reported by others using
Hopkinson bar and normal (non-inclined) plate impact techniques. In the case of AD-85, at a
mean stress of 3.5 GPa, the shear strength obtained in pressure/shear experiments was 1.1 GPa,
whereas the strength obtained by normal plate impact was 2.8 GPa.2 Similarly, at a mean stress
of 6.5 GPa, the pressure/shear strength of AD-99.5 was 1.8 GPa, whereas the normal plate
impact strength was at least 4 GPa.2 In the pressure/shear experiments described by Klopp and
B-l
Ceramic Flyer Plate
V„
Ceramic Anvil Plate
Laser Beams for Particle Velocity Diagnostics
RAM-8521-78
Figure B-1. The symmetric pressure/shear experiment.
B-2
Shockey,2-3 velocities transverse to the plates were measured at the center of the rear, free
surfaces of the target plates using a laser Doppler velocimeter (LDV).
The disparity between the strengths measured using pressure/shear and the strengths
measured using other techniques must be understood if the pressure/shear measurements are to
be valid. The disparity could have arisen from two experimental idiosyncrasies that would
invalidate the measurements. First, the impact faces could have slipped relative to each other,
thereby applying a velocity boundary condition of unknown, possibly time-varying amplitude to
the target plate. Subsequent analyses to deduce constitutive behavior would be using the wrong
input. Second, the target plate in the region of the LDV measurement could have failed
catastrophically in tension, thereby perturbing the velocity pulse carrying the constitutive
information to that location. Subsequent analyses would be comparing the wrong output.
Tension failure could have occurred along planes at 45° to the plane of the plate when the shear
wave, lagging the compression wave, ran into the decompressed region adjacent to the free target
rear surface.
OBJECTIVES
Our objective in this task was to investigate whether front face slip or back face failure
could have occurred in the pressure/shear experiments described by Klopp and Shockey.2'3 If
front face slip or back face failure occurred, then those measurements are invalid. Conversely, of
course, if slip or failure were unlikely, the measurements could still be invalid for other reasons.
APPROACH
Our approach was to perform pressure/shear experiments in which the target impact face
and rear face transverse particle velocities would be known a priori. We then measure the
velocities directly using embedded magnetic gages. If slip does not occur between the impact
faces, then the impact face velocity should jump to one-half the transverse component of the
impact velocity and remain there. The rear face velocity should be the same as measured
previously using the LDV, or one-half that velocity if the rear face is covered with another layer
of ceramic, as was the case in the experiments to be described.
Two experiments were performed, one on AD-85 and one on AD-99.5. Figure B-2
depicts the geometry of the tests. The flyer plates were simple disks 49 mm in diameter and 5.1
mm thick, inclined at 15° with respect to the launch direction. The targets were composed of two
plates sandwiched together in ceramic-to-ceramic contact. U-shaped, constantan wire, particle
B-3
AI2O3 Flyer
Magnetic Field AI2O3 Target
Oblique View
Particle Velocity Gages
Al203 Back Plate
Gage Leads
Side View CAM-3673-54
Figure B-2. Pressure/shear experiment to detect slip.
B-4
velocity gages were embedded in laser-cut, 100-um-deep grooves cut in the impact and rear
faces of the front plate. The impact face gage leads exited toward the rear through drilled holes.
The front plates were 49 mm in diameter and 5.1 mm thick. The back plates were 25 x 30 mm
rectangles 4 mm thick. The back plates covered the particle velocity gage in the rear surface of
the front plate and were held in place with short fillets of glue at their edges. If the interface
between the front and back plate do not slip, then the rear gage is effectively an "in-material"
gage.
The impact experiments were performed in SRI's 65 mm gas gun facility. The gun has a
slotted barrel to prevent projectile rotation and thereby maintains alignment of the impact faces.
Impact occurs in a muzzle tank that is evacuated to < 100 mtorr to prevent formation of a
lubricating gas cushion between the impact faces.
Particle velocities were measured using the IMPS technique developed by Gupta.4 To
measure velocities using the technique, the target containing the U-shaped gages is placed within
a magnetic field that is uniform in the proximity of the gages and oriented such that the field
vector is perpendicular to the target plate. In our facility, the field orientation is changed by
adjusting independently the current in orthogonal solenoid and Helmholtz coils. The active
element of the particle velocity gage is the bottom of the U, which is oriented perpendicular to
the direction of shear. When the active element moves in the magnetic field, it generates a
voltage proportional to its length and the field amplitude, which are known beforehand, and the
transverse velocity. The vertical legs of the U and the leads exiting toward the rear do not
contribute to the generated voltage.
RESULTS
The impact velocity in the AD-85 experiment was 430 m/s, and the tilt, or lack of
parallelism, of the impact faces was 0.3 mrad. The impact velocity in the AD-99.5 experiment
was 414 m/s, and the tilt was not recorded. The measured and anticipated results are compared
in Figure B-3. The AD-85 impact face record little resembles the record anticipated in the case
of no slip. For the first 0.45 |is of the impact face record, the transverse velocity rises well above
the anticipated value for no slip (56 m/s) and exceeds the range of the recorder, then falls rapidly
to around 10 m/s. The back face record goes negative for the first 0.2 |j.s, then rises erratically to
well above the velocity anticipated for fully elastic behavior and full slip between the front and
back target plates. The record also exceeds the range of the recorder. The back face record goes
negative at the time the compression wave is anticipated to arrive, and shows that the gage is
B-5
. AD-85
E
ü O _i LII > UJ CO a: LU > CO z <
.100 -
50 -
-50 -
i I I '■■■■'
< 2 -50
■ I i__i i i—L i ■ ■ ■
r-
o.o 0.5 1.0
TIME (us)
1.5
1 ■ ■ I 2.0
CAM-3673-55
Figure B-3. Measured (solid) and predicted (dashed) particle velocity histories.
(a) AD-85. Missing segments were out of range, (b) AD-99.5.
B-6
unexpectedly sensitive to the longitudinal motion. We do not know why; the low tilt (0.3 mrad)
suggests that the initial, transverse component of motion induced by the tilted compression wave
should not exceed 3 m/s.5 The AD-99.5 impact face gage record first goes negative for 0.1 JLLS,
then rises erratically over another 0.1 |is toward an average of about 36 m/s. The anticipated
velocity in the case of no slip was 54 m/s. The back face record begins going negative with the
arrival of the compression wave, then turns positive slightly before the anticipated arrival of the
shear wave, and rises erratically toward the velocity (54 m/s) anticipated for full slip between the
front and back target plates.
DISCUSSION
The two pressure shear experiments just described do not determine unequivocally
whether front face slip or back face failure occurred in prior pressure/shear experiments.
Although the front face velocities failed to reach levels corresponding to no slippage and the
back face velocities approached levels corresponding to full slippage, idiosyncracies in the
transverse velocity records associated with the longitudinal waves suggest that the particle
velocity gages were not performing as anticipated, and the results should therefore be viewed
skeptically. Possibly, gaps between the gage wires and groove sides allowed the wires to move
independently of the ceramic. Indeed, for the duration of each experiment before relief wave
arrival, total transverse displacements on the order of 130 |im were anticipated. Gaps between
the wires and grooves could have been as large as 50 p.m. Gaps were filled with cyanoacrylate
adhesive before the experiments, but bubbles were visible in the region between the wires and
groove walls. No effort was made to bias the wires toward the sides of the grooves in the
direction of the oncoming ceramic.
Comparison with Prior Pressure/Shear Results
The results are ambiguous, but the evidence more readily supports the argument that
slippage was occurring. Therefore, our previous pressure/shear results2-3 that suggest very low
ceramic strength levels should also be viewed skeptically.
Comparison with Spherical Cavity Expansion Results
Further evidence to suggest that the pressure/shear test results are invalid is provided by
the results of the spherical wave tests and analyses. There, faithful computer reproduction of the
3 B-7
experimentally measured particle velocities required the use of high ceramic strengths similar to
those obtained by others in normal plate impact experiments.2
REFERENCES
1. A. S. Abou-Sayed, R. J. Clifton, and L. Hermann, "The Oblique-plate Impact Experiment," Exp. Mech. 16(4) 127-132 (1976).
2. R. W. Klopp and D. A. Shockey, "Tests for Determining Failure Criteria of Ceramics Under Ballistic Impact," SRI International Final Report to U. S. Army Research Office on Contract DAAL03-88-K-0200, June, 1992.
3. R. W. Klopp and D. A. Shockey, "The Strength Behavior of Granulated Silicon Carbide at High Strain Rates and Confining Pressure," J. Appl. Phys. 70(12) 7318-7326 (1991).
4. Y. M. Gupta, "Shear Measurements in Shock-Loaded Solids," Appl. Phys. Lett. 29(11) 694- 697 (1976).
5. R. W. Klopp and R. J. Clifton, "Analysis of Tilt in the High Strain Rate Pressure-Shear Plate Impact Experiment," J. Appl. Phys. 67(11) 7171-7173 (1990).


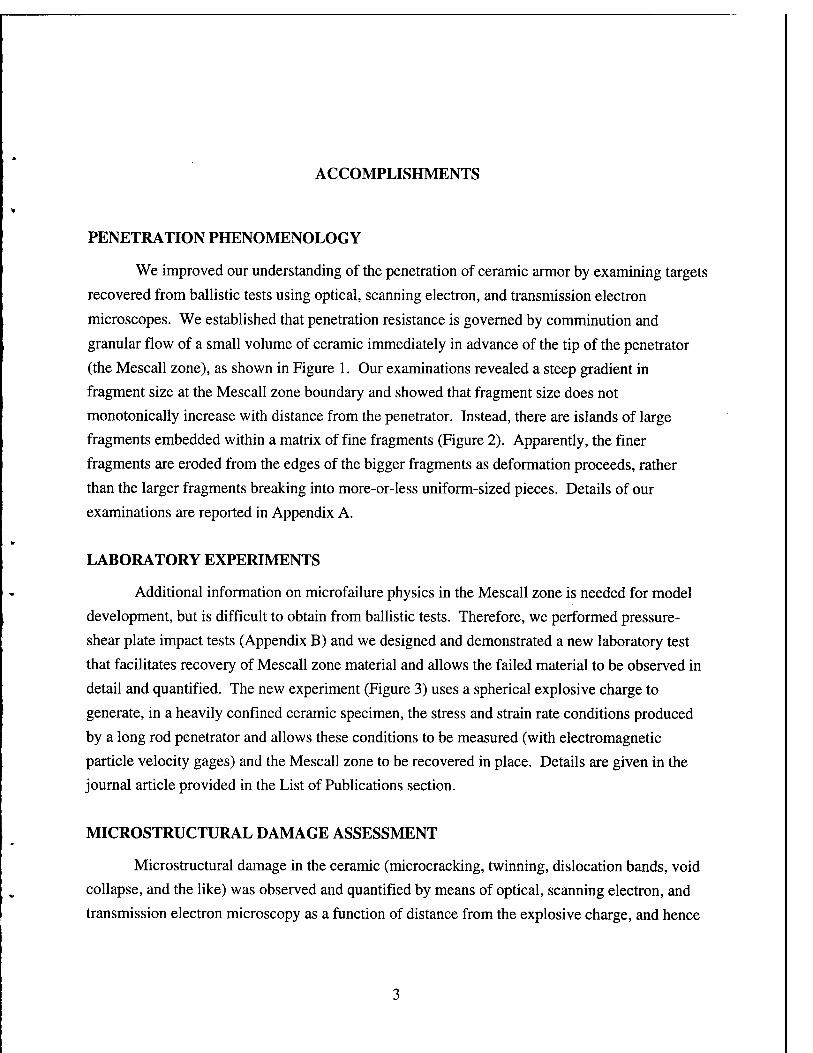


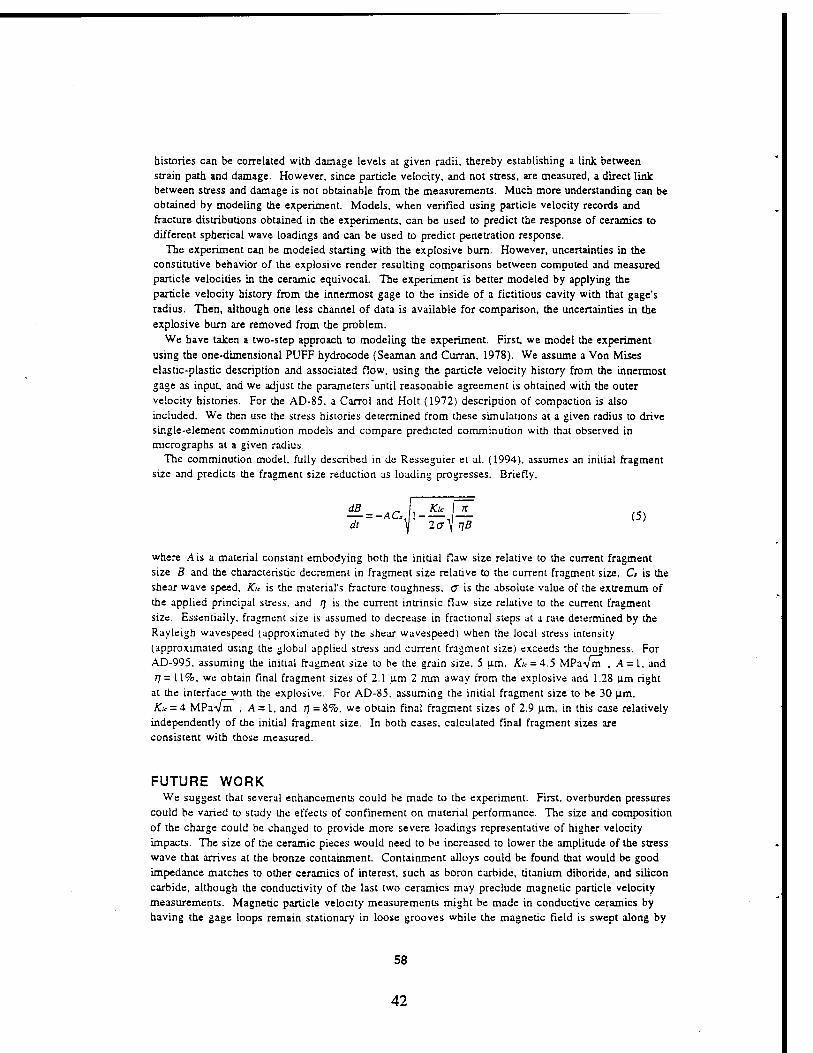


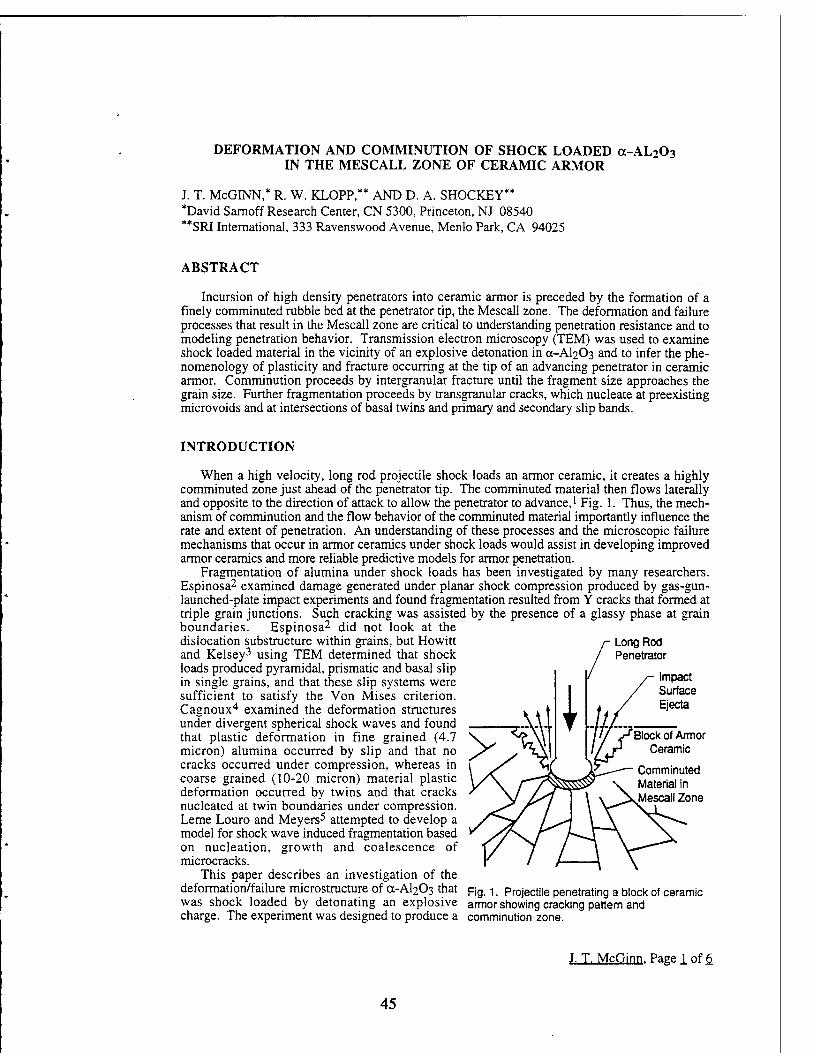


![Thermal Conductivity of Thick Film Tungsten Metallization ... · the metallization/ceramic interface adhesion mechanism which has been explained by the glass penetration theory [3].](https://static.documents.pub/doc/80x56/5e9504fbc2e4a97df63c0bd5/thermal-conductivity-of-thick-film-tungsten-metallization-the-metallizationceramic.jpg)


