Abstract Impact energy studies were carried out for different grades of carbon steel, aluminum and stainless steel. There was a decrease in energy absorbed as the carbon content was increased or the temperature was decreased. Heat treatment had a positive effect on the amount of energy absorbed. A smaller grain size caused by normalizing increased the amount of energy absorbed in a material. A transition temperature, DBTT, was observed in materials with a BCC crystal which was lacking in the FCC materials studied. Introduction In today’s emerging technologies, advances in material preparation and processing has taken the forefront. This has led to an increased need in understanding the material characteristics such as mechanical, optical, electrical, morphological properties. One of the critical properties studied for various materials is the ability to absorb energy in impact. This data is crucial for various industries such as the transport, military and aviation industries [1]. As a result, impact tests have been designed to measure the resistance to failure of a material to a suddenly applied force. The common methods of testing this property are Charpy, Izod, low velocity and high velocity impact tests. For metals, in order to study the impact properties and in particular low velocity impact properties, Charpy impact test is preferred. Charpy impact test determines the energy absorbed by a material or its impact toughness and is a standardized high strain rate test. The basis of the test lies in the conversion of the potential energy in the hammer to kinetic energy as it strikes the material. It is important to note that Charpy test are a relative mode of analysis i.e. they are relative and best understood through comparative studies. The study tries to focus on the effect of temperature, heat treatment methods, carbon content as well as crystal structure on
Transcript
Abstract
Impact energy studies were carried out for different grades of carbon steel, aluminum and stainless steel. There was a decrease in energy absorbed as the carbon content was increased or the temperature was decreased. Heat treatment had a positive effect on the amount of energy absorbed. A smaller grain size caused by normalizing increased the amount of energy absorbed in a material. A transition temperature, DBTT, was observed in materials with a BCC crystal which was lacking in the FCC materials studied.
Introduction
In today’s emerging technologies, advances in material preparation and processing has taken the forefront. This has led to an increased need in understanding the material characteristics such as mechanical, optical, electrical, morphological properties. One of the critical properties studied for various materials is the ability to absorb energy in impact. This data is crucial for various industries such as the transport, military and aviation industries [1]. As a result, impact tests have been designed to measure the resistance to failure of a material to a suddenly applied force. The common methods of testing this property are Charpy, Izod, low velocity and high velocity impact tests.
For metals, in order to study the impact properties and in particular low velocity impact properties, Charpy impact test is preferred. Charpy impact test determines the energy absorbed by a material or its impact toughness and is a standardized high strain rate test. The basis of the test lies in the conversion of the potential energy in the hammer to kinetic energy as it strikes the material. It is important to note that Charpy test are a relative mode of analysis i.e. they are relative and best understood through comparative studies.
The study tries to focus on the effect of temperature, heat treatment methods, carbon content as well as crystal structure on the ability of materials such as carbon steels, stainless steel and aluminum to absorb energy on impact.
Procedure
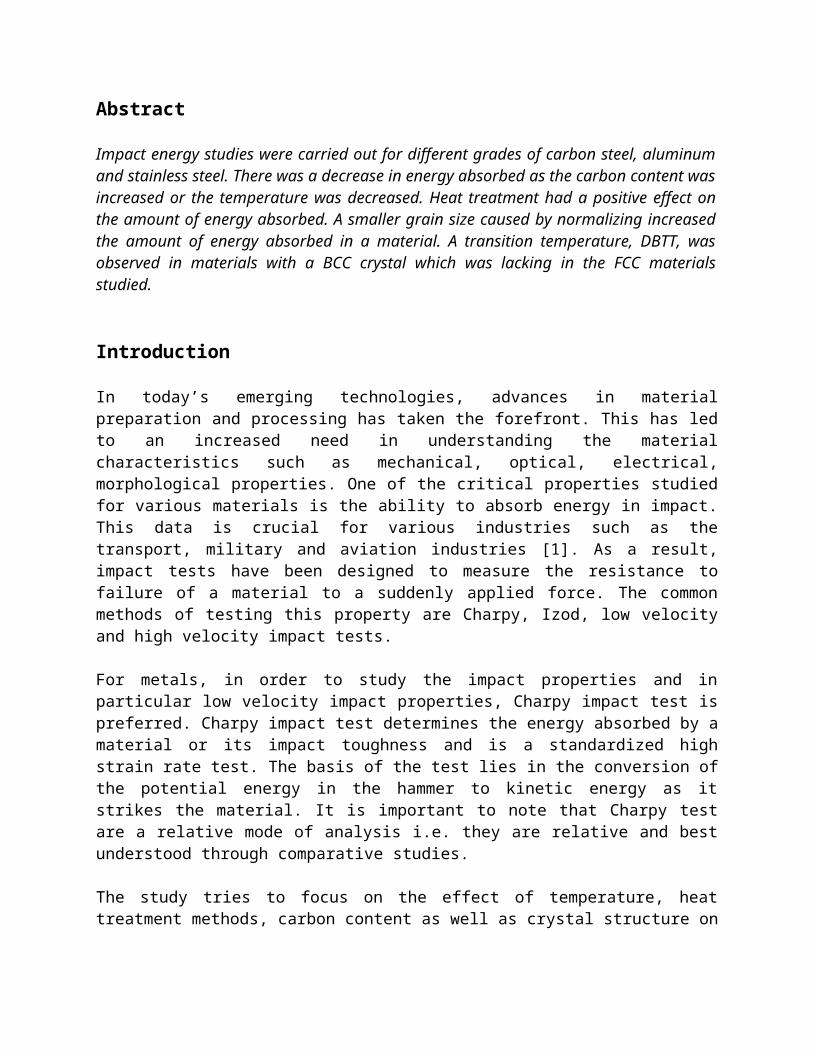
The tests were all done as per ASTM E23 standards and were carried out on the Impact test machine as shown in Figure 1[2]. The various materials used for the tests were two sets of plain carbon steel (1018, 1045, 1095), Aluminum (6061- T651) and stainless steel (304). One set of plain carbon steels were also normalized in order to understand the effect of heat treatment. 1018 was normalized at 915oC and 1045, 1095 were normalized at 860oC.
The other set of plain carbon steel, which were cold finished, were kept at different temperatures to study its effect. The temperatures selected were 22oC which was room temperature, 0oC which was in an ice bath, 100oC which was in boiling water, -196oC which was in liquid nitrogen and 250oC which was in a furnace. Only one sample per criteria was tested. There could have been a potential error while transferring the specimen to the tester as it was more than 5 seconds for some of the samples [2].
Figure 1: Charpy impact testing machine
Results
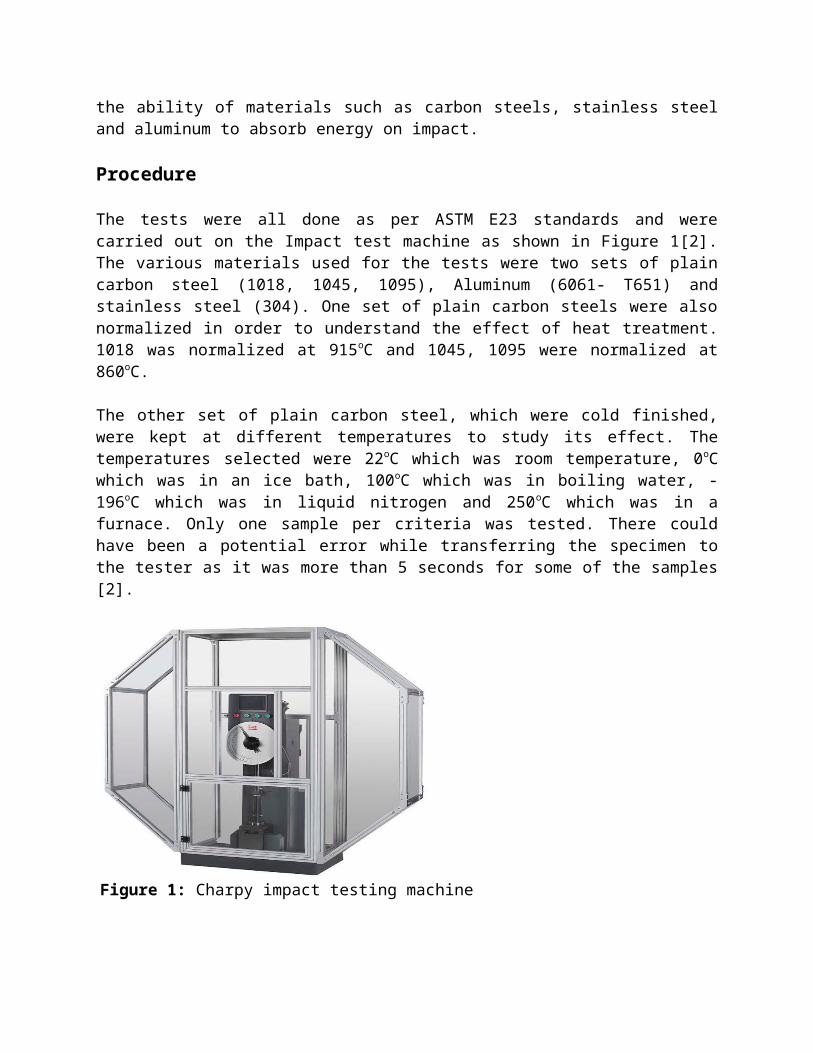
Table 1: Impact energies for different materials at different temperatures and heat treatments
Impact Energy (J)Plain Carbon Steel Aluminum Stainless SteelCold Finished Normalized
Table 2: Fracture surface analysis for the various materials at different temperatures
Fracture Surface
Plain Carbon Steel AluminumStainless
Steel
Cold Finished Normalized
Temperature (ᵒ C) 1018 1045 1095 1018 1045 1095 6061 304
-196
Mixed fracture
with hints of ductile
and brittle failure modes
Brittle fracture
Pure brittle
fracture
Mixed fractu
re with hints
of ductile and brittle failure modes
Pure brittle
fracture
Pure brittle
fracture
Ductile Failure with pronounced shear lips on
the edges and a highly
rough fracture surface
Ductile Failure
with pronounced shear lips on
the edges and a highly rough
fracture surface
0
Ductile fracture
with rough
surface on the
fracture
Brittle fracture with a hint of rough
surface
Pure brittle
fractureNA
Mixed fracture with a rough
fractured surface
Pure brittle
fracture
Ductile Failure with pronounced shear lips on
the edges and a highly
rough fracture surface
Ductile Failure
with pronounced shear lips on
the edges and a highly rough
fracture surface
22
Ductile fracture with hint
of formation of shear
lips
Mixed fracture with a rough
surface at fracture
Pure brittle
fractureNA
Mixed fracture with a more
pronounced ductile
failure with
formation of shaer
lips
Mixed fracture with a hint of shear
lip formati
on
Ductile Failure with pronounced shear lips on
the edges and a highly
rough fracture surface
Ductile Failure
with pronounced shear lips on
the edges and a highly rough
fracture surface
100
Ductile fracture
with rough
surface with
slightly pronounced shear
lips
Mixed fracture with a more
pronounced ductile
failure with
formation of shaer
lips
Pure brittle
fractureNA
Ductile fracture
with rough
surface and high degree
shear lip formation
Mixed fracture with a hint of shear
lip formati
on
Ductile Failure with pronounced shear lips on
the edges and a highly
rough fracture surface
Ductile Failure
with pronounced shear lips on
the edges and a highly rough
fracture surface
250
Ductile fracture
with rough
surface and high degree
shear lip formation
Ductile failure with
shear lip formation
on the edges
Mixed fracture with a hint of shear
lip formati
on
NA
Ductile fracture
with rough
surface and high degree
shear lip formation
Mixed fracture with a hint of shear
lip formati
on
Ductile Failure with pronounced shear lips on
the edges and a highly
rough fracture surface
Ductile Failure
with pronounced shear lips on
the edges and a highly rough
fracture surface
Figure 2: Effect of carbon content on the impact energy for plain carbon steel
Figure 3: Effect of temperature on 1018 cold finished plain carbon steel
Figure 4: Effect of normalizing on 1045 plain carbon steel
DBTT
45
Figure 5: Comparison of impact energies for FCC aluminum 6061 and stainless steel 304
(a) (b)
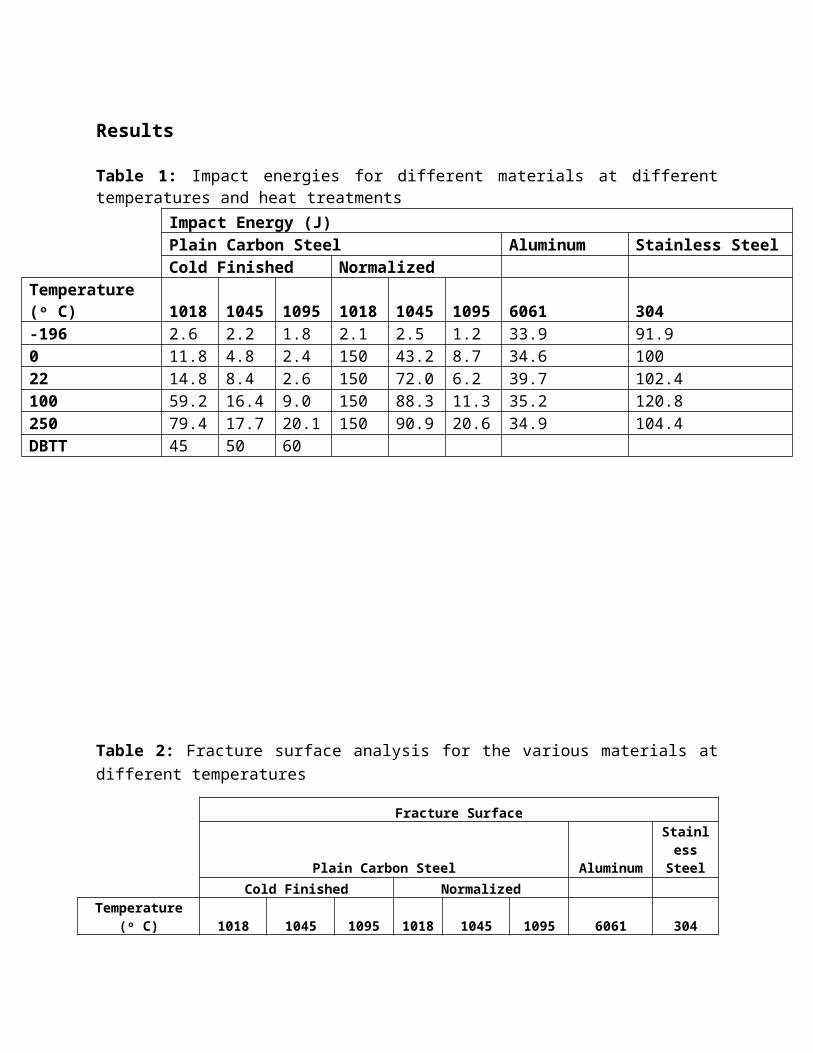
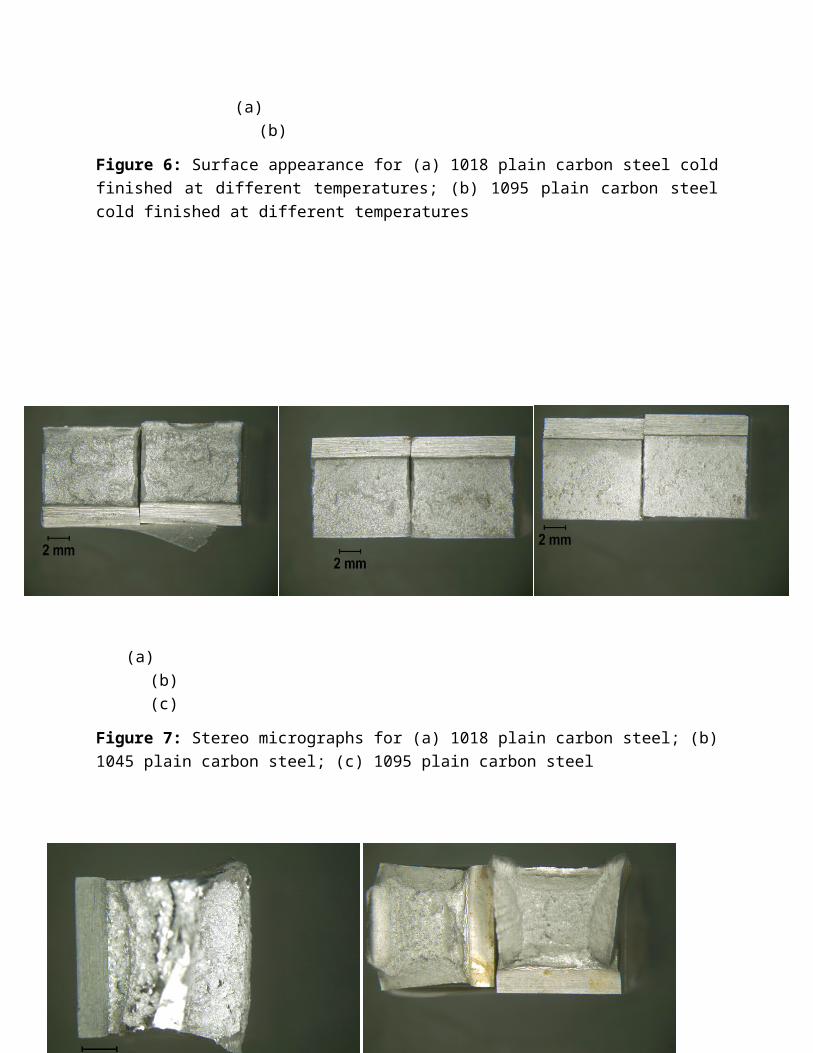
Figure 6: Surface appearance for (a) 1018 plain carbon steel cold finished at different temperatures; (b) 1095 plain carbon steel cold finished at different temperatures
Figure 8: Stereo micrographs of the cracked surface for (a) Aluminum 6061; (b) stainless steel 304
The above set of data and figures captures the essence of the impact tests carried out. Table 1 summarizes the impact energies for the various materials used at different temperatures. It helps summarize the trends in order to see the effects of temperature, heat treatment, carbon content and crystal structure on impact energy. Table 2 describes the fracture surface of the various grades of materials under different temperatures and heat treated conditions. As the carbon content is increased or the temperature is decreased, the fracture surface increasingly becomes more brittle in nature. Also normalizing the material showed a higher degree of ductile fracture as compared to cold finished specimens.
Figure 2 shows a definite trend of reduction in impact energy as the carbon content is increased in plain carbon steels. Figure 3 shows the effect of temperature and also a pronounced rise called the Ductile to Brittle Transition Temperature (DBTT) for plain carbon steel. Figure 4 depicts the effect of normalizing plain carbon steels on impact energies. An increase in impact energy is observed as the specimen is normalized. Figure 5 shows the effect of bond strength on FCC crystal structures. A stronger bond seems to show a higher amount of energy absorbed during impact.
Figure 6 shows the fracture surface topography for plain carbon steels. A smoother surface is noticed as the carbon content is increased. Figure 7 is a stereo microscopic image of the plain carbon steels to have a closer look of the fracture surface. Figure 8 looks at the fracture surface for aluminum and stainless steel. The image confirms that the fracture surface is actually that of a ductile material.
Discussion
Effect of carbon content:
Carbon atoms, which have a much smaller diameter as compared to iron, tend to move to interstitial positions within the crystal structure. As a result, when a dislocation is moving, these carbon atoms act as a barrier where additional energy is required to move the dislocation past the carbon atoms. As a result, the material is stronger. As the carbon content is increased, the amount of these interstitial sites filled increases thus making it even harder for dislocations to move [3]. It is also known that for materials, as the strength increases the ability to absorb energy decreases. This effect can be seen on Figure 2. As the carbon content is increased from 0.18% to 0.95%, the amount of energy it can absorb significantly reduces.
Another key factor is the change in crystal structure as carbon fills the interstitial sites. The structure of the crystal changes from BCC to tetragonal [4]. This effectively means that the dislocation has to jump a greater distance in the tetragonal structure as compared to BCC. At
higher carbon content, the number of crystals which are distorted are higher. As a result, the number of slip systems reduce making the material behave more and more like a brittle material. This trend is confirmed by stereo microscopic images which are shown in Figure 6 and 7. As the carbon content is increased, the fractured surface seems smoother. This is because the material gets less ductile as carbon content is increased and thus the fracture is clean. In the case of 1018 steel, there are shear lips formed and the surface topography is very rough which is a strong indicator of ductile failure. When the surface of 1095 steel is studied, the surfaces are smoother and there is no sign of a shear lip.
Effect of temperature:
Temperature plays a significant role in the behavior of materials. The number of vacancies, and the ease of slip system movement is strongly correlated to the temperature. As temperature increases, the number of vacancies increases. As a result, at higher temperatures, the material behaves more ductile as compared to lower temperatures. This effect can be seen in Figure 3 with the increase in impact energy as the temperature rises.
It is also interesting to note that for plain carbon steels, there is a particular temperature where the amount of energy it can absorb drastically increases. This temperature is known as Ductile to Brittle transition temperature (DBTT) and is marked in Figure 3 [3]. For 1018, the DBTT is around 45oC. This effect is seen only is materials that have a BCC crystal structure. A unique feature of BCC materials is that there is no closed packed planes which means that there isn’t a preferential direction for slip to occur. As the temperature crosses the DBTT, the activation energy required to move dislocations greatly reduces thus making it behave more like a ductile material. This behavior can be observed in Figure 3.
Effect of normalizing:
Grain size plays an important role is the amount of energy required to move dislocations. When a material is normalized, the structure is pearlitic in nature which has smaller grain sizes as compared to cold finished materials [4]. As the grain size is reduced, the amount of energy it can absorb increases. This fact can be seen in Figure 4 as normalized 1045 plain steel has higher impact values at a given temperature as compared to the cold finished sample.
Effect of bond strength:
Materials have different primary and secondary bonds which hold together the atoms in its crystal structure. The bond strength varies depending on the type of bond. Ionic bonds are stronger than metallic etc. It is also important to note that for materials with similar bond type, their respective bond strength are not the same. The bond strength between iron atoms is stronger
than the bond strength between aluminum atoms [3]. The activation energy required to break bonds in an aluminum structure is lower than that of stainless steel. As a result, stainless steel can absorb more energy as compared to aluminum which is observed in Figure 5.
Figure 8 shows the fracture surface of stainless steel and aluminum. Both have shear lips and rough surfaces which indicates that both underwent ductile failure. This figure shows that even for ductile materials, the amount of energy absorbed under impact is never the same due to the reason stated above.
Conclusions
The tests were conducted as per ASTM standards and the values were tabulated. There was a strong correlation between the carbon content and the impact energy absorbed. As the carbon content increased, the strength of the material increased which meant that the ability to absorb energy decreases. The temperature at which it is tested at has a significant effect on the energy absorbed by the materials. As the temperature was increased, the vacancy sites increases thus promoting ductile failure which in turn leads to higher amount of energy absorbed. The crystal structure, bond strength and heat treatment also had a positive effect on the energy absorbed by the material. BCC crystals showed a point where there was distinct transition in the amount of energy is absorbed and is known as Ductile to Brittle Transition Temperature.
References
[1] Lee S, An Overview of Advanced Composite Materials and Their Industrial Applications, Lecture at The Hong Kong University of Science and Technology, March 2012
[2] Standard Test Methods for Notched Bar Impact Testing of Metallic Materials, E 23-07, 2007 Annual Book of ASTM Standards, American Society for Testing and Materials.
[3] Fulay P.P , Wright W.J , The Science and Engineering of Materials, sixth edition, Cengage Learning, 2011
[4] Meyers M, Chawla K.K , Mechanical Behavior of Materials, Second edition, Cambridge University press, 2009