53
Tk Charts on the 2nd quarter 2003/2004, May 17, 2004
Tk
0Charts on the 2nd quarter 2003/2004, May 17, 2004
Tk
1Charts on the 2nd quarter 2003/2004, May 17, 2004
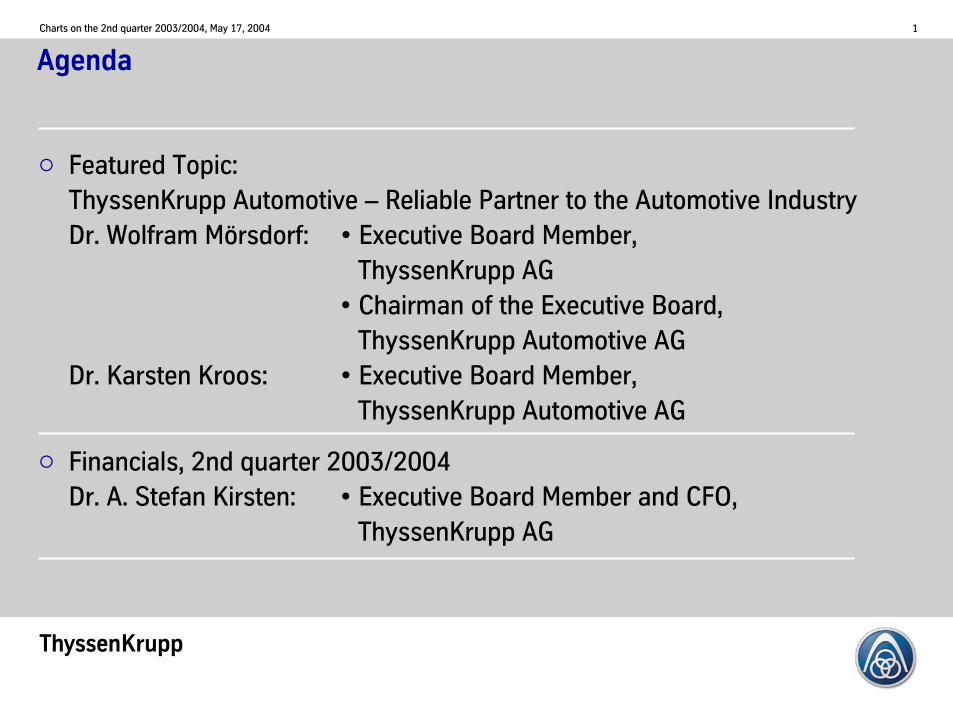
Agenda
Featured Topic: ThyssenKrupp Automotive – Reliable Partner to the Automotive IndustryDr. Wolfram Mörsdorf: • Executive Board Member,
ThyssenKrupp AG• Chairman of the Executive Board,
ThyssenKrupp Automotive AGDr. Karsten Kroos: • Executive Board Member,
ThyssenKrupp Automotive AG
Financials, 2nd quarter 2003/2004Dr. A. Stefan Kirsten: • Executive Board Member and CFO,
ThyssenKrupp AG
Tk
2Charts on the 2nd quarter 2003/2004, May 17, 2004
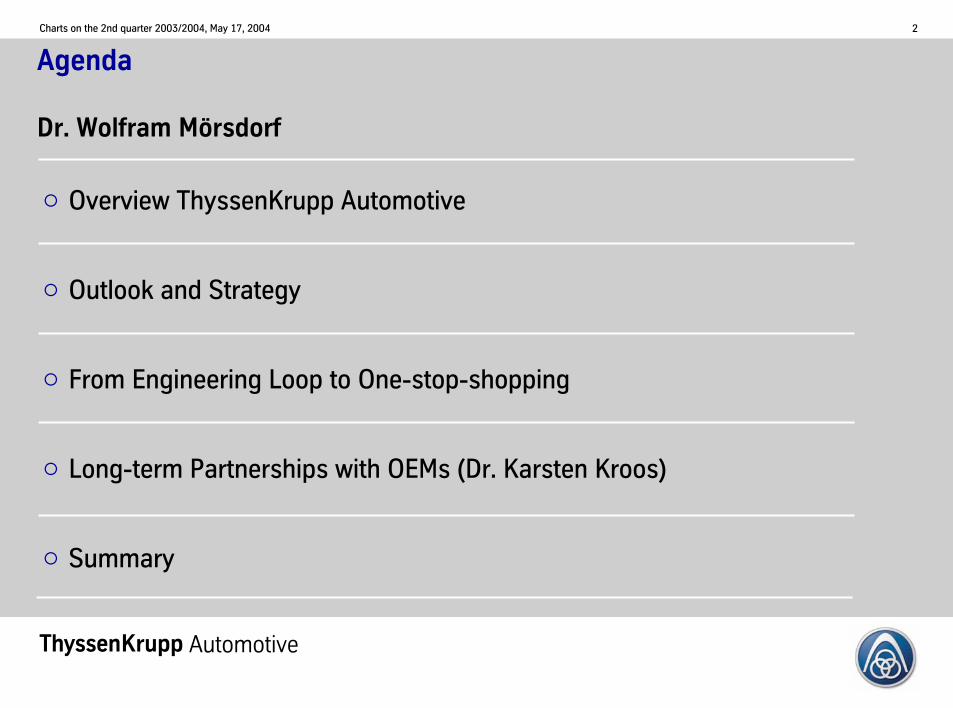
Agenda
Overview ThyssenKrupp Automotive
Outlook and Strategy
From Engineering Loop to One-stop-shopping
Long-term Partnerships with OEMs (Dr. Karsten Kroos)
Summary
Dr. Wolfram Mörsdorf
Automotive

Tk
3Charts on the 2nd quarter 2003/2004, May 17, 2004
ThyssenKrupp Group 2002/2003
Group sales (consolidated): €35.9 billion • EBT (consolidated): €706 million • Employees: 190,102
ThyssenKrupp AG
Steel
• Carbon Steel• Stainless Steel• Special Materials
Inter-segment sales unconsolidated; employees as at Sept 30, 2003
Sales: €12.0 bnEBT: €384 mEmployees: 49,286
Steel
Services
• MaterialsServices Europe
• MaterialsServices North America
• Industrial Services• Special Products
Sales: €10.9 bnEBT: €24 m Employees: 38,487
Services
Elevator
• 5 regional Business Units
• Passenger Boarding Bridges
• Accessibility
Sales: €3.4 bnEBT: €355 mEmployees: 29,689
Automotive
• Chassis• Body• Powertrain
Sales: €6.3 bnEBT: €188 mEmployees: 41,414
Technologies
•Production Systems
•Plant Technology•Marine•Mechanical
Engineering
Sales: €5.4 bnEBT: €42 mEmployees: 29,871
Capital Goods
Automotive

Tk
4Charts on the 2nd quarter 2003/2004, May 17, 2004
ThyssenKrupp Automotive 2002/2003
Chassis Body Powertrain
Sales: €6,295 million • EBT: €188 million • Employees: 41,414ThyssenKrupp Automotive
Sales: €1,685 mEmployees: 11,347*
Components/Modules, e.g.Roof partsSide panelsDoors
Systems, e.g.Body systemsDesign and engineeringservices
Sales: €1,877 mEmployees: 14,481*
Components/Modules, e.g.CrankshaftsCamshaftsSteering columns/steeringshafts
Systems, e.g.Steering systemsCylinder head systems
Sales: €2,764 mEmployees: 15,441*
Components/Modules, e.g.Axle parts/axle assembliesCast parts
Systems, e.g.Complete axlesAir suspension systems
* excl. administration and sales
Automotive
Tk
5Charts on the 2nd quarter 2003/2004, May 17, 2004
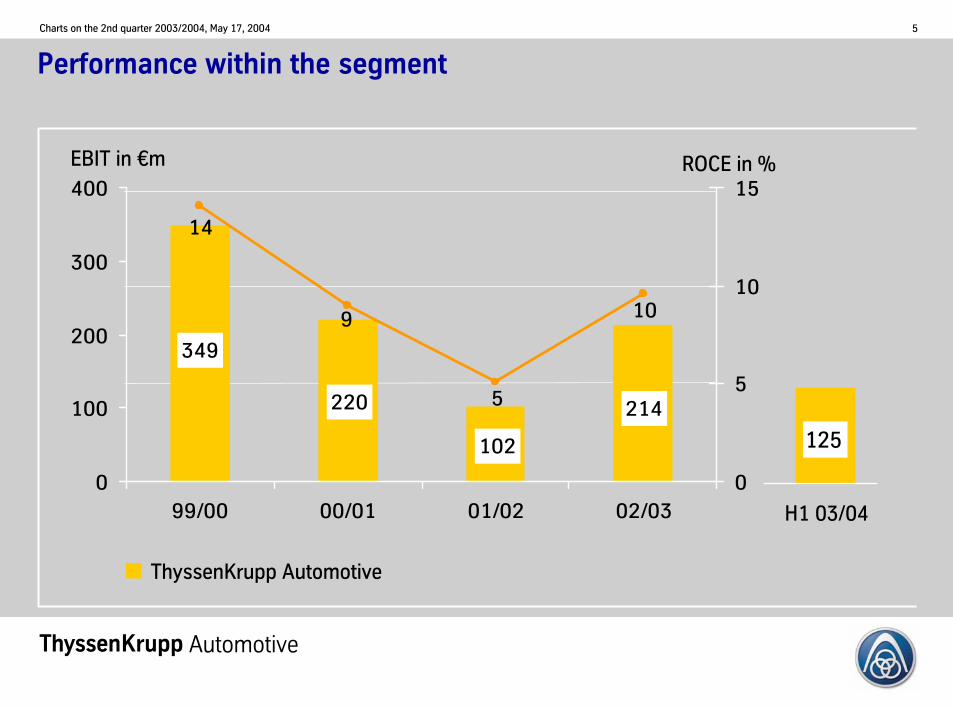
Performance within the segment
EBIT in €m ROCE in %
ThyssenKrupp Automotive
H1 03/04
220
349
214
102
10
5
9
14
0
100
200
300
400
99/00 00/01 01/02 02/030
5
10
15
125
Automotive
Tk
6Charts on the 2nd quarter 2003/2004, May 17, 2004
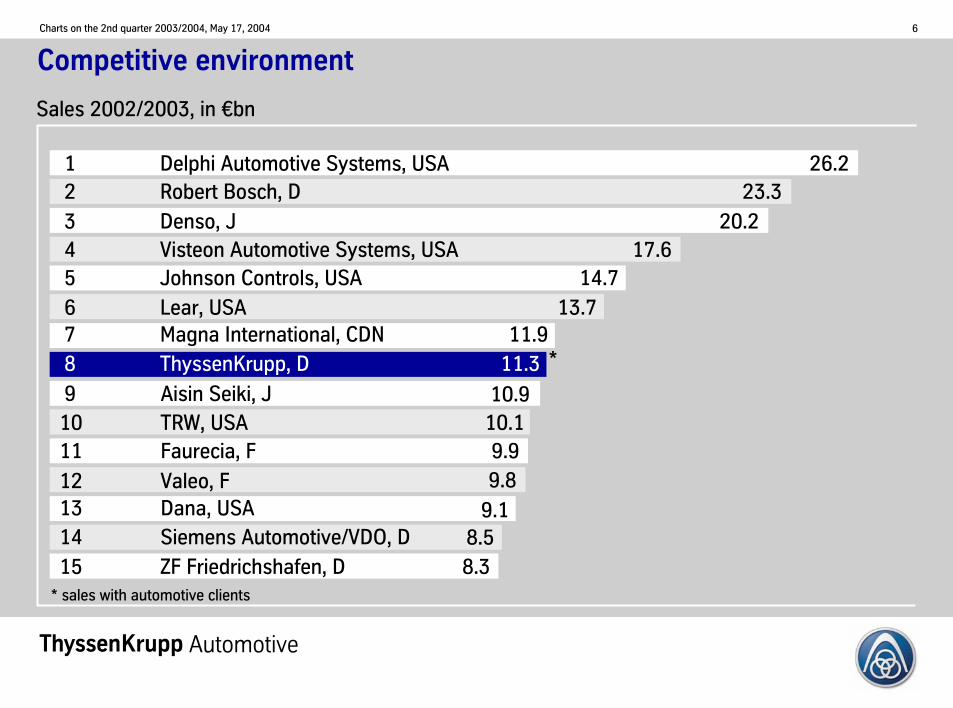
* sales with automotive clients
Competitive environment
26.223.3
20.217.6
14.713.7
11.911.3
10.110.19.9
9.18.58.3
10.9
1 Delphi Automotive Systems, USA2 Robert Bosch, D3 Denso, J4 Visteon Automotive Systems, USA5 Johnson Controls, USA6 Lear, USA7 Magna International, CDN8 ThyssenKrupp, D
910 TRW, USA11 Faurecia, F
12 Valeo, F13 Dana, USA14 Siemens Automotive/VDO, D15 ZF Friedrichshafen, D
Aisin Seiki, J
9.8
*
Sales 2002/2003, in €bn
Automotive

Tk
7Charts on the 2nd quarter 2003/2004, May 17, 2004
Top 10 customers
ThyssenKrupp Automotive achieves 2/3 of its €6,295 m sales with its10 biggest customers (2002/2003)
Automotive
General Motors
CumminsTRW
CaterpillarPorsche
Renault/NissanBMW
DaimlerChrysler
Ford
Volkswagen
Others
Tk
8Charts on the 2nd quarter 2003/2004, May 17, 2004
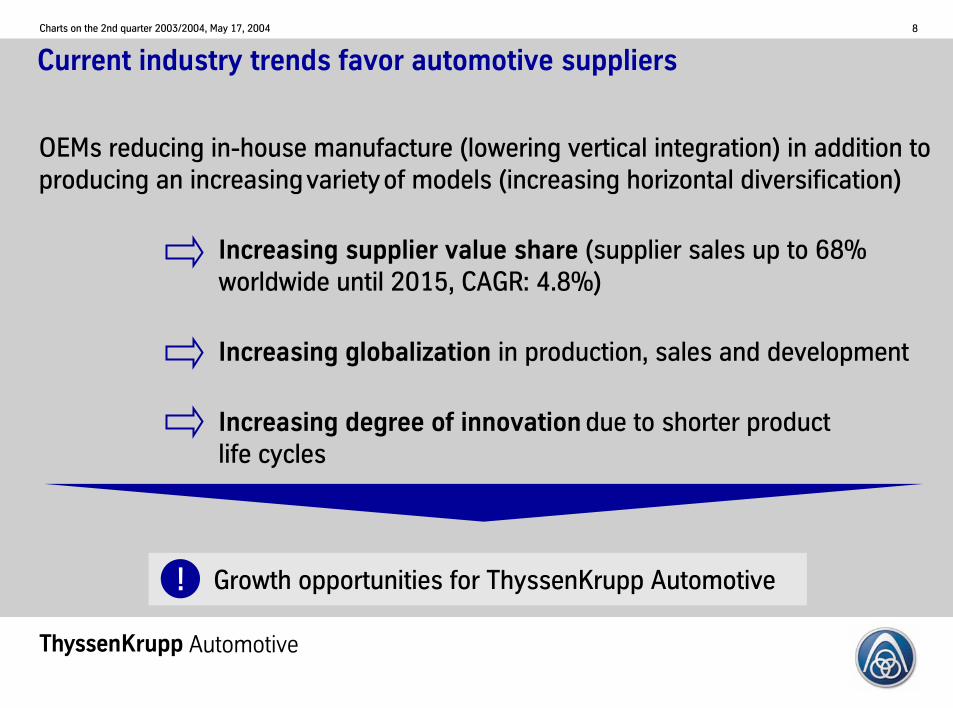
OEMs reducing in-house manufacture (lowering vertical integration) in addition toproducing an increasingvarietyof models (increasing horizontal diversification)
Increasing supplier value share (supplier sales up to 68% worldwide until 2015, CAGR: 4.8%)
Increasing globalization in production, sales and development
Increasing degree of innovation due to shorter productlife cycles
Current industry trends favor automotive suppliers
Growth opportunities for ThyssenKrupp Automotive!
Automotive
Tk
9Charts on the 2nd quarter 2003/2004, May 17, 2004
Organic and acquisitionary growth
Twin Focus Strategy: Parallel expansion of high-margin component and system business in core activities
Increase business with Asian OEMs,expand along with our customers presence in Asia and Eastern Europe
Utilize existing cross segment capabilities within the ThyssenKrupp Group
Enhance technological competence through cross segment cooperation and joint product development
Objectives and strategic actions
Increase sales to €10 bn by 2007/08 (CAGR: 9.7%), target ROCE: 17%
Automotive

Tk
10Charts on the 2nd quarter 2003/2004, May 17, 2004
Chassis Chassis
Customer: BMW
Models: Series 3
Product: Assembly front and rear axle
Company: ThyssenKrupp Automotive Systems, Germany
Organic growth: New projects (I)
Customer: Ford, EUCD-Program
Models: Ford Mondeo, Galaxy, Freelander;Volvo V70, S80, S60
Product: Structural parts front and rear axle
Company: ThyssenKrupp AutomotiveTallent Chassis, UK
Automotive

Tk
11Charts on the 2nd quarter 2003/2004, May 17, 2004
Body Body
Organic growth: New projects (II)
Customer: PSA
Model: 207
Product: Body-in-white components
Company: ThyssenKrupp Sofedit, France
Customer: Ford
Models: GT-Program
Product: Body frame
Company: ThyssenKrupp Budd/ Milford Fabricating Company,USA
Automotive
Tk
12Charts on the 2nd quarter 2003/2004, May 17, 2004
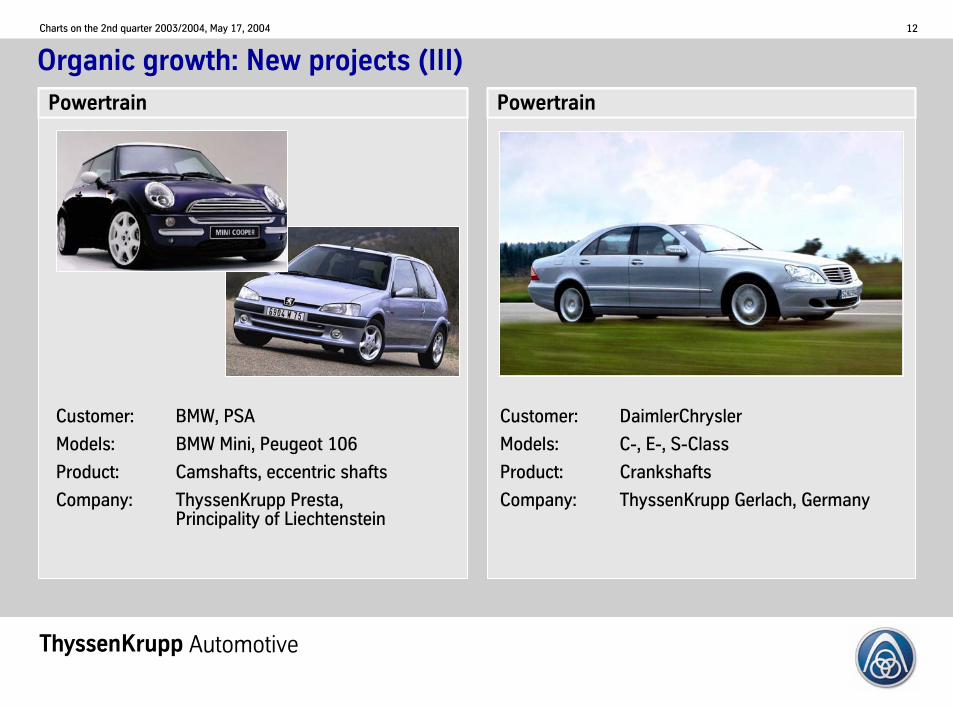
Powertrain Powertrain
Organic growth: New projects (III)
Customer: DaimlerChrysler
Models: C-, E-, S-Class
Product: Crankshafts
Company: ThyssenKrupp Gerlach, Germany
Customer: BMW, PSA
Models: BMW Mini, Peugeot 106
Product: Camshafts, eccentric shafts
Company: ThyssenKrupp Presta,Principality of Liechtenstein
Automotive
Tk
13Charts on the 2nd quarter 2003/2004, May 17, 2004
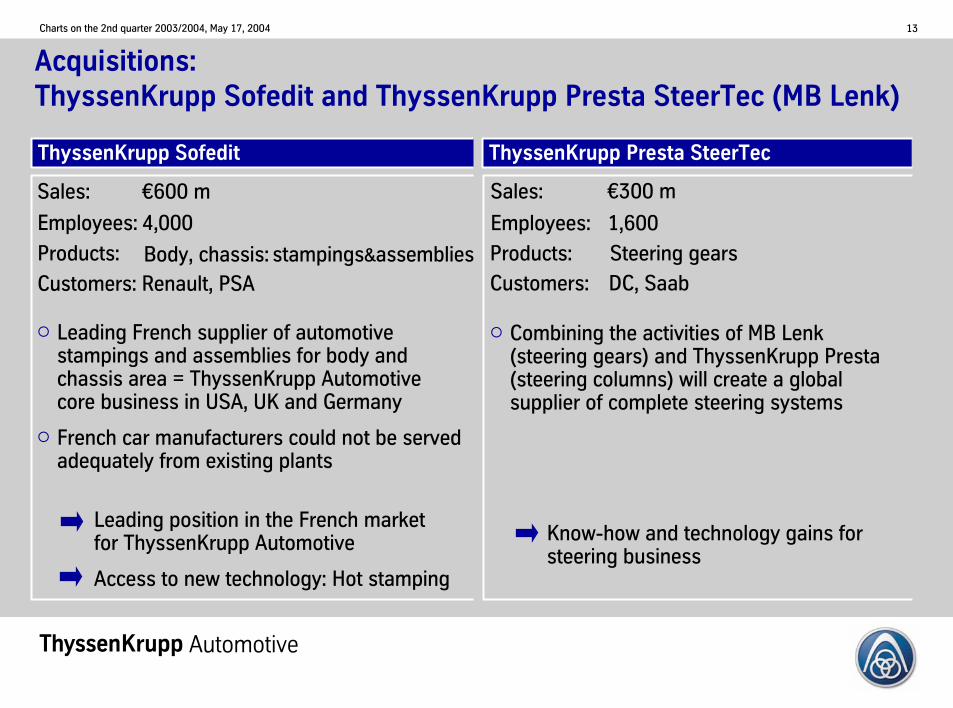
Acquisitions: ThyssenKrupp Sofedit and ThyssenKrupp Presta SteerTec (MB Lenk)
Automotive
ThyssenKrupp Sofedit
Sales: €300 m
Employees: 1,600
Products:
Sales: €600 m
Employees: 4,000
Customers: Renault, PSA
Leading French supplier of automotive stampings and assemblies for body and chassis area = ThyssenKrupp Automotive core business in USA, UK and Germany
French car manufacturers could not be served adequately from existing plants
Leading position in the French market for ThyssenKrupp Automotive
Access to new technology: Hot stamping
Body, chassis: stampings&assemblies Products: Steering gears
Customers: DC, Saab
Combining the activities of MB Lenk(steering gears) and ThyssenKrupp Presta(steering columns) will create a global supplier of complete steering systems
Know-how and technology gains for steering business
ThyssenKrupp Presta SteerTec
Tk
14Charts on the 2nd quarter 2003/2004, May 17, 2004
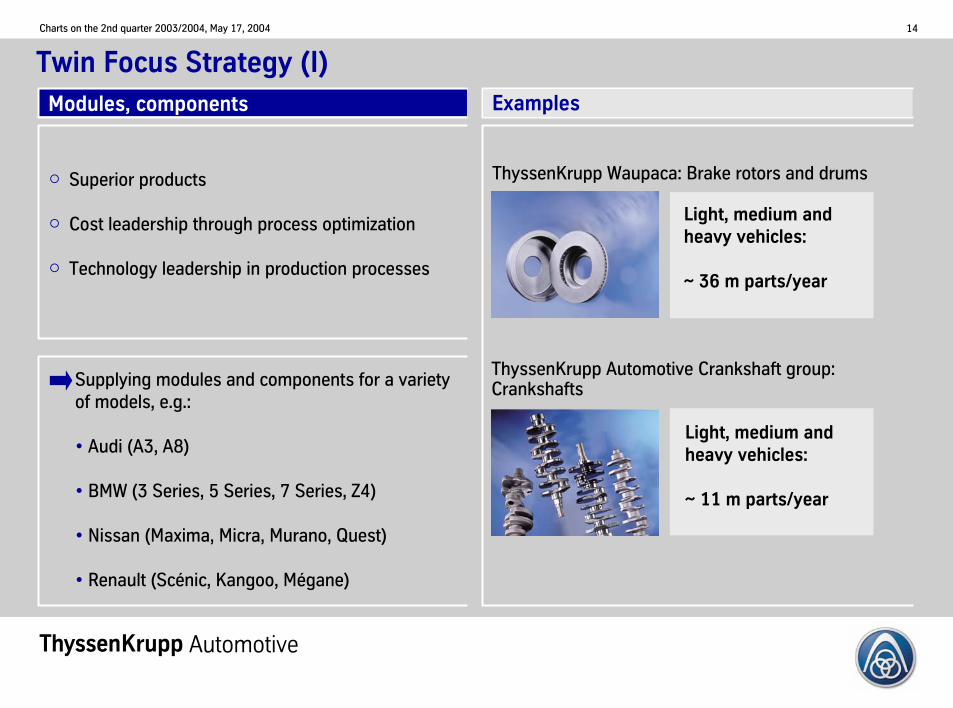
Twin Focus Strategy (I)
Automotive
Modules, components
ThyssenKrupp Waupaca: Brake rotors and drums
Examples
Superior products
Cost leadership through process optimization
Technology leadership in production processes
Light, medium and heavy vehicles:
~ 36 m parts/year
ThyssenKrupp Automotive Crankshaft group: Crankshafts
Light, medium and heavy vehicles:
~ 11 m parts/year
Supplying modules and components for a varietyof models, e.g.:
• Audi (A3, A8)
• BMW (3 Series, 5 Series, 7 Series, Z4)
• Nissan (Maxima, Micra, Murano, Quest)
• Renault (Scénic, Kangoo, Mégane)

Tk
15Charts on the 2nd quarter 2003/2004, May 17, 2004
Twin Focus Strategy (II)
Automotive
Engineering capability
Assembly and logistics capability
Electronics/mechatronics capability
Project management capability
ThyssenKrupp Presta: Steering shafts/columns
Systems (system integrator, system specialist) Examples
ThyssenKrupp Presta SteerTec: Steering gears
~ 19 m parts/year
~ 2 m parts/year
Competence:Wheel to wheel
Supplying systems for a variety of models, e.g.:
• DaimlerChrysler (E and S Class)
• Jaguar (XJ-Type)
• Porsche (Cayenne, Boxster, Carrera)
• Smart (fortwo, roadster)

Tk
16Charts on the 2nd quarter 2003/2004, May 17, 2004
Globalizing: Further growth in Asia and Eastern Europe
Automotive
Existing joint ventures with
• SAIC (ThyssenKrupp Presta HuiZhong Shanghai Co., Ltd.) China
• FAW (ThyssenKrupp Presta Fawer Changchun Co., Ltd.) China
• FAW (Liaoyang K.S. Automotive Spring Company Ltd.) China
• ZRRZ (ThyssenKrupp Zhong-Ren Chassis Co., Ltd.) China
• JBM (ThyssenKrupp JBM Pvt. Ltd.) India
• Compa (ThyssenKrupp Compa Arcuri S.A.) Romania
• Compa (ThyssenKrupp Bilstein Compa S.A.) Romania
New activities planned:
• Follow European and North American OEMs and build up facilities next to theirtransplants especially in China
• Build up transplant business with Asian OEMs especially in Eastern Europe
• Increase Asian and East European local sourcing content
Tk
17Charts on the 2nd quarter 2003/2004, May 17, 2004
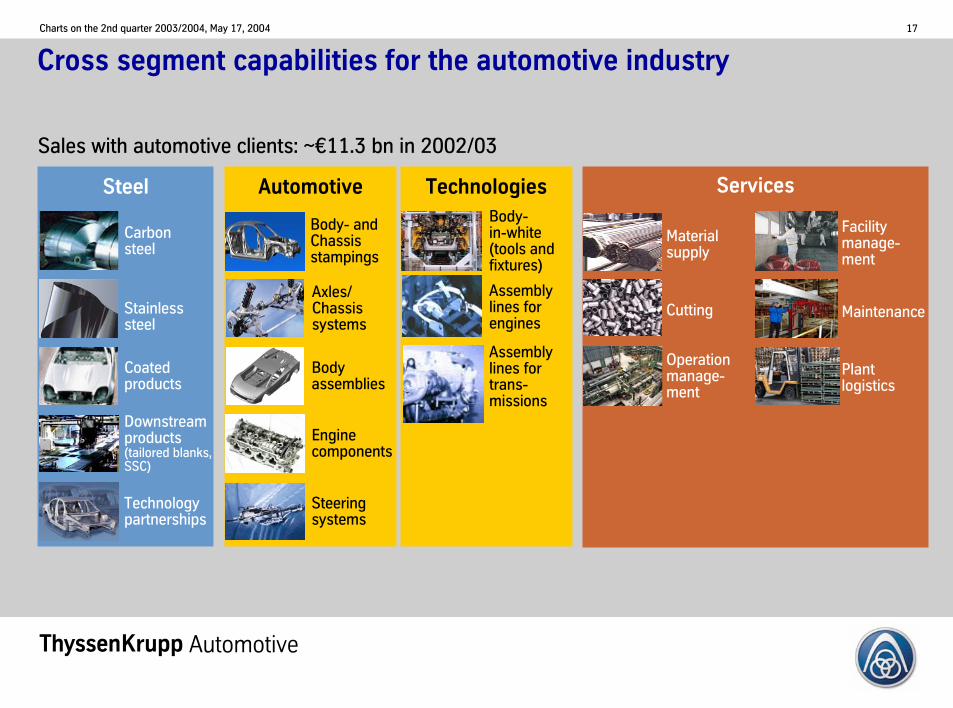
TechnologiesAutomotiveSteel
Sales with automotive clients: ~€11.3 bn in 2002/03
Carbonsteel
Stainlesssteel
Technologypartnerships
Downstreamproducts (tailored blanks, SSC)
Coatedproducts
Body- and Chassisstampings
Bodyassemblies
Enginecomponents
Axles/Chassissystems
Body-in-white(tools andfixtures)
Materialsupply
Cutting
Operationmanage-ment
Facility manage-ment
Maintenance
Plantlogistics
Services
Steering systems
Cross segment capabilities for the automotive industry
Automotive
Assembly lines for engines
Assembly lines fortrans-missions
Tk
18Charts on the 2nd quarter 2003/2004, May 17, 2004
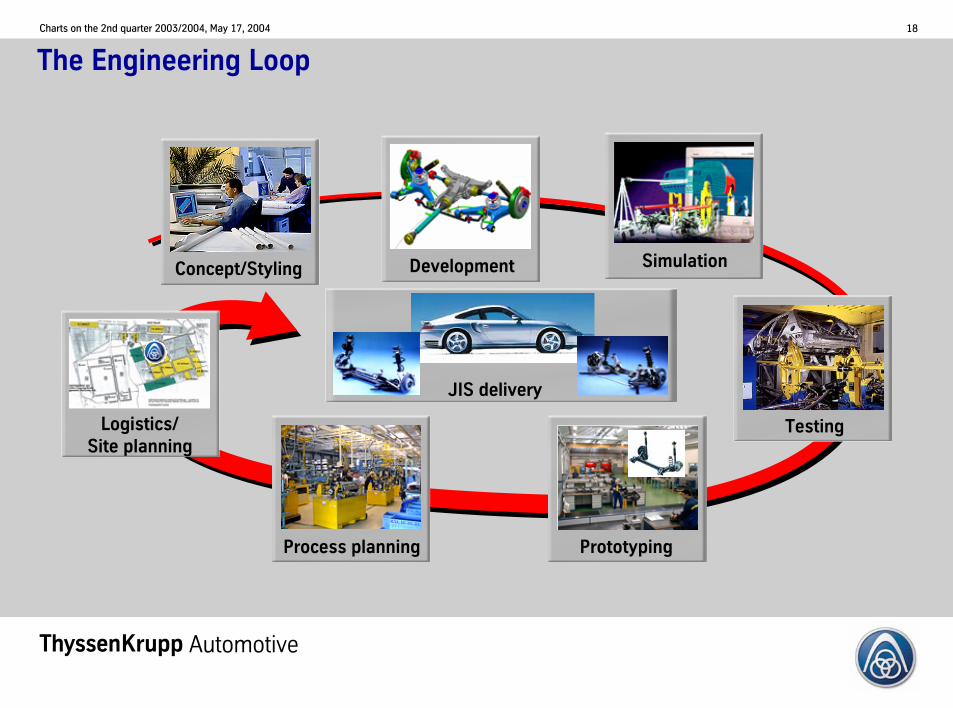
Testing
Simulation
Process planning
Concept/Styling Development
Prototyping
Logistics/Site planning
JIS delivery
The Engineering Loop
Automotive
Tk
19Charts on the 2nd quarter 2003/2004, May 17, 2004
North AmericanAutomotive Council
EuropeanAutomotive Council
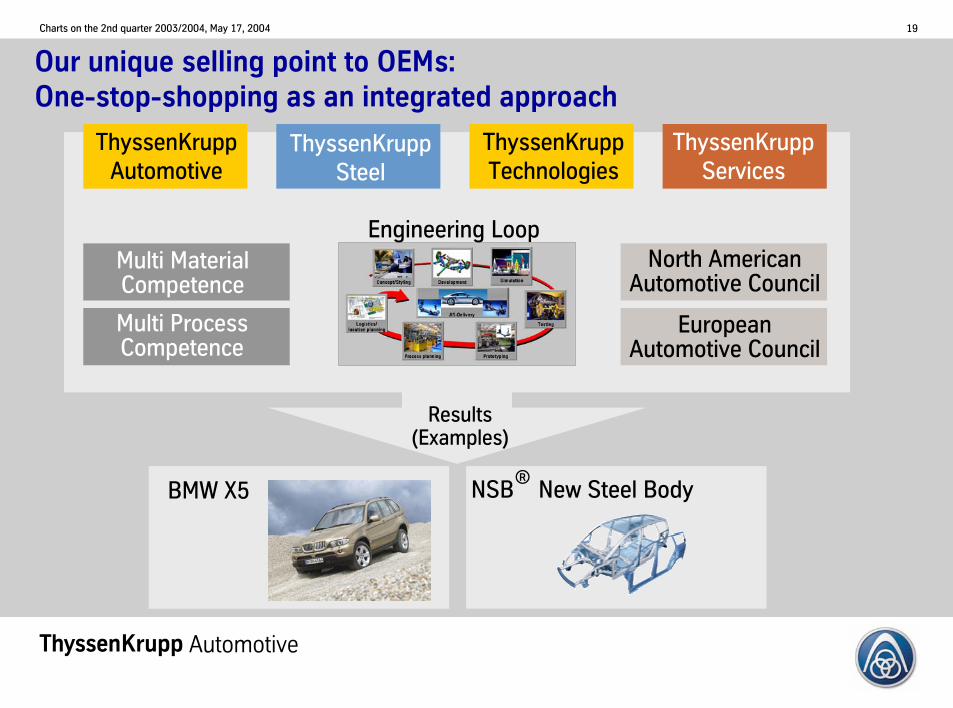
Our unique selling point to OEMs: One-stop-shopping as an integrated approach
Multi MaterialCompetence
Multi ProcessCompetence
ThyssenKruppAutomotive
ThyssenKruppSteel
ThyssenKruppTechnologies
ThyssenKruppServices
Results(Examples)
Automotive
Engineering Loop
BMW X5 NSB New Steel Body®
Tk
20Charts on the 2nd quarter 2003/2004, May 17, 2004
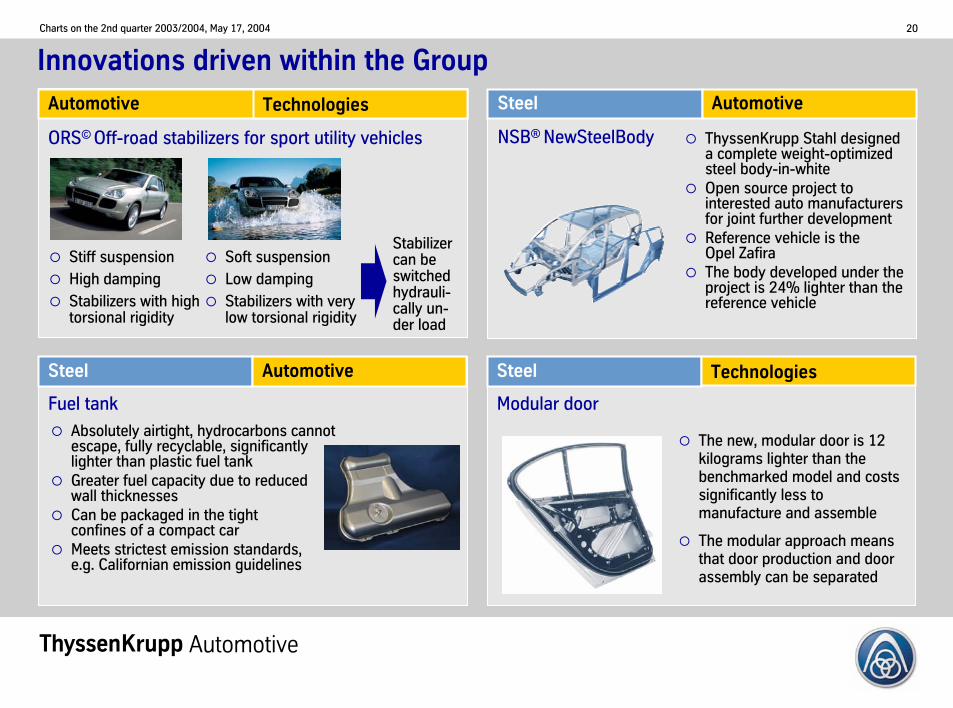
Fuel tank Modular door
The new, modular door is 12 kilograms lighter than the benchmarked model and costs significantly less to manufacture and assemble
The modular approach means that door production and door assembly can be separated
Steel Automotive Steel
Absolutely airtight, hydrocarbons cannot escape, fully recyclable, significantly lighter than plastic fuel tank Greater fuel capacity due to reducedwall thicknessesCan be packaged in the tight confines of a compact carMeets strictest emission standards, e.g. Californian emission guidelines
Innovations driven within the Group
NSB® NewSteelBody ThyssenKrupp Stahl designed a complete weight-optimized steel body-in-whiteOpen source project to interested auto manufacturers for joint further developmentReference vehicle is the Opel ZafiraThe body developed under the project is 24% lighter than the reference vehicle
Steel Automotive
ORS© Off-road stabilizers for sport utility vehicles
Stiff suspensionHigh dampingStabilizers with hightorsional rigidity
Soft suspensionLow dampingStabilizers with verylow torsional rigidity
Stabilizer can be switched hydrauli-cally un-der load
Automotive
Technologies
Technologies
Automotive
Tk
21Charts on the 2nd quarter 2003/2004, May 17, 2004
Automotive
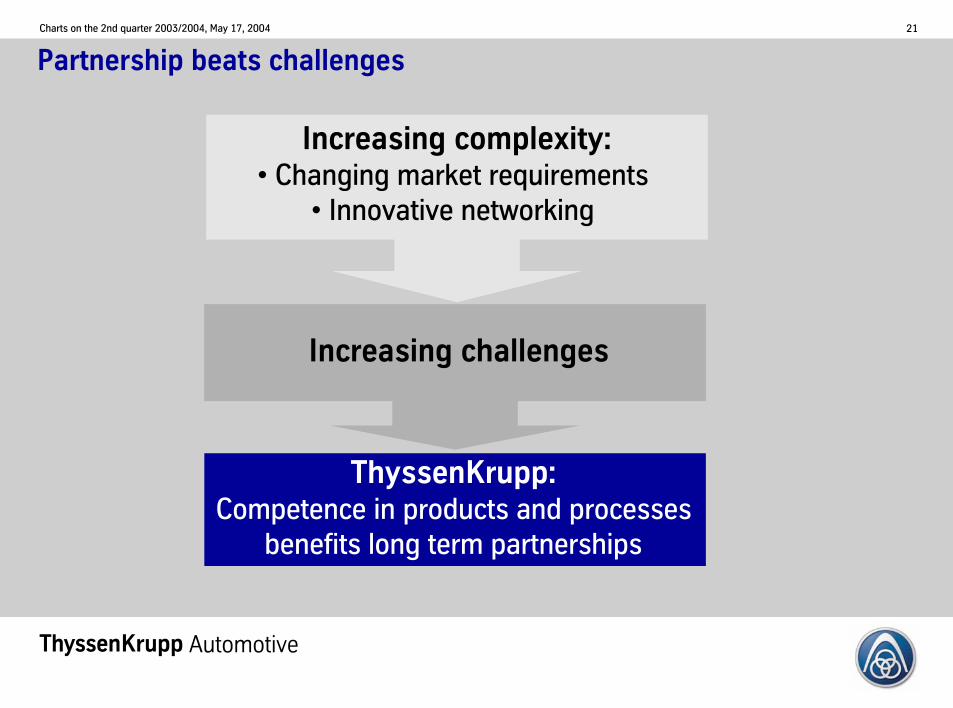
Increasing complexity:• Changing market requirements
• Innovative networking
Increasing challenges
ThyssenKrupp:Competence in products and processes
benefits long term partnerships
Partnership beats challenges

Tk
22Charts on the 2nd quarter 2003/2004, May 17, 2004
Testing
Simulation
Process planning
Concept/Styling Development
Prototyping
Logistics/Site planning
JIS delivery
The Engineering Loop
Automotive
Tk
23Charts on the 2nd quarter 2003/2004, May 17, 2004
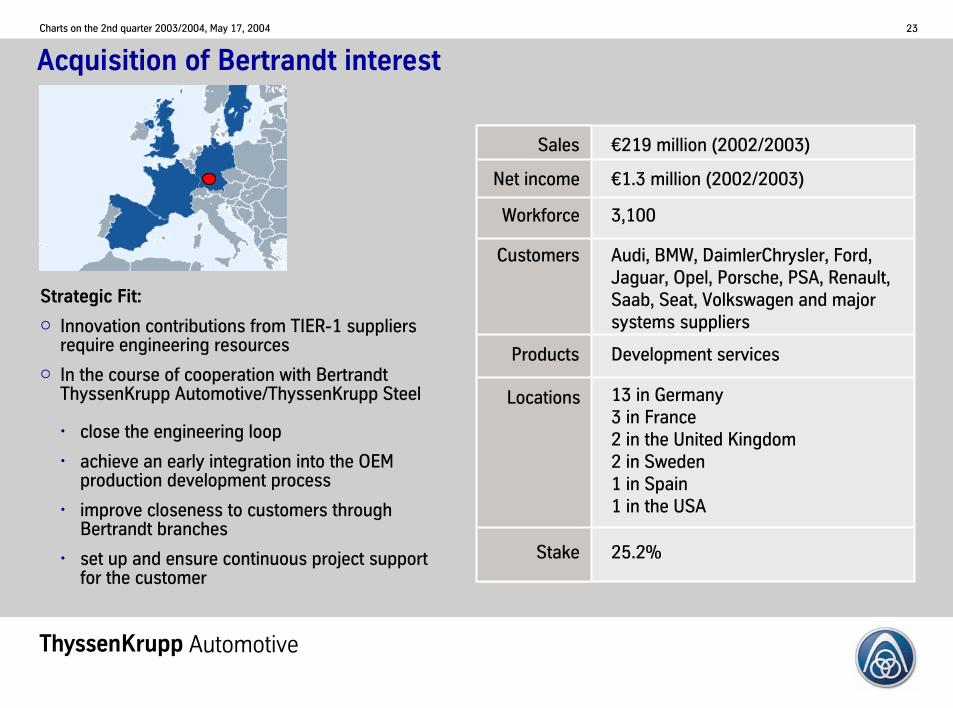
Acquisition of Bertrandt interest
Sales
Net income
Workforce
Customers
Products
Locations
Stake
€219 million (2002/2003)
€1.3 million (2002/2003)
3,100
Audi, BMW, DaimlerChrysler, Ford,Jaguar, Opel, Porsche, PSA, Renault,Saab, Seat, Volkswagen and majorsystems suppliers
Development services
13 in Germany3 in France2 in the United Kingdom 2 in Sweden 1 in Spain1 in the USA
25.2%
Strategic Fit:
Innovation contributions from TIER-1 suppliers require engineering resources
In the course of cooperation with BertrandtThyssenKrupp Automotive/ThyssenKrupp Steel
• close the engineering loop
• achieve an early integration into the OEM production development process
• improve closeness to customers through Bertrandt branches
• set up and ensure continuous project support for the customer
Automotive
Tk
24Charts on the 2nd quarter 2003/2004, May 17, 2004
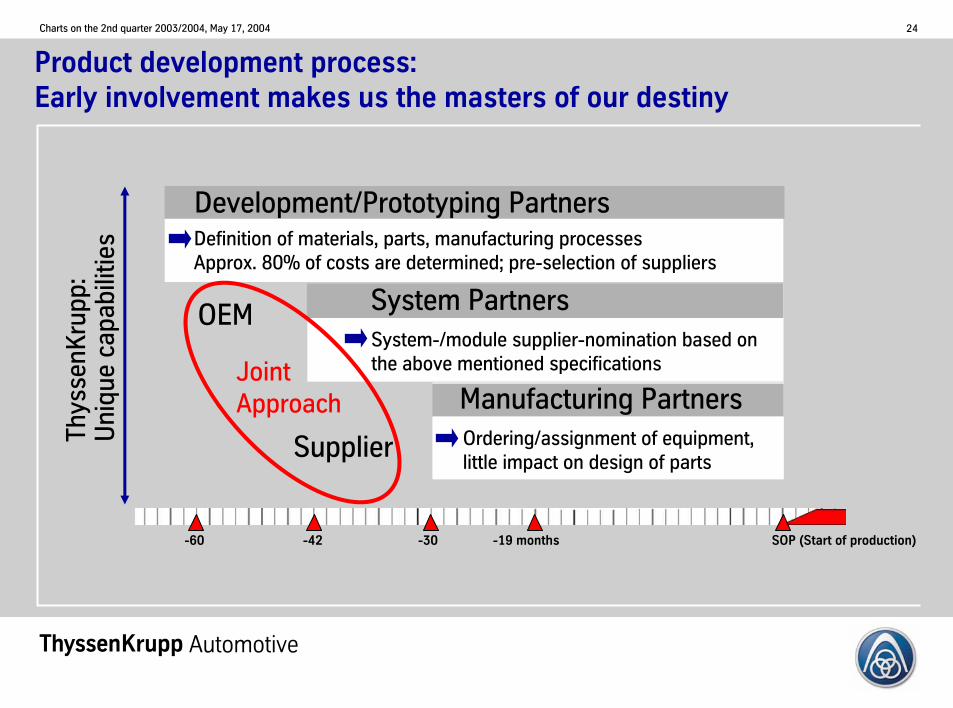
Product development process: Early involvement makes us the masters of our destiny
Automotive
Development/Prototyping PartnersDefinition of materials, parts, manufacturing processesApprox. 80% of costs are determined; pre-selection of suppliers
Manufacturing PartnersOrdering/assignment of equipment, little impact on design of parts
System PartnersSystem-/module supplier-nomination based on the above mentioned specificationsJoint
Approach
OEM
SupplierThys
senK
rupp
: U
niqu
e ca
pabi
litie
s
SOP (Start of production)-19 months-30-60 -42

Tk
25Charts on the 2nd quarter 2003/2004, May 17, 2004
Competence supports long-term partnership
Systems
Components
Systems
Components
Systems
Components
Joint engineeringJoint business planningJoint fitness
Thys
senK
rupp
Por
tfol
io:
Con
nect
ing
Com
pete
nce
Leading technologyLeading qualityLeading cost structureLeading global presence
Competencebeats competition
Automotive
Chassis Body Powertrain
Tk
26Charts on the 2nd quarter 2003/2004, May 17, 2004
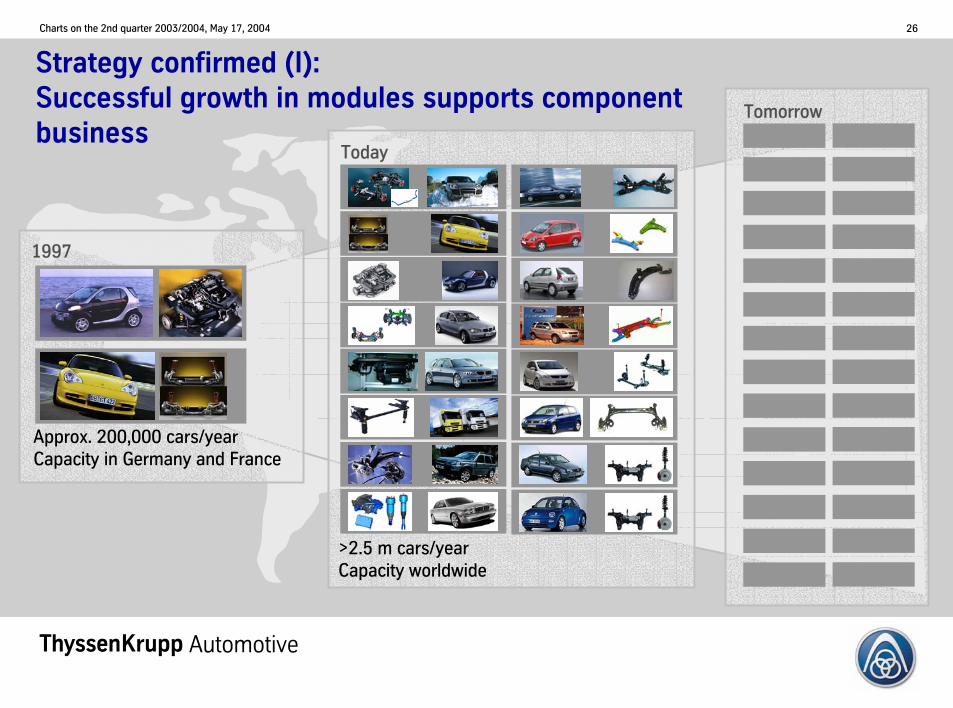
Approx. 200,000 cars/yearCapacity in Germany and France
1997
>2.5 m cars/yearCapacity worldwide
Today
Strategy confirmed (I):Successful growth in modules supports component business
Automotive
Tomorrow

Tk
27Charts on the 2nd quarter 2003/2004, May 17, 2004
Strategy confirmed (II):From modules to systems
Automotive
1997
Assembly
2003
Assembly
2004
Engineering
Prototyping
Quality-Management
Purchase
Components
Assembly
Range of activities for the smart formore:
Tk
28Charts on the 2nd quarter 2003/2004, May 17, 2004
Summary
ThyssenKrupp Automotive: Technology and cost leadership worldwide
Above average sales growth targeted
Expansion of engineering competence and long-term partnerships with OEMs
Unique approach in the automotive industry: One-stop-shopping within the ThyssenKrupp Group
Automotive
Tk
29Charts on the 2nd quarter 2003/2004, May 17, 2004
Agenda
Overview and Outlook 2003/2004
Group Financials
Segment Financials
Financial Calendar
Dr. A. Stefan Kirsten
Tk
30Charts on the 2nd quarter 2003/2004, May 17, 2004
Q2 2003/2004 – Overview
Order intake up 18% at €10.7 billion, at constant €/$ rate up 22%
Sales up 7% at €9.8 billion, at constant €/$ rate up 11%
EBT from continuing operations €249 million, up €42 million against last year’s EBT figures before a disposal gain of €41 million
Basic EPS increased from €0.31 to €0.56
Net financial payables at €4.3 billion remained almost on September 2003 level; effects from dividend payment and portfolio optimizations counterbalanced
Business picking up

Tk
31Charts on the 2nd quarter 2003/2004, May 17, 2004
Highlights
Business in Steel is continuously improving
- Orders, sales and EBT (adjusted for disposals) picking up- Carbon Steel driving profits, Stainless Steel cyclical, Special Materials still difficult- Further price increases implemented
Services and Automotive performing increasingly well
- Restructuring and streamlining of portfolio bearing fruit
Groupwide portfolio optimization continued
- Selective white space acquisitions in Elevator – entering important Italian market- Triaton Group sold with a significant gain
Proven Capital Market capability
- Successful bond placement

Tk
32Charts on the 2nd quarter 2003/2004, May 17, 2004
Portfolio Optimizations since October 2003
Dong Yang Elevator (South Korea) AcquisitionElevator Service 1 (Singapore) Acquisition
Novoferm (D) DisposalSheffield Automation (USA) Disposal*Foundry (USA) Closure
MB Lenk Group (D) Acquisition
Triaton Group (D) Disposal
Darcast (UK) Disposal
Automotive
Elevator
Technologies
Services
Bonfedi (I) Acquisition
Bertrandt (D) Acquisition*
* Closing not yet completed

Tk
33Charts on the 2nd quarter 2003/2004, May 17, 2004
Portfolio Optimization – Disposals
Number of Entities
Sales(annual)
PensionObligations
EmployeesEBT(annual)
Fiscal Year2002/03
12*
1
1
14
-
Total
€919 m
€327 m
€365 m
€1,611 m
-
€1 m
€8 m
€16 m
€25 m
-
€19 m
€14 m
€69 m
€102 m
-
4,529
2,177
2,311
9,017
-
Net Financial
Debt
€242 m
€1 m
€31 m
€274 m
-Subsequent Event
1st Quarter2003/04
* incl. non-consolidated entities
2nd Quarter2003/04
Tk
34Charts on the 2nd quarter 2003/2004, May 17, 2004
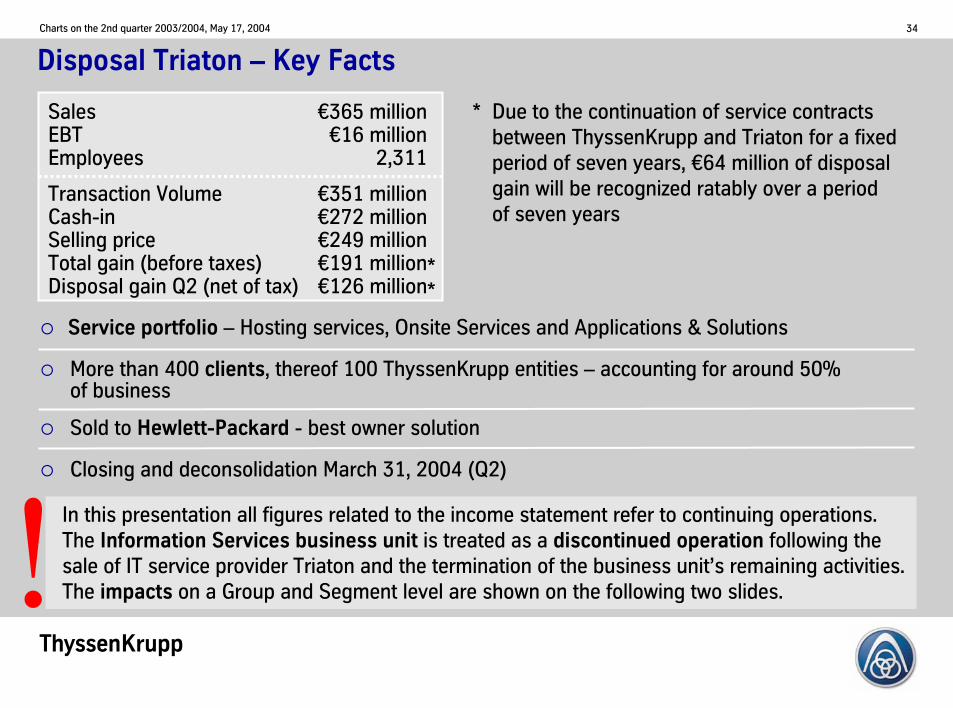
In this presentation all figures related to the income statement refer to continuing operations. The Information Services business unit is treated as a discontinued operation following the sale of IT service provider Triaton and the termination of the business unit’s remaining activities. The impacts on a Group and Segment level are shown on the following two slides.
Disposal Triaton – Key Facts
Service portfolio – Hosting services, Onsite Services and Applications & Solutions
More than 400 clients, thereof 100 ThyssenKrupp entities – accounting for around 50% of business
Sold to Hewlett-Packard - best owner solution
Closing and deconsolidation March 31, 2004 (Q2)
Sales €365 millionEBT €16 millionEmployees 2,311
Transaction Volume €351 millionCash-in €272 millionSelling price €249 millionTotal gain (before taxes) €191 millionDisposal gain Q2 (net of tax) €126 million
* Due to the continuation of service contracts between ThyssenKrupp and Triaton for a fixed period of seven years, €64 million of disposal gain will be recognized ratably over a period of seven years
**
Tk
35Charts on the 2nd quarter 2003/2004, May 17, 2004
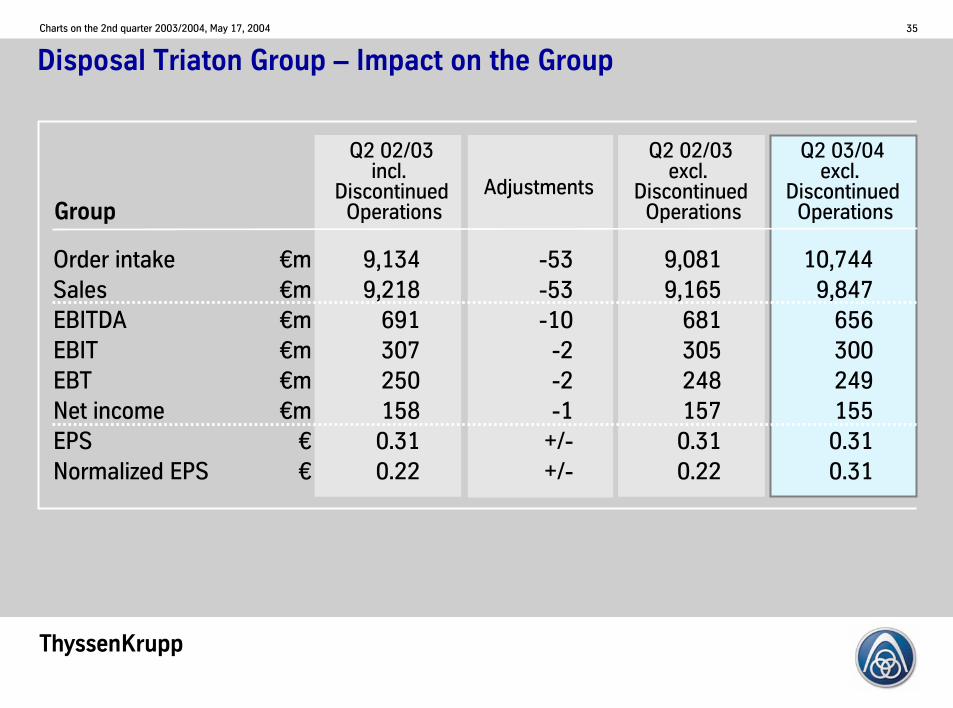
Disposal Triaton Group – Impact on the Group
Q2 02/03incl.
DiscontinuedOperations
Order intakeSalesEBITDAEBITEBTNet incomeEPSNormalized EPS
€m€m€m€m€m€m
€€
9,0819,165
6813052481570.310.22
10,7449,847
6563002491550.310.31
Adjustments
9,1349,218
6913072501580.310.22
-53-53-10
-2-2-1
+/-+/-
Q2 02/03excl.
DiscontinuedOperations
Q2 03/04excl.
DiscontinuedOperationsGroup

Tk
36Charts on the 2nd quarter 2003/2004, May 17, 2004
Disposal Triaton Group – Impact on the Services Segment
Q2 02/03incl.
DiscontinuedOperations
Order intakeSalesEBITDAEBITEBT
€m€m€m€m€m
2,7922,719
662917
2,8822,819
754538
Adjustments
2,8452,772
763119
-53-53-10
-2-2
Q2 02/03excl.
DiscontinuedOperations
Q2 03/04excl.
DiscontinuedOperationsServices

Tk
37Charts on the 2nd quarter 2003/2004, May 17, 2004
Outlook
For the 2nd half of fiscal 2003/2004 we currently expect an unchanged economic environment, even though the risks of an economic weakening have increased.
For the full year we forecast sales in the magnitude of roughly €38 billion. In terms of earnings before taxes, excluding the effects of disposals, we aim to get as close as possible to €1 billion.
With support from the economy and without major distortions on the currency and raw material markets, we could pass the €1 billion mark this year.
Tk
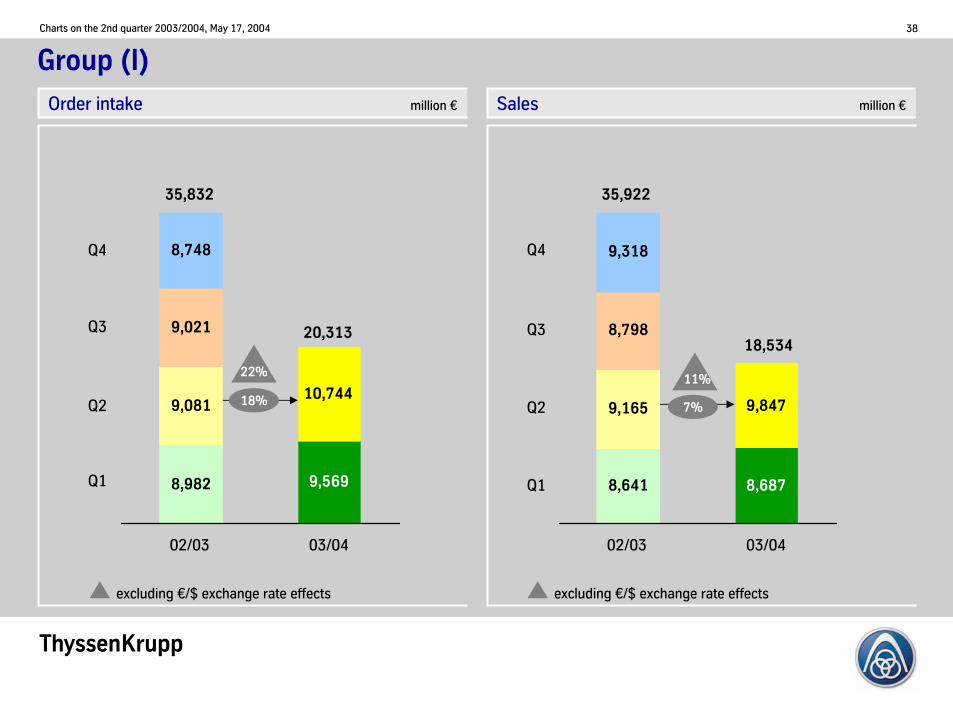
38Charts on the 2nd quarter 2003/2004, May 17, 2004
8,982 9,569
9,08110,744
9,021
8,748
02/03 03/04
Group (I)
18%
Q1
Q2
Q3
35,832
Q4
Q1
Q2
Q4
Order intake million € Sales million €
Q3
22%
excluding €/$ exchange rate effects excluding €/$ exchange rate effects
8,6878,641
9,8479,165
8,798
9,318
02/03 03/04
20,31318,534
7%
11%
35,922

Tk
39Charts on the 2nd quarter 2003/2004, May 17, 2004
163
249
163
249
61
02/03reported
Group (II)EBT million €
03/04reported
03/04normalized
1) Sale of stainless quarto plate activities €41 m2) Sale of construction services -€61 m
02/03normalized
2)
140
207
218
726
161
20%
411)
412412
Q1
Q3
Q2
Q4
140
248
218
100
706
Tk
40Charts on the 2nd quarter 2003/2004, May 17, 2004
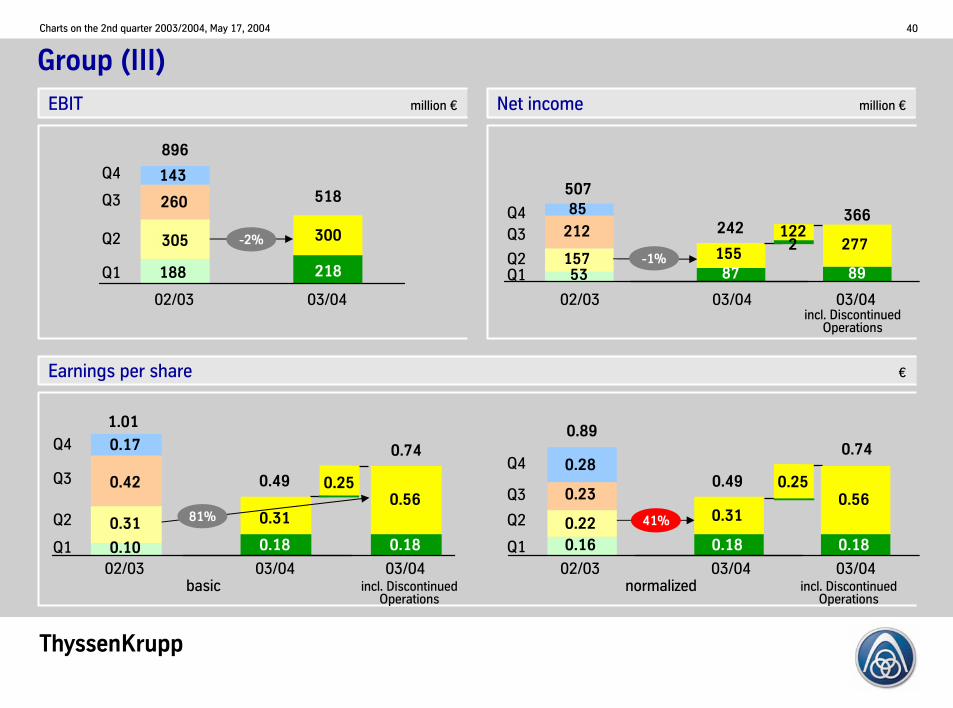
0.16 0.18
0.310.22
0.23
0.28
Group (III)
02/03 03/0403/04Q1
Q2
Q3
Q4
Q2
Q3
Q4
1.010.89
Earnings per share €
EBIT million € Net income million €
260
218188
305
143
02/03 03/04
Q1
Q2
Q3
Q4
896
-2%
02/03 03/04
300
518
Q1Q2
Q3Q4
02/03 03/04
53 87157 155
212
85507
89
277
incl. Discontinued Operations
366
03/04
0.18
0.56
0.74
incl. Discontinued Operations
02/03 03/040.10 0.18
0.310.31
0.42
0.17
0.18
0.56
0.74
Q1
0.250.25
03/04incl. Discontinued
Operationsbasic normalized
242
0.49
41%
0.49
-1%
1222305
81%
Tk
41Charts on the 2nd quarter 2003/2004, May 17, 2004
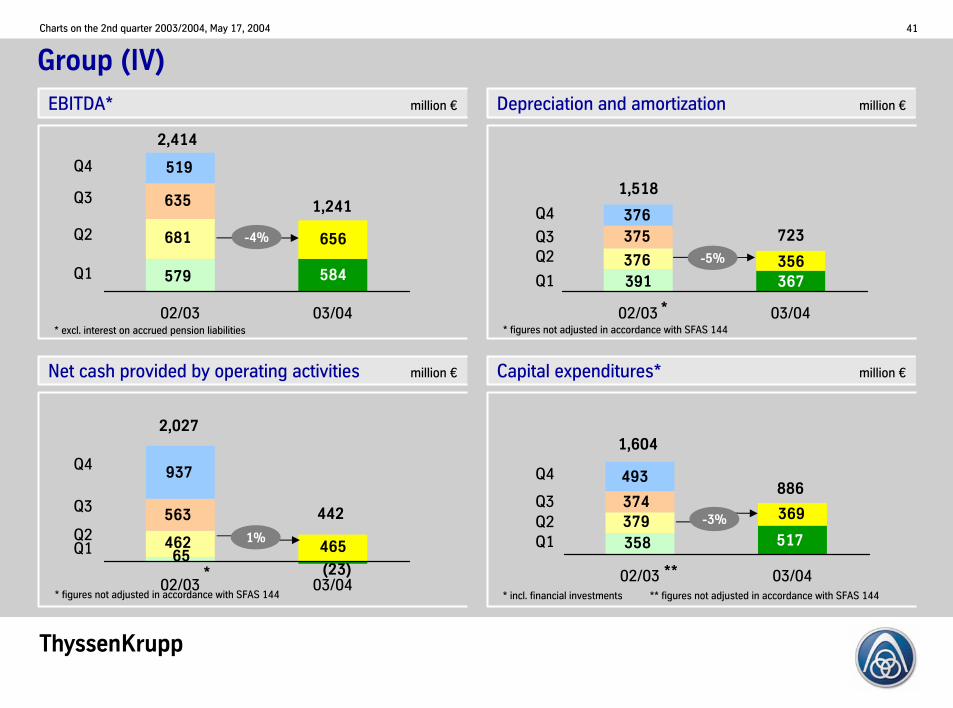
937
65462 465
563
02/03 03/04
519
584579
656681
635
02/03 03/04
Group (IV)
Q1
2,027
Q2
Q3
Q4
Q1
Q2Q3
Q4
Q1Q2Q3
Q4
1,604895
Q1
Q2
Q3
Q4
* excl. interest on accrued pension liabilities
EBITDA* million € Depreciation and amortization million €
Net cash provided by operating activities million € Capital expenditures* million €
-4%
367391356376
375376
02/03 03/04
517358
369379374
493
02/03 03/04
1%-3%
1,241
886
442
* figures not adjusted in accordance with SFAS 144
* figures not adjusted in accordance with SFAS 144 * incl. financial investments ** figures not adjusted in accordance with SFAS 144
***
*
2,414
1,518
-5%
723
(23)

Tk
42Charts on the 2nd quarter 2003/2004, May 17, 2004
7,7057,6318,149
4,9314,235 4,280
4,5534,2354,931
978713795
March 03 Sept 03 March 04
7,6147,6318,149
Group (V)
Sept 03
Equity to fixed assets ratio
Cash and cash equivalents
Equity ratio
4,948
March 04
1%
55.5%60.5%
March 03
49.1%
25.3%
51.9%
26.7%
5,7265,176
50.4%
25.1%
55.5%
Net financial payables to equity(gearing)
Net financial payables
Sept 03 March 04March 03
Financial payables million € Stockholders’ equity million €
Gearing million € Maturity profileof gross financial payables* million €
896
4,280
7,705
Total: 4,948
03/04
1,036
21%
04/05
240
5%
05/06
1,210
24%
06/07
351
7%
07/08
289
6%
thereafter
1,822
37%
* as of Sept 03

Tk
43Charts on the 2nd quarter 2003/2004, May 17, 2004
Segment Overview – Steel (I)
Order intake• Carbon Steel• Stainless SteelSales• Carbon Steel• Stainless Steel
EBITDA• Carbon Steel• Stainless SteelEBIT• Carbon Steel• Stainless SteelEBT• Carbon Steel• Stainless Steel
million €
3,2991,8871,1283,2221,8631,096
36821115417875
11215760
104
Change Changein %
2nd quarter
2002/03 2003/04
4,2612,4331,4453,6172,0611,259
349294
64161160
26138146
14
962546317395198163
-1983
-90-1785
-86-1986
-90
29.228.928.112.310.614.9
-5.239.3
-58.4-9.6
113.3-76.8-12.1
143.3-86.5
Steel
* incl. sale of stainless quarto plate activities €41 m
*
**
**
*
International market characterized by high demand and significantly increased raw material costs at the beginning of the year => jump in freight rates and costs of ore, coal, coke and scrap
Steel
Significant expansion of business volumes; orders, sales and EBT (excl. sale of quarto plate activities of €41 million) above previous years figures
Crude steel output remained high at4.4 million metric tons; no major production cuts due to raw material shortage
Carbon Steel
Order intake and sales up due to higher revenues and volumes
Leap in EBT in all operating groups, primarily volume driven; price increases only had minor impact on account of shipment structure and high proportion of longer term contracts; higher raw material and freight rate costs cut into earnings; efficiency-enhancement and €/$ rate helped
Tk
44Charts on the 2nd quarter 2003/2004, May 17, 2004
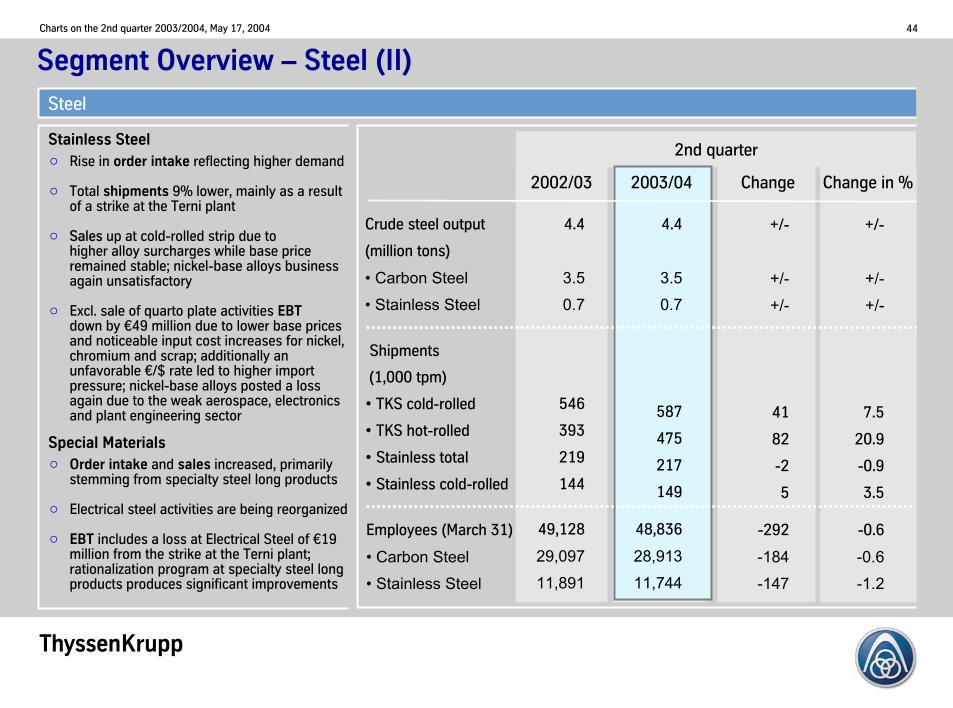
Crude steel output
(million tons)
• Carbon Steel
• Stainless Steel
(1,000 tpm)
• TKS cold-rolled
• TKS hot-rolled
• Stainless total
• Stainless cold-rolled
Segment Overview – Steel (II)
4.4
3.5
0.7
Change Change in %
2nd quarter
2002/03 2003/04
Shipments
Employees (March 31)
• Carbon Steel
• Stainless Steel
546
393
219
144
49,128
29,097
11,891
4.4
3.5
0.7
587
475
217
149
48,836
28,913
11,744
-292
-184
-147
+/-
+/-
+/-
+/-
+/-
+/-
41
82
-2
5
7.5
20.9
-0.9
3.5
Steel
-0.6
-0.6
-1.2
Order intake and sales increased, primarily stemming from specialty steel long products
Electrical steel activities are being reorganized
EBT includes a loss at Electrical Steel of €19 million from the strike at the Terni plant; rationalization program at specialty steel long products produces significant improvements
Special Materials
Rise in order intake reflecting higher demand
Total shipments 9% lower, mainly as a result of a strike at the Terni plant
Sales up at cold-rolled strip due to higher alloy surcharges while base price remained stable; nickel-base alloys business again unsatisfactory
Excl. sale of quarto plate activities EBTdown by €49 million due to lower base prices and noticeable input cost increases for nickel, chromium and scrap; additionally an unfavorable €/$ rate led to higher import pressure; nickel-base alloys posted a loss again due to the weak aerospace, electronics and plant engineering sector
Stainless Steel
Tk
45Charts on the 2nd quarter 2003/2004, May 17, 2004
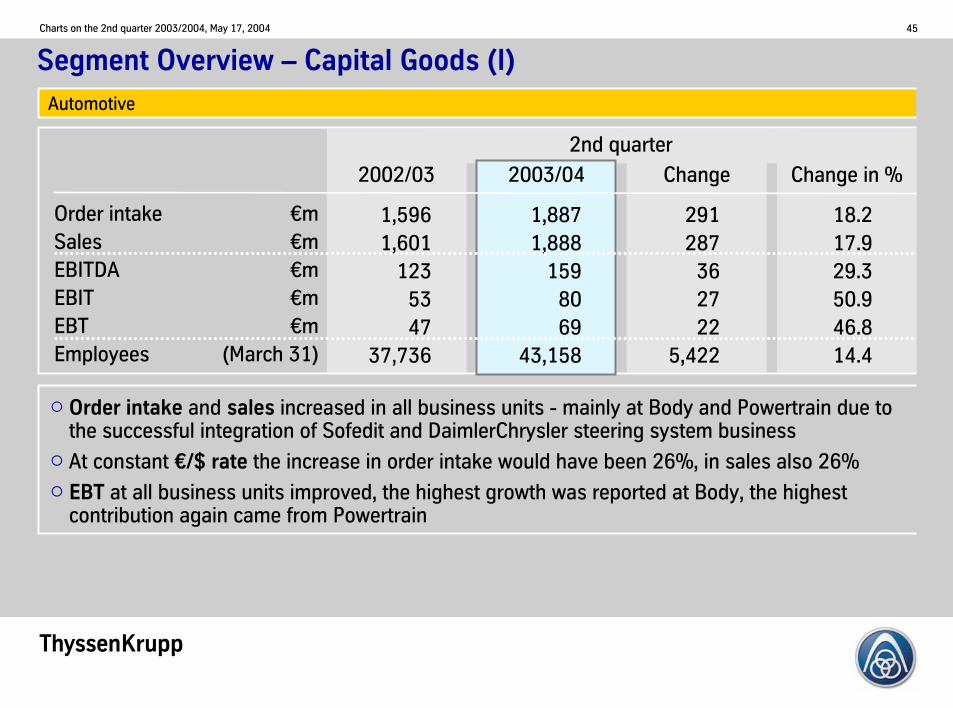
Segment Overview – Capital Goods (I)
Order intakeSalesEBITDAEBITEBTEmployees
2nd quarter
1,5961,601
1235347
37,736
Change Change in %2002/03 2003/04
1,8871,888
1598069
43,158
291287
362722
5,422
18.217.929.350.946.814.4
€m€m€m€m€m
(March 31)
Automotive
Order intake and sales increased in all business units - mainly at Body and Powertrain due to the successful integration of Sofedit and DaimlerChrysler steering system business
At constant €/$ rate the increase in order intake would have been 26%, in sales also 26%
EBT at all business units improved, the highest growth was reported at Body, the highest contribution again came from Powertrain

Tk
46Charts on the 2nd quarter 2003/2004, May 17, 2004
Segment Overview – Capital Goods (II)
Order intakeSalesEBITDAEBITEBTEmployees
2nd quarter
836812
998883
29,054
Change Change in %2002/03 2003/04
918833
998781
30,817
8221+/--1-2
1,763
9.82.6+/-
-1.1-2.46.1
Elevator
€m€m€m€m€m
(March 31)
New installation business still weak, service and modernization business performed well despite strong competition
Order intake and sales increased attributable to acquisitions (mainly DongYang) and improved marketing efforts; at constant €/$ rate the improvement in order intake was 16%, in sales 8%
EBT maintained at prior-year level even in an environment characterized by intensive price competition and declining demand for new installations; mixed picture on business unit level

Tk
47Charts on the 2nd quarter 2003/2004, May 17, 2004
Segment Overview – Capital Goods (III)
Order intakeSalesEBITDAEBITEBTEmployees
2nd quarter
1,0681,336
413
1531,500
Change Change in %2002/03 2003/04
1,4361,215
25(5)
227,346
368-121
-16- 8
-13-4,154
34.5-9.1
-39.0-
-86.7-13.2
Technologies
€m€m€m€m€m
(March 31)
Despite disposals of several companies (at Mechanical Engineering) order intake up; particularly at Plant Technology and Marine
Sales down mainly due to disposals, excl. structural changes sales were slightly higher; improvements at Plant Technology
In April 04, the customer of Transrapid in Shanghai signed the overall acceptance
EBT mainly impacted by a loss of €27 million realized on the sales financing of cruise ships atMarine; restructuring measures at MetalCutting showed positive impacts; Plant Technology andMechanical Engineering increased their earnings

Tk
48Charts on the 2nd quarter 2003/2004, May 17, 2004
Segment Overview - Services
Order intakeSalesEBITDAEBITEBTEmployees
2nd quarter
2,7922,719
662917
38,892
Change Change in %2002/0390
100-91621
-4,200
3.23.7
13.655.2
123.5-10.8
Services
€m€m€m€m€m
(March 31)
2003/042,8822,819
754538
34,692
Further step in the portfolio optimization: disposal of Triaton Group; Information Services business unit discontinued
Order intake and sales up despite the disposal of Construction Services in the previous year; improvements at Materials Services Europe and Special Products; Industrial Services still effected by weak economy; Materials Services North America still hit by €/$ rate impact
EBT more than doubled – performance enhancements and restructurings bearing fruit, losses from Construction Services disappeared; Materials Services Europe and North America showed higher earnings; Industrial Services reported a loss – primarily due to further restructuring measures; Special Products again at a high level

Tk
49Charts on the 2nd quarter 2003/2004, May 17, 2004
July 23 to Quiet PeriodAugust 11, 2004
August 12, 2004 Interim Report 3rd quarter 2003/04 (April to June)Conference Call with Analysts and Investors
October 25 to Quiet Period November 30, 2004
December 1, 2004 Annual Press Conference Analysts’ and Investors’ Meeting
Financial Calendar 2004

Tk
50Charts on the 2nd quarter 2003/2004, May 17, 2004
January 21, 2005 Annual General Meeting
January 24, 2005 Payment of dividend for the 2003/04 fiscal year
January 25, 2005 Quiet Period to February 11, 2005
February 14, 2005 Interim Report 1st quarter 2004/05 (October to December)Conference Call with Analysts and Investors
May 13, 2005 Interim Report 2nd quarter 2004/05 (January to March)
Financial Calendar 2005

Tk
51Charts on the 2nd quarter 2003/2004, May 17, 2004
How to contact ThyssenKrupp Investor Relations
Institutional Investors and Analysts:
Phone: +49 211 824-36464
Fax: +49 211 824-36467
E-mail: [email protected]
Internet: www.thyssenkrupp.com
To be added to the IR mailing list, send us a
brief e-mail with your details!

Tk
52Charts on the 2nd quarter 2003/2004, May 17, 2004
Disclaimer
This presentation contains certain statements that are neither reported financial results nor other historical information. These statements are forward-looking statements and are subject to risk and uncertainties that could cause actual results to differ materially from those expressed in the forward-looking statements. Many of these risks and uncertainties relate to factors that are beyond ThyssenKrupp’s ability to control or estimate precisely, such as future market and economic conditions, the behavior of other market participants, the ability to successfully integrate acquired businesses and achieve anticipated synergies and the actions of government regulators. Readers are cautioned not to place undue reliance on these forward-looking statements, which apply only as of the date of this presentation. ThyssenKrupp does not undertake any obligation to publicly release any revisions to these forward-looking statements to reflect events or circumstances after the date of these materials.

![Belt Selection Guide 2005 - Прогресс [eng].pdf · Modular Plastic Conveyor Belts Belt Selection Guide July 2004. ... modular plastic conveyor belt experts are available ...](https://static.documents.pub/doc/80x56/5a9f7dd97f8b9a71178cd2bb/belt-selection-guide-2005-engpdfmodular-plastic-conveyor-belts.jpg)


