52
Chemical Attack by Sulfates: Harmonizing Test Methods and Specification Limits Michael Thomas University of New Brunswick Thano Drimalas University of Texas

Chemical Attack by Sulfates: Harmonizing Test Methods and Specification Limits
Michael ThomasUniversity of New Brunswick
Thano DrimalasUniversity of Texas

Corrosion Resistance of Concrete IncorporatingSupplementary Cementing Materials
in a Marine Environment
Michael Thomas, Andrew Fahim & Ted MoffattUniversity of New Brunswick
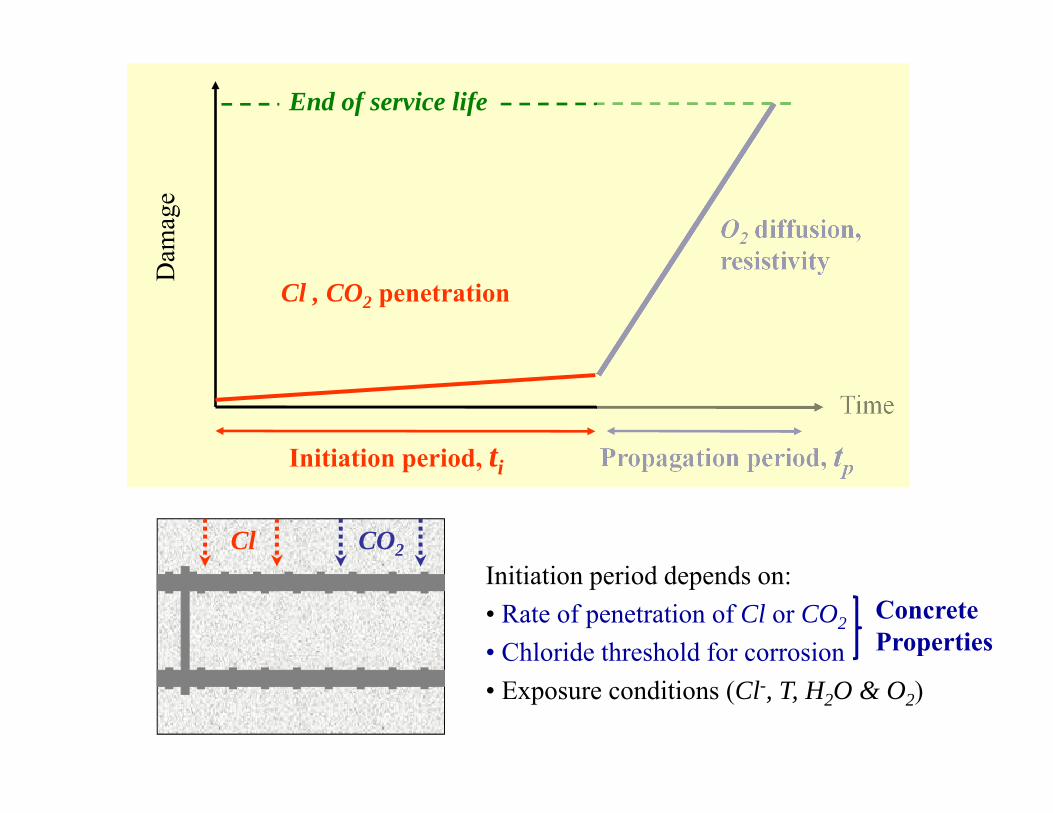
Initiation period, ti Propagation period, tp
End of service life
Dam
age
Time
Cl , CO2 penetration
O2 diffusion,resistivity
Cl CO2Initiation period depends on:• Rate of penetration of Cl or CO2
• Chloride threshold for corrosion• Exposure conditions (Cl-, T, H2O & O2)
ConcreteProperties
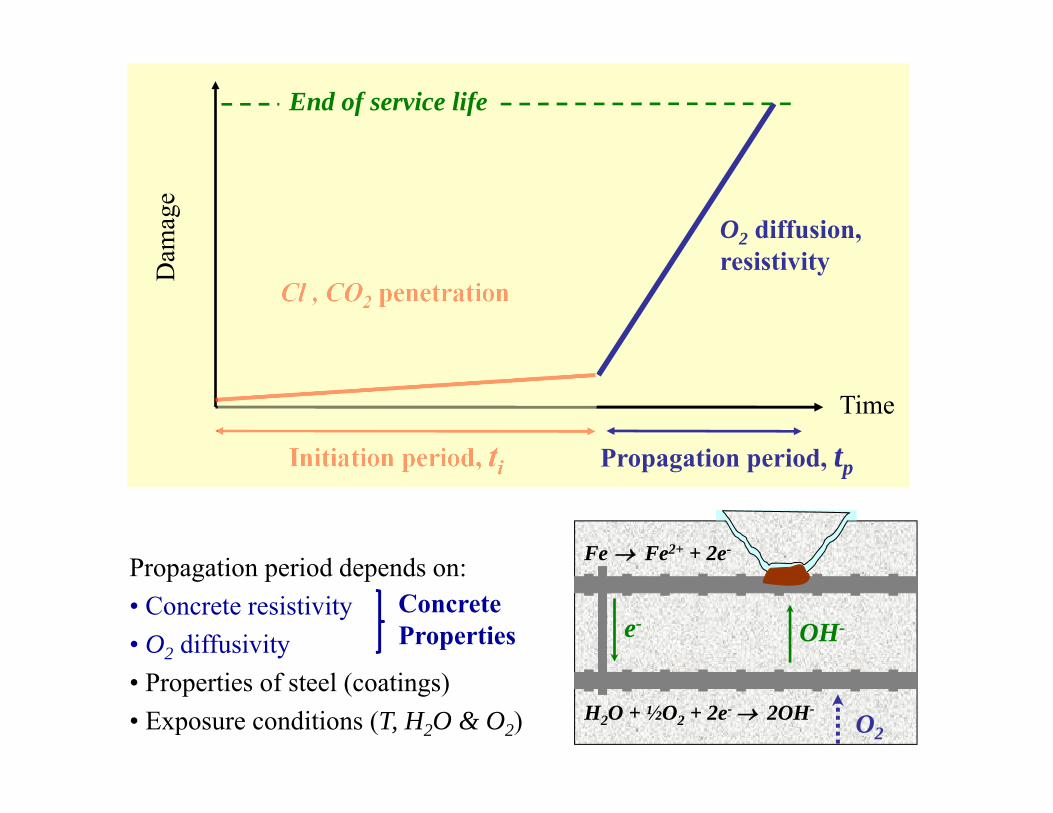
Initiation period, ti Propagation period, tp
End of service life
Dam
age
Time
Cl , CO2 penetration
O2 diffusion,resistivity
Fe Fe2+ + 2e-
e-
H2O + ½O2 + 2e- 2OH-
OH-
O2
Propagation period depends on:• Concrete resistivity• O2 diffusivity• Properties of steel (coatings)• Exposure conditions (T, H2O & O2)
ConcreteProperties

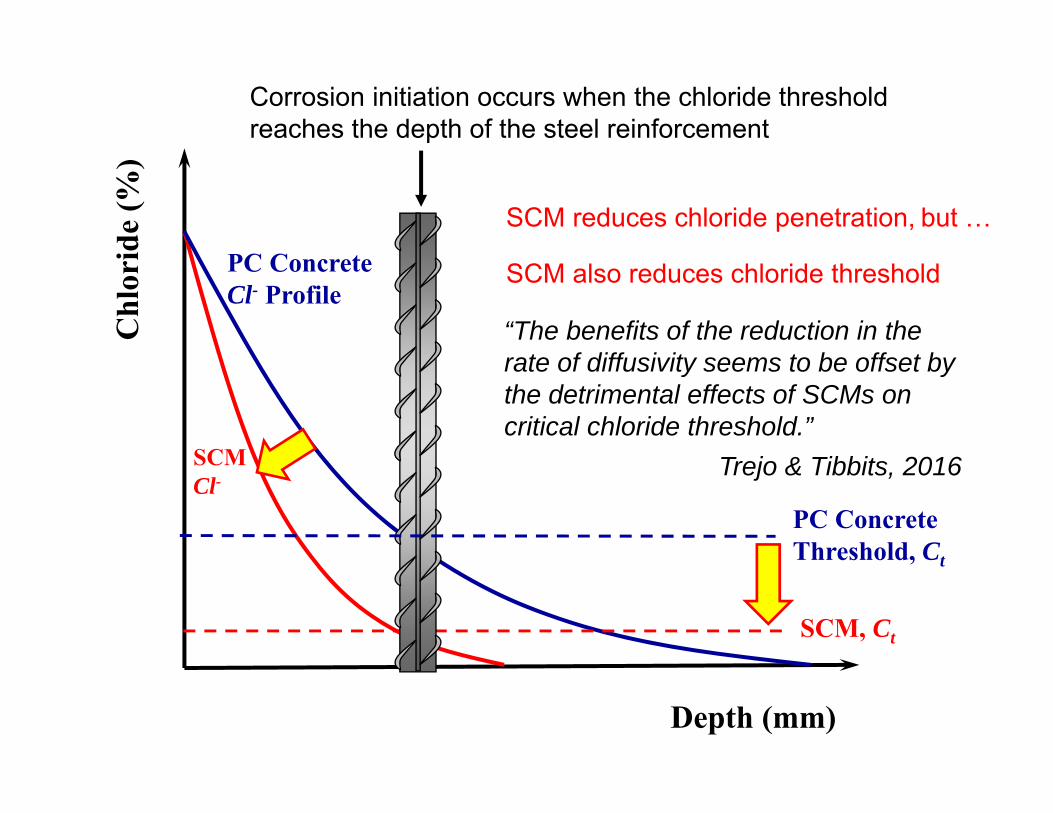
Chl
orid
e (%
)
Depth (mm)
PC ConcreteThreshold, Ct
PC ConcreteCl- Profile
SCM reduces chloride penetration,
Corrosion initiation occurs when the chloride threshold reaches the depth of the steel reinforcement
SCMCl-
SCM, Ct
but …
SCM also reduces chloride threshold
“The benefits of the reduction in the rate of diffusivity seems to be offset by the detrimental effects of SCMs on critical chloride threshold.”
Trejo & Tibbits, 2016
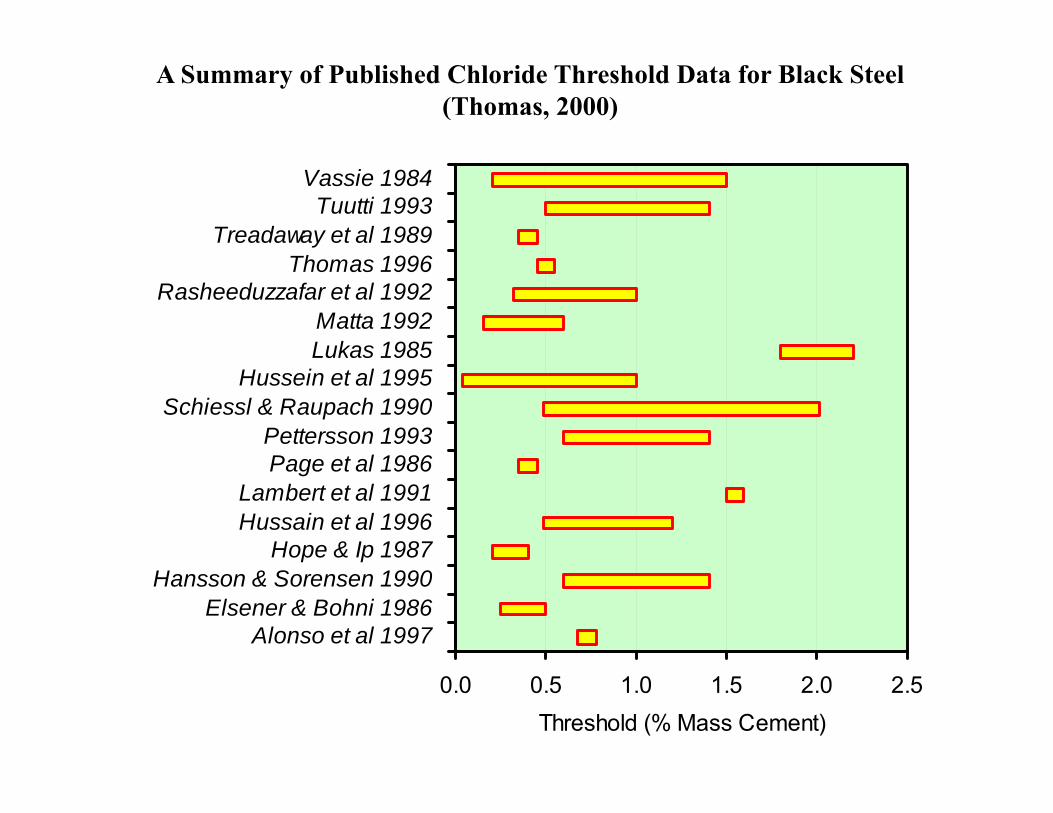
0.0 0.5 1.0 1.5 2.0 2.5
Alonso et al 1997Elsener & Bohni 1986
Hansson & Sorensen 1990Hope & Ip 1987
Hussain et al 1996Lambert et al 1991
Page et al 1986Pettersson 1993
Schiessl & Raupach 1990Hussein et al 1995
Lukas 1985Matta 1992
Rasheeduzzafar et al 1992Thomas 1996
Treadaway et al 1989Tuutti 1993
Vassie 1984
Threshold (% Mass Cement)
A Summary of Published Chloride Threshold Data for Black Steel(Thomas, 2000)
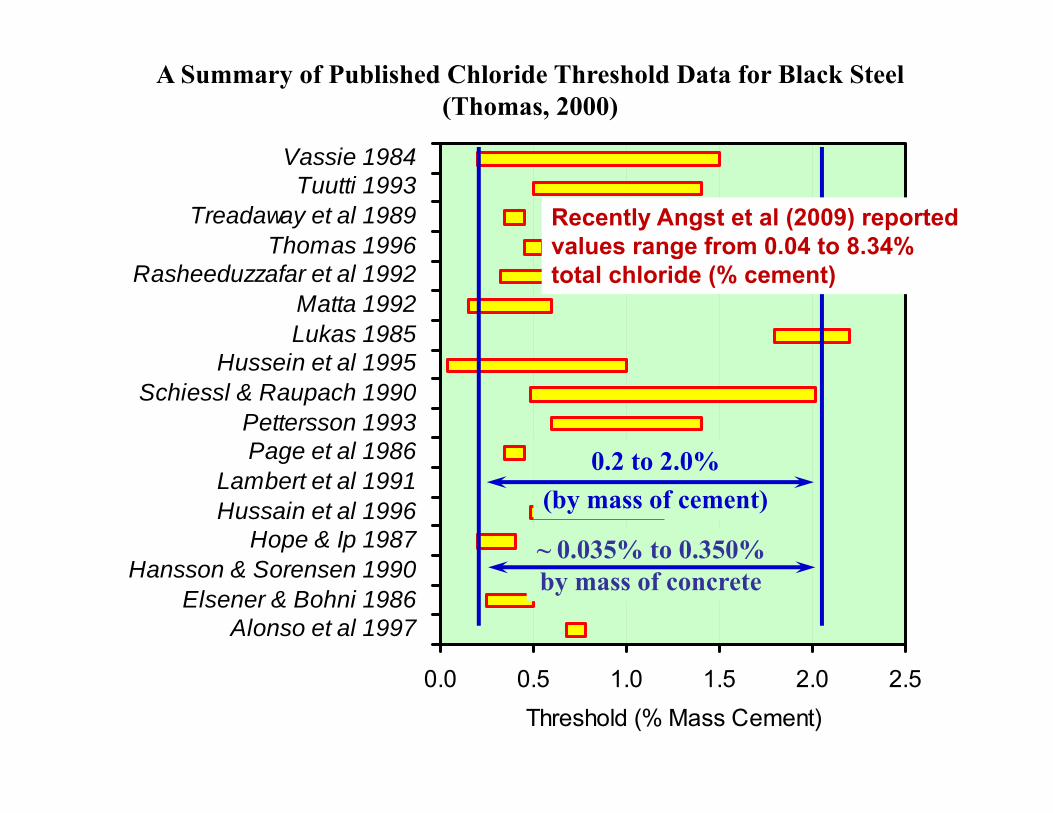
0.0 0.5 1.0 1.5 2.0 2.5
Alonso et al 1997Elsener & Bohni 1986
Hansson & Sorensen 1990Hope & Ip 1987
Hussain et al 1996Lambert et al 1991
Page et al 1986Pettersson 1993
Schiessl & Raupach 1990Hussein et al 1995
Lukas 1985Matta 1992
Rasheeduzzafar et al 1992Thomas 1996
Treadaway et al 1989Tuutti 1993
Vassie 1984
Threshold (% Mass Cement)
0.2 to 2.0%(by mass of cement)
~ 0.035% to 0.350%by mass of concrete
Recently Angst et al (2009) reported values range from 0.04 to 8.34% total chloride (% cement)
A Summary of Published Chloride Threshold Data for Black Steel(Thomas, 2000)

Scatter of Chloride Threshold Values in the Literature
(Angst et al. 2009)
(The numbers above the bars indicate the frequency of occurrence in the literature)
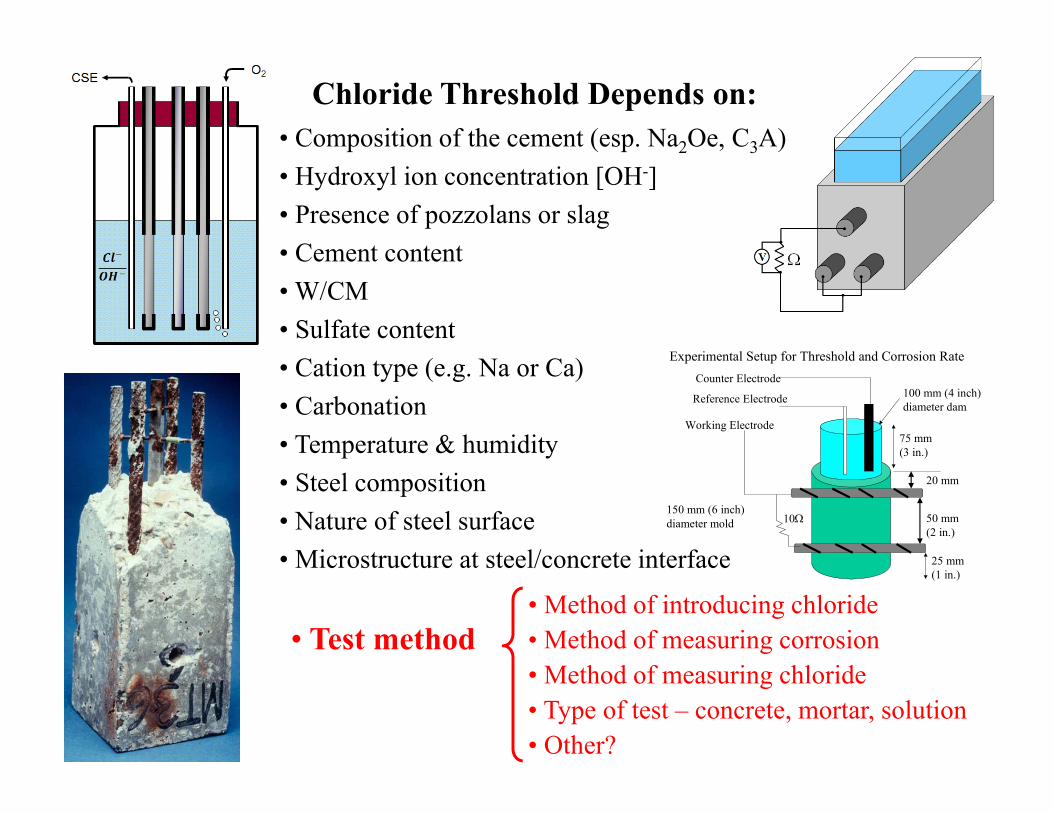
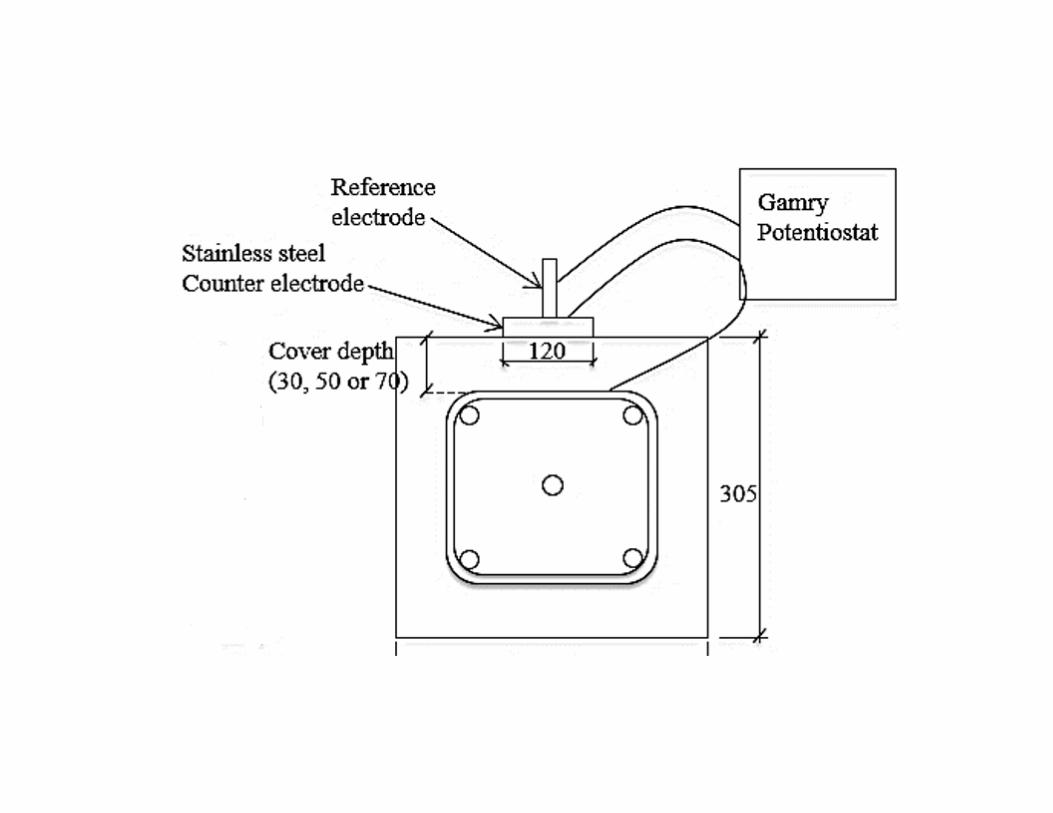
Reference Electrode
Working Electrode
Counter Electrode
20 mm
Experimental Setup for Threshold and Corrosion Rate
10 50 mm(2 in.)
25 mm(1 in.)
150 mm (6 inch)diameter mold
75 mm(3 in.)
100 mm (4 inch)diameter dam
Chloride Threshold Depends on:• Composition of the cement (esp. Na2Oe, C3A)• Hydroxyl ion concentration [OH-]• Presence of pozzolans or slag• Cement content• W/CM• Sulfate content• Cation type (e.g. Na or Ca)• Carbonation• Temperature & humidity• Steel composition• Nature of steel surface• Microstructure at steel/concrete interface
• Test method• Method of introducing chloride• Method of measuring corrosion• Method of measuring chloride• Type of test – concrete, mortar, solution• Other?
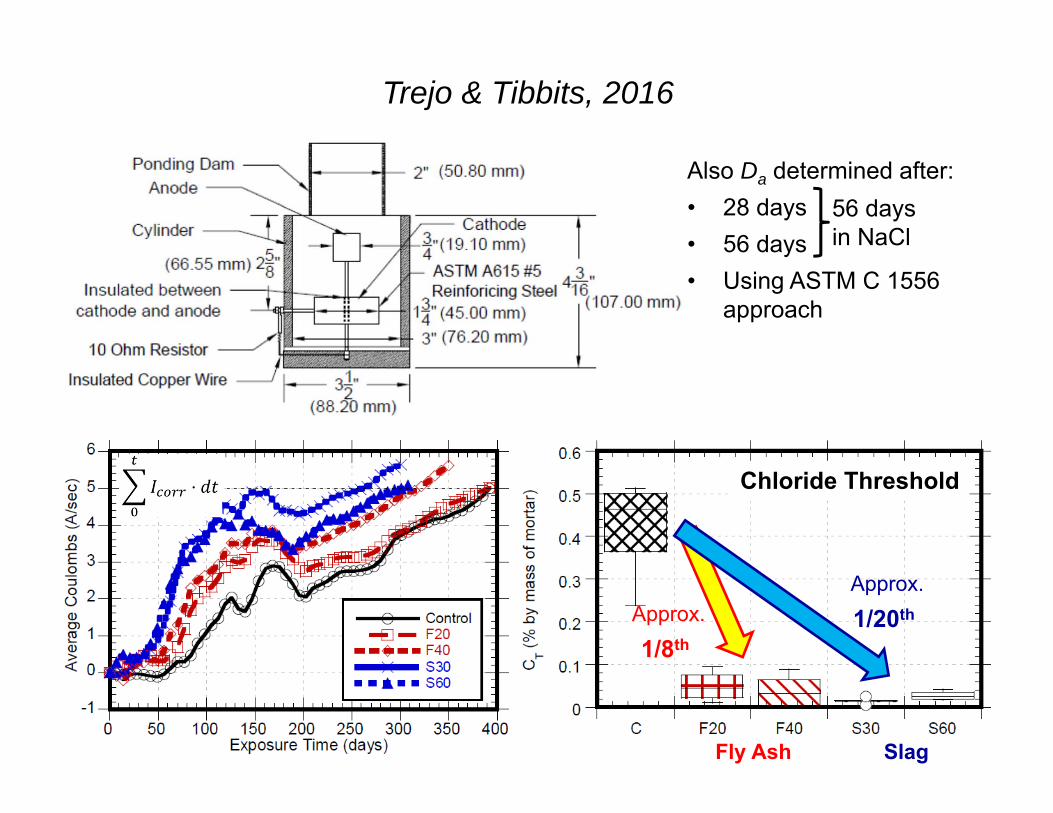
Trejo & Tibbits, 2016
Also Da determined after:• 28 days• 56 days• Using ASTM C 1556
approach
56 daysin NaCl
Slag
Approx.1/8th
Fly Ash
Chloride Threshold
Approx.1/20th

PC Concrete20 – 120 y
Slag Concrete5 – 15 y
Fly Ash Concrete10 – 20 y
Trejo & Tibbits, 2016

Critical Chloride Concentration
Cl- which tends to disrupt the passive film
OH- tending to stabilize the passive film
Competition between:
It has been shown that the molar ratio of chloride ions to hydroxyl ions is the critical factor governing corrosion of steel in concrete. Diamond suggests that corrosion is likely when:
3.0
OHCl
Bentur et al, 1997

OHClPortland
cement
C3A
Na2Oe
SCM(pozzolan
& slag)
Al2O3
Na2Oe, CaO, Si2O
At a given level of chloride (in concrete) the [Cl-]/[OH-] of the pore solution will be a function of the amount and composition of the cementing materials (Portland cement + SCM):
• Most SCM’s decrease OH concentration of pore solution
• Most SCM’s increase Cl binding (not silica fume)
• Page and Havdahl (1985): Cl−/OH− is not a reliable index.
• For example, silica fume increases Cl- and decreases OH- but a denser microstructure reduces O2 content & thus depresses steel potential.
• These effects might compensate for the negative effects on the pore solution chemistry.
• Thus a higher Cl−/OH− ratio in the pore solution does not necessarily lead to a higher risk of corrosion initiation.
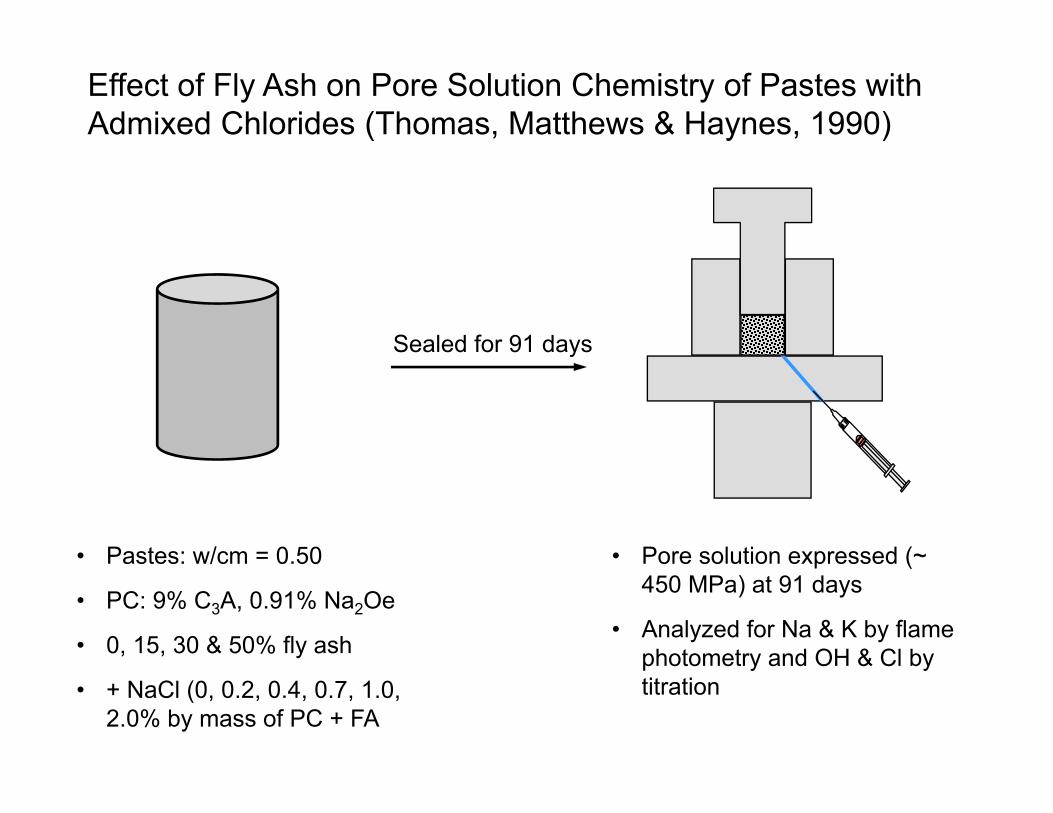
• Pastes: w/cm = 0.50
• PC: 9% C3A, 0.91% Na2Oe
• 0, 15, 30 & 50% fly ash
• + NaCl (0, 0.2, 0.4, 0.7, 1.0, 2.0% by mass of PC + FA
Sealed for 91 days
• Pore solution expressed (~ 450 MPa) at 91 days
• Analyzed for Na & K by flame photometry and OH & Cl by titration
Effect of Fly Ash on Pore Solution Chemistry of Pastes with Admixed Chlorides (Thomas, Matthews & Haynes, 1990)

Effect of Fly Ash on Pore Solution Chemistry of Pastes with Admixed Chlorides (Thomas, Matthews & Haynes, 1996)
0
50
100
150
200
250
300
350
400
0.0 0.2 0.4 0.6 0.8 1.0
Cl‐(m
M/L)
Chloride Added (% binder)
0153050
Fly Ash (%)
Cl- Concentration
0
200
400
600
800
1000
0.0 0.2 0.4 0.6 0.8 1.0
OH‐
(mM/L)
Chloride Added (% binder)
0153050
Fly Ash (%)
OH- Concentration

0.0
0.1
0.2
0.3
0.4
0.5
0.0 0.2 0.4 0.6 0.8 1.0
Cl‐/O
H‐
Chloride Added (% binder)
0153050
Fly Ash (%)
Effect of Fly Ash on Pore Solution Chemistry of Pastes with Admixed Chlorides (Thomas, Matthews & Haynes, 1996)
Cl-/OH-
• Fly ash reduced both Cl- & OH-
concentrations of the pore solution
• No consistent trend observed in the Cl-/OH- ratio with fly ash content
• At 0.4% chloride (by mass of binder) there is essentially no difference in the Cl-/OH- ratio regardless of fly ash content

No corrosion when Cl ≤ 0.70% by mass of binder
Plan to examine specimens again in May 2015 2018
Condition of Reinforced Prisms after 10 Years’ Exposure Outdoors
Chloride(% PC + FA)
Fly Ash Content (% mass of total cementing materials)
0 (Control) 15 30 50
0.0No evidence of corrosion on any specimens.0.4
0.7
1.0
Rust staining over all bars.Cracks > 1mm over bars
with 10‐mm cover.Cracks < 1mm over bars
with 20‐mm cover
Rust staining with hairline cracks (< 1mm) over bars with 10‐mm
cover only.
Minor rust staining over bars with 10‐mm
cover only.No cracking.

BRE Marine Exposure Site
IonsAnalyzed
Composition (g/L)BRE Atlantic
Cl 18.2 17.8SO4 2.60 2.54Ca 0.40 0.41Mg 1.20 1.50Na 9.74 9.95K 0.40 0.33

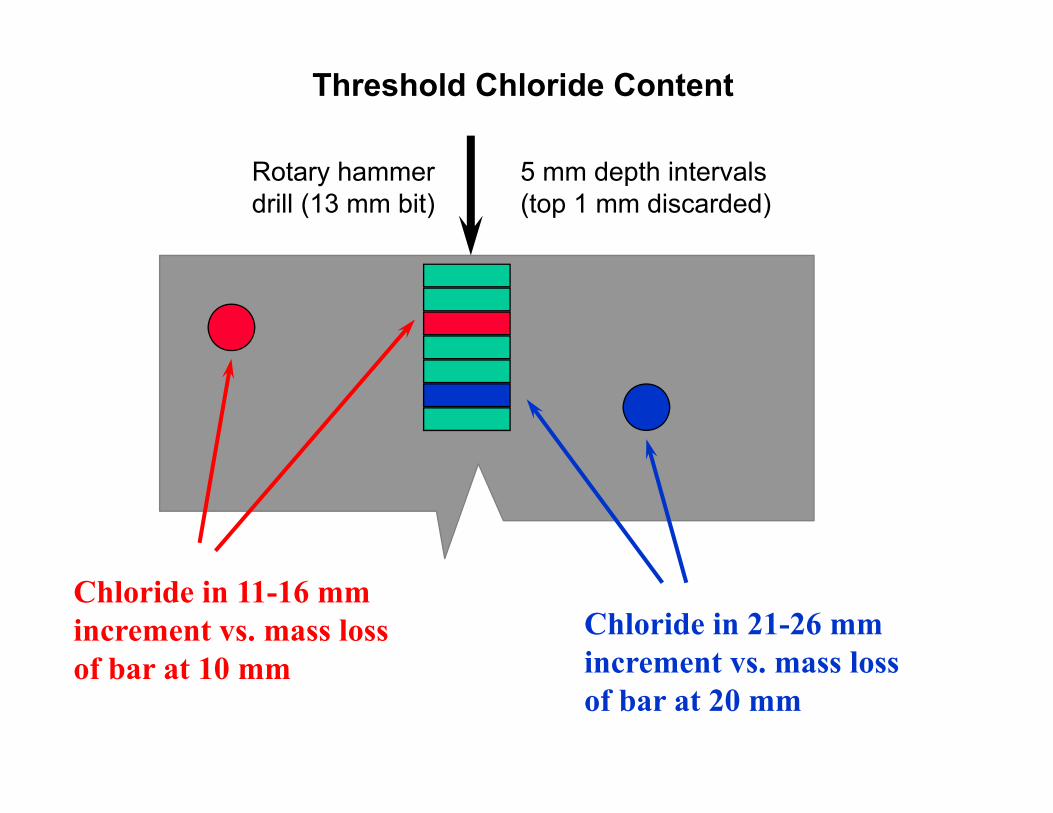
Rotary hammerdrill (13 mm bit)
5 mm depth intervals(top 1 mm discarded)
Threshold Chloride Content
Chloride in 11-16 mm increment vs. mass loss of bar at 10 mm
Chloride in 21-26 mm increment vs. mass loss of bar at 20 mm

Fly Ash(%)
Threshold, Ct
(% Cement)0 0.7015 0.6530 0.5050 0.20
Thomas, 1996

No fly ash
30% Fly Ash 50% Fly Ash
15% Fly Ash
Condition of Reinforced Prisms after 10 Years’ Exposure Outdoors
PC Concrete – significant corrosion of all rebar (with 10-mm & 20-mm cover) in all concrete samples
FA Concrete – minor corrosion signs but only for steel with 10-mm cover –no signs of corrosion for steel at 20 mm

C35 OPC Concretes
0.0
1.0
2.0
3.0
4.0
5.0
0 10 20 30 40Depth (mm)
Chl
orid
e (%
cem
ent) 28 days
1 year
2 years
4 years
10 years

C35 Concretes - 50% Fly Ash
0.0
1.0
2.0
3.0
4.0
5.0
0 10 20 30 40Depth (mm)
Chl
orid
e (%
cem
ent) 28-days
1 year
2 years
4 years
10 years
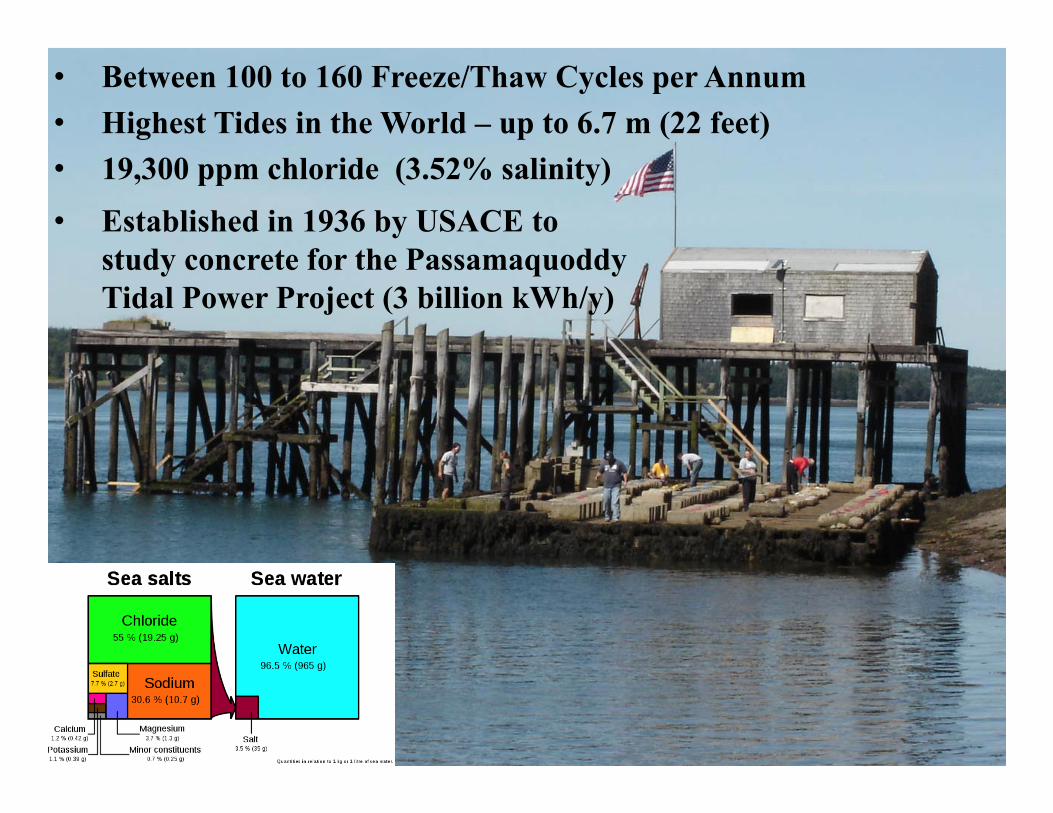
• Between 100 to 160 Freeze/Thaw Cycles per Annum• Highest Tides in the World – up to 6.7 m (22 feet)• 19,300 ppm chloride (3.52% salinity)• Established in 1936 by USACE to
study concrete for the Passamaquoddy Tidal Power Project (3 billion kWh/y)

Mid-Tide Wharf

Over 80 years studies have included:• fibre-reinforcement• polymer-impregnation• supplementary cementing materials• portland-limestone cement• sulfur concrete• high-alumina cement• ettringite-based rapid-set binders• w/cm and strength• ultra-high-performance concrete• corrosion-resistant reinforcement• impact of load and cracking• “mechanical air-entrainment”• corrosion-inhibiting admixtures• alkali-aggregate reaction

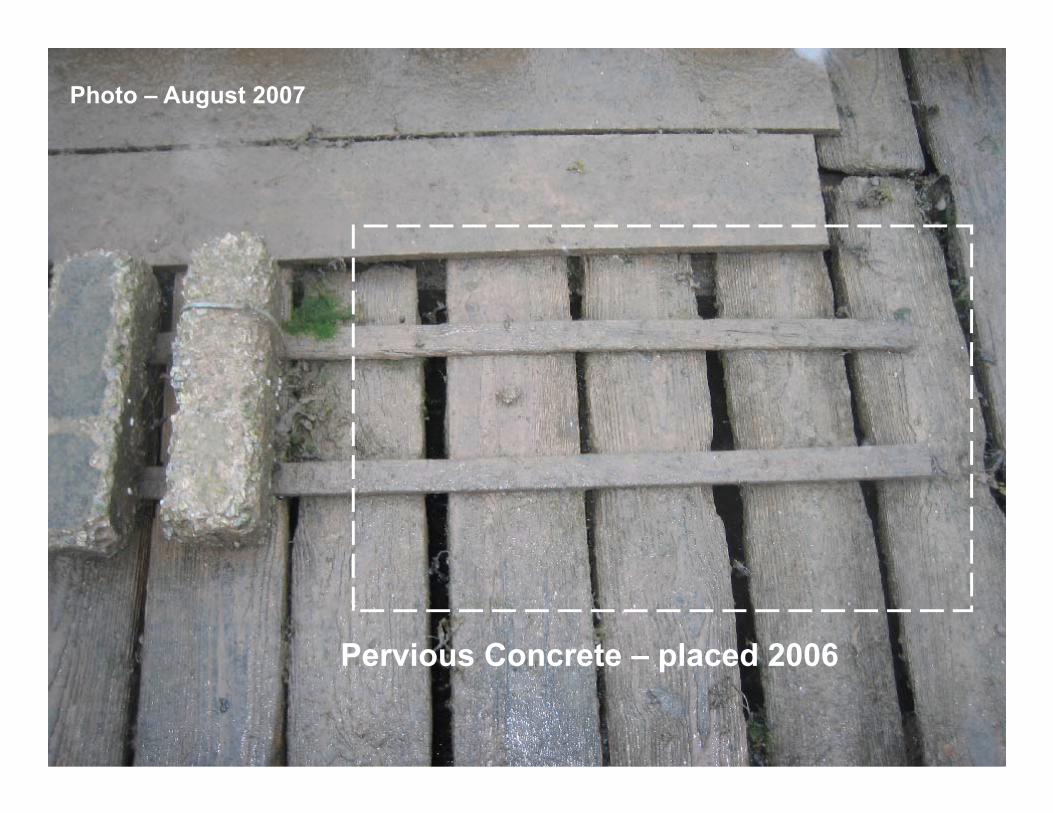
Photo – August 2007
Pervious Concrete – placed 2006


In Summer 2003: Started to retrieve blocks with a wide range of SCM as they reached an age of 25 years.

Phase I 1978 0 to 65% Slag
Phase II 1979Binary blends with Fly AshTernary blends with Fly Ash & Slag
Phase III 1980 0 to 65% Slag with LWA
Phase IV 1981 0 to 25% Fly Ash
Phase V 19820 to 80% Slag0 to 20% Silica Fume (AE & Non-AE)
Phase VI 1985 Ternary blends with Silica Fume & Fly Ash with & without fibers
Phase VII 1986 Silica Fume with LWA (Truck Mixed)
CANMET Test Program at Treat Island
Phases I to VII (1978 – 1986)
= specimens retrieved and tested Malhotra & Bremner, 1996

Phase VIII 1987 High-Volume Fly Ash Concrete (56% FA)
Phase IX 1988 Steel reinforced concrete with Fly Ash, Slag & Silica Fume
Phase X 1989 Silica Fume with LWA (3 sources)
Phase XI 1990 HVFA Concrete with LWA (3 sources)
Phase XII 1991 Uncoated and epoxy-coated steel
Phase XIII 1992 HVFA Concrete – 8 fly ash sources
Phase XIV 1994 ASR prevention with fly ash and silica fume
CANMET Test Program at Treat IslandPhases VIII to XIV (1987 – 1994)
= specimens retrieved and tested
Malhotra & Bremner, 1996

25‐Year Profiles: All Mixes (with W/CM = 0.40)
Mixes without SCM
Mixes with SCM

Phase VIII 1987 High-Volume Fly Ash Concrete (56% FA)
Phase IX 1988 Steel reinforced concrete with Fly Ash, Slag & Silica Fume
Phase X 1989 Silica Fume with LWA (3 sources)
Phase XI 1990 HVFA Concrete with LWA (3 sources)
Phase XII 1991 Uncoated and epoxy-coated steel
Phase XIII 1992 HVFA Concrete – 8 fly ash sources
Phase XIV 1994 ASR prevention with fly ash and silica fume
CANMET Test Program at Treat IslandPhases VIII to XIV (1987 – 1994)
= specimens retrieved and tested
Malhotra & Bremner, 1996

AndrewFahim
TedMoffatt
Acknowledgements

• Four concrete mixes• 100% Portland Cement (PC)• 25% Fly Ash (FA)• 10% Silica Fume (SF)• 50% Slag (SG)
• W/CM = 0.50, Air = 6 to 7%, Slump = 75 ± 25 mm
• Steel bars with cover depths of:• 30, 50 & 70 mm
• And 140 mm !
70 mm 50 mm 140 mm30 mm
Reinforced-Concrete Samples placed in 1987
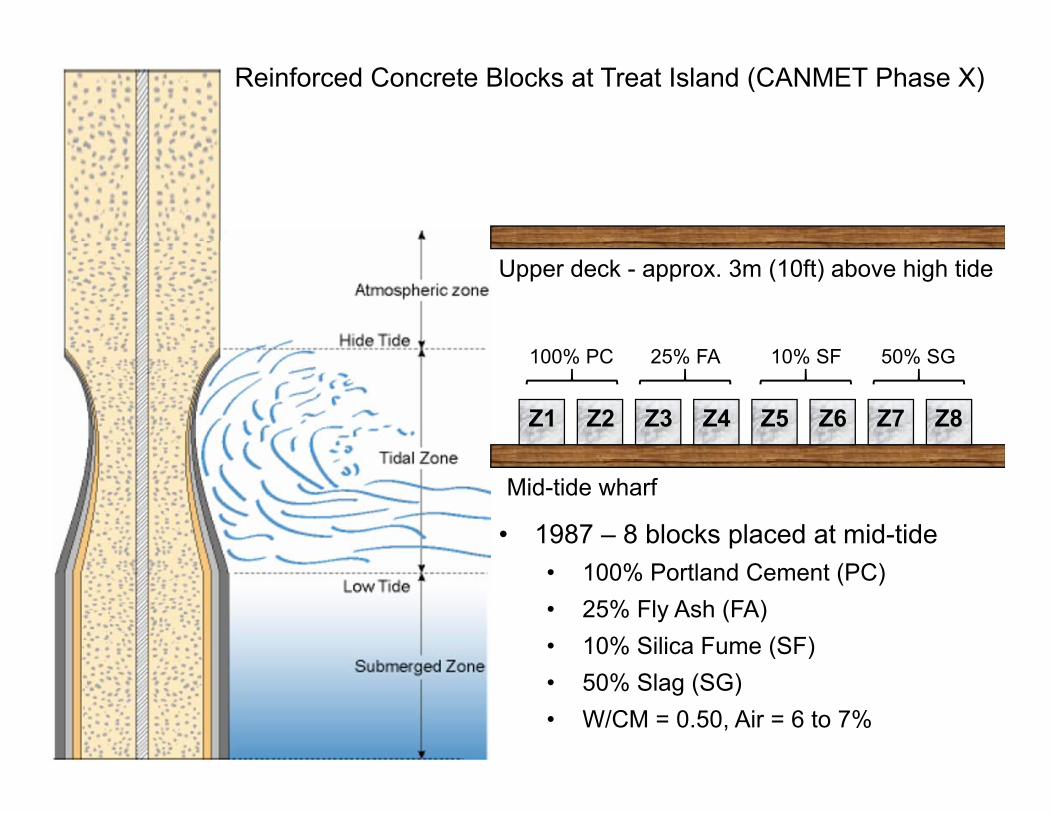
Mid-tide wharf
Upper deck - approx. 3m (10ft) above high tide
Z1 Z2 Z3 Z4 Z5 Z6 Z7 Z8
Reinforced Concrete Blocks at Treat Island (CANMET Phase X)
• 1987 – 8 blocks placed at mid-tide• 100% Portland Cement (PC)• 25% Fly Ash (FA)• 10% Silica Fume (SF)• 50% Slag (SG)• W/CM = 0.50, Air = 6 to 7%
100% PC 25% FA 10% SF 50% SG

Mid-tide wharf
Upper deck - approx. 3m (10ft) above high tide
Z2 Z4 Z6 Z8
• 1987 – 8 blocks placed at mid-tide• 2007 – 4 blocks moved to upper deck
Reinforced Concrete Blocks at Treat Island (CANMET Phase X)
Z1 Z3 Z5 Z7
No evidence of corrosion after 20 years


Mid-tide wharf
Upper deck - approx. 3m (10ft) above high tide
Z1
Z2
Z3
Z4
Z5
Z6
Z7
Z8
• 1987 – 8 blocks placed at mid-tide• 2007 – 4 blocks moved to upper deck• 2012 – blocks at mid-tide to UNB
for chloride profiling
Reinforced Concrete Blocks at Treat Island (CANMET Phase X)

Mid-tide wharf
Upper deck - approx. 3m (10ft) above high tide
Z2 Z4 Z6 Z8
• 1987 – 8 blocks placed at mid-tide• 2007 – 4 blocks moved to upper deck• 2012 – blocks at mid-tide to UNB
for chloride profiling• 2014 – 4 blocks on upper deck to UNB
for corrosion measurements
Reinforced Concrete Blocks at Treat Island (CANMET Phase X)

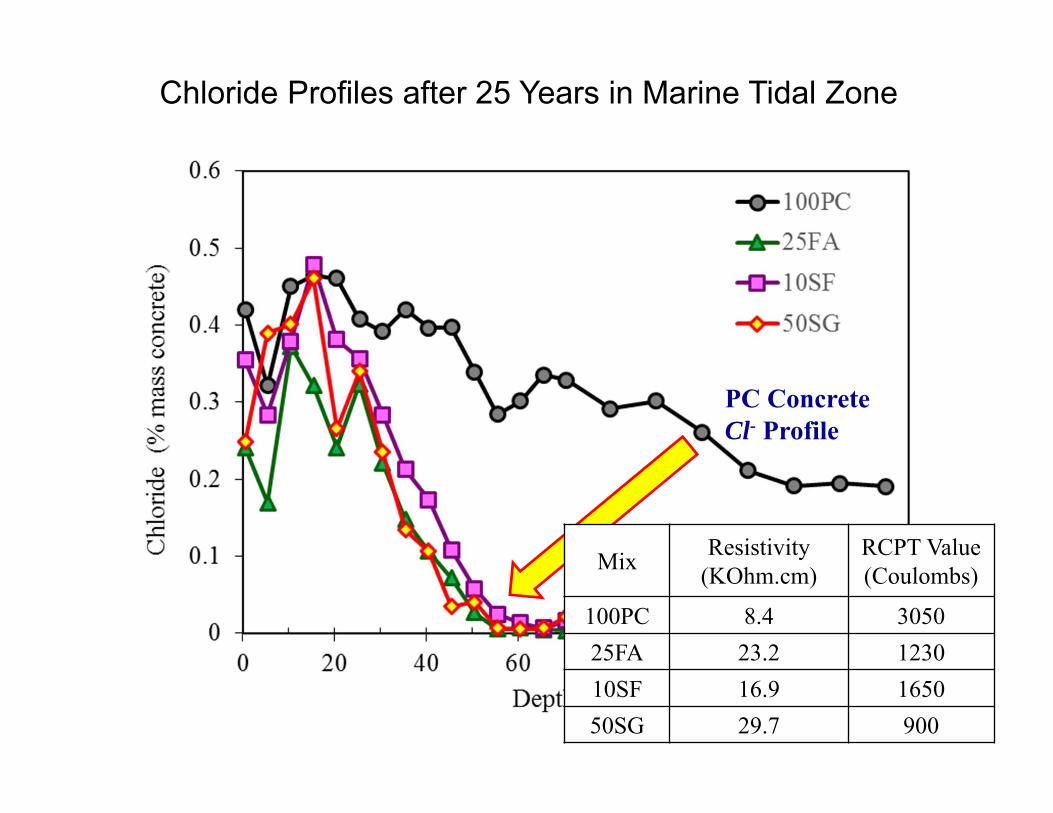
Chloride Profiles after 25 Years in Marine Tidal Zone
Chl
orid
e (%
)
Depth (mm)
PC ConcreteThreshold, Ct
PC ConcreteCl- Profile
SCM reduces chloride penetration,
Corrosion initiation occurs when the chloride threshold reaches the depth of the steel reinforcement
SCMCl-
SCM, Ct
but …
SCM also reduces chloride threshold
“The benefits of the reduction in the rate of diffusivity seems to be offset by the detrimental effects of SCMs on critical chloride threshold.”
Trejo & Tibbits, 2016
Chloride Profiles after 25 Years in Marine Tidal Zone
PC ConcreteCl- Profile
SCM ConcreteCl- Profiles
Mix Resistivity (KOhm.cm)
RCPT Value (Coulombs)
100PC 8.4 305025FA 23.2 123010SF 16.9 165050SG 29.7 900

Half-Cell Potentials
Chloride Profiles
Threshold
Active
Passive
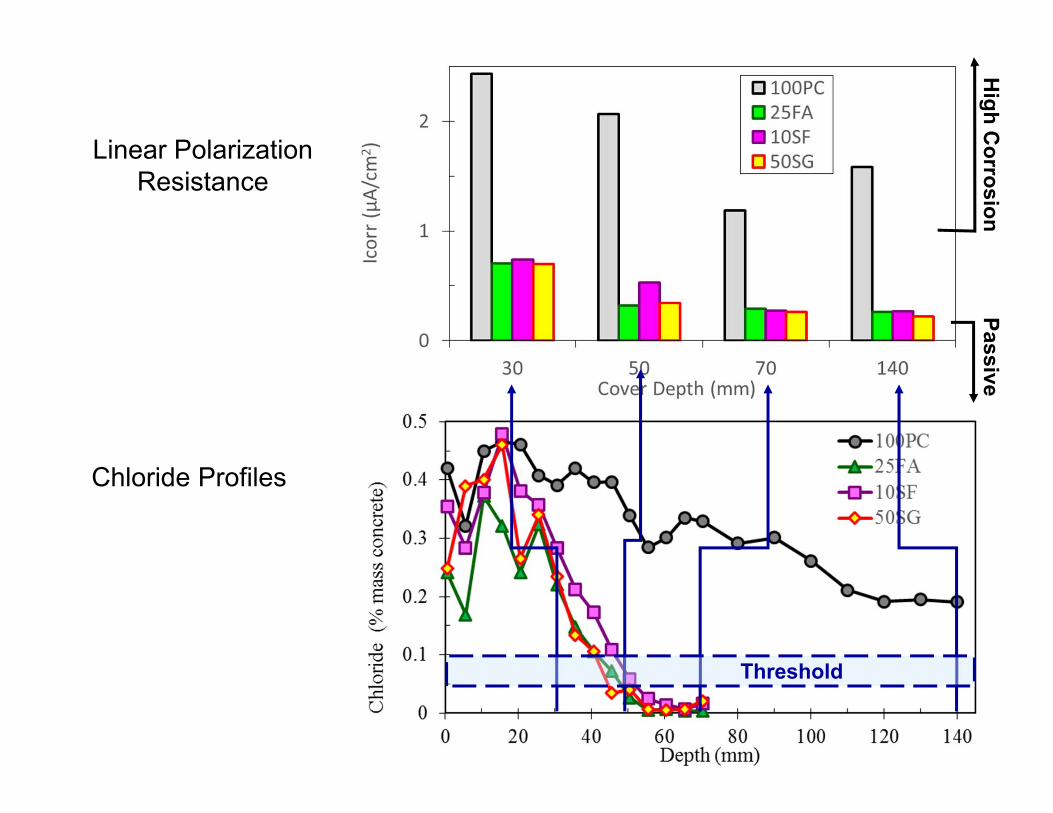
Linear PolarizationResistance
Chloride Profiles
Threshold
High C
orrosionPassive

25FA 50SG10SF
100% PC
Visual Condition of Steel with 70-mm Cover at 27 Years

Conclusions
• Data from long-term natural field exposure studies indicate that the beneficial effect of SCM’s increasing chloride resistance substantially outweighs any detrimental effect of reducing the chloride threshold for corrosion.
• SCM’s influence both the Cl- and the OH- concentration of the pore solution (generally reducing both) – the actual Cl-/OH- ratio may not be affected to any significant extent (similar differences in the ratio may be encountered with Portland cements of varying composition).
• Measuring transport coefficients and chloride thresholds at early ages in accelerated tests negates the long-term effects of SCM and likely leads to erroneous results
• Establishing realistic chloride concentration thresholds is critical for meaningful service life predictions. Need to develop appropriate methodology for determining chloride thresholds

Questions?

The End


