Page 1
Chemical Composition of Dew Resulting from Radiative Cooling at a Semi-arid Site
in Agra, India
ANITA LAKHANI,1 RAVINDRA SINGH PARMAR,1 and SATYA PRAKASH1
Abstract—Dew samples were collected between October 2007
and February 2008 from a suburban site in Agra. pH, conductivity,
major inorganic ions (F-, Cl-, NO3-, SO4
2-, Na?, K?, Ca2?, Mg2?,
and NH4?), and some trace metals (Cr, Sn, Zn, Pb, Cd, Ni, Mn, Fe,
Si, Al, V, and Cu) were determined to study the chemistry of dew
water. The mean pH was 7.3, and the samples exhibited high ionic
concentrations. Dew chemistry suggested both natural and
anthropogenic influences, with acidity being neutralized by atmo-
spheric ammonia and soil constituents. Ion deposition flux varied
from 0.25 to 3.0 neq m-2 s-1, with maximum values for Ca2?
followed by NH4?, Mg2?, SO4
2-, Cl-, NO3-, Na?, K?, and F-.
Concentrations of trace metals varied from 0.13 to 48 lg l-1 with
maximum concentrations of Si and minimum concentration of Cd.
Correlation analysis suggested their contributions from both crustal
and anthropogenic sources.
Key words: Dew, inorganic ions, trace metals, deposition
fluxes, deposition velocities.
1. Introduction
Dew is formed by condensation of atmospheric
water vapor on a substrate as a result of radiative
cooling. The conditions causing dew are well known
from both a meteorological (MONTEITH and
UNSWORTH, 1990) and physical point of view (BEYSENS,
1995). Deposition of several atmospheric chemical
species has been found to be enhanced when surfaces
are wetted by dew (SMITH and FRIEDMAN, 1982). Dew
forms at night when emission of infrared radiation
from surfaces causes them to cool below the dew
point. Atmospheric water vapor in contact with this
cooled surface condenses and forms a water film.
This condensation generally occurs on clear, atmo-
spherically stable nights when wind speeds are
minimal. Under these conditions, atmospheric gases
and particles may be transferred to the dew, where
they are more readily absorbed or retained than under
dry conditions, resulting in enhanced deposition. Dew
is a local phenomenon, significantly influenced by
microclimatic ambiance, land profile, and favorable
meteorological conditions. The chemical properties
of dew are driven by dissolution of surrounding gas
and atmospheric particles that fall on the substrate.
Studies have revealed that concentrations of chemical
species in dew samples are much higher than in rain
samples collected in the same areas (FOSTER et al.,
1990; WANGER et al., 1992). Dew composition can be
a good indicator of the level of atmospheric pollution
in a geographical region of interest, because of the
types and quantities of chemicals and materials
transported by dew and the range of its interactions.
Dew water dissolving water-soluble pollutants from
the atmosphere may have harmful influences on the
contacted materials. It has been reported that dew
formed on plants and leaves enhances the dry depo-
sition velocity of acid gases, such as HNO3 and SO2,
and may have an important role in acid deposition to
vegetation (WISNIESWSKI, 1982; WESLEY et al., 1990).Dew chemical properties have been far less
investigated than its meteorological and physical
properties. Early studies on dew chemistry empha-
sized only some inorganic ions (YAALON and GANOR,
1968; BRIMBLECOMBE and TODD, 1977). BRIMBLECOMBE
and TODD (1977) found that the pH of individual dew
droplets lay between 5 and 7, and that roughly equal
concentrations of potassium and sodium were present
in dew water. The mean pH of bulk dew water
formed on the surfaces of chemically inert collectors
has been reported to be 4.0 by PIERSON et al. (1986),
who also suggested that dew water was acidified
mainly by SO2, although some fraction of SO2
1 Department of Chemistry, Dayalbagh Educational Institute,
Dayalbagh, Agra, India. E-mail: [email protected]
Pure Appl. Geophys. 169 (2012), 859–871
� 2011 Springer Basel AG
DOI 10.1007/s00024-011-0329-8 Pure and Applied Geophysics
Page 2
dissolved in dew remained as S(IV). Studies by
PIERSON et al. (1986), who measured deposition of
trace elements to dew, found a dependence of depo-
sition velocity on aerosol size fraction. Elements
predominantly associated with fine particles (Pb, Se,
Br, and V) had the lowest deposition velocities
(\0.1 cm s-1), while elements with more mass on
coarse particles, such as Ba, Mg, and Ca, had the
highest deposition velocities (0.1–1.0 cm s-1).
CHAMEIDES (1987) studied generation of acid dew
from dry deposition of HNO3 as well as SO2, using a
model involving dynamical resistance, surface resis-
tance, and reactions in dew droplets. No large
variation in concentration of ions of various dew
samples was reported by FOSTER et al. (1990) over a
13-month period in Indiana, USA where the mean pH
of dew samples was found to be 6.82. WANGER et al.
(1992) reported mean pH of dew samples of 6.37 and
found that the concentrations of various ions in dew
were several times those in rain, attributing this to the
evaporation effect. KATAGIRI et al. (1995) pointed out
that some fraction of S(IV) in dew water was present
as hydroxyalkanesulfonate (HASA), which is an
adduct of S(IV) with aldehydes. There are several
reports about dew chemistry in urban areas such as in
Chile (RUBIO et al., 2002), USA (MULAWA et al.,
1967), Japan (CHIWA et al., 2003), and Jordan (JIRIES,
2001), where dew characteristics are rather different.
Dew water was found to be corrosive with high ionic
concentrations in Chile, very acidic in Japan, with
high concentrations of sulfates and nitrates at urban
and mountain sites of Mt. Gokurakuji, and slightly
alkaline and weakly mineralized in Jordan. On an
island (Corsica, France), dew characteristics were
found to be comparable to those in Jordan, except that
dew was less alkaline; water was potable with respect
to the main ions and constituents investigated
(MUSELLI et al., 2002). The importance of dew in the
mercury cycle was investigated during three sampling
periods in the Great Lakes region and one in the
Florida Everglades in North America (MALCOLM and
KEELER, 2002).
Recently, BEYSENS et al. (2006) investigated both
the chemical and bacteriological properties of dew
water and compared them with rainwater in urban
area of Bordeaux, France, finding that dew exhibited
ion characteristics close to low mineralized
commercial spring water found in Europe. Most
recently, KLIMASZEWSKA et al. (2009) applied linear
discriminant analysis to study the effect of local
meteorological characteristics on dew chemistry in
samples collected from various sites in Poland, and
POLKOWSKA et al. (2008) reported the chemical char-
acteristics of dew water collected at several locations
in Poland.
Typically, most measurements of dew chemistry
have focused on the effect of dew on acid deposition.
Major ions were found in dew water in equal or
higher concentrations than in precipitation from the
same location. Consequently, in a watershed where
dew is a frequent phenomenon or has a major
hydrological input, dew may also be a major source
of nutrients or pollutants. There is limited research
devoted to the composition and role of dew in the
cycling of elements. The chemistry of wet deposition
in the form of rain, dry deposition and aerosol com-
position has been studied extensively at the site of
current study (SAXENA et al., 1991, 1996, 1997;
KUMAR et al., 1993; KHARE et al., 1997; KHARE et al.,
2000; SATSANGI et al., 1998; SINGH et al., 2001;
PARMAR et al., 2001; LAKHANI, 2005; SINGH and
KHARE, 2006; LAKHANI et al., 2007, 2008), but dew
chemistry has been less explored. In the present
study, dew samples collected at this semi-arid site in
India were analyzed to reveal the nature of deposi-
tion. A preliminary attempt is made to quantify the
relationship between aerosol concentrations and
concentrations in dew water.
2. Methodology
2.1. Sampling Site
The sampling site for this study is located on our
institute campus in Dayalbagh (population approxi-
mately 15,000), a small suburb lying north of Agra
City (27�10’N, 78�05’E), which lies in a semi-arid
zone, adjacent to the Thar Desert of Rajasthan. A
map of the sampling site is shown in Fig. 1. The
sampling site lies by the side of a road that carries
mixed vehicular traffic, moderate (of the order of 105
vehicles per day) during the day and minimal (of the
order of 102 vehicles per night) at night. The campus
860 A. Lakhani et al. Pure Appl. Geophys.
Page 3
lies about 2 km north of a national highway which
has dense vehicular traffic (108 vehicles) throughout
the day and night. The site is surrounded by a variety
of deciduous trees and agricultural fields. The soil is
sandy and calcareous by nature. There is no industry
in this suburb. During the study period, temperatures
ranged from 2–20�C and the average relative humid-
ity (RH) was 70%.
2.2. Dew Collection and Measurement
Dew occurs mostly between October to March,
with maximum accumulation in December and
January. Maximum dewfall occurs at height of
100 cm above ground and decreases exponentially
downwards. Since one effect expected of dew is to
dissolve previously deposited material and to react
with the surface on which it forms, dew was collected
on two polytetrafluoroethylene (PTFE) mounted trays
of area 1,740 cm2. The collectors were placed on a
1-m-high iron stand above the ground at the onset of
dew formation. Before employing, the collectors
were washed with detergent solution and thoroughly
washed with deionized water until the conductivity of
the rinsed water reduced to around 1 lS cm-1. To
eliminate any dilution of the samples from the
washing water, the collectors were dried by blowing
hot air. To exclude dry deposition of gases and
particles prior to the onset of dew formation,
collectors were deployed at 6.00 p.m. (local time)
in the evening when dew formation commenced and
the overnight dew samples were collected about 12 h
later at 6.00 a.m. the next morning before sunrise by
scrapping off with a clean Teflon scraper and
Figure 1Map of sampling site (Agra)
Vol. 169, (2012) Chemical Composition of Dew 861
Page 4
transferred to a clean polyethylene bottle. The dew
collected in this manner contains not only gas-phase
substances and particulate matter deposited during
dew formation but also dry deposition. Dew collec-
tion took place only on rainless nights to eliminate
any influence of rain droplets on collected dew
samples. The dew samples were weighed to deter-
mine the volume, considering the density to be equal
to that of water. A total of 50 dew samples were
collected during October 2007–March 2008. Maxi-
mum dew was observed in the month of January (our
sampling period), between 9 p.m. to 6 a.m. Hence,
for all calculation purposes, dew occurrence time was
taken as 9 h.
Electrical conductivity and pH were determined
immediately using a conductivity meter and a pH
meter, respectively, in an aliquot of the sample. pH
was measured with an Elico digital pH meter (model
Li-122) and a glass and a reference electrode assembly
using the two-buffer technique. Standard deviation for
pH measurement was 0.05 units. For conductivity
measurements, a Systronics conductivity meter
(model 304) was used. Sample conductance was
measured after calibration of the instrument with
0.1 N KCl at the prevailing temperature. The conduc-
tivity cell had accuracy of 0.5%. The remaining
sample was then filtered with 0.45 lm pore-size
membrane filter. A fraction of the sample was
transferred into a clean PTFE bottle and spiked with
CHCl3 at ratio of 1:10 v/v to inhibit microbial growth
and refrigerated at 4�C in a refrigerator. This part was
used for analysis of the major anions and NH4? while
the other fraction of the sample was acidified to low pH
(pH 2) by adding concentrated HNO3 and stored in an
acid-leached bottle for use in analysis of major cations.
Root-mean-square reproducibility in collection
and analysis of physical parameters such as pH and
conductivity evaluated from dew collectors deployed
concurrently was 3% for amount of water deposited,
5% for conductivity, and 6% for pH. The discrepan-
cies in the concentrations for all measured species
were low (3–12%), as listed in Table 1. Conceivably
the discrepancies are genuine in the sense that
something might have fallen onto one collector and
not the other during the night. Field blanks were also
collected to detect any contamination of the samples
which might have resulted due to improper washing
of the collectors and any impurity in the deionized
water being used for preparation of solutions and
sample handling. To collect field blanks, trays were
exposed to the atmosphere for 10 min and then rinsed
thoroughly with deionized water and stored in
polyethylene bottles after their volume had been
raised to 100 ml. These samples were treated and
analyzed in a similar manner to the dew samples. The
values of different ionic components in the field
blanks are also listed in Table 1.
2.3. Sampling of Aerosols
Aerosols were also collected during this period to
study the relation of dew with aerosol. Aerosol
sampling was also conducted on the roof (10 m) of
the faculty building on the institute campus, which
was close to the dew sampling site. Sampling was
performed using a four-stage cascade particle sepa-
rator (CPS-105; Kimoto, Japan). The CPS has 50%
efficient cutoff in aerodynamic diameter classes of
0.7–1.6, 1.6–5.4, 5.4–10, and [10 lm for the four
stages. The average flow rate of the CPS was
800 ± 0.5 l min-1. Flow rate was indicated by a
rotameter attached to an automatic flow controller.
Despite this, the flow rate was checked after every
3 h. The deviation in flow rate was very small and
therefore was considered negligible. Aerosols were
collected on 20 9 25 cm2 Whatman 41 filter papers.
Filter papers were carefully equilibrated in desicca-
tors before and after sampling to eliminate the effect
of humidity. Sampling was performed over 24 h to
obtain sufficient mass of aerosol for analysis. The
mass of aerosol particles collected on each stage was
Table 1
Experimental uncertainties
Component Collection
variability (%)
Field blanks
(leq l-1)
F- 4 0.4
Cl- 3 0.3
NO3- 11 0.5
SO42- 12 0.3
NH4? 7 0.4
Ca2? 6 1.1
Mg2? 2 0.5
Na? 3 0.5
K? 5 0.4
862 A. Lakhani et al. Pure Appl. Geophys.
Page 5
determined by the difference in weight before and
after sampling.
2.4. Analysis
To determine the concentration of major cations
and anions along with trace metals, filters were cut
into two equal parts of known area. One part of the
filter was extracted by ultrasonic agitation in 50 ml
deionized water for 1 h. The extracts were then
filtered through 0.45 lm pore-size nylon membrane
filters, and the water-soluble cations and anions were
determined in these filters in a similar manner to that
described for the dew samples. For analysis of trace
metals Cr, Sn, Zn, Pb, Cd, Ni, Mn, Fe, Si, Al, V, and
Cu, the other half of the filter paper was digested by
acid treatment. Each filter was folded and placed in a
beaker. Then 5 ml nitric acid (12 N) was added, and
the beaker was covered with a watch glass and heated
slowly. Before complete evaporation, 5 ml acid was
again added, and the beaker was covered with a
watch glass and heated to obtain refluxing action
until clear solution was obtained. The solution was
filtered using 0.45 lm pore-size nylon membrane
filters. The filtrate was transferred to 50-ml volumet-
ric flask and made up with deionized water. All the
trace metals were analyzed using inductively coupled
plasma atomic emission spectroscopy (ICP-AES,
Jobin Yuon Panorama 46P). To test for complete
extraction, the residue of the filters was extracted
again and analyzed by the same procedure. The levels
of trace metals were below detection limit in these
test samples.
Major anions (Cl-, F-, NO3-, and SO4
2-) were
analyzed by ion chromatograph (Dionex DX-500).
Separation was accomplished using a separator
column (AS4A-SC) with self-regenerating suppressor
which ensured the lowest possible background noise
level and detection limit. The column was protected
upstream by a guard column (AG4A). A sample of
10 lL was injected. The eluent was a mixture of
sodium carbonate (1.8 mM) and sodium bicarbonate
(1.7 mM), passed at flow rate of 1 ml min-1. All
samples were first allowed to come to room temper-
ature before analysis and were injected into the
chromatograph without dilution. All concentrations
were calculated based on chromatogram areas of
standards prepared daily from 100 ppm stock solu-
tion. The stock solutions were prepared weekly,
spiked with CHCl3, and stored at 4�C. No loss was
found in 1 week. The major cations (Na?, K?, Ca2?,
and Mg2?) and trace metals (Sn, Cr, Zn, Pb, Cd, Ni,
Mn, Fe, Si, Al, V, and Cu) were analyzed using ICP-
AES (Jobin–Yvon Panorama 46P). Typical argon
flow rates were 1 l min-1 for the carrier, 0–1 l min-1
for the auxiliary plasma, and 15 l min-1 for the
coolant plasma. NH4? was analyzed spectrophotomet-
rically by the indophenol blue method. Among the
collected samples, 45 had sufficient volume for
complete chemical analysis.
For quality control of the analytical results,
measured and calculated electric conductivities were
compared. The mean ratio of calculated to measured
conductivity was observed to be 0.92 ± 0.10.
Dewfall ranged from 0.1 to 0.5 l m-2 during the
sampling period. To account for the effect of amount
of dew water on ion concentrations, the volume-
weighted mean concentration (VWM) and the vol-
ume-weighted standard deviation (VWSD) were
calculated for each ion (DAYAN et al., 1985). The
VWM concentration was calculated using the for-
mula X ¼PN
i¼1 XiPi=PN
i¼1 Pi;
VWSD ¼p
NPN
i¼1 P2i Xi½ �2�ð
PNi Pi Xi½ �Þ2
h i
ðPN
i PiÞ2 N � 1ð Þ;
where Pi is the dew amount corresponding to the ith
sample, Xi is the concentration of the ith species, and
N is the number of samples.
From the chemical composition of the dew
samples and amount of water collected, deposition
fluxes and deposition velocities for the major ions
were calculated. The accumulated amounts of various
species deposited per unit area in the dew, referred to
as deposition accumulation, were obtained by multi-
plying the concentration in each sample (Ci) by the
respective amount of water per unit area (Vi) and
summing the products. The fluxes were obtained by
dividing the accumulation by the sum of collection
times (t).
Deposition accumulation ¼X
Ci Vi;
Deposition flux ¼P
Ci ViPt
:
Vol. 169, (2012) Chemical Composition of Dew 863
Page 6
Deposition velocity (Vd) is defined as the ratio
between deposition flux (F) and atmospheric concen-
tration (C). Deposition velocity is dependent on the
chemical characteristics of the measured species, the
size of the particle, the nature of the surface upon which
the deposition occurs, and the prevailing atmospheric
conditions, such as winds, turbulence, temperature,
and humidity. Dry deposition velocities may vary by
orders of magnitude depending on the above factors,
thus introducing large uncertainties in estimation of
dry deposition rates from airborne concentrations.
3. Results and Discussion
3.1. Chemical Composition of Dew Water
The mean pH during the sampling period was
calculated from the VWM concentration of H?, i.e.,
pH = -log [H?]. Figure 2a shows a statistical sum-
mary of the ionic concentration, the VWM
concentrations are shown in Fig. 2b, while their
percentage contributions are shown in Fig. 2c. The
Event Variation of pH is shown in Fig. 3. The
horizontal line at pH 5.6 represents the reference
level. The samples had pH varying from 6.3 to 7.8.
The volume-weighted mean pH was 7.3, indicating
alkaline nature. In the present study four anions (F-,
Cl-, NO3-, and SO4
2-) and five cations (Na?, K?,
Ca2?, Mg2?, and NH4?) were quantitatively mea-
sured. To ensure the reliability of these ion data and
to assess the possibility of any other ions with notable
concentration that were ignored, the balance of total
anions (P
-) versus total cations (P
?) was checked
carefully. Average ionic balance on an equivalent
basis at this site was (P
-/P
?) was 0.8. This
indicates contribution of some unmeasured anions to
Figure 2a Box plots of ionic constituents. b Volume-weighted means of ionic constituents. c Percentage contribution of ionic constituents
864 A. Lakhani et al. Pure Appl. Geophys.
Page 7
the dew water composition. Anion deficit could be
attributed to some unmeasured anions such as
bicarbonate that could arise from dissolution of
carbonate salts and organic anions formate and
acetate, which in a previous study at this site have
shown concentrations varying between 0.9–60.0 and
2.1–18.9 leq l-1, respectively, accounting for
approximately 3.7% of total ionic concentration
(KHARE et al., 2000).
The total ionic strength of dew samples calculated
from the measured ionic concentrations ranged
between a minimum of 4,846 leq l-1 and a maxi-
mum of 43,688 leq l-1. These values are in the same
range of concentration as those derived from mea-
surements performed on dew and fog water
concentration in Delhi, India (KHEMANI et al., 1987).
These values indicate high pollutant concentration in
the region during the winter period. Figure 2b shows
that the concentrations of major ions were in the
order: NH4? [ NO3
- [ Ca2? [ Cl- [ SO42- [
Mg2? [ K? [ F-. The average concentrations of
NH4?, Ca2?, Mg2?, and Na? were 780, 300, 184, and
190 leq l-1, respectively. NH4? was the major cation
and contributed most (28.5%) to the total ionic
concentration; it could be derived from human and
animal excrements or agricultural activities. Ca2?
accounted for 11% of the ionic concentrations and
could be derived from dissolution of minerals CaCO3,
CaCO3�MgCO3, and CaSO4�2H2O. NO3- was the
largest anion, mainly deriving from vehicle emis-
sions, while SO42- could be derived from coal
combustion. The cations (Na?, K?, Ca2?, and
Mg2?) contributed 27.2% and NH4? 28.5%, whereas
the contribution of the anions (F-, Cl-, NO3-, and
SO42-) was relatively small, accounting for 44.1%
(Fig. 2c).
3.2. Equivalent Ratios between Concentrations
of Analytes
Since the site is an inland site, influence of sea salt
on ionic composition is expected to be negligible.
Equivalent sea salt ratios are Cl-/Na? = 1.17, SO42-/
Na? = 0.125, K?/Na? = 0.22, Ca2?/Na? = 0.44,
and Mg2?/Na? = 0.25. These ratios were calculated
for dew water concentrations, being in general higher
than the seawater ratios (1.06, 1.39, 0.69, 1.69, and
1.1, respectively). Deviations above the seawater
ratios have also been observed in precipitation studies
conducted previously at this site (SAXENA et al., 1996;
SATSANGI et al., 1998; SINGH et al., 2001). Cl- in dew
water may result from absorption of HCl gas by
airborne liquid droplets followed by deposition and
soil-derived chloride salts. Hydrogen chloride is
possibly deposited via smoke from coal-fired domes-
tic stoves, where fuel of different quality is burnt,
frequently with addition of household refuse contain-
ing plastic, printed paper, wood sticks, crop residues,
and cowdung cakes. The average SO42-/Na? ratio was
also higher than the seawater ratio, which can be
attributed to emission from fuel combustion. The
average K?/Na? ratio was also higher; the potassium
excess could be attributed to fertilizers, windblown
soil and dust, and biomass burning. The higher Ca2?/
Na? ratio indicates that the major source of calcium
is airborne soil, and agricultural and constructional
activities carried out in the vicinity of the site. The
NO3-/SO4
2- ratio ranged over a wide interval, but in
general the concentration of SO42- was greater than
that of NO3-.
3.3. Relationships between Chemical Species
To investigate the possible sources of ions in dew
water, correlations between ionic concentrations were
determined. The correlation matrix for the ion pairs is
presented in Table 2. Significant correlation among
the soil-derived ions Ca2?, Mg2? and Na? was
observed (Ca2? and Mg2? = 0.86, Ca2? and
Figure 3Event Variation of pH
Vol. 169, (2012) Chemical Composition of Dew 865
Page 8
Na? = 0.88, Mg2? and Na? = 0.84). SO42- and
NO3- were moderately correlated (r = 0.68), proba-
bly because of co-emission of their precursors (SO2
and NOx), and they were strongly correlated with
Ca2?, Mg2? and Na? (SO42- and Ca2? = 0.81, SO4
2-
and Mg2? = 0.72, SO42- and Na? = 0.79, Ca2? and
NO3- = 0.46, Mg2? and NO3
- = 0.55, Na and
NO3- = 0.49), suggesting similarity of their behavior
in dew deposition and also indicating both natural
and anthropogenic influences on dew water. These
correlations also indicate that soil dust might also be
a significant source of these ions apart from being
formed in the atmosphere from their anthropogenic
precursors. These react with atmospheric NH3 in the
gas phase to form ammonium salts, and their acidic
effects are neutralized. The concentrations of NH4?
correlated closely with SO42- and NO3
- (r = 0.91 and
0.46, respectively). It is likely that the increase in
dew pH caused by absorption of NH3 as well as
CaCO3 enhanced dissolution of S(IV) and N(III),
which might be derived from atmospheric SO2 and
HNO2, respectively, as well as increasing dissolution
of the weak acids formic and acetic acid that existed
in the vapor phase. The [NH4?] to [SO4
2-] ? [NO3-]
ratio varied from 0.19 to 3.89, and [NH4?] was also
positively correlated (r = 0.51) with the sum of
[NO3-] and [SO4
2-].
The correlation between pH and the log concen-
tration of ions that should influence it was small and
insignificant. The partial correlations of pH with
SO42-and NO3
- controlled for Ca2?, Mg2?, and NH4?
were positive but not significant (rpH;SO2�4 ;Ca2þ = 0.14,
rpH;SO2�4 ;NHþ
4= 0.04, rpH;NO�3 ;Ca2þ = 0.17, rpH;NO�3 ;Mg2þ
= 0.20, rpH;NO�3 ;NHþ4
= 0.11). The NH4?/SO4
2- ratio
was 2.74 ± 0.36. The relationship between the NH4?/
SO42- ratio and pH was negligible, indicating that an
influence of soil-derived SO42- and direct scavenging
of locally emitted NH3 are important. pH and the
NH4?/SO4
2- ratio varied independently (1.13–5.54);
consequently, the correlation coefficient was insig-
nificant. The NH4?/NO3
- and NH4?/(SO4
2- ? NO3-)
ratio also followed a similar relationship with pH
(rNHþ4=NO�3 :pH = 0.30 and rNHþ
4=NO�3 þSO2�
4 :pH = 0.10).
Also, no relationship was evident between pH and the
Ca2?/SO42- ratio. Soil is considered to be the major
source of Ca2? and industrial pollution the main
source of SO42- and NO3
- particles in the atmosphere.
However, dominance of these components in the
atmosphere depends upon the area and their sources.
The mass ratio of Ca2?/SO42- can serve as an
indicator for the pH level in precipitation samples.
This ratio in the dew samples collected at this site
was found to be above unity (1.3).
3.4. Dew Acidification/Neutralization Process
HARA et al. (1995) suggested the use of a
quantitative index pAi while discussing the acid–
base relationship and the chemistry of different kinds
of atmospheric water. pAi is the hypothetical pH of
atmospheric water if no neutralization takes place for
both sulfuric and nitric acid. This index focuses only
on the acidic component, whereas the actual pH is
determined by the balance between acidic and
neutralizing components.
pAi ¼ �log nssSO2�4 þ NO�3
� �;
Table 2
Correlation coefficients of major cations and anions in dew (N = 45)
Component Ca2? Cl– F- K? Mg2? Na? NH4? NO3
- SO42-
Ca2? 1
Cl– 0.78** 1
F- 0.14 -0.03 1
K? -0.20 -0.25 0.36* 1
Mg2? 0.86** 0.79** -0.10 -0.23 1
Na? 0.88** 0.96** -0.03 -0.12 0.84** 1
NH4? 0.80** 0.74** 0.26 -0.32 0.67* 0.66* 1
NO3- 0.46* 0.53* 0.16 -0.19 0.55* 0.49* 0.46* 1
SO42- 0.81** 0.65* 0.42* -0.23 0.72** 0.79** 0.91** 0.68* 1
One tailed significance: P = 0.01*, 0.001**
866 A. Lakhani et al. Pure Appl. Geophys.
Page 9
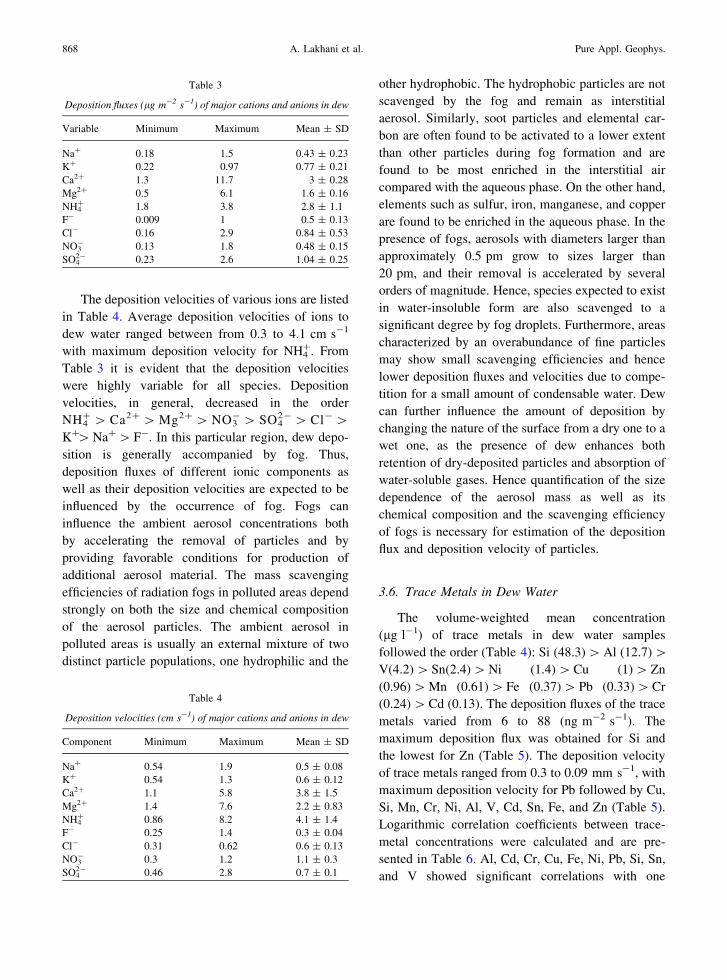
where nssSO42- is non-sea-salt sulfate
Since at this site the sea salt contribution is
negligible, non-sea-salt sulfate has been considered
as total sulfate. For all of the samples, pAi values
appeared in a highly limited range (when compared
with pH values) from 3.89 to 4.64, with mean value
of 4.29. The difference between pH and pAi values
was large, which suggests that dew water was
neutralized with NH3 or CaCO3, as shown in Fig. 4.
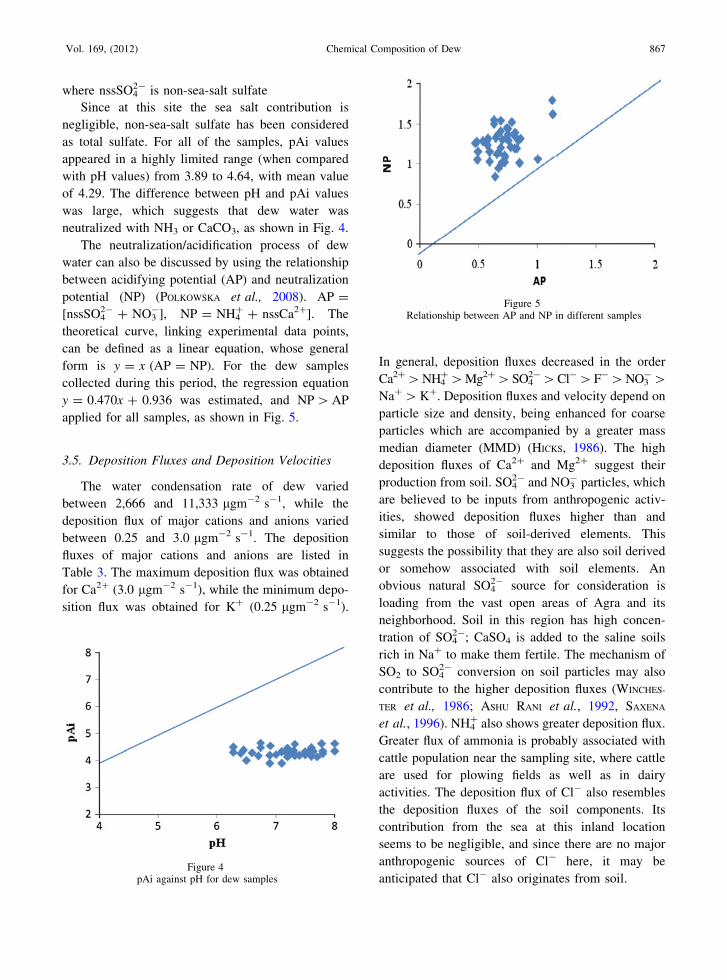
The neutralization/acidification process of dew
water can also be discussed by using the relationship
between acidifying potential (AP) and neutralization
potential (NP) (POLKOWSKA et al., 2008). AP =
[nssSO42- ? NO3
-], NP = NH4? ? nssCa2?]. The
theoretical curve, linking experimental data points,
can be defined as a linear equation, whose general
form is y = x (AP = NP). For the dew samples
collected during this period, the regression equation
y = 0.470x ? 0.936 was estimated, and NP [ AP
applied for all samples, as shown in Fig. 5.
3.5. Deposition Fluxes and Deposition Velocities
The water condensation rate of dew varied
between 2,666 and 11,333 lgm-2 s-1, while the
deposition flux of major cations and anions varied
between 0.25 and 3.0 lgm-2 s-1. The deposition
fluxes of major cations and anions are listed in
Table 3. The maximum deposition flux was obtained
for Ca2? (3.0 lgm-2 s-1), while the minimum depo-
sition flux was obtained for K? (0.25 lgm-2 s-1).
In general, deposition fluxes decreased in the order
Ca2? [NH4? [Mg2? [SO4
2- [Cl- [F- [NO3- [
Na? [ K?. Deposition fluxes and velocity depend on
particle size and density, being enhanced for coarse
particles which are accompanied by a greater mass
median diameter (MMD) (HICKS, 1986). The high
deposition fluxes of Ca2? and Mg2? suggest their
production from soil. SO42- and NO3
- particles, which
are believed to be inputs from anthropogenic activ-
ities, showed deposition fluxes higher than and
similar to those of soil-derived elements. This
suggests the possibility that they are also soil derived
or somehow associated with soil elements. An
obvious natural SO42- source for consideration is
loading from the vast open areas of Agra and its
neighborhood. Soil in this region has high concen-
tration of SO42-; CaSO4 is added to the saline soils
rich in Na? to make them fertile. The mechanism of
SO2 to SO42- conversion on soil particles may also
contribute to the higher deposition fluxes (WINCHES-
TER et al., 1986; ASHU RANI et al., 1992, SAXENA
et al., 1996). NH4? also shows greater deposition flux.
Greater flux of ammonia is probably associated with
cattle population near the sampling site, where cattle
are used for plowing fields as well as in dairy
activities. The deposition flux of Cl- also resembles
the deposition fluxes of the soil components. Its
contribution from the sea at this inland location
seems to be negligible, and since there are no major
anthropogenic sources of Cl- here, it may be
anticipated that Cl- also originates from soil.Figure 4
pAi against pH for dew samples
Figure 5Relationship between AP and NP in different samples
Vol. 169, (2012) Chemical Composition of Dew 867
Page 10
The deposition velocities of various ions are listed
in Table 4. Average deposition velocities of ions to
dew water ranged between from 0.3 to 4.1 cm s-1
with maximum deposition velocity for NH4?. From
Table 3 it is evident that the deposition velocities
were highly variable for all species. Deposition
velocities, in general, decreased in the order
NH4? [ Ca2? [ Mg2? [ NO3
- [ SO42- [ Cl- [
K?[ Na? [ F-. In this particular region, dew depo-
sition is generally accompanied by fog. Thus,
deposition fluxes of different ionic components as
well as their deposition velocities are expected to be
influenced by the occurrence of fog. Fogs can
influence the ambient aerosol concentrations both
by accelerating the removal of particles and by
providing favorable conditions for production of
additional aerosol material. The mass scavenging
efficiencies of radiation fogs in polluted areas depend
strongly on both the size and chemical composition
of the aerosol particles. The ambient aerosol in
polluted areas is usually an external mixture of two
distinct particle populations, one hydrophilic and the
other hydrophobic. The hydrophobic particles are not
scavenged by the fog and remain as interstitial
aerosol. Similarly, soot particles and elemental car-
bon are often found to be activated to a lower extent
than other particles during fog formation and are
found to be most enriched in the interstitial air
compared with the aqueous phase. On the other hand,
elements such as sulfur, iron, manganese, and copper
are found to be enriched in the aqueous phase. In the
presence of fogs, aerosols with diameters larger than
approximately 0.5 pm grow to sizes larger than
20 pm, and their removal is accelerated by several
orders of magnitude. Hence, species expected to exist
in water-insoluble form are also scavenged to a
significant degree by fog droplets. Furthermore, areas
characterized by an overabundance of fine particles
may show small scavenging efficiencies and hence
lower deposition fluxes and velocities due to compe-
tition for a small amount of condensable water. Dew
can further influence the amount of deposition by
changing the nature of the surface from a dry one to a
wet one, as the presence of dew enhances both
retention of dry-deposited particles and absorption of
water-soluble gases. Hence quantification of the size
dependence of the aerosol mass as well as its
chemical composition and the scavenging efficiency
of fogs is necessary for estimation of the deposition
flux and deposition velocity of particles.
3.6. Trace Metals in Dew Water
The volume-weighted mean concentration
(lg l-1) of trace metals in dew water samples
followed the order (Table 4): Si (48.3) [ Al (12.7) [V(4.2) [ Sn(2.4) [ Ni (1.4) [ Cu (1) [ Zn
(0.96) [ Mn (0.61) [ Fe (0.37) [ Pb (0.33) [ Cr
(0.24) [ Cd (0.13). The deposition fluxes of the trace
metals varied from 6 to 88 (ng m-2 s-1). The
maximum deposition flux was obtained for Si and
the lowest for Zn (Table 5). The deposition velocity
of trace metals ranged from 0.3 to 0.09 mm s-1, with
maximum deposition velocity for Pb followed by Cu,
Si, Mn, Cr, Ni, Al, V, Cd, Sn, Fe, and Zn (Table 5).
Logarithmic correlation coefficients between trace-
metal concentrations were calculated and are pre-
sented in Table 6. Al, Cd, Cr, Cu, Fe, Ni, Pb, Si, Sn,
and V showed significant correlations with one
Table 3
Deposition fluxes (lg m-2 s-1) of major cations and anions in dew
Variable Minimum Maximum Mean ± SD
Na? 0.18 1.5 0.43 ± 0.23
K? 0.22 0.97 0.77 ± 0.21
Ca2? 1.3 11.7 3 ± 0.28
Mg2? 0.5 6.1 1.6 ± 0.16
NH4? 1.8 3.8 2.8 ± 1.1
F- 0.009 1 0.5 ± 0.13
Cl- 0.16 2.9 0.84 ± 0.53
NO3- 0.13 1.8 0.48 ± 0.15
SO42- 0.23 2.6 1.04 ± 0.25
Table 4
Deposition velocities (cm s-1) of major cations and anions in dew
Component Minimum Maximum Mean ± SD
Na? 0.54 1.9 0.5 ± 0.08
K? 0.54 1.3 0.6 ± 0.12
Ca2? 1.1 5.8 3.8 ± 1.5
Mg2? 1.4 7.6 2.2 ± 0.83
NH4? 0.86 8.2 4.1 ± 1.4
F- 0.25 1.4 0.3 ± 0.04
Cl- 0.31 0.62 0.6 ± 0.13
NO3- 0.3 1.2 1.1 ± 0.3
SO42- 0.46 2.8 0.7 ± 0.1
868 A. Lakhani et al. Pure Appl. Geophys.
Page 11
another, indicating common occurrence. The corre-
lations among Al, Si, Mn, and Fe indicate crustal
origin, and these elements appear to have been
released into the local air by increased human activity
as the site is in an agricultural area. The elements Pb,
Cd, V, Cr, Ni, Sn, Zn, and Cu are considered to arise
from anthropogenic sources such as ferrous and
nonferrous foundries, tanneries, and vehicular traffic.
4. Conclusions
Dew water was found to be alkaline with mean
pH of 7.3. The principal cation in dew water was
NH4?, followed by Ca2?, Na?, and Mg2?, while the
predominant anion was NO3-, followed by SO4
2- and
Cl-. Dew water was found to be alkaline due to
neutralization of acids by ammonia and soil constit-
uents incorporated in dew. However, correlations
between ionic species indicated both natural and
anthropogenic influences on dew water. The maxi-
mum deposition flux was obtained for Ca2?, followed
by NH4?, Mg2?, SO4
2-, Cl-, F-, NO3-, Na?, and K?.
The average deposition velocities of ions ranged from
0.3 to 4.1 cm s-1 with maximum deposition velocity
for NH4?. This shows that dew can influence the
amount of deposition by changing the nature of the
surface from a dry one to wet one. The volume-
weighed mean concentration (lg l-1) of trace metals
in dew water samples followed the order: Si
(48.3) [ Al (12.7) [ V (4.2) [ Sn (2.4) [ Ni
(1.4) [ Cu (1) [ Zn (0.96) [ Mn (0.61) [ Fe
(0.37) [ Pb (0.33) [ Cr (0.24) [ Cd (0.13). Al, Cd,
Cr, Cu, Fe, Ni, Pb, Sn, and V were significantly
correlated, indicating common occurrence. Correla-
tions among Al, Si, Mn, and Fe indicated their crustal
origin, while the elements Pb, Cd, V, Cr, Ni, Sn, Zn,
and Cu were considered to arise from anthropogenic
sources.
Acknowledgments
The authors are grateful to the Director, Dayalbagh
Educational Institute Agra and Head, Department of
Chemistry and The Department of Science and
Table 5
Volume-weighed mean concentration, deposition flux, and veloc-
ities of trace metals
Component Mean ± SD
(lg l-1)
Deposition flux
(ng m-2 s-1)
Deposition
velocity (mm s-1)
Cd 0.13 ± 0.02 1.1 ± 0.2 1.7 ± 0.4
Cr 0.24 ± 0.03 1.0 ± 0.1 2.2 ± 0.9
Pb 0.33 ± 0.04 49 ± 3.9 8.0 ± 2.3
Fe 0.37 ± 0.06 19 ± 1.2 0.9 ± 0.1
Mn 0.61 ± 0.02 24 ± 1.8 4 ± 1.3
Zn 0.96 ± 0.02 6 ± 0.2 0.3 ± 0.1
Cu 1.04 ± 0.3 48 ± 3.8 5.3 ± 1.2
Ni 1.4 ± 0.04 58 ± 2.9 2.0 ± 0.2
Sn 2.4 ± 0.14 21 ± 1.1 1.3 ± 0.5
V 4.2 ± 0.18 15 ± 1.8 1.8 ± 0.6
Al 12.7 ± 0.13 25 ± 2.4 1.9 ± 0.3
Si 48.3 ± 1.6 88 ± 6.2 4.7 ± 1.7
Table 6
Correlation coefficients for trace metals in dew water
Al Cr Cu Fe Mn Ni Pb Si Sn V Zn Cd
Al 1
Cr 0.57* 1
Cu 0.46* 0.59* 1
Fe 0.15 0.23 0.19 1
Mn -0.07 -0.03 0.06 0.64* 1
Ni 0.72** 0.46* 0.56* 0.26 0.01 1
Pb 0.52* 0.32 0.34* 0.14 0.01 0.79** 1
Si -0.02 0.11 0.20 0.65* 0.89** 0.05 0.09 1
Sn 0.53* 0.31 0.22 0.20 0.03 0.22 0.10 0.13 1
V 0.53* 0.31 0.33* 0.03 -0.08 0.80** 0.95** -0.02 0.11 1
Zn -0.01 -0.01 0.02 0.36* 0.34** -0.24 -0.33 0.31* 0.20 -0.42 1
Cd 0.52 0.28 0.30 0.11 -0.03 0.78** 0.89** 0.03 0.24 0.94** 0.36 1
One tailed significance: P = 0.01*, 0.001**
Vol. 169, (2012) Chemical Composition of Dew 869
Page 12
Technology, DST project no. SR/S4/AS:207/02, New
Delhi, for financial assistance.
REFERENCES
ASHU RANI., PRASAD, D.S.N., MADNAWAT, P.S.N. and GUPTA, S.K.,
(1992), The role of free fall dust in catalyzing auto-oxidation of
aqueous sulphur dioxide, Atmos. Environ., 26, 667-673.
BEYSENS, D. (1995), The formation of dew. Atmos. Res. 39,
215-237.
BEYSENS, D., OHAYON, C., MUSELLI, M., CLUS O., (2006), Chemical and
biological characteristics of dew and rain water in an urban coastal
area (Bordeaux, France), Atmos. Environ., 40, 3710-3723.
BRIMBLECOMBE, P. and TODD, I.J., (1977), Sodium and potassium in
dew, Atmos. Environ., 11 (7), 649-650.
CHAMEIDES,W.l., (1987), Acid dew and the role of chemistry in the
dry deposition of reactive gases to wetted surfaces. J. Geophys.
Res., 92 11895-11908.
CHIWA, M., OSHIRO, N., MIYAKE, T., NAKATANI, N., KIMURA, N.,
YUHARA, T., HASHIMOTO, N., SAKUGAWA, H., (2003), Dry depo-
sition washoff and dew on the surfaces of pine foliage on the
urban-and mountain-facing sides of Mt. Gokurakuji, Western
Japan, Atmos. Environ., 37, 327-337.
DAYAN, U., MILLER, J. M., KEENE, W. C. and GALLOWAY, J. N.
(1985) An analysis of precipitation chemistry data from Alaska.
Atmos. Environ., 19, 651-657.
FOSTER, J.R., PRIBUSH, R.A., CARTER, B.H., (1990) The chemistry of
dews and frosts in Indianapolis, Indiana, Atmos. Environ.,
24(A), 229-2236.
HARA, H., KITAMURA, M., MORI, A., NOGUCHI, I., OHIZUMI, T., SETO,
S., TAKEUCHI, T., DEGUCHI, T.(1995), Precipitation chemistry in
Japan 1989-1993., Water Air Soil Pollut., 85, 2307-2312.
HICKS, B.B., (1986), Measuring dry deposition: A Re-assessment of
the state of the art, Water, Air and Soil Pollution, 30 (1-2), 75-90.
JIRIES, A. (2001), Chemical composition of dew in Amman, Japan,
Atmos. Res., 57, 261-268.
KATAGIRI, Y., SAWAKI, N., ARAI, Y., OKOCHI, H. and IGAWA, M.,
(1995), Chem. Lett., 197.
KHARE, P., SATSANGI, G.S., KUMAR, N., KUMARI, K.M. and S.S.
SRIVASTAVA, (1997), HCHO, HCOOH and CH3COOH in air and
rain water at a rural tropical site in north central India, Atmos.
Environ., 31 (23), 3867-3875.
KHARE, P., SINGH S.P., KUMARI, K.M., KUMAR A. and S.S. SRI-
VASTAVA, (2000), Characterization of organic acids in dew
collected on surrogate surfaces. Journal of Atmospheric Chem-
istry 37, 231-244.
KHEMANI, L.T., MOMIN, G.A., PRAKASA RAO, P.S.P., SAFAI, P.D. AND
PRAKASA, P. (1987), Influence of alkaline particulates on the
chemistry of fog water at Delhi, North India, Water, Air and Soil
Pollution, 34, 183-189.
KLIMASZEWSKA, K., SARBU,C., POLKOWSKA, Z., LECH D., PASLAW-
SKI,p., MALEK, S., NAMIESNIK J., (2009), Application of linear
discriminant analysis to the study of dew chemistry on the basis
of samples collected in Poland, Cent. Eur. J. Chem., 7(1), 20-30.
doi:10.2478/s11532-008-0082-8.
KUMAR, N., KULSHRESTHA, U.C., SAXENA, A., KUMARI, K.M. and
SRIVASATAV, S.S. (1993), Effect of anthropogenic activity on
formate and acetate levels in precipitation at four sites in Agra,
India, Atmos. Environ., 278 (1), 87-91.
LAKHANI, A., SATSANGI G.S., PARMAR R.S. and PRAKASH S. (2005),
Chemistry of sulphur and nitrogen species and other major
cations/anions in fog water. Ind. J. Radio and Space Physics, 34,
42-49.
LAKHANI, A., PARMAR, R.S., SATSANGI, G.S. and PRAKASH S.
(2007), Chemistry of fogs at Agra, India: Influence of soil
particulates and atmospheric gases. Environ. Monit. Assess.,
133, 435-445.
LAKHANI, A., PARMAR, R.S., SATSANGI, G.S. and PRAKASH S. (2008),
Size distribution of trace metals in ambient air of Agra. Ind.
J. Radio and Space Physics, 37, 434-442.
MALCOLM, E. and KEELER, G. (2002), Measurements of mercury in
dew: Atmospheric removal of mercury species to a wetted sur-
face, Environ. Sci. Technol., 36, 2815-2821.
MONTEITH, J.L., UNSWORTH, M.H. (1990), Principles of Environ-
mental Physics, Second Ed., Routledge, Chapman& hall, Inc.,
New York.
MULAWA, P.A., CADLE, S.H., LIPARI, F., ANG, C.C. and VANDER-
VENNET, R.T. (1967), Urban dew: Its composition and influence
on dry deposition rates, Atmos Environ., 20(7), 1389-1396.
MUSELLI, M., BEYSENS, D., MARCILLAT, J., MILIMOUK, I., NILSSON, T.,
LOUCHE, A (2002), Dew water collector for potable water in
Ajaccio. Atmos. Res., 64, 297-312.
PARMAR, R.S., SATSANGI, G.S., KUMARI, K.M., LAKHANI, A., SRI-
VASTAVA, S.S. AND PRAKASH, S. (2001), Study of size distribution
of atmospheric aerosol at Agra, Atmos. Environ., 35, 693-702.
PIERSON, W.R. BRACHACZEK, W.W., GORSE, R.A. JR. JAPAR, S.M. and
NORBECK, J.M. (1986), On the acidity of dew. Journal of Geo-
phys. Res. 91, 4083-4096.
POLKOWSKA, Z., MAREK, B., KLIMASZEWSKA K., SOBIK, M., MALEK, S.
and NAMIESNIK J., (2008), Chemical characterization of dew
water collected in different geographic regions of Poland, Sen-
sors, 8, 4006-4032.
RUBIO, M.A., LISSI, E., VILLENA, G., (2002), Nitrite in rain and
dew in Santiago city, Chile: Its possible impact on the early
morning start of the photochemical smog, Atmos. Environ. 36,
293-297.
SATSANGI, G.S., LAKHANI, A., KHARE, P. SINGH S.P., KUMARI, K.M.
AND SRIVASTAVA, S.S. (1998). Composition of rainwater at a
semi-arid rural site in India, Atmos. Environ. 32(21), 3783-3793.
SINGH, S.P., KHARE, P., MAHARAJ KUMARI K. and SRIVASTAVA
S.S.,(2006), Chemical characterization of dew at a regional
representative site of North-Central India, Atmos. Res. 80, 239
(2006).
SINGH, S.P., KHARE, P., SATSANGI, G.S., LAKHANI, A., MAHARAJ
KUMARI K. AND SRIVASTAVA S.S. (2001), Rainwater composition
at a regional representative site of a semi-arid region of India.
Water, Air and Soil Pollution, 127, 93-108.
SAXENA, A., SHARMA, S., KULSHRESTHA, U.C., and SRIVASTAVA S.S,
(1991), Factors affecting alkaline nature of rain water in Agra
(India), Environ. Pollut., 74, 129-138.
SAXENA, A., KULSHRESTHA, U.C., KUMAR, N., KUMARI K.M. and
SRIVASTAVA S.S, (1996). Characterization of precipitation at
Agra, Atmos. Environ., 30, 3405-3412.
SAXENA, A, KULSHRESTHA, U.C., KUMAR, N., KUMARI, K.M., SATYA
PRAKASH and SRIVASTAVA, S. S. (1997), Dry deposition of sul-
phate and nitrate to polypropylene surfaces in a semi arid area of
India. Atmos. Environ., 31 (15), 2361-2366.
SMITH B.E. and FRIEDMAN E.J. (1982) Mitre corporation working
paper WP82W00141, MITRE corporation, Metrek Division,
1820 Dolley Madison Boulevard, Mclean, VA 22102.
870 A. Lakhani et al. Pure Appl. Geophys.
Page 13
WANGER, G., STEELE, K., PEDEN, M. (1992), Dew and frost chem-
istry at a mid-continental site, United States, J. Geophys. Res.,
97, 20591-20597.
WESLEY, M.L., SISTERSON, D.L. and JASTROW, J.D., (1990), Obser-
vations of the chemical properties of dew on vegetation that
affect the dry deposition of SO2, J. Geophys. Res. 95, 7501-7514.
WINCHESTER, J.W., LI, S., AND GILLETTE, D.A., (1986), Potential for
airborne dust scavenging and dry deposition of SO2. Proceedings
of NAPAP Workshop on Dry Deposition, Harpers Ferry, VA,
25-27.
WISNIESWSKI, J., (1982), The potential acidity associated with dews,
frosts and fogs, Water, Air and Soil Pollution, 17, 361-177.
YAALON and GANOR E. (1968), Chemical composition of dew and
dry fallout in Jerusalem, Israel. Nature, 217, 1139-1140.
(Received November 15, 2010, revised March 23, 2011, accepted April 17, 2011, Published online May 25, 2011)
Vol. 169, (2012) Chemical Composition of Dew 871