a Chongqing Key Laboratory of Soft Condensed Matter Physics and Smart Materials, College of Physics, Chongqing University, Chongqing 400044, People’s Republic ofChinabDepartment of Physics, The Chinese University of Hong Kong, Hong Kong, China
H I G H L I G H T S
• The two kinds of drop behavior underlow air pressure were investigated.
• The critical air pressure for drop ex-pansion was analyzed and experi-mentally verified.
• The bubbling mechanism on micro-scale patterned substrates was illu-strated.
• Two stages of drop expansion drivenby bubbling was demonstrated.
G R A P H I C A L A B S T R A C T
A R T I C L E I N F O
Keywords:BubblingMicroscale patterned surfaceDrop expansionLow air pressure
A B S T R A C T
The growth of bubbles has been extensively studied for decades. However, the bubbling inside a single drop oncomplex surfaces and its subsequent effects on drop are not well understood yet. A systematical investigating ofbubbling mechanism in drops on customized microscale pore-patterned surfaces is presented, and the resultsdemonstrate that drop behaviors can be controlled under low air pressure. As the pressure decreases, the dropbehaves via two approaches, depending on the competition between the critical chamber pressure and the lowerlimit of pressure. When the former one is higher, drop prefers to expand, otherwise, evaporation occurs. Furtherstudies suggest that the drop expansion consists of two stages: pinning mode and pinning to depinning transition.This work provides new insights in understanding of bubbling physics on complex patterned substrates, opens ageneral route for the controlling of drop behaviors under low air pressure, and can also find potential appli-cations in optimization design for self-cleaning patterned surface.
1. Introduction
Bubbling, whether it occurs inside air, liquid, or even solid, is acommon phenomenon in nature [1–6]. To our knowledge, the studieson bubbling can be traced back to 19th century [7–9]. Bubbling is alsoimportant technologically in medicine and in industry, widely ap-pearing in drug delivery [10,11], in situ non-invasive destruction of
damaged tissues or obstructions [12,13], isolating object from erosion[14], and noise absorption [15]. Therefore, it is of great significance tounderstand the physical mechanism of bubbling and its consequenteffects.
The bubbling process is usually started from a nucleation event andcan be triggered by a number of ways, such as pressure reduction[16–18], acoustic shock [19–23], catalytic decomposition [24], electric
https://doi.org/10.1016/j.cej.2019.123547Received 29 June 2019; Accepted 18 November 2019
heating [25], and light heating [26–28]. Among them, air bubble insidebulk water growing on a solid surface in response to a pressure re-duction is the one of the most widely used research approach [16]. Thegrowth of the bubbles in such situation is found to be symmetrical inmorphology and experiences three stages: the floating stage with aconstant radius, the transition stage with a significant change in bothcontact angle and bubble radius, and the expansion stage with a con-stant contact angle [16]. However, the thorough understanding ofbubbling inside a single drop on complex surfaces is still lacking,let alone the studies of drop behaviors associated with bubbling.Meanwhile, bubbles in real environments or industries tend to be cre-ated and attached to surfaces that are not completely smooth or evenrough [19,29,30], which makes the study of bubbling in complex en-vironment have general and practical significance.
Inspired by the research findings that a sessile drop on a suitably-designed patterned surface can achieve the Cassie–Baxter state, or ametastable state [17], and air pockets are trapped below the drop inboth states. These air pockets serve as nuclei, and once the atmosphericpressure is reduced sufficiently, they will expand to coalesce with theneighbors, and yield a big growing bubble, resulting in the expansion ofthe drop [17]. In this work, we thus place drops on customized mi-croscale pore-patterned surfaces under low atmospheric pressure. Wenotice that not every drop expands unless the corresponding criticalpressure surpasses the lower limit of chamber pressure. When dropexpansion occurs, its morphology change is asymmetric and it goesthrough two stages: pinning stage and pinning to depinning transition.Our experiments demonstrate that the special surface micro-structureson patterned surface bring fundamentally different bubbling physicsand enrich the consequent drop behaviors. A suitably customized sur-face can be used to promote or prevent the yield of bubbles, and thusfurther manipulates drop behaviors to realize either expansion or eva-poration. Furthermore, the observation of rapid movement of base
diameter during pining to depinning transition may provide inspirationfor patterned surface design to strength the effect of drop sliding onhydrophobic surface. This study provides a new approach to study dropexpansion driven by bubbling, generalizes the understanding of bub-bling and associated drop behaviors to a more complex system, and canalso be applied to the optimization design for self-cleaning hydrophobicsurface.
2. Experiments and methods
2.1. Tested surfaces
Different microscale pore-patterned PDMS surfaces with varyingdiameters and spaces were used in our experiments. Firstly, the pillar-patterned mold was fabricated based on standard UV photolithography(URE-2000/35, China) and dry-etching on a clean silicon wafer. Theheight of the pillar was ~23 µm by precisely adjusting the dry-etchingprocess. After that, the silicon mould was placed on the heating plate(IKA C-MAG HP7; Germany) baked for 12 h at 120 °C. Then, the sam-ples with micro-pore arrays were obtained by reverse-mould withPDMS through micro-pillar arrays silicon template.Polydimethylsiloxane (PDMS, SYLGARD 184; America) base mixedwith curing agent at a ratio of 10:1 was poured over the patterned re-gion of the mold and placed in the vacuum oven for de-gassing, andplaced on the drying oven (DZF 6020; China) at 70 °C for 2 h. Aftercuring, the pore-patterned PDMS layer was gently peeled off in ethanolsolution.
2.2. Surface characterization
The PDMS surfaces were properly cut and treated by gold sprayingprocess (SBC-12 type ion sputter, China) for 90 s, and then measured by
Fig. 1. (a) Diagram of the experimental setup. A drop is placed on a pore-patterned PDMS substrate inside a transparent vacuum chamber. (b) A cartoon illustratingthe surface appearance of the substrate. Black and white indicate the solid and hole part respectively. D is the diameter of the hole and L is the space between twoneighbor holes. The height of the hole is H , which is not shown here. The magnified image indicated by the yellow dashed box shows the basic unit of substrate andcan help to calculate the solid fraction. (c) Side-view images show two different kinds of drop behavior on pore-patterned substrates under low pressure. A drop caneither expand (Top) or evaporate (Bottom). The corresponding bottom-view images before depressurization indicate that air pockets can be entrapped inside thepores below the water drop for both cases. SEM-view images show the pore sizes of the corresponding surfaces. Scale bars are 1 mm, μ500 m, and μ100 m, re-spectively, from left to right. (For interpretation of the references to colour in this figure legend, the reader is referred to the web version of this article.)
J. Zheng, et al. Chemical Engineering Journal 391 (2020) 123547
2
scanning electron microscope (SEM, Tescan Mira3 LMH; Czech). Thepore sizes for different surfaces varied from 20 μm to 80 μm in diameterand 10 μm to 50 μm in spacing.
2.3. Contact angle and sagging depth measurement
The drop was firstly dyed by Rhodamine 6G, and then we usedconfocal microscope (Leica TCS SP8; Germany) to capture the contactangle in the advanced state on the pore’s sidewall and the sagging depthof drop.
2.4. Experimental procedure and apparatus
The entire experiment was carried out in a transparent PMMAchamber as shown in Fig. 1a. The chamber was connected to a vacuumpump (2XZ-2 rotary vane vacuum pump; China) to realize a low insideair pressure. We measured the real time pressure values with a vacuumgauge (BOOST.PLD.0201; China) and the low limit of pressure in ourexperiment is 7.5 kPa. We used a high-speed camera (Phantom V7.3;Ametek, USA) equipped with a 5× lens (M Plan APO 5X; Japan) tocapture the drop placed on the pore-patterned PDMS surface. Thebottom view images were recorded by mounted the transparent PMMAcavity on an inverted microscope (Olympus IX73; Japan) with a 10×objective (Olympus M Plan FLN 10X/0.3, Japan). During each test, 4 μLdeionized water were used extracted with a pipette (Eppendorf Re-search plus 0.2–10 μL; Germany) and placed on a substrate inside thetransparent chamber. Then, we connected the chamber with the va-cuum pump and sealed with vacuum oil at the joint.
3. Results and discussion
3.1. Two kinds of drop behavior under low air pressure
In this experiment, we place a de-ionized water drop with diameter= ±D 2.2 0.1 mm0 on a microscale pore-patterned poly-
dimethylsiloxane (PDMS) substrate inside a transparent vacuumchamber, as shown in Fig. 1a. The pressure, Pchamber , could be variedbetween 7.5 and 100 kPa (100 kPa is normal atmospheric pressure). Thesubsequent evolution of drop is recorded by a Phantom V7.3 high-speedvideo camera at a frame rate of 500 fps. Different PDMS substrates withdifferent pore sizes are fabricated by mold-based UV optical litho-graphy. The pores on these substrates have the same height H ( μ23 m),but different diameters D ( μ20, 40, 60, 70, and 80 m) and spacesbetween them L ( μ10, 20, 30, 40, and 50 m), as illustrated by Fig. 1b.The solid fraction φ is defined as the area ratio between the solid partand the entire substrate. Specifically, it can be calculated by dividingthe area of black part by the total area as shown in Fig. 1b, which gives
= −+
φ 1 πDD L4( )
22 .
In order to make sure that our results are generally valid, the ex-periment with identical conditions were repeated at least five times andwe replaced the substrate with a fresh and identical one after eachmeasurement to avoid contamination of the substrate due to the residueleft by the previous drop. All experiments exhibit consistent behaviorsthat demonstrate the robustness of our finding.
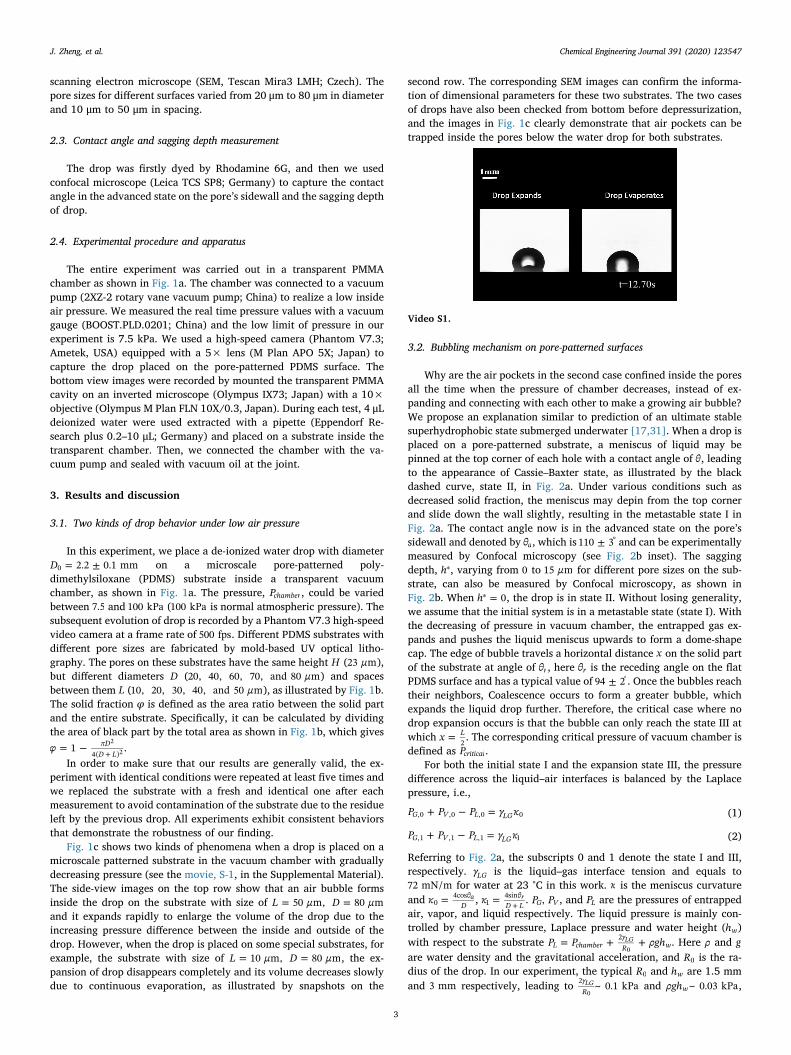
Fig. 1c shows two kinds of phenomena when a drop is placed on amicroscale patterned substrate in the vacuum chamber with graduallydecreasing pressure (see the movie, S-1, in the Supplemental Material).The side-view images on the top row show that an air bubble formsinside the drop on the substrate with size of = =L μ D μ50 m, 80 mand it expands rapidly to enlarge the volume of the drop due to theincreasing pressure difference between the inside and outside of thedrop. However, when the drop is placed on some special substrates, forexample, the substrate with size of = =L μ D μ10 m, 80 m, the ex-pansion of drop disappears completely and its volume decreases slowlydue to continuous evaporation, as illustrated by snapshots on the
second row. The corresponding SEM images can confirm the informa-tion of dimensional parameters for these two substrates. The two casesof drops have also been checked from bottom before depressurization,and the images in Fig. 1c clearly demonstrate that air pockets can betrapped inside the pores below the water drop for both substrates.
Video S1.
3.2. Bubbling mechanism on pore-patterned surfaces
Why are the air pockets in the second case confined inside the poresall the time when the pressure of chamber decreases, instead of ex-panding and connecting with each other to make a growing air bubble?We propose an explanation similar to prediction of an ultimate stablesuperhydrophobic state submerged underwater [17,31]. When a drop isplaced on a pore-patterned substrate, a meniscus of liquid may bepinned at the top corner of each hole with a contact angle of θ, leadingto the appearance of Cassie–Baxter state, as illustrated by the blackdashed curve, state II, in Fig. 2a. Under various conditions such asdecreased solid fraction, the meniscus may depin from the top cornerand slide down the wall slightly, resulting in the metastable state I inFig. 2a. The contact angle now is in the advanced state on the pore’ssidewall and denoted by θa, which is ± °110 3 and can be experimentallymeasured by Confocal microscopy (see Fig. 2b inset). The saggingdepth, ∗h , varying from 0 to μ15 m for different pore sizes on the sub-strate, can also be measured by Confocal microscopy, as shown inFig. 2b. When =∗h 0, the drop is in state II. Without losing generality,we assume that the initial system is in a metastable state (state I). Withthe decreasing of pressure in vacuum chamber, the entrapped gas ex-pands and pushes the liquid meniscus upwards to form a dome-shapecap. The edge of bubble travels a horizontal distance x on the solid partof the substrate at angle of θr , here θr is the receding angle on the flatPDMS surface and has a typical value of ± °94 2 . Once the bubbles reachtheir neighbors, Coalescence occurs to form a greater bubble, whichexpands the liquid drop further. Therefore, the critical case where nodrop expansion occurs is that the bubble can only reach the state III atwhich =x L
2 . The corresponding critical pressure of vacuum chamber isdefined as Pcritical.
For both the initial state I and the expansion state III, the pressuredifference across the liquid–air interfaces is balanced by the Laplacepressure, i.e.,
+ − =P P P γ κG V L LG,0 ,0 ,0 0 (1)
+ − =P P P γ κG V L LG,1 ,1 ,1 1 (2)
Referring to Fig. 2a, the subscripts 0 and 1 denote the state I and III,respectively. γLG is the liquid–gas interface tension and equals to72 mN/m for water at 23 °C in this work. κ is the meniscus curvatureand =κ θ
D04cos a , =
+κ θ
D L14sin r . P P,G V , and PL are the pressures of entrapped
air, vapor, and liquid respectively. The liquid pressure is mainly con-trolled by chamber pressure, Laplace pressure and water height (hw)with respect to the substrate = + +P P ρghL chamber
γR w
2 LG0
. Here ρ and gare water density and the gravitational acceleration, and R0 is the ra-dius of the drop. In our experiment, the typical R0 and hw are 1.5 mmand 3 mm respectively, leading to ~ 0.1 kPaγ
R2 LG
0and ρgh ~ 0.03 kPaw ,
J. Zheng, et al. Chemical Engineering Journal 391 (2020) 123547
3
which are both negligible compared with the first term. Thus, at theinitial state I, = =P P 100 kPaL chamber,0 ,0 , and at the critical expansionstate III, =P PL critical,1 . It’s reasonable to assume the expansion of bubblein each cavity is an isothermal process and the vapor saturation con-dition always holds. According to the ideal gas law, we have
=P V P VG G,0 0 ,1 1. Here, = − − −− ∗
V θ θ(3sin sin 2)πD H h πDθ a a0
( )4 24cos
3a
2 33 and
= + − ++V θ θ(3cos cos 2)πD H π D L
θ r r1 4( )
24sin3
r
2 33 are the volume of entrapped
air in each cavity at state I and III respectively. The saturated vaporpressure is denoted by ∗PV , which is constant under thermostatic as-sumption, leading to = = =
∗P P P 2.8 kPaV V V,0 ,1 (at 23 °C in experiment)[31]. Finally, on the basis of the above analysis, we get
= − + + −∗ ∗P γ κ P P V
VP γ κ( )critical LG V chamber V LG0 ,0
0
11 (3)
In Eq. (3), γ κ γ κ,LG LG0 1 and ∗PV are of the order of a few kPa, whilePchamber,0 is about 100 kPa and should dominate. So the Eq. (3) could besimplified to a linear relation
=P P VVcritical chamber,0
0
1 (4)
Plugging in the specific parameters of each set of experiments, we ob-tain the corresponding critical vacuum chamber pressure and show it inFig. 2c as a function of the reciprocal coefficient of volume expansion ofentrapped air. The fitting result indeed reveals such a linear relation-ship as predicted. The larger volume expansion ratio calls for lowercritical chamber pressure. As shown in Fig. 2c, the blue line indicatesthe minimum pressure limit achievable in our experiment, which isabout 7.5 kPa. For cases where the critical pressure Pcritical is below thepressure limit, drop expansion is suppressed, as illustrated by solidsymbols. On the other hand, the open symbols represent the cases withdrop expansion. This quantitative agreement provides strong experi-mental evidence for our model. This finding can be applied to regula-tion of drop behavior to achieve either expansion or evaporation byusing suitably customized surface at reduced air pressure.
3.3. Pinning to depinning transition during drop expansion
More interestingly, we observe that the expansion of drop shows aunique behavior. The external profiles of an expanding drop at fivetypical moments, =t 17.00 s0 , =t 19.34 s1 , =t 20.96 s2 , =t 21.10 s3 and
Fig. 2. (a) Cartoon picture (drawn not to scale) il-lustrating the detailed parameters of a water drop ona patterned substrate. The magnified image indicatedby red dashed box show the stable initial and ex-pansion states of liquid–gas interface and cavitymorphology under reduced chamber pressure. In in-itial, the drop can be in a metastable state with asagging depth of ∗h (I) or in a Cassie–Baxter state (II).The critical expansion state (III) when no coalescenceof bubbles occurs. (b) The 3-D reconstructed confocalimage showing the metastable state of drop on pore-patterned substrate. The white arrows indicate thePDMS wall, cavity, and liquid (dyed by Rhodamine6G) respectively. Scale bar: μ10 m. The inset showsthe advancing contact angle on the pore’s sidewall,and = ± °θ 110 3a . (c) Plot of critical vacuum pressure(Pcritical) as a function of the reciprocal coefficient ofvolume expansion of entrapped air from state I to
state III ( )VV
01. The linear fitting result with a slope of
97 kPa provides experimental evidence for ourmodel. The blue line indicates the lower limit of va-cuum chamber pressure in experiment. Drop expan-sion occurs (indicated by open symbols) when Pcritical
is greater than this minimum value, otherwise, dropexpansion is suppressed (illustrated by solid sym-bols). (For interpretation of the references to colourin this figure legend, the reader is referred to the web
version of this article.)
Fig. 3. (a) The asymmetric growth of a drop on the patterned substrate under reduced vacuum chamber pressure at five typical moments. Depinning occurs at eitherthe right side of the triple-phase contact angle of drop on substrate (from t0 to t1, or from t2 to t3), or the left side (from t3 to t4). =t 17.00 s0 , =t 19.34 s1 , =t 20.96 s2 ,
=t 21.10 s3 and =t 22.10 s4 . (b) Corresponding plots of contact angle on the right side of drop, θ, and the base diameter of the triple-phase contact line, d, as afunction of time. θc is the threshold contact angle just before the pinning to depinning transition. δd indicates the increase of base diameter between two adjacentdepinning events (e.g., from t1 to t3).
J. Zheng, et al. Chemical Engineering Journal 391 (2020) 123547
4
=t 22.10 s4 , after the pressure reduction are shown in Fig. 3a. Theprofile evolution is an asymmetric process. From t0 to t1, and from t2 tot3, the right end of the triple-phase (liquid–solid–vacuum) contact lineshows a sudden increase while the left end remains nearly unchanged.But from t3 to t4, the jump of contact line occurs at the left end. Wedefine the base diameter of the triple-phase contact line and the cor-responding contact angle on the right side as d and θ, respectively (seeFig. 3b inset), and plot their evolution as a function of time in Fig. 3bmain panel. As time goes by, the chamber pressure decreases to reachits lower limit, during which the drop boundary is pinned to the sub-strate. Therefore, the base diameter of the triple-phase contact line dkeeps almost constant (showing a very slow increase) while the rightcontact angle increases gradually to approach a threshold value, θc. Att1, such a pinning mode changes to a depinning mode with a dramaticdecrease of contact angle and a hopping of the base diameter, similar tothe depinning during drop evaporation on superhydrophobic surfaces[32]. The increase of base diameter between two adjacent depinningevents (e.g., from t1 to t3) is defined as δd. δd is composed by two parts: aslowly growth in pinning state (e.g., from t1 to t2) and a sharp increase inpinning to depinning transition (e.g., from t2 to t3). It should also benoted that the threshold contact angle is significantly smaller near t4 atwhich a depinning transition happens, compared with that around t1 ort3. The reason is straightforward, the base diameter hopping near t4 iscaused by the depinning of the left end of contact line. At this point, themeasured right contact angle has not reached its maximum thresholdvalue yet.
We try to explain the step change behavior of base diameter, bydirectly observing the evolution of the actual boundary of an expandingdrop. The corresponding bottom-view images are shown in Fig. 4a (seethe movie, S-2, in the Supplemental Material for a clear demonstration).The three typical moments, t1, t2 and t3, are consistent with the momentsshown in Fig. 3 since they come from the same set of experiment. Theliquid is squeezed into a thin shell during the drop expansion due to the
gradual increase of the bubble volume inside drop, and its profile isindicated by the black arrow in Fig. 4a. At t1, the front of liquid justarrives at and is pinned by the periphery of the hole as illustrated by redcircles in Fig. 4a. The liquid boundary sweeps the hole along the outeredge of hole slowly. It takes about 1.62 s (from t1 to t2) to completeencirclement of the hole. During this period, the base diameter in-creases at an extremely slow rate, corresponding to the pinning state ofdrop. Once the encirclement is finished, the liquid front travels for-wardly at a velocity which is at least ten times faster than the previouspinning stage, and spends only 0.14 s (from t2 to t3) to reach the outeredge of the neighbor hole as indicated by green circles. This rapidchange of base diameter corresponding to the pinning to depinningtransition. It inspires us to improve the design for patterned hydro-phobic surface, such as optimizing the ratio of space and diameter ofpores, realizing fast sliding of drop and strengthening the effect of self-clean. Our observation also suggests that the total increase of basediameter during one such event, δd, should match the sum of the dia-meter of hole and the space between them, i.e., +D L( ). Indeed, we findand excellent agreement between δd and +D L( ) in experiment, asshown in Fig. 4b.
Fig. 4. (a) Bottom view images showing one evolution cycle of the actual boundary of an expanding drop on a pore-patterned PDMS substrate. The three typicalmoments have one-to-one correspondence with time nodes shown above. =t 19.34 s1 , =t 20.96 s2 , and =t 21.10 s3 . Red and green circles sketch the outlines of theholes involved in this typical evolution cycle. The arrow indicates the liquid shell. Scale bar: μ500 m. (b) Plot of the total increase of base diameter during oneevolution cycle, δd, versus the sum of the diameter of hole and the space between them, +D L( ). The excellent dependence provides experimental evidence for ourmodel. (c) Plot of threshold contact angle (which is also the advancing contact angle), as a function of solid fraction. Apparently θc decrease with φ, indicating loweradvancing contact angle is achieved for substrate with higher solid fraction. Red dot: data measured in our experiments; solid line: theoretical prediction by McKinleyet al. [33]. This matching also demonstrates the reliability of our model. (For interpretation of the references to colour in this figure legend, the reader is referred tothe web version of this article.)
J. Zheng, et al. Chemical Engineering Journal 391 (2020) 123547
5
Video S2.Let’s look back to the contact angle on the right side of the drop. It
reaches its threshold value, θc, at the critical moment of pinning todepinning transition. This θc should be consistent with the advancingcontact angle of drop on a patterned substrate. We illustrate θc as afunction of solid fraction φ in Fig. 4c and find θc decrease as the increaseof φ, possibly due to the higher hydrophobicity under lower solidfraction. Moreover, according to the theoretic model proposed byMcKinley and coworkers [33], the apparent advancing contact angle ofdrop, ∗θadv, on textured surfaces should satisfy the formula:
= + −∗θ r ϕ θ ϕ θcos cos (1 )cosadv ϕ d adv d adv, 1 , 2. Where rϕ is the roughness of
the surface, which is defined as the ratio of the actual surface in contactwith the liquid to the projected area of the wetted region. =r 1ϕ sincethe wetted region is flat in our experiment. ϕd adv, is defined as the dif-ferential parameter when the triple-phase contact line is advancing and
= − −ϕ φ1 1d adv, . = °θ 1061 and = °θ 1802 are the equilibrium contactangles on a plat homogeneous solid PDMS and air, respectively. Theapparent advancing contact angle curve from McKinley’s theory is alsoplotted in Fig. 4c and it exhibits excellent agreement with our experi-mental data. This agreement provides experimental evidence for ourassumption that θc corresponds to the advancing contact angle.
4. Conclusion
In conclusion, we systematically investigate the bubbling process ina drop on varied microscale pore-patterned surfaces and develop asimple model to illustrate the bubbling mechanism. This work gen-eralizes the understanding of bubbling and consequent drop behaviorson complex patterned substrates, and also has several practical ad-vantages and allow many potential applications. First, we demonstratethat the drop behaviors can be manipulated under low air pressure bysimply adjusting the structure parameters of patterned surface to reachdifferent critical pressure for bubbling. The drop expansion occurswhen the critical pressure surpasses the lower limit of pressure in ex-periment, otherwise, the drop prefers to maintain its overall appearanceand evaporate slowly at reduced pressure environment. This findingcan be applied to regulation of drop behavior under low air pressure.Second, we show that the drop expansion contains two processes:pinning mode and pinning to depinning transition. During the pinningmode, the contact angle of drop on substrate grows gradually to reachthe apparent advancing contact angle, and the increase of the basediameter of the triple-phase contact line is quite slow due to the pinningof drop by the periphery of the hole. However, in the pinning to de-pinning transition, completely different behavior emerges: once theencirclement of hole by liquid front is completed, the contact angledecreases sharply while the base diameter jumps suddenly by a rate atleast one order of magnitude faster than that in the pinning state. Thismay have potential applications in optimization design for patternedsurface, to strengthen the effect of drop sliding and to enhance the ef-ficiency of self-cleaning hydrophobic surface.
Acknowledgments
This work is supported by the National Natural Science Foundationof China through Grants No. 11604030, No. 11674043, and No.11974067; by the Fundamental Research Funds for the CentralUniversities through Project No. 2018CDJDWL0011 and No.2019CDYGYB017.
References
[1] D. Lohse, Bubble puzzles, Phys. Today 56 (2003) 36–41.[2] B. Wilco, R.C.A. Veen, T. Van Der, D.L. Tuan, K.G. Keij, I.R. Winkels, V.D.M. Peters,
S. Devaraj, J.H. Chao, D. Lohse Snoeijer, Maximal air bubble entrainment at liquid-
drop impact, Phys. Rev. Lett. 109 (2012) 264501.[3] Y.S. Joung, C.R. Buie, Aerosol generation by raindrop impact on soil, Nat. Commun.
6 (2015) 6083.[4] B.E. Pinchasik, H. Mohwald, A.G. Skirtach, Mimicking bubble use in nature: pro-
pulsion of Janus particles due to hydrophobic–hydrophilic interactions, Small 10(2014) 2670–2677.
[5] T. Luan, F. Meng, P. Tao, W. Shang, J. Wu, C. Song, T. Deng, Bubble-enabled un-derwater motion of a light-driven motor, Small 15 (2019) 1804959.
[6] P.P. Wang, J.J. Cilliers, S.J. Neethling, P.R. Brito-Parada, The behavior of risingbubbles covered by particles, Chem. Eng. J. 365 (2019) 111–120.
[7] M.N. Iii, Y.T. Didenko, K.S. Suslick, Sonoluminescence temperatures during multi-bubble cavitation, Nature 401 (1999) 772–775.
[8] B.W. Zeff, B. Kleber, J. Fineberg, D.P. Lathrop, Singularity dynamics in curvaturecollapse and jet eruption on a fluid surface, Nature 403 (2000) 401–404.
[9] D.J. Durian, Foam mechanics at the bubble scale, Phys. Rev. Lett. 75 (1995) 4780.[10] K.J. Chen, H.F. Liang, H.L. Chen, Y. Wang, P.Y. Cheng, H.L. Liu, Y. Xia, H.W. Sung,
A thermoresponsive bubble-generating liposomal system for triggering localizedextracellular drug delivery, ACS Nano 7 (2013) 438–446.
[11] K.J. Chen, E.Y. Chaung, S.P. Wey, K.-J. Lin, F. Cheng, C.C. Lin, H.L. Liu, H.W. Tseng,C.P. Liu, M.C. Wei, Hyperthermia-mediated local drug delivery by a bubble-gen-erating liposomal system for tumor-specific chemotherapy, ACS Nano 8 (2014)5105–5115.
[12] C. Jiménez, G.R. De, A. Aguilera, S. Alonso, A. Cirugeda, J. Benito, R.M. Regojo,R. Aguilar, A. Warlters, R. Gómez, In situ kidney insonation with microbubblecontrast agents does not cause renal tissue damage in a porcine model, J. Ultras.Med. 27 (2008) 1607–1615.
[13] R. Vorreuther, R. Corleis, T. Klotz, P. Bernards, U. Engelmann, Impact of shockwave pattern and cavitation bubble size on tissue damage during ureteroscopicelectrohydraulic lithotripsy, J. Urol. 153 (1995) 849–853.
[14] A. Philipp, W. Lauterborn, Cavitation erosion by single laser-produced bubbles, J.Fluid Mech. 361 (2000) 75–116.
[15] S.H. Huynh, M. Muradoglu, Y. Yu, T.W. Ng, Captive bubble nucleation, growth, anddetachment on plastrons under reduced pressure, Colloids Surf. A Physicochem.Eng. Asp. 509 (2016) 39–47.
[16] L. Jiang, C. Haosheng, Z. Weizheng, W. Bo, S.D. Stoyanov, E.G. Pelan, Growth ofbubbles on a solid surface in response to a pressure reduction, Langmuir 30 (2014)4223–4228.
[17] Y. Xue, P. Lv, L. Ying, Y. Shi, H. Duan, Morphology of gas cavities on patternedhydrophobic surfaces under reduced pressure, Phys. Fluids 27 (2015) 270–280.
[18] P. Lin, F. Wang, L. Liu, Q. He, Characteristics of iron droplet ejection caused by gasbubble bursting under reduced pressure, J. Iron Steel Res. Int. 17 (2010) 7–11.
[19] N. Bremond, M. Arora, C.D. Ohl, D. Lohse, Controlled multibubble surface cavita-tion, Phys. Rev. Lett. 96 (2006) 224501.
[20] D.Y. Zang, L. Li, W.L. Di, Z.H. Zhang, C.L. Ding, Z. Chen, W. Shen, P.B. Bernard,X.G. Geng, Inducing drop to bubble transformation via resonance in ultrasound,Nat. Commun. 9 (2017) 3546.
[22] A. Volk, C.J. Kähler, Size control of sessile microbubbles for reproducibly drivenacoustic streaming, Phys. Rev. Appl. 9 (2018) 054015.
[23] T. Saito, M. Toriu, Effects of a bubble and the surrounding liquid motions on theinstantaneous mass transfer across the gas–liquid interface, Chem. Eng. J. 265(2015) 164–175.
[24] A.A. Solovev, Y. Mei, E. Bermúdez Ureña, G. Huang, O.G. Schmidt, Catalytic mi-crotubular jet engines self-propelled by accumulated gas bubbles, Small 5 (2009)1688–1692.
[25] Q. Wang, G. Zhang, W. Chao, M. Rong, Y. Wei, The electrically induced bubblebehaviors considering different bubble injection directions, Int. J. Heat Mass Transf.104 (2017) 729–742.
[26] X. Liu, L. Bao, M. Dipalo, F.D. Angelis, X. Zhang, Formation and dissolution ofmicrobubbles on highly-ordered plasmonic nanopillar arrays, Sci. Rep. 5 (2015)18515.
[27] L. Zhang, J. Xing, X. Wen, J. Chai, S. Wang, Q. Xiong, Plasmonic heating fromindium nanoparticles on a floating microporous membrane for enhanced solarseawater desalination, Nanoscale 9 (2017) 12843–12849.
[28] A.L. Klein, W. Bouwhuis, C.W. Visser, H. Lhuissier, C. Sun, J.H. Snoeijer,E. Villermaux, D. Lohse, H. Gelderblom, Drop shaping by laser-pulse impact, Phys.Rev. Appl. 3 (2015) 044018.
[29] P.V.D. Linde, P. Peñas-López, D.V.D. Meer, D. Lohse, H. Gardeniers, D.F. Rivas, Gasbubble evolution on microstructured silicon substrates, Energ. Environ. Sci. 11(2018) 3452–3462.
[30] Z.D. Huang, M. Su, Q. Yang, Z. Li, S.R. Chen, Y.F. Li, X. Zhou, F.Y. Li, Y.L. Song, Ageneral patterning approach by manipulating the evolution of two-dimensional li-quid foams, Nat. Commun. 8 (2017) 14110.
[31] Y. Xiang, S. Huang, P. Lv, Y. Xue, Q. Su, H. Duan, Ultimate stable underwater su-perhydrophobic state, Phys. Rev. Lett. 119 (2017) 134501.
[32] W. Xu, C.H. Choi, From sticky to slippery droplets: dynamics of contact line de-pinning on superhydrophobic surfaces, Phys. Rev. Lett. 109 (2012) 024504.
[33] W. Choi, A. Tuteja, J.M. Mabry, R.E. Cohen, G.H. Mckinley, A modifiedCassie–Baxter relationship to explain contact angle hysteresis and anisotropy onnon-wetting textured surfaces, J. Colloid Interf. Sci. 339 (2009) 208–216.
J. Zheng, et al. Chemical Engineering Journal 391 (2020) 123547