The enhancement of hydrogen recovery in PSA unit of domestic petro- chemical plant M.R. Rahimpour a,b,⇑ , M. Ghaemi a , S.M. Jokar a , O. Dehghani a , M. Jafari a , S. Amiri a , S. Raeissi a a Department of Chemical Engineering, School of Chemical and Petroleum Engineering, Shiraz University, Shiraz 71345, Iran b Department of Chemical Engineering and Materials Science, University of California, Davis, 1 Shields Avenue, Davis, CA 95616, United States highlights The PSA unit of a domestic petrochemical plant is simulated. An unsteady-state heterogeneous mathematical model is used for simulation. Three suitable sub cycle time for three different operating conditions are estimated. The optimal feed flow rate is obtained for enhancement of hydrogen recovery. The optimal cycle time is obtained for enhancement of hydrogen recovery. graphical abstract article info Article history: Received 3 January 2013 Received in revised form 25 March 2013 Accepted 10 April 2013 Available online 19 April 2013 Keywords: Pressure swing adsorption Adsorption in layered beds Hydrogen purification Gas separation abstract In this work a mathematical model is employed to simulate the industrial layered PSA unit of domestic petrochemical plant which operates for purification of hydrogen. The outlet stream of this plant has about 99.99% purity in hydrogen and the hydrogen recovery is about 75%. A good agreement was observed between the simulation results and the plant data. Moreover, in this study, the effect of cycle time and feed flow rate on hydrogen recovery and product purity is investigated and an optimal value is estimated for cycle time and feed flow rate. The optimal sub cycle time causes to reduce the pollution load of the sorbents. Reduction of pollution load of adsorbents increases the absorber life time and con- sequently, decreases operating cost of PSA unit of domestic petrochemical plant that allocates for purge of adsorbents. The results show that by applying the optimal cycle time and optimal feed flow rate as the operating conditions, hydrogen recovery of the PSA unit increases from 75% to 80% and 77.5% respec- tively, and hydrogen purity of the product stream slightly reduces. This phenomenon increases purified hydrogen that is fed to hydrogenation unit. Ó 2013 Elsevier B.V. All rights reserved. 1. Introduction Energy supply and demand play a vital role in our modern life. Among various energy supplies, fossil fuels such as coal, oil and gas are the most common ones. Although these energy sources are used extensively for different purposes such as generating electric- ity in a large scale, their application should be limited due to grow- ing environmental concerns. Fossil fuels are the largest greenhouse gas emitters in the world, contributing approximately 3/4 of all carbon, methane and other greenhouse gas emissions. Burning coal also produces sulfur dioxide which contributes to acid rain [1,2]. Considering these disadvantages of using fossil fuels, there is an increasing interest in modernizing energy supplies. 1385-8947/$ - see front matter Ó 2013 Elsevier B.V. All rights reserved. http://dx.doi.org/10.1016/j.cej.2013.04.029 ⇑ Corresponding author at: Department of Chemical Engineering, School of Chemical and Petroleum Engineering, Shiraz University, Shiraz 71345, Iran. Tel.: +98 711 2303071; fax: +98 711 6287294. E-mail address: [email protected](M.R. Rahimpour). Chemical Engineering Journal 226 (2013) 444–459 Contents lists available at SciVerse ScienceDirect Chemical Engineering Journal journal homepage: www.elsevier.com/locate/cej
Transcript
Chemical Engineering Journal 226 (2013) 444–459
Contents lists available at SciVerse ScienceDirect
Chemical Engineering Journal
journal homepage: www.elsevier .com/locate /ce j
The enhancement of hydrogen recovery in PSA unit of domestic petro-chemical plant
1385-8947/$ - see front matter � 2013 Elsevier B.V. All rights reserved.http://dx.doi.org/10.1016/j.cej.2013.04.029
⇑ Corresponding author at: Department of Chemical Engineering, School ofChemical and Petroleum Engineering, Shiraz University, Shiraz 71345, Iran. Tel.:+98 711 2303071; fax: +98 711 6287294.
M.R. Rahimpour a,b,⇑, M. Ghaemi a, S.M. Jokar a, O. Dehghani a, M. Jafari a, S. Amiri a, S. Raeissi a
a Department of Chemical Engineering, School of Chemical and Petroleum Engineering, Shiraz University, Shiraz 71345, Iranb Department of Chemical Engineering and Materials Science, University of California, Davis, 1 Shields Avenue, Davis, CA 95616, United States
h i g h l i g h t s
� The PSA unit of a domesticpetrochemical plant is simulated.� An unsteady-state heterogeneous
mathematical model is used forsimulation.� Three suitable sub cycle time for
three different operating conditionsare estimated.� The optimal feed flow rate is obtained
for enhancement of hydrogenrecovery.� The optimal cycle time is obtained for
enhancement of hydrogen recovery.
g r a p h i c a l a b s t r a c t
a r t i c l e i n f o
Article history:Received 3 January 2013Received in revised form 25 March 2013Accepted 10 April 2013Available online 19 April 2013
Keywords:Pressure swing adsorptionAdsorption in layered bedsHydrogen purificationGas separation
a b s t r a c t
In this work a mathematical model is employed to simulate the industrial layered PSA unit of domesticpetrochemical plant which operates for purification of hydrogen. The outlet stream of this plant hasabout 99.99% purity in hydrogen and the hydrogen recovery is about 75%. A good agreement wasobserved between the simulation results and the plant data. Moreover, in this study, the effect of cycletime and feed flow rate on hydrogen recovery and product purity is investigated and an optimal valueis estimated for cycle time and feed flow rate. The optimal sub cycle time causes to reduce the pollutionload of the sorbents. Reduction of pollution load of adsorbents increases the absorber life time and con-sequently, decreases operating cost of PSA unit of domestic petrochemical plant that allocates for purgeof adsorbents. The results show that by applying the optimal cycle time and optimal feed flow rate as theoperating conditions, hydrogen recovery of the PSA unit increases from 75% to 80% and 77.5% respec-tively, and hydrogen purity of the product stream slightly reduces. This phenomenon increases purifiedhydrogen that is fed to hydrogenation unit.
� 2013 Elsevier B.V. All rights reserved.
1. Introduction
Energy supply and demand play a vital role in our modern life.Among various energy supplies, fossil fuels such as coal, oil and gas
are the most common ones. Although these energy sources areused extensively for different purposes such as generating electric-ity in a large scale, their application should be limited due to grow-ing environmental concerns. Fossil fuels are the largest greenhousegas emitters in the world, contributing approximately 3/4 of allcarbon, methane and other greenhouse gas emissions. Burning coalalso produces sulfur dioxide which contributes to acid rain [1,2].Considering these disadvantages of using fossil fuels, there is anincreasing interest in modernizing energy supplies.
q gas density (kg/m3)t time (s)m gas velocity (m/s)e bed porosityqi the amount of component I adsorbed (kgadsorbed/kgadsor-
bent)z axial bed coordinate (m)DZ axial dispersion coefficient (m2/s)Ci the molar concentration of component I (mol/m3)a1,i adsorption isotherm constant for component I
(kgadsorbed/kgadsorbent)a2,i adsorption isotherm constant for component I (K)b0,i adsorption isotherm constant for component I (1/mm
Hg)b1,i adsorption isotherm constant for component I (K)qi,eq the amount of I adsorbed component in equilibrium
Ki the overall mass transfer coefficient (1/s)TF temperature of feed streamXi the molar fraction of component I in the gas phaseXi,in the molar fraction of component I in inlet streamTin the temperature of the inlet streammf the average velocity at feed entrancePads adsorption pressurePD purge pressurePout pressure in the exit of the bed which is providing purge
gasKf set time coefficientRi adsorbent vessel internal radiusVP gas velocity at product endXH2 ;P hydrogen molar fraction at product streamXH2 ;f hydrogen molar fraction at feed stream
M.R. Rahimpour et al. / Chemical Engineering Journal 226 (2013) 444–459 445
1.1. Hydrogen
At the recent years, application of hydrogen as an alternative tofossil fuel has been investigated widely. There is an increasinginterest in using hydrogen as an energy carrier for the near future.
Hydrodealkylation, hydrodesulphurization, and hydrocrackingare the main consumers of H2 in the petroleum plants. H2 is usedas hydrogenating agent and in production of methanol. In addition,it has many applications in physics and engineering. For example itis used as shielding gas such as atomic hydrogen welding [3] and asa rotor coolant in electrical generators. Pure hydrogen or mixedhydrogen with nitrogen is employed as a tracer gas.
Hydrogen is produced by different methods. Haber processwhich is used for ammonia production and electrolysis of brineto yield chlorine are used for hydrogen production. Catalytic steamreforming of natural gases is also a common method for hydrogenproduction in industrial plants. It is noteworthy that during theseprocesses, the obtained product is a mixture of hydrogen, as desir-able product, and one or additional gases. Thus, separation of thesemixtures to obtain purified hydrogen is an important issue that hasbeen investigated by researchers in recent years. During the recentyears, several researchers have been studied on hydrogen purifica-tion by membrane technology. For example, Cheng et al. haveinvestigated the Hydrogen separation from a commercial Towngas mixture consists of H2, CH4, CO2 and CO by alumina, zeolite(ZSM-5), palladium and Pd–Ag alloy membranes. Their studyshowed that using ZSM-5 membrane with using thin palladiumand Pd–Ag alloy membranes increases ability of adsorption ofhydrogen compared with using commercial alumina membranealone [4].
According to important role of Pd membranes (which are madefrom Pd with the other component), in hydrogen purification, sev-eral researchers were interested in investigation of different meth-ods of preparation of this type of membrane. For example,preparation of Pd/Vycor composite membranes using electro lessplating from both typical hydrazine-based and formaldehyde mod-ified baths was investigated by Yeung et al. [5]. Moreover, Yeunget al. has made dense Pd/SS-316L composite membranes usingconventional electro less plating and a new synthesis procedurebased on electro less plating with osmosis. This prepared mem-brane has about five times higher hydrogen permeation rate andbetter thermal stability [6].
1.2. Pressure swing adsorption (PSA)
There are various commercial methods for gas separation suchas extraction, distillation, and adsorption. Adsorption processes,particularly pressure swing adsorption (PSA) are the most impor-tant tools for gas separation. Pressure swing adsorption is a suit-able, low cost and energy-efficient technology for gas separationwhich is used in industrial plants. So, there is an increasing interestin using this process in order to purify various types of gases suchas hydrogen.
By considering the advantages of using PSA method for gas sep-aration, there has been significant development in pressure swingadsorption system [7]. For example, layered bed technology, con-sisting of different sorbents, is a novel and attractive alternativefor multicomponent gas separation [8–12]. In this new method,at the inlet of the column a weak sorbent is followed by strongerlayer. This arrangement helps the reduction of absorbent size andincreases the use of each sorbent. Considering the advantages ofusing this technology, researchers have been interested in investi-gating the effect of various parameters on operation of this meth-od. For example, Chlendi and Tondeur showed that relative layeredlength has a significant effect on yield and the productivity of thePSA unit consisting of double layered columns [13].
Binary separation in layered beds has been studied by Pigoriniand LeVan [14]. They showed that ratio of the two layers has obvi-ous effect on the separation process. At the recent years, Park et al.[15] has analyzed a mathematical model in order to minimize thebed size and enhance the efficiency of sorbents. Moreover, a novelcompact layered pressure swing adsorption (LPSA) that was usedfor removing carbon dioxide and nitrogen from a gas mixture hasbeen investigated by Cavenati et al. [16]. Rege et al. [17] haveinvestigated the performance of a pressure swing adsorption unitthat was employed for air separation. Single bed containing onetype of adsorbent and layered bed containing two different adsor-bents was analyzed by these researchers. The main objective oftheir study was to estimate an optimal value for amount of adsor-bents that are used for particular bed operating conditions. CO2
separation by pressure swing adsorption is an attractive issuewhich has been analyzed by several researchers in recent years[18,19].
In 2002, Gomes et al. have investigated Carbon dioxide removalby pressure swing adsorption (PSA) processes to obtain the optimal
janka
Zvýraznenie
janka
Zvýraznenie
janka
Zvýraznenie
Fig. 1. The block flow diagram of the olefin plant.
446 M.R. Rahimpour et al. / Chemical Engineering Journal 226 (2013) 444–459
feed flow rate and cycle time [20]. Their study showed that Zeolite13X is a suitable sorbent for CO2 sequestration. A pressure swingadsorption, which was employed for hydrogen recovery from coalgas, was simulated by Ahn et al. [21]. Their simulation showed thatusing the higher zeolite ratio in layered beds increases the hydro-gen production with higher purity in the PSA operation. Grant andDouglas have developed a mathematical model to investigate thesensitivity of breakthrough of adsorption beds to operation param-eters [22]. They employed the sensitivity data in order to obtainthe optimized conditions for a two-layer, two-bed PSA system.
As illustrated, hydrogen is among the most important novel en-ergy carriers. So hydrogen purification by pressure swing adsorp-tion is an attractive issue at the recent years [23–26]. Byconsidering the importance of hydrogen production as an energycarrier, many researchers have studied PSA process in order to im-prove the performance of this technology. For example, Lopes et al.employed a mathematical model to simulate a 10 steps one-col-umn VPSA system [27]. Moreover, their mathematical model wasused to investigate the influence of operation conditions and theeffect of step times on performance of PSA technology.
A compact pressure swing adsorption was employed foradsorption of CO and CO2 in mixtures of H2/CO/CO2 by Majlanet al. [28]. In this system the pure hydrogen was used for fuel cell.Their study showed that CPSA system is a suitable system for cre-ation the required specifications of hydrogen purity. In order toinvestigate a hydrogen purification process from steam methanereforming off gas, a multi-bed pressure swing adsorption has beensimulated by Nikolic et al. [29]. Temperature is an importantparameter which can influence the adsorption process. A non-iso-thermal multicomponent pressure swing adsorption system whichwas used for separation of CH4 and H2 on active carbon has beenanalyzed by Tanczyk and Warmuzinski [30].
1.3. Objective
In the present work an industrial hydrogen purification unit,(PSA unit of domestic petrochemical plant) is simulated in order
Fig. 2. Simplified diagram of olefin uni
to obtain an optimal time for sub cycle of adsorption that leadsto reduction of the pollution load of the sorbents. Reduction of pol-lution load of sorbents enhances the sorbents lifetime that is animportant issue in industrial plants. Moreover, in this study the ef-fect of cycle time on hydrogen recovery and hydrogen purity inoutlet stream is analyzed. The inlet stream of this system is con-taining about 94% hydrogen on a typical day. The main impuritiesof inlet stream are methane, nitrogen and carbon monoxide. PSAunit investigated in the current work consists of five beds whicheach of them are composed of five different sorbents layers. Theexperimental data’s are employed to validate the mathematicalmodel that predicts the performance of this unit.
2. Domestic petrochemical plant
Olefins are the building blocks in manufacturing of polymersand elastomers or converted into derivatives such as aldehydes,alcohols, and glycols. The olefin important produced is ethylene.Ethylene production witnessed a dramatic growth in the late20th century from 29 million lb to 180 billion lb. As a result, it isknown that even a small improvement in ethylene production pro-cess may lead to a remarkable profit for the petrochemical industry[31,32].
In domestic petrochemical plant thermal cracking of alkanessuch as ethane, propane, butane, naphtha and gas oil is used to pro-duce ethylene. The block flow diagram (Fig. 1) shows how the ole-fin plant is work to produce ethylene and acetylene. As it is shownin Fig. 1 the unit consists of two main parts: 1 – Cracking furnaces(hot section) 2 – Compressors and separators (cold section). In firstpart the olefins are primarily produced by steam cracking of largehydrocarbon molecules in furnaces. Various hydrocarbon productscould form through 1400 chemical reactions in coils of the fur-naces. The high concentration of acetylene in the feed stream ofpolymerization plants not only contaminates the catalysts but alsoforms metal acetylides which are extremely explosive. So, in thesecond part the output stream from furnaces are fed to separationtowers and hydrogenation catalytic reactors to convert acetyleneto ethylene. In domestic petrochemical plant some portion of theethylene is used as the feedstock of poly-ethylene production unitand the rest is exported in the liquid phase. The feed and productcomponents are shown in Fig. 1.
3. Process description of olefin unit
A simplified schematic diagram of complicated olefin unit ofdomestic petrochemical plant is shown in Fig. 2. Each part of thisfigure is described in details in the following sections.
M.R. Rahimpour et al. / Chemical Engineering Journal 226 (2013) 444–459 447
3.1. Cracking furnaces
In this process, a mixture of steam and hydrocarbons includingethane, propane, butane, isobutane, naphtha, and gas oil is intro-duced into furnaces in order to produce olefins. The cracking fur-naces are the heart of the whole ethylene manufacturing process.Both gas and liquid furnaces are used in order to produce olefinsin domestic petrochemical plant. A wide variety of feedstock forfurnaces can be employed with ethane and naphtha being the mostcommon. Ethane is fed to the gas furnaces and naphtha to the li-quid furnaces. The desired products from the furnaces are light ole-fins, i.e., ethylene, propylene and butadiene. However, dependingon the nature of the feedstock, a wide array of by-products canbe produced. Tables 1 and 2 provide information about the prod-ucts of liquid and gas furnaces from this company, respectively.It is noticeable that gas furnace produces 1.5 times more ethylenethan liquid furnace.
In domestic petrochemical plant, a mixture of ethane and steamgoes through two passes in gas furnaces. Table 3 shows flow ratesof ethane and steam in each pass during a run length of reactor.
3.2. Transfer line exchanger and quench tower
The fast reduction of temperature of output stream from fur-naces is very critical to prevent unwanted side reactions. The sidereactions include formation of polymers from monomers in hightemperature. So, Products leave the furnaces and cool downquickly in the transfer line exchanger (TLE).
3.3. Compressors
The products from quench tower are compressed in centrifugalcompressors. High pressure is necessary for producing pure
hydrogen which is used in hydrogenation reactors. The compres-sion ratio should be low enough to prevent polymer productionin the output at high temperature.
3.4. Acid gas removal unit
By considering the existence of byproducts such as carbon mon-oxide, carbon dioxide and sulfur contaminants in gas cracker efflu-ents, separation processes are used for eliminating thesecomponents. The existence of carbon dioxide could cause hydrateformation and sulfur can poison catalysts of the reactors. The con-centration of carbon dioxide should be less than 0.1 ppm forincreasing the final ethylene product purity which is fed to thepolymerization unit.
448 M.R. Rahimpour et al. / Chemical Engineering Journal 226 (2013) 444–459
Removing acid gas is done in the caustic tower. This tower isplaced after compressors because absorption process increaseswith increasing the pressure. The following reactions occur in thecaustic tower:
H2Sþ 2NaOH! Na2Sþ 2H2O ð1Þ
CO2 þ 2NaOH! Na2CO3 þH2O ð2Þ
3.5. DE-Methanizer and PSA unit
The output of caustic tower is directed to a DE-Methanizer formethane separation. Methane is the outlet stream of the top ofthe DE-Methanizer bed. Also, the bottom gas stream which con-sists of hydrogen is fed to the PSA unit. Hydrogen which is neededfor hydrogenation unit is purified by PSA unit. Another outletstream of PSA unit is fed to hydrogenation unit to convert the acet-ylene to the ethylene and the other alkanes to the olefins. The de-tails of PSA unit will be discussed later in Section 4.
4. The PSA unit of domestic petrochemical plant
The first step in this work is to simulate the PSA unit of domes-tic petrochemical plant. The PSA unit is used for hydrogen purifica-tion in olefin unit of domestic petrochemical plant. In the PSA unitthere are normally 5 adsorbers in operation, called D01A, D01B,D01C, D01D and D01E. Each adsorber is cycled through an identicaladsorption-regeneration sequence. The cycles are staggered, sothat at all of the times 1 adsorber is on the adsorption step andthe other 4 are in various stages of regeneration. In order to in-crease the reliability of the unit, the system can switch from 5-bed to 4-bed operation, either manually (by the operator) or auto-matically (by the control logic). Manual switchover will be used formaintenance reasons, periodical check of vessel and maintenanceon valve set.
Table 4Sequence of the steps of a complete PSA cycle.
Automatic switchover to 4-bed operation will happen when thecontrol system detects a major failure to an adsorber, the relatedvalves or instrumentation or I/O card. The regeneration is carriedout in three stages: depressurization to purge pressure, purge atlow pressure and repressurization to adsorption pressure. One to-tal adsorption and regeneration cycle is called a complete cycle andhas no further meaning. One sub cycle is divided into three steps,named steps 1, 2, and 3 (identical in 5- and 4-bed operation).The steps of this unit followed a predefined rule which is shownin Table 4.
Each vessel is filled with five different commercial adsorbentlayers which are called H5-2, H2-10, H1, H14 and H1, respectively.These sorbents are different in their composition. For example,zeolite is the main component of H1 and H14 and alumina oxideis the principal component of H5-2. The commercial specificationsof these adsorbents are tabulated in Table 5. There is a specifiedarrangement for these five different sorbent layers. H5-2 which isat the feed entrance is followed by an active carbon layer calledH2-10. After this layer, H1, H14 and H1 are used respectively assorbents for hydrogen purification. It may be questionable thatwhy different sorbents with this arrangement are used in eachcolumn.
Commercial sorbents are able to separate special components.Actually one type of sorbent is not able to adsorb all the chemicalcomponents. According to selectivity property of commercial sor-bents, in industrial plants, PSA units which are utilized to separatejust one component from a mixture, one type of sorbent should beused. But in cases that several components shall be separated froma gas mixture, two or more types of sorbents are utilized foradsorption process.
In the PSA unit investigated in this study, CO, CO2, CH4, C2H4,C2H6 and N2 are separated from inlet gas mixture. So, as illustrated,different types of sorbents are used for adsorption. Moreover,when concentration of components is not considerable, escapingcomponents from empty regions of the bed is more possible. Con-sequently, in this case, in order to increase the driving force, more
pe Surface area (m2/gr) Bulk density Crush strength Porosity
let – 680–710 40–48 (N/cm) 0.4
let – 670–720 40–50 (N/cm) 0.4
nule 930–950 490–510 – 0.38–0.4
ere 300–320 680–700 120–145 (N/Granule) 0.38–0.4
M.R. Rahimpour et al. / Chemical Engineering Journal 226 (2013) 444–459 449
value of sorbents shall be used in each column. According to thesereasons (separation of different chemical components and lowconcentration of impurities), in this PSA unit, four types of sorbentshave been used.
The first sorbent layer (H5-2), operates as a guard bed and isused to prevent the entrance of some components such as mercuryand arsine. The second sorbent layer (H2-10), which consists of ac-tive carbon (100%), is an inexpensive sorbent which is used foradsorption of hydrocarbons such as acetylene, ethylene and CO2.This phenomenon is indicated later in Fig. 6c. As it is shown in thisfigure, most of the value of ethylene, acetylene and CO2 is adsorbedby H2-10.
As illustrated in the paper, carbon monoxide is a toxic compo-nent for hydrogenation unit. The outlet stream of the PSA unit isfed to the hydrogenation unit and consequently must be separatedby PSA unit. The third, fourth and fifth sorbent layers (H1–H14 andH1, respectively), which consist of zeolite mainly are high-perfor-mance and expensive sorbents to adsorb components such asmethane and CO. Consequently, because of high-performance ofzeolite and importance of CO separation, this type of sorbent isused three times in each column. Size of particles of H1 and H14is 5 and 8 Å, respectively and actually H14 is more inexpensivethan H1. Therefore using a layer of H14 sorbent between two H1layers instead of using H1 layer completely is more economicallywithout any decreasing in adsorption efficiency. This fact is themain reason of arrangement of H1 and H14.
Because of the ability of zeolite to adsorb all the componentsone may ask that why zeolite is not used in each column com-pletely instead of combination of active carbon and zeolite. Activecarbon is more inexpensive than zeolite and is able to adsorb sometypes of hydrocarbons. So adsorption of components by active car-bon is more economically.
The effect of arrangement of sorbent layers which is an impor-tant operating parameter and sometimes seems ineffective onoperating of PSA units has been investigated by several research-ers. For example, Simone Cavenati et al. have studied on effect ofthe ratio of adsorbent layers.
In the PSA unit investigated in this study, by considering theweak interaction of hydrogen with five sorbent layers, it is consid-ered as an inert gas, during the performance of the PSA unit.
Fig. 3. Simplified diagram of the PSA un
As illustrated, the PSA unit which is investigated in this studyconsists of five beds that follow a specified sequence. Fig. 3 showsa brief description of this unit. The way the beds are connected oneto another and exchange of gas between columns in each step isobvious in this figure. The valves open and close automatically tochange the performance of the PSA unit from one step to anotherbased on the rule that is shown in Table 4. In order to follow thepredefined rule illustrated in Table 4, an automatic system is usedto control the interconnection of valves.
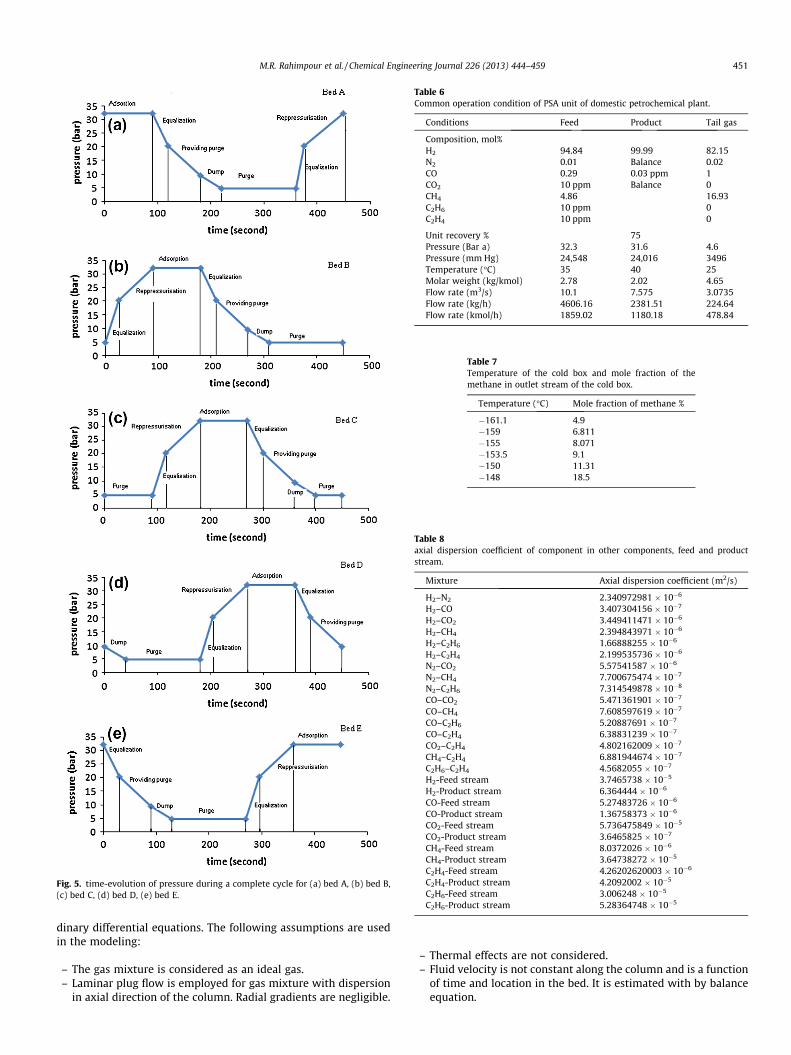
Moreover, in order to illustrate the operation of PSA unit moreobviously, the time-evolution of pressure in the five columns dur-ing each sub cycle is shown by Fig. 5. Step sequence which is indi-cated in Fig. 3 and Table 4 for each bed, can be followed in Fig. 5.Exchange of gas between columns in the first sub cycle is describedin the following paragraphs.
As it shown in the Fig. 5, during the first sub cycle, bed ‘‘A’’ oper-ates as an adsorber bed. Moreover, as indicated in this figure, in thesecond sub cycle time, bed ‘‘B’’ shall operate as the adsorber col-umn. So its pressure must be increased in the first sub cycle forpreparation of this bed for adsorption step in the second sub cycle.
During the first sub cycle, bed ‘‘E’’ (The last bed which has oper-ated as an adsorber column in the last sub cycle and must be pre-pared for purge step) by accumulated hydrogen, increases thepressure of bed ‘‘B’’ through EQvalve’s (equalization). Consequently,pressure of bed ‘‘E’’ and ‘‘B’’ decreases and increases to 20.2 barrespectively. Actually the pressure of bed ‘‘B’’ and ‘‘E’’ are equal-ized. After increasing the pressure of bed ‘‘B’’, a portion of feedstream enters to the bottom of this bed changing pressure from20.2 bar to 32.3 bar (repressurization) and finally the bed is readyfor adsorption step completely.
As illustrated, pressure of bed ‘‘E’’ must be decreased to 4.6 barfor purge step. A portion of pressure drop is done during the equal-ization step. The remained hydrogen in bed ‘‘E’’ enters the top ofbeds ‘‘C’’ and ‘‘D’’ for purging these beds. Consequently, the pres-sure of bed ‘‘E’’ decreases from 20.2 to 9.3 bar and this bed is pre-pared for purge step approximately. In the next sub cycle, bydischarging the remained hydrogen in bed ‘‘E’’ (dump), its pressuredecreases to favorable pressure (4.6 bar). It is necessary to illus-trate that before purging of bed ‘‘D’’ by ‘‘E’’ in the first sub cycle,by discharging the remained gas in bed ‘‘D’’ to the tail gas header
it of domestic petrochemical plant.
Fig. 4. Simplified schematic of each bed.
450 M.R. Rahimpour et al. / Chemical Engineering Journal 226 (2013) 444–459
(dump), this bed is prepared for purge step and its pressure de-creases to 4.6 bar.
Schematic of 5 adsorbers, called D01A, D01B, D01C, D01D andD01E are the same. Fig. 4 shows the simplified schematic of thesebeds and arrangement of sorbent layers in these columns.
Inlet mixture of PSA unit of domestic petrochemical plant iscomprised of seven components. These components are hydrogen,nitrogen, ethylene, acetylene, methane, carbon monoxide and car-bon dioxide. The outlet stream of this industrial unit with 99.99%purity in hydrogen is used for hydrogenation unit of domestic pet-rochemical plant. The PSA unit investigated in this study operatesunder various conditions on different days. The molar flow rate,impurity of components, and sub cycle time are different in variousdays. For example, mole fraction of methane is in the range of 4–15%. The common operation condition of PSA unit of domestic pet-rochemical plant is tabulated in Table 6.
By considering this complicated process, several operatingparameters can be effective on mole fraction of components in in-let stream of the PSA unit. For instance, the temperature varies ondifferent days. Consequently, the mole fraction of methane inwhich fed to the PSA unit is not the same on various operatingdays. Six different temperatures which create various mole fractionof methane in inlet stream of PSA unit are tabulated in Table 7.
Mole fraction of components in outlet stream of the liquid andgas crackers are not the same. For instance, the production of acet-ylene and methane by liquid furnaces is higher compared with gas
crackers. Whiles, mole fraction of hydrogen in outlet stream of gascracker is higher than liquid cracker. This difference for liquid andgas furnaces was shown in Tables 1 and 2, respectively. Gas Chro-matography ASTM D2504 Test method is used for analysis of non-condensable gases in C2 and lighter hydrocarbon products. Othercomponents are analyzed by ASTM D6159 method. According tothese statements, the number of liquid and gas crackers is anotheroperating parameter that has the direct effect on amount ofcracked components which are the feed of separation units suchas PSA unit. In normal conditions, five gas crackers and four liquidcrackers are used for cracking process. The arrangement of liquidand gas crackers depends on the produce capacity and shortageof liquid or gas feed of the crackers. For example, Sometimes it ismore desirable to produce the higher ethylene compared withthe other olefins. Consequently, it is necessary to increase thenumber of the gas furnace. On specific days, liquid feed is less com-pared with the other days. So, it is suitable to decrease the numberof liquid furnace.
5. Mathematical model
For simulating PSA unit a set of partial differential and algebraicequations are used to develop a mathematical model. These partialdifferential equations (PDE’s) are converted by method of line to aset of ordinary differential equations (ODE’s). After this conversion,programming with MATLAB has been used to solve this set of or-
Fig. 5. time-evolution of pressure during a complete cycle for (a) bed A, (b) bed B,(c) bed C, (d) bed D, (e) bed E.
Table 6Common operation condition of PSA unit of domestic petrochemical plant.
Table 11Boundary conditions employed for simulation.
Fluid entering the bed Xi = Xi,in
Fluid leaving bed and closed end (Ci/@Z) = 0Adsorption Z = 0 ? m = mf
Pressure equalizations, repressurization and provide purge: Z = 0 ? m = 0Blow down Z = 0 ? P = P(t)Purge Z = 0 ? P = PD
Intersection of the second and the third layers P2(xi) = P3(xi)Intersection of the third and the fourth layers P3(xi) = P4(xi)Intersection of the fourth and the Fifth layers P4(xi) = P5(xi)
452 M.R. Rahimpour et al. / Chemical Engineering Journal 226 (2013) 444–459
– Because of low temperature difference between inlet and outletstreams, the Langmuir isotherm is used for computation of mul-ticomponent adsorption equilibrium.
– The amount of adsorbed hydrogen is negligible.– A linear driving force equation (LDF equation) is used for esti-
mation of mass transfer rate.– No heat is lost to the surroundings.
5.1. Balance equations
Overall mass balance for gas phase is described by the followingequation:
@q@t¼ � @ðmqÞ
@z� ð1� eÞ
eXn�1
i¼1
@qi
@tð3Þ
where ‘‘q’’, ‘‘m’’, ‘‘z’’, ‘‘t’’, ‘‘qi’’, are the gas density, gas stream velocity,axial dimension, time and the ratio of amount of adsorbed compo-nent to the amount of sorbent (kgi/kgsorbent) respectively.
In this equation, ‘‘e’’ is the porosity of the sorbents layers. In thisequation, e is the porosity of the sorbents layers. Porosity of eachsorbent layer with the other physical properties are tabulated inTable 5.
The following equation derived from mass balance for compo-nent i:
@ci
@t¼ Dz
@2ci
@z2 �@ðm � ciÞ@z
� 1� ee
@qi
@tð4Þ
Boundaryconditions
T = Tin
(T/@Z) = 0Z = L ? P = Pads
Z = L ? P = P(t)Z = L ? m = 0Z = L ? m = �mout (Pout/PL)V2(xi) = V3(xi) T2(xi) = T3(xi) Ci,2(xi) = Ci,3(xi)V3(xi) = V4(xi) T3(xi) = T4(xi) Ci,3(xi) = Ci,4(xi)V4(xi) = V5(xi) T4(xi) = T5(xi) Ci,4(xi) = Ci,5(xi)
M.R. Rahimpour et al. / Chemical Engineering Journal 226 (2013) 444–459 453
where ‘‘Ci’’ is the molar concentration of component ‘‘i’’ in the gasphase and ‘‘Dz’’ is the axial dispersion coefficient of component‘‘A’’ in gas mixture which is calculated by the following equation[33]:
DA;m ¼NA � yA
Xn
i¼A
Ni
Xn
i¼A
1DiðyiNA � yANiÞ
ð5Þ
0 0.5 1 1.5 2 2.5 3 3.50.94
0.95
0.96
0.97
0.98
0.99
1
1.01
z-direction
Mol
e fr
acti
on o
f hy
drog
en
simulationexperimental
0 0.5 1 1.5 2 2.5 3 3.5-1
-0.5
0
0.5
1
1.5
2
2.5
3
3.5 x 10⁻⁵
z-direction
Mol
e fr
acti
on o
f C
O2,
C2H
4, C
2H6
simulationexperimental
0 0.5 10
0.2
0.4
0.6
0.8
1
1.2x 10⁻⁴
Mol
e fr
acti
on o
f N
2
(a)
(c)
(e)
Fig. 6. Mole fraction variation of (a) hydrogen, (b) methane, (c) carbon dioxide + ethyleneoperates in adsorption step at 56 s.
As indicated in this equation, before calculation of axial dispersioncoefficient of component ‘‘A’’ in gas mixture, axial dispersion coeffi-cient of component ‘‘A’’ in other components shall be estimated byWilke Lee equation which has been derived by modification of Hir-schfelder–Bird–Spotz method [34]:
DAB ¼10�4 1:084� 0:249
ffiffiffiffiffiffiffiffiffiffiffiffiffiffiffi1
MAþ 1
MB
q� �h iðTÞ3=2
ffiffiffiffiffi1
MA
qþ 1
MB
� �ðPtotalÞðrABÞ2f KT
eAB
� � ð6Þ
0 0.5 1 1.5 2 2.5 3 3.50
0.005
0.01
0.015
0.02
0.025
0.03
0.035
0.04
0.045
0.05
z-direction
Mol
e fr
acti
on o
f m
etha
ne
simulationexperimental
0 0.5 1 1.5 2 2.5 3 3.50
0.5
1
1.5
2
2.5
3 x 10⁻³
z-direction
Mol
e fr
acti
on o
f m
onox
ide
simulationexperimental
1.5 2 2.5 3 3.5z-direction
simulationexperimental
(b)
(d)
+ acetylene, (d) carbon monoxide and (e) nitrogen along the bed axial direction that
Fig. 7. Comparison of amount of adsorbed (a) nitrogen, (b) carbon monoxide, (c) carbon dioxide + ethylene + acetylene, (d) methane estimated by simulation andcorresponded plant data during the operating time of adsorption step at the end of second layer.
454 M.R. Rahimpour et al. / Chemical Engineering Journal 226 (2013) 444–459
where M is the axial dispersion coefficient of each component inother components and the axial dispersion coefficient of each com-ponent in feed and product stream are tabulated in Table 8:
In this work, Langmuir isotherm is used for computation ofmulticomponent adsorption equilibrium:
qieq ¼qisatbiPi
1þPn
j¼1bjPjð7Þ
qisat ¼ a1;i þa2;i
Tð8Þ
bi ¼ b0;iexpb1;i
T
� �ð9Þ
The Langmuir coefficients of components which are used in Eqs.(7)–(9) are tabulated in Table 9.
Mass transfer rate is estimated by the following equation (LDFequation):
@qi
@t¼ Kiðqieq � qiÞ ð10Þ
The overall mass transfer coefficients of components on H-2-10, H-1and H-14 layers are summarized in Table 10a–c respectively.
Pressure variation with time in equalization, providing purge,dump and repressurization steps is estimated by the followingequation:
P ¼ PðtÞ ¼ PL þ ðPH � PLÞt
tstep
� �2
� 2ttstepþ 1
" #ð11Þ
where ‘‘P’’ is the pressure of gas stream which varies with time dur-ing each step. ‘‘PL’’, ‘‘PH’’ and ‘‘tstep’’ are the minimum pressure, themaximum pressure and the total duration of each step respectively.
5.2. Initial conditions
A number of initial conditions are needed in order to solve themodel which is developed in this study. At the beginning of the PSAcycle, the absorbents are considered clean. The bed temperature isconsidered to be equal to the temperature of the inlet stream.
The following initial conditions are used to solve the coupledpartial differential and algebraic equations for simulation of PSAunit of domestic petrochemical plant:
CiðzÞ ¼ 0; i ¼ 1; . . . ;n� 1 z ¼ ð0; lÞ ð12Þ
PðZÞ ¼ initial pressure of bed z ¼ ð0; lÞ ð13Þ
qiðzÞ ¼ 0; i ¼ 1; . . . ;n� 1 z ¼ ð0; lÞ ð14Þ
5.3. Boundary conditions
Although the balance equations used for simulation of all stepsof the process such as pressurization and equalization are thesame, but boundary conditions are different. The boundary condi-tions employed to solve the model developed in this study are tab-ulated in Table 11:
Fig. 8. Comparison of amount of adsorbed (a) nitrogen, (b) carbon monoxide, (c) carbon dioxide + ethylene + acetylene, (d) methane estimated by simulation andcorresponded plant data during the operating time of adsorption step at the end of third layer.
M.R. Rahimpour et al. / Chemical Engineering Journal 226 (2013) 444–459 455
6. Results and discussion
6.1. Model validation
In this work, a set of coupled partial differential equations wassolved for simulation of PSA unit of domestic petrochemical plant.The model developed in this work, was validated against corre-sponded plant data which were reported by domestic petrochem-ical plant. Fig. 6a–e shows the variation of mole fraction ofcomponents along axial direction of the bed which operates inadsorption step at a certain time (56 s). The comparison showedthat the variations of operating parameters are well predicted bythe model.
It is obvious that Analysis of mole fraction of components ingas stream is impossible along the bed axial direction. Conse-quently, mole fraction of components along the bed axial direc-tion estimated by simulation at a certain time (56 s), have beencompared with mole fraction of components reported by domes-tic petrochemical plant at the end of the column at the same time(Fig. 6).
Moreover, the developed simulation in this study is used to esti-mate the amount of adsorbed components at the end of each layerduring the adsorption step. As depicted in Figs. 7g–9, amount ofadsorbed components estimated by simulation at the end of sec-ond, third and fourth sorbent layers, respectively, have been com-pared with those of reported by domestic petrochemical plantduring the adsorption time.
As illustrated in Table 6, methane is the main impurity of inletstream of PSA unit of domestic petrochemical plant. For exampleon a typical day, the inlet stream has about 4.86%, 0.01% and
0.29% impurity in methane, nitrogen and carbon monoxide, respec-tively. Moreover, there is a significant difference between the over-all mass transfer coefficient for methane and the other componentsin gas mixture. Consequently, as is shown in Figs. 7–9, the amountof adsorbed methane is higher than the other components. Becauseof the time limitation in the adsorption step, sampling at the eachend of the sorbent layer in numerous moments is impossible. Asdepicted in Figs. 7–9, sampling was possible just at three differentmoments.
Also, simulation is used for estimating the hydrogen recoveryand product purity. Consequently, comparison between hydrogenrecovery and product purity predicted by simulation and corre-sponded plant data for the same operating conditions is anothersuitable way for validation of simulation (Table 12). As shown inTable 11, the hydrogen recovery and product purity are well pre-dicted by simulation. So, simulation creates suitable facility toinvestigate the effect of operating parameters on variation ofhydrogen recovery and hydrogen purity that have direct effect onoperating and total costs.
Application of simulation of PSA unit is not limited to adsorp-tion step. In the current work, purge step is modeled by proper ini-tial and boundary conditions. Consequently, simulation could beused to determine a predictable mole fraction of components andamount of components adsorbed during the purge step. Compari-son between mole fractions of components along the axial direc-tion of the column at a certain time with corresponded plantdata, during the purge step is another alternative to validate thesimulation. Fig. 10a and b shows the variation of mole fraction ofhydrogen and methane, respectively along the axial direction ofthe column during the purge step.
Fig. 9. Comparison of amount of adsorbed (a) nitrogen, (b) carbon monoxide, (c) carbon dioxide + ethylene + acetylene, (d) methane estimated by simulation andcorresponded plant data during the operating time of adsorption step at the end of fourth layer.
Table 12Comparison between hydrogen recovery and product (Hydrogen) purity predicted bysimulation and corresponded plant data for the same operating conditions.
456 M.R. Rahimpour et al. / Chemical Engineering Journal 226 (2013) 444–459
The cycle time of PSA unit of domestic petrochemical plant isabout 350 s. The hydrogen purity estimated by simulation in dif-ferent moments during a complete cycle and corresponded plantdata are tabulated in Table 13. As illustrated in this table, thereis no significant difference between mole fractions of hydrogenin different moments of a cycle. Changing the system from one stepto another in a short time is the main reason of this equality. Inother words, preparation of a bed for adsorption step in a shorttime (less than 290 s), causes the sorbents of the PSA unit to befresh for adsorption process all the moments during a sub cycle.Consequently, there is not significant slump in activity of sorbentsduring a cycle and subsequently there is not considerable reduc-tion in amount of adsorbed components in different moments.
6.2. Obtaining the optimal time for adsorption step
The costs of valve installation and maintenance in industrialplans are considerable compared with the other equipment. Soeach valve damage increases the operating costs that are allocated
to valves maintenance. Shifting system from one step to another induration less than 50 s damages the valve structure. In specialcases, shifting a PSA unit from one step to another in duration lessthan 50 s decreases the pollutant absorption by sorbent withoutany change in purity and efficiency. But in these cases, becauseof the enhancement of the operating costs, it is more suitable to in-crease the transition with duration of more than 50 s. According tothese statements, obtaining a suitable time step has direct effect onpollution load and operating costs. As illustrated, the operatingconditions of PSA unit on various days are different. So it is not pos-sible to set the time of each step to constant value. In other words,time steps estimated for different operating conditions of a PSAunit are not the same. Consequently, estimation of suitable timefor each step of PSA cycle that has direct effect on operating costsand pollution load of sorbents is an important issue in the PSA unitof domestic petrochemical plant and the other PSA units whichoperates in different conditions.
Simulation is used to obtain an optimal time for adsorptionstep. The plant data reported by domestic petrochemical plantfor three different days are tabulated in Tables 14–16. As is shownin these tables, the inlet stream of PSA unit on these days has var-ious impurities in methane, ethylene, acetylene, nitrogen, carbonmonoxide and carbon dioxide. It is obvious that obtaining a partic-ular time for adsorption step, which operates in different operatingconditions, is necessary. The suitable times estimated by simula-tion for adsorption step of PSA unit investigated in this studywhich operates in three different operating conditions are visiblein Tables 14–16.
0 0.5 1 1.5 2 2.5 3 3.5 40.94
0.95
0.96
0.97
0.98
0.99
1
z-direction
Mol
e fr
acti
on o
f hy
drog
en
simulationexperimental
0 0.5 1 1.5 2 2.5 3 3.5 40
0.005
0.01
0.015
0.02
0.025
0.03
0.035
0.04
0.045
0.05
z-direction
Mol
e fr
acti
on o
f m
etha
ne
simulationexperimental
(a)
(b)
Fig. 10. Mole fraction variations of (a) hydrogen and (b) methane along the bedaxial direction that operates in purge step at 45 s.
Table 13Comparison between hydrogen purity estimated by simulation and correspondedplant data in different moments of a cycle.
Time (s) Product purity% Product purity%Simulation Plant data
M.R. Rahimpour et al. / Chemical Engineering Journal 226 (2013) 444–459 457
The obtained optimal times for adsorption step in differentoperating conditions (step 1, 2 and 3) have been allocated to PSAunit and the similar results are achieved. Actually, by allocatingoptimal sub cycle time, pollution load of sorbents for purificationof hydrogen to 99.99% vol. is minimized.
6.3. The effect of cycle time on hydrogen recovery and product purity
In a PSA unit, hydrogen recovery and product purity are twoimportant and key parameters. The performance of the unit is con-trolled by the variation of these parameters. It is obvious that gaspurification by sorbents is the main objective of a PSA unit. Themole ratio of hydrogen to total product which collected from theproduct line in the last cycle duration is called product purity.Product purity is described by the following equation:
Product purity ¼R Tcycle
0 p � R2i � e � VP � XH2p � dtR Tcycle
0 p � R2i � e � VP � dt
ð15Þ
As illustrated, the hydrogen recovery of the PSA unit investigated inthis study is about 75%. The mole ratio of hydrogen collected fromthe product line to total hydrogen that is fed to the bed entrance inthe last cycle duration is called hydrogen recovery. Hydrogen recov-ery is defined by the following equation:
Hydrogen recovery ¼R Tcycle
0 p � R2i � e � VP � XH2p � dtR Tcycle
0 p � R2i � e � mf � XH2 f � dt
ð16Þ
Considering the value of hydrogen as a novel energy carrier,every change in hydrogen production has a considerable effecton ecumenical price of hydrogen and world economy. Theenhancement of hydrogen recovery contributes to increase thePSA unit economics and improves its efficiency. Consequently, itis very important to investigate the suitable alternative forenhancement of hydrogen recovery. The cycle time is an importantvariable that has direct effect on the unit performance and operat-ing parameters. Cycle time is the sum of the step times. So, the ob-served increasing in cycle time is because of increasing the steptimes. The enhancement of the step time, causes to enhance thepollution load of sorbent and consequently decreases the abilityof the sorbents for adsorption of the impurities. Although theincreasing of cycle time decreases the ability of sorbents and prod-uct purity, it would increase hydrogen recovery. According to thesestatements, obtaining an optimal cycle time is an attractive alter-native to increase the hydrogen recovery with slight reduction inproduct purity.
As illustrated, the outlet stream of PSA unit is used for hydroge-nation unit. Carbon monoxide is a toxic composition for hydroge-nation unit and existence of carbon monoxide in product streamis an unfavorable phenomenon in this unit. Consequently, it is veryimportant to consider that by enhancement of the cycle time, theincreasing in impurity of other components except carbon monox-ide is allowable. Optimal cycle time has strength relation with mo-lar flow rate of inlet stream and other operation parameters. So it isimpossible to estimate a constant optimal time for various operat-ing conditions.
As shown in Fig. 11, an optimal cycle time is obtained (670 s) forPSA unit of domestic petrochemical plant that operates in condi-tions tabulated in Table 6. For these conditions allocation of670 s to complete the cycle, decreases product purity and increaseshydrogen recovery to 99.8% and 0.8%, respectively, without anyenhancement of mole fraction of carbon monoxide in the outletstream.
The variation of cycle time is a controversial issue in the indus-trial PSA units. There is a reverse relation between sub cycle time(T) and feed flow rate which is described by the followingequation:
In other words, control systems use feed flow rate and Kf to estimatethe sub cycle time automatically. Kf is a set time coefficient which ischangeable by operators. Operators are allowed to change Kf to reg-ulate the desired feed flow rate or sub cycle time. For instance,maybe in a specific day consumer of PSA unit requests higher prod-
Table 14Estimated adsorption time for a possible operating condition (set 1).
Fig. 11. Variation of hydrogen recovery and product purity as a function of cycletime.
0.9965
0.997
0.9975
0.998
0.9985
0.999
0.9995
1
Hyd
roge
n pu
rity
Feed flow rate8 10 12 14 16 18 20
0.75
0.76
0.77
0.78
0.79
0.8
0.81
0.82
Hyd
roge
n re
cove
ry
Fig. 12. Variation of hydrogen recovery and product purity as a function of feedflow rate.
458 M.R. Rahimpour et al. / Chemical Engineering Journal 226 (2013) 444–459
uct stream compared with the other days. Enhancement of productstream contributes to increase in feed stream. Based on Eq. (17) andby considering the Kf regulated by operators, sub cycle time is esti-mated and applied for PSA unit automatically. But sometimes aquestionable event takes place in PSA unit of industrial plants
jointly. It is better to give an example for more obvious explanationof this event. On a specific day, desired amount of hydrogen whichmust be collected in outlet stream of PSA unit of domestic petro-chemical plant and Kf factor are not changed, whiles feed flow rateand sub cycle time are changed simultaneously. On this specific day,
M.R. Rahimpour et al. / Chemical Engineering Journal 226 (2013) 444–459 459
enhancement of mole fraction of methane in the inlet stream of PSAunit is the only considerable variation of inlet operating variables.In this condition, feed flow rate increases to compensate for hydro-gen reduction in feed stream. On based of the equation 17 and byconsidering the constant Kf, sub cycle time decreases automatically.Consequently, variation of mole fraction of components in inletstream of PSA unit causes cycle time to be changed automatically.
6.4. The effect of feed flow rate on hydrogen recovery and productpurity
Feed flow rate is an important operating parameter that influ-ences on hydrogen recovery and product purity. As the feed rate in-creases in a constant cycle time, bed utilization is enhanced. Inother words, fraction of polluted bed increases. This phenomenondecreases the ability of sorbents for adsorption of impurities andconsequently decreases product purity. On the other hand,enhancement of feed flow rate increases the hydrogen recoveryslightly. According to these statements, obtaining an optimal feedflow rate is an attractive alternative to increase the hydrogenrecovery with slight reduction in product purity.
It is impossible to estimate a specific optimal feed flow rate forPSA unit of domestic petrochemical plant which operates in differ-ent operating conditions. As shown in Fig. 12 an optimal feed flowrate is obtained (11.3 m3/s) for PSA unit that operates under condi-tions tabulated in Table 6.
For these conditions allocation of 11.3 m3/s as the feed flowrate, decreases product purity and increases hydrogen recoveryto 99.776% and 77.5%, respectively, without any enhancement ofmole fraction of carbon monoxide in the outlet stream.
7. Conclusions
By considering the importance of hydrogen production as amodern energy carrier and world price of hydrogen there isincreasing interest in hydrogen purity in PSA units.
In this work, the PSA unit of domestic petrochemical plant wassimulated. The results were in good consistency with the unit data.The main goal of this simulation is to find the suitable time foradsorption step of three different operating conditions. Hydrogenrecovery and product purity are two important parameters affect-ing the performance of the PSA unit. Feed flow rate and cycle timeare two operating variables that have direct effect on hydrogenrecovery and product purity. In this study, the optimal value offeed flow rate and cycle time is estimated for PSA unit of domesticpetrochemical plant that operates under certain operatingconditions.
In specific operating conditions, the optimal value of cycle timeand feed flow rate is 670 s and 11.3 m3/s respectively. The opti-mum cycle time increases hydrogen recovery to 80% with slightreduction of hydrogen purity in product stream. The optimum feedflow rate contributes to increase hydrogen recovery to 77.5% withslight reduction of hydrogen purity. The impurity of carbon mon-oxide dos not increases due to enhancement of cycle time. Conse-quently, allocating the 670 s to performance of complete cycle ofPSA unit is allowable and non-harmful for hydrogenation unit.
References
[1] B. Wang, W.D. Goodman, G.F. Froment, Kinetic modeling of pure hydrogenproduction from decalin, J. Catal. 253 (2008) 229–238.
[2] N. Kariya, A. Fukuoka, T. Utagawa, M. Sakuramoto, Y. Goto, M. Ichikawa,Efficient hydrogen production using cyclohexane and decalin by pulse-spraymode reactor with Pt catalysts, Appl. Catal. 247 (2003) 247–259.
[3] A. Durgutlu, Experimental investigation of the effect of hydrogen in argon as ashielding gas on TIG welding of austenitic stainless steel, Mater. Des. 25 (2003)19–23.
[4] Y.S. Cheng, M.A. Peña, J.L. Fierro, D.C.W. Hui, K.L. Yeung, Performance ofalumina, zeolite, palladium, Pd–Ag alloy membranes for hydrogen separationfrom Towngas mixture, J. Membr. Sci. 204 (2002) 329–340.
[5] K.L. Yeung, J.M. Sebastian, A. Varma, Novel preparation of Pd/Vycor compositemembranes, Catal. Today 25 (1995) 231–236.
[6] K.L. Yeung, R. Aravind, J. Szegner, A. Varma, Metal composite membranes:synthesis, characterization and reaction studies, Stud. Surface Sci. Catal. 101(1996) 1349–1358.
[7] D.M. Ruthven, S. Farooq, K.S. Knaebel, Pressure Swing Adsorption, VCHPublishers, New York, U.S.A., 1994.
[8] G. Klein, T. Vermeulen, Cyclic performance of layered beds for binary ionexchange, A.I.Ch.E. 71 (1975) 69–76.
[9] D.D. Frey, A model of adsorbent behavior applied to the use of layered beds incycling zone adsorption, Sep. Sci. Technol. 17 (1983) 1485.
[10] P.C. Wankat, D. Tondeur, Use of multiple sorbents in pressure swingadsorption, parametric pumping and cycling zone adsorption, A.I.Ch.E. 81(1985) 74.
[11] M. Chlendi, D. Tondeur, in: M.D. LeVan (Ed.), Dynamics of Two-Adsorbent Bedswith Flow-Reversal for Gas Separation, Fundamentals of Adsorption, KluwerAcademic Publishers, Boston, U.S.A., 2009, pp. 187–194.
[12] C.F. Watson, R.D. Whitley, M.I. Meyer, Multiple zeolite adsorbent layers inoxygen separation U.S. Patent. 5, 1996, pp. 529–610.
[13] M. Chlendi, D. Tondeur, Dynamic behavior of layered columns in pressureswing adsorption, Gas. Sep. Purif. 9 (1995) 231.
[14] G. Pigorini, M.D. LeVan, Equilibrium theory for pressure swing adsorption, 2.Purification and enrichment in layered beds, Ind. Eng. Chem. Res. 36 (1997)2296.
[15] J.H. Park, J.N. Kim, S.H. Cho, J.D. Kim, R.T. Yang, Adsorber dynamics and optimaldesign of layered beds for multicomponent gas adsorption, Chem. Eng. Sci. 53(1998). 3951-63.
[16] S. Cavenati, C.A. Grande, A.E. Rodrigues, Separation of CH4/CO2/N2mixtures bylayered pressure swing adsorption for upgrade of natural gas, Chem. Eng. Sci.61 (2006) 3893–3906.
[17] S.U. Rege, R.T. Yang, K. Qian, M.A. Buzanowski, Air-prepurification by pressureswing adsorption using single/layered beds, Chem. Eng. Sci. 56 (2001) 2745–2759.
[18] Y. Takamura, S. Narita, J. Aoki, S. Hironaka, S. Uchida, Evaluation of dual-bedpressure swing adsorption for CO2 recovery from boiler exhaust gas, Sep. Purif.Technol. 24 (2001). 519-28.
[19] T. Takeguchi, W. Tanakulrungsank, T. Inui, Separation and/or concentration ofCO2 from CO2/N2 gaseous mixture by pressure swing adsorption using metal-incorporated microporous crystals with high surface area, Gas Sep. Purif. 7(1993) 3–9.
[21] S. Ahn, Y.W. You, D.G. Lee, K.H. Kim, M. Oh, C.H. Lee, Layered two-and four-bedPSA processes for H2 recovery from coal gas, Chem. Eng. Sci. 68 (2012) 413–423.
[22] T.G. Glover, M.D. LeVan, Sensitivity analysis of adsorption bed behavior:examination of pulse inputs and layered-bed optimization, Chem. Eng. Sci. 63(8) (2008) 2086–2098.
[23] R.P. Lively, N. Bessho, D.A. Bhandari, Y. Kawajiri, W.J. Koros, Thermallymoderated hollow fiber sorbent modules in rapidly cycled pressure swingadsorption mode for hydrogen purification, Int. J. Hydrogen Energy 37 (20)(2012) 15227–15240.
[24] S.J. Doong, R.T. Yang, Hydrogen purification by the multibed pressure swingadsorption process, Reactive Polymers, Ion Exchangers, Sorbents 6 (1987) 7–13.
[25] T. Saitou, K. Sugiyama, Hydrogen purification with metal hydride sinteredpellets using pressure swing adsorption method, J. Alloys Compd. 231 (1995)865–870.
[26] S.E. Iyuke, W.R.W. Daud, A.B. Mohamad, A.A.H. Kadhum, Z. Fisal, A.M. Shariff,Application of Sn-activated carbon in pressure swing adsorption forpurification of H2, Chem. Eng. Sci. 55 (2000) 4745–4755.
[27] V.S.L. Carlos, A. Grande, E.R. Alírio, Activated carbon for hydrogen purificationby pressure swing adsorption: multi component breakthrough curves and PSAperformance, Chem. Eng. Sci. 34 (2011) 2771–2777.
[28] E.H. Majlan, W.R.W. Daud, S.E. Iyuke, A.B. Mohamad, A.A.H. Kadhum, A.W.Mohammad, M.S. Takriff, N. Bahaman, Hydrogen purification using compactpressure swing adsorption system for fuel cell, Int. J. Hydrogen Energy 34 (6)(2009) 2771–2777.
[29] D. Nikolic, A. Giovanoglou, M.C. Georgiadis, E.S. Kikkinides, Modelling andsimulation of multi-bed pressure swing adsorption processes, Computer AidedChem. Eng. 24 (2007) 159–164.
[30] M. Tanczyk, K. Warmuzinski, Multicomponent pressure swing adsorption. PartII. Experimental verification of the model, Chem. Eng. Process. 37 (1998) 301–315.
[31] M. Masoumi, M. Shahrokhi, M. Sadrameli, J. Tpwfighi, Modeling and Control ofa Naphtha Thermal Cracking Pilot Plant, American Chemical Society,Washington, DC, ETATS-UNIS, 2006.
[32] A. Tarafder, B.C.S. Lee, A.K. Ray, G.P. Rangaiah, Multiobjective Optimization ofan Industrial Ethylene Reactor Using a Nondominated Sorting GeneticAlgorithm, American Chemical Society, Washington, DC, ETATS-UNIS, 2005.