Chemical mixing in the bottom boundary layer of a eutrophic reservoir: The effects of internal seiching on nitrogen dynamics Bridget R. Deemer,* Stephen M. Henderson, John A. Harrison Washington State University Vancouver, School of the Environment, Vancouver, Washington Abstract In lakes and reservoirs, the bottom boundary layer (BBL) mediates chemical fluxes between sediments and the overlying water column. At the internal shoreline, where the thermocline contacts the lakebed, the motions of internal waves can create fluctuating redox conditions and dynamic physical forcing that may support ecologically important reactions such as denitrification. We characterized physical and chemical dynamics within the internal shoreline of a eutrophic reservoir during the spring and early summer of 2012 (18 May to 18 July). An internal seiche was found to generate quasi-periodic fluctuations (periods about 12– 24 h) in BBL stratification, temperature, and redox conditions. To examine possible implications for chemical mixing and microbial processing, differences between vertically offset, simultaneous BBL measurements of velocity, temperature, N 2 , and N 2 O were made over 23 h. Vertical differences in BBL temperature, N 2 , and N 2 O formed and collapsed during the wave cycle, with the largest differences occurring following the arrival of an internal bore. Through much of the wave cycle, chemical differences were explained by physical advec- tion and mixing. However, chemical differences measured after bore arrival were not explained by advection, possibly owing to local production of N 2 and N 2 O. These results highlight the dynamic physical environment within the internal shoreline, and the potential of this zone to contribute to system wide denitrification and nitrous oxide production. In lakes, the bottom boundary layer (BBL) functions as a chemical and physical interface between sediments and the water column (Imberger 1998). The BBL can be defined as the zone immediately above the lakebed where flows are strongly damped by turbulent friction between the water col- umn and sediments. This zone mediates the exchange of sol- utes and particles between the water column and the sediment (Lorke et al. 2003) and is often a region of sharp redox gradients (Bryant et al. 2010). Mixing across the BBL may, thus, bring substrates, limiting reactants, and microbes together, facilitating important biogeochemical reactions. One process that often relies on mixing of limiting reactants is denitrification, defined here as the microbially mediated conversion of biologically available nitrogen (N) to nonreac- tive dinitrogen (N 2 ). Denitrification requires suboxic condi- tions ( < 6.25 lmol O 2 L 21 ) and reduced electron donors (often organic carbon) to proceed, but also requires oxidized forms of N (e.g., NO 2 3 ), which are produced in an oxygen- ated environment (Seitzinger et al. 2006). Thus, the trans- port of water column NO 2 3 across the BBL may fuel denitrification in reducing, carbon rich sediments. Denitrification is an important, but difficult to measure, pathway for N removal in aquatic ecosystems (Groffman et al. 2006; Seitzinger et al. 2006). Previous work to charac- terize spatial distribution of denitrification in lakes and reser- voirs has focused on comparing littoral vs. profundal environments (Saunders and Kalff 2001; David et al. 2006) and on the water column distribution of N 2 , the end product of denitrification (Deemer et al. 2011; Grantz et al. 2012; Beaulieu et al. 2014). Between littoral and profundal envi- ronments lies the internal shoreline, where the thermocline meets the lakebed. This region may be a particularly active site for denitrification and other redox reactions, but we are unaware of any field studies that focus specifically on inter- nal shoreline N dynamics. At the internal shoreline, internal waves (often dominated by energetic internal seiches) can periodically expose the sediments to warm, oxygenated, epi- limnetic water followed by cold, hypoxic (or anoxic) hypo- limnion water (Fig. 1a–c). In addition to creating a dynamic biochemical environment, internal waves may influence physical mixing of limiting reactants by generating free *Correspondence: [email protected]This is an open access article under the terms of the Creative Commons Attribution-NonCommercial License, which permits use, distribution and reproduction in any medium, provided the original work is properly cited and is not used for commercial purposes. 1 LIMNOLOGY and OCEANOGRAPHY Limnol. Oceanogr. 00, 2015, 1–24 V C 2015 The Authors Limnology and Oceanography published by Wiley Periodicals, Inc. on behalf of Association for the Sciences of Limnology and Oceanography doi: 10.1002/lno.10125
Transcript
Chemical mixing in the bottom boundary layer of a eutrophicreservoir: The effects of internal seiching on nitrogen dynamics
Bridget R. Deemer,* Stephen M. Henderson, John A. HarrisonWashington State University Vancouver, School of the Environment, Vancouver, Washington
Abstract
In lakes and reservoirs, the bottom boundary layer (BBL) mediates chemical fluxes between sediments andthe overlying water column. At the internal shoreline, where the thermocline contacts the lakebed, themotions of internal waves can create fluctuating redox conditions and dynamic physical forcing that maysupport ecologically important reactions such as denitrification. We characterized physical and chemicaldynamics within the internal shoreline of a eutrophic reservoir during the spring and early summer of 2012(18 May to 18 July). An internal seiche was found to generate quasi-periodic fluctuations (periods about 12–24 h) in BBL stratification, temperature, and redox conditions. To examine possible implications for chemicalmixing and microbial processing, differences between vertically offset, simultaneous BBL measurements ofvelocity, temperature, N2, and N2O were made over 23 h. Vertical differences in BBL temperature, N2, andN2O formed and collapsed during the wave cycle, with the largest differences occurring following the arrivalof an internal bore. Through much of the wave cycle, chemical differences were explained by physical advec-tion and mixing. However, chemical differences measured after bore arrival were not explained by advection,possibly owing to local production of N2 and N2O. These results highlight the dynamic physical environmentwithin the internal shoreline, and the potential of this zone to contribute to system wide denitrification andnitrous oxide production.
In lakes, the bottom boundary layer (BBL) functions as achemical and physical interface between sediments and thewater column (Imberger 1998). The BBL can be defined asthe zone immediately above the lakebed where flows arestrongly damped by turbulent friction between the water col-umn and sediments. This zone mediates the exchange of sol-utes and particles between the water column and thesediment (Lorke et al. 2003) and is often a region of sharpredox gradients (Bryant et al. 2010). Mixing across the BBLmay, thus, bring substrates, limiting reactants, and microbestogether, facilitating important biogeochemical reactions.One process that often relies on mixing of limiting reactantsis denitrification, defined here as the microbially mediatedconversion of biologically available nitrogen (N) to nonreac-tive dinitrogen (N2). Denitrification requires suboxic condi-tions (<6.25 lmol O2 L21) and reduced electron donors(often organic carbon) to proceed, but also requires oxidized
forms of N (e.g., NO23 ), which are produced in an oxygen-
ated environment (Seitzinger et al. 2006). Thus, the trans-port of water column NO2
3 across the BBL may fueldenitrification in reducing, carbon rich sediments.
Denitrification is an important, but difficult to measure,pathway for N removal in aquatic ecosystems (Groffmanet al. 2006; Seitzinger et al. 2006). Previous work to charac-terize spatial distribution of denitrification in lakes and reser-voirs has focused on comparing littoral vs. profundalenvironments (Saunders and Kalff 2001; David et al. 2006)and on the water column distribution of N2, the end productof denitrification (Deemer et al. 2011; Grantz et al. 2012;Beaulieu et al. 2014). Between littoral and profundal envi-ronments lies the internal shoreline, where the thermoclinemeets the lakebed. This region may be a particularly activesite for denitrification and other redox reactions, but we areunaware of any field studies that focus specifically on inter-nal shoreline N dynamics. At the internal shoreline, internalwaves (often dominated by energetic internal seiches) canperiodically expose the sediments to warm, oxygenated, epi-limnetic water followed by cold, hypoxic (or anoxic) hypo-limnion water (Fig. 1a–c). In addition to creating a dynamicbiochemical environment, internal waves may influencephysical mixing of limiting reactants by generating free
This is an open access article under the terms of the Creative CommonsAttribution-NonCommercial License, which permits use, distribution andreproduction in any medium, provided the original work is properlycited and is not used for commercial purposes.
1
LIMNOLOGYand
OCEANOGRAPHY Limnol. Oceanogr. 00, 2015, 1–24VC 2015 The Authors Limnology and Oceanography published by Wiley Periodicals, Inc.
on behalf of Association for the Sciences of Limnology and Oceanographydoi: 10.1002/lno.10125
convection within sediments (Kirillin et al. 2009), by modi-fying the thin near-bed diffusive boundary layer (Bryantet al. 2010), or by modifying stratification and mixing in theoverlying turbulent BBL.
Internal waves can have a particularly strong influence onBBL stratification and mixing through the process of shear-induced periodic stratification, which occurs when verticallysheared up and downslope flows cause differential advectionof stratified waters (Fig. 1a–c, Taylor 1993; Lorke et al. 2005;Umlauf and Burchard 2011; Cossu and Wells 2014). Duringupslope flow, faster velocities higher above the bed can tilt, oreven overturn near-bed isotherms (Fig. 1b), generating weakor reversed stratification and relatively intense turbulence
(Lorke et al. 2005). Conversely, during downslope flow lighterfluid can be preferentially advected over denser fluid (Fig. 1c),enhancing stratification, and inhibiting turbulence (Lorkeet al. 2005).
The simple pattern of shear-induced periodic stratifica-tion, outlined above, can be complicated by stepwise transi-tions from down- to up-slope flow associated with the arrivalof “internal bores” (Fig. 1d). These bores form as closelyspaced isotherms at the leading edge of a cold-water layerpropagate up the lakebed and pitch forward within the BBL,in a manner reminiscent of breaking surface waves. Theoreti-cal models predict that bore development might be particu-larly effective when the bed slope nearly equals the slope of
Fig. 1. (a–d) Cross-sections of the internal shoreline bottom boundary layer. Contour lines depict thermal stratification and associated chemical stratifica-tion during neutral flow (a), upslope flow (b), downslope flow (c), and in the presence of a thin internal bore (d). Near-bed stratification is reduced duringupslope flow (b) and intensifies during downslope flow (c) relative to the stratification during neutral flow (a). Dotted lines and grey arrows in panels a-dindicate stratification contours during neutral flow; vertical black arrows in panels b-d show shear induced stratification contours; diagonal black arrows inpanels b-d show direction of flow. Study site map (e) showing the locations of the internal shoreline tripod (~) and deep-water (•) sampling station, aswell as the profundal, littoral, and internal shoreline zones of Lacamas Lake. Black dot on insert map indicates the location of Lacamas Lake in WashingtonState.
Deemer et al. Chemical mixing in the bottom boundary layer
2
internal wave “characteristic curves” (i.e., the curves alongwhich wave energy propagates). However, near-equality ofbed and characteristic slopes is not essential to bore forma-tion. Instead, weakly nonlinear perturbation expansionsshow that bores may be widespread when isotherm tiltbecomes comparable to bed slope (Thorpe 1992, 1999).Observations confirm that bores are commonly observednear sloping beds in lakes (Thorpe and Lemmin 1999; Cossuand Wells 2014) and in a wide range of oceanic environ-ments (Winant 1974; Bluteau et al. 2011; Walter et al. 2014).Sufficiently near the bed, bore arrival and the associatedtransition to upslope flow is expected to reduce stratification,but the zone of reduced stratification can be very thin. Forbores that are thinner than the scale over which BBL stratifi-cation is measured, the transition to upslope flow is associ-ated with increased BBL stratification (Fig. 1d), in contrast tothe decreased stratification that would typically accompanyupslope flow (Fig. 1b).
Here, we focus on the interactions between water flows,stratification and vertical differences in chemical concentra-tions within the BBL. Vertical differences in BBL chemicalconcentrations are of particular interest owing to their poten-tial to shed light on chemical fluxes at the sediment waterinterface (Holtappels et al. 2011). For example, elevated near-bed N2 concentrations within the BBL may provide evidencefor sediment-based denitrification and associated N2 produc-tion. In the coastal ocean, BBL chemical gradients have beenattributed to biogeochemical fluxes, leading to quantitativeflux estimates (Holtappels et al. 2011; McGillis et al. 2011).For lakes, based on previous observations of strong shear-induced periodic temperature stratification, we hypothesizethat BBL chemical gradients induced by local biogeochemicalprocessing can be modified by physical advection. Specifically,sheared BBL velocities might generate larger vertical N2 con-centration differences during stratified downslope flow (Fig.1c), and smaller vertical N2 concentration differences duringless stratified upslope flow (Fig. 1b), with this trend possiblycomplicated by the arrival of thin internal bores (Fig. 1d).Identification of such advection-induced concentration differ-ences is required for proper interpretation of BBL chemicalconcentration differences; only after advective concentrationdifferences are removed can residual concentration differencesbe used to shed light on local biogeochemical processing.
The aim of this study was to identify the role of physicaladvection in the formation of vertical chemical differenceswithin the BBL. To do this, we measured the vertical offsetin temperature, velocity, and nitrogenous solute concentra-tions within the internal shoreline of a small eutrophic reser-voir over a 23-h wave cycle. Vertical differences in BBLchemistry induced by physical advection were estimatedusing measured BBL temperature differences and relation-ships between temperature and nitrogenous solutes observedat the deepest site within the reservoir. The relative impor-tance of advection was then quantified by comparing
measured chemical differences with the estimated advection-based vertical differences. We also estimated the residual dif-ference in nitrogenous solutes that could not be explainedby physical advection. It is this residual difference that haspotential to shed light on microbial N cycling. Patterns inthe formation and collapse of temperature and chemicalstratification within the BBL were placed into the context ofa longer 62-d deployment of velocity and temperature sen-sors at the same site that spanned the 23-h intensive sam-pling. This longer term dataset supported a bettercharacterization of internal wave dynamics within the BBLand, together with background O2 concentrations, an analy-sis of the physiochemical conditions under which residualnitrogenous chemical differences were observed.
Methods
Study siteLacamas Lake is a small (1.3 km2), long, narrow reservoir in
southwest Washington State (45.37N, 122.25W, Fig. 1e). Ithas an average depth of 7.8 m and a maximum depth of19.8 m. A dam was built in 1938, deepening the preexistinglake, and it is currently operated primarily for recreationalpurposes. Lacamas Lake experiences strong thermal stratifica-tion from early June to October, with a thermocline between4 m and 7 m depth. The reservoir is eutrophic and completehypolimnetic hypoxia is generally observed within weeks ofthe onset of stratification (Deemer et al. 2011). Velocities aredominated by a seiche-like, wind-driven internal wave with ahorizontal wavelength that exceeds the metalimnion lengthand a period of between 12 h and 24 h (Henderson andDeemer 2012). This internal wave propagates vertically carry-ing energy to the lakebed (Henderson and Deemer 2012), andcauses the depth of the thermocline to oscillate up to 2 m atthe internal shoreline. The southeast region of the internalshoreline (where the thermocline meets the lakebed) is broadand gradually sloped creating a relatively large internal shore-line region (Fig. 1e).
BBL chemical measurementsTo shed light on chemical mixing in the bottom boundary
layer, 74 pairs of N2 : Ar samples, 37 pairs of N2O samples, and9 pairs of grab samples for NO2
3 and NH14 were obtained
between 10:00 h PST 15 June 2012 and 09:00 h 16 June 2012.The N2 : Ar samples were collated into 11 sets, roughly one forevery 2 h of sampling, and N2O samples were collated into 10sets. Two narrow gauge silicon tubes (1/800 ID) were attachedto a large (1.5 m tall) aluminum tripod in 8.5 m water depth toobtain paired samples from elevations z 5 0.1 m and 0.4 mabove the bed, within the internal shoreline (Internal Shore-line Tripod Site, Fig. 1e). Samples were manually pulled upfrom depth at a rate of approximately 1 mL s21 using 60 mLBD luer lok syringes. Samples were used to flush and fill Labcoexetainers (for N2 : Ar analysis), small aluminum crimp-topwheaton vials (for N2O analysis), or were filtered into 30 mL
Deemer et al. Chemical mixing in the bottom boundary layer
3
plastic HDPE Nalgene bottles (for nutrient analysis). To esti-mate vertical concentration differences, paired samples atz 5 0.1 m and 0.4 m, collected within 5 min of each other,were differenced to obtain between 3 and 9 concentration dif-ference estimates for each measurement set. Samples thatfailed to meet QA/QC criteria (see below section on MIMS) orthat contained bubbles were omitted from the analysis.
Physical measurementsPhysical measurements were collected from a single site
within the internal shoreline (Internal Shoreline Tripod Site;Fig. 1e) between 18 May 2012 and 18 July 2012. Boundarylayer water velocity profiles were measured using a 2 MHz Nor-tek Aquadopp Acoustic Doppler Profiler (ADP) mounted onthe large tripod described above. The ADP was mounted at ele-vation z ! 1.3 m above the bed, and pointed downward tomeasure velocity every 0.015 m from z 5 0.135 m to z 5 1.14 m.At z<0.135 m, velocities may have been contaminated byacoustic sidelobe reflections from the bed, and were discarded.The ADP operated in pulse-coherent mode (Lohrmann et al.1990), recording one 1-s burst of two 2-Hz measurements every12 s throughout the 62 d deployment. Water column tempera-tures were measured using four RBR loggers attached to themain lander at z 5 0.2 m and 0.4 m (fast-response RBR TR-1060s, logging every 2 s), and at z 5 0.9 m and 1.3 m (RBR XR-420 CTs, logging every 10 s). Owing to the small depth range,adiabatic temperature corrections did not significantly affectestimates of density stratification, and were neglected.
The 62 d of ADP and temperature data were divided intohourly segments. ADP measurements associated with acous-tic correlations<90% were discarded (Rusello 2009). Hourlymeans were used for all results presented below, except thoseshown in Fig. 5. Standard coordinate transformations, andmeasured instrument heading, pitch, and roll, were used toconvert hourly mean ADP along-beam velocities into east-ward, northward, and upward coordinates. The “along-lake”coordinate, 126 8 clockwise from North (dashed line, Fig. 1e),was chosen as the principle axis of the covariance matrixbetween hourly averaged ADP eastward and northwardvelocities measured 0.3 m above the bed.
Water column chemistryN2 : Ar, N2O, NO2
3 , and NH14 samples were collected with
a Van Dorn sampler from the deepest part of the reservoir(Deep-Water Site; Fig. 1e) on five dates between 30 May2012 and 26 July 2012 at 0.1, 1, 2, 4, 5.5, 7, 9, 11, 13, and15 m depth as well as 0.2 m off the lakebed. Either a HachDS5X Sonde or an In Situ Troll 9500 was used to measuretemperature and dissolved oxygen at each sampling depth.
To characterize O2 dynamics within the internal shore-line, an In Situ Troll 9500 equipped with a temperatureprobe and optical dissolved oxygen sensor was deployedwithin 10 m of the large tripod (Internal Shoreline TripodSite; Fig. 1e) on two separate occasions during the spring of2012. The Troll 9500 was attached to a second, smaller
(0.5 m 3 0.5 m) aluminum lander 0.1 m above the lakebedand logged at 15 min intervals during the first deploymentand at 2 min intervals during the second deployment. Thefirst Troll 9500 deployment occurred from 16 May 2012 at16:00 h to 30 May 2012 at 13:30 h. The second deploymentcoincided with the 24-h sampling described above and lastedfrom 11:15 h on 15 June 2012 to 10:00 h on 16 June 2012.
Laboratory analysisFor analysis of NO2
3 and NH14 , filtered (Whatman GF/F
0.45 lm) water samples were collected in acid-washed 30 mLplastic HDPE Nalgene bottles and stored frozen until analysison a Westco discrete nutrient analyzer using standard EPA-approved colorimetric methods (method number 353.2 forNO2
3 and 4500-NH3-G for NH14 , National Environmental
Methods Index, www.nemi.gov). The detection limits were0.4 lmol L21 for NO2
3 and 0.6 lmol L21 for NH14 .
Water column N2O samples were collected in 72 mL crimp-top Wheaton vials, treated with saturated ZnCl2 to stop micro-bial activity, and analyzed using a gas equilibration techniqueas in Harrison and Matson (2003). Briefly, samples werebrought to 25 8C, and 20 mL of ultrahigh purity helium head-space was introduced to Wheaton vials. Following headspaceintroduction, vials equilibrated for at least 24 h before head-space gas was analyzed using a Hewlett Packard 5890 Series IIPlus gas chromatograph equipped with an electron capturedetector (ECD). The ECD contained 63Ni as the isotope source,and a mixture of argon and methane was used as the carriergas as in Harrison and Matson (2003). Every six samples,0.1 ppm and 5 ppm N2O standards were run. Coefficient ofdetermination (R2) values for calibration curves were neverlower than 0.98 using repeated measurements of N2O at eachstandard concentration, and the mean percent coefficient ofvariation of standards (defined as 100 3 SD/Mean where SD isthe standard deviation of standard concentration readingsfrom a single run, and Mean is the mean standard concentra-tion reading from a single run) was 8.7%. Headspace N2O con-centrations were converted to original dissolved gasconcentrations using the appropriate solubility tables (Weissand Price 1980). Expected N2O concentrations were then cal-culated based on the sample collection temperature and estab-lished temperature solubility rules (Weiss and Price 1980).N2O in excess of saturation is reported as “excess” N2O and isconsidered the result of microbial activity.
N2 : Ar and O2 : Ar samples were collected in duplicate12 mL Labco exetainers, treated with ZnCl2, and refrigeratedunder water prior to analysis for N2 : Ar ratios on a MembraneInlet Mass Spectrometer (MIMS) as in Kana et al. (1994). Sam-ples were run within 98 d of collection and there was nodetectable effect of the time elapsed between sample collectionand analysis on measured N2 (p>>0.05 for a regression of timevs. N2 : Ar). Laboratory procedures and calculations of excessN2 are described in Deemer et al. (2011). Briefly, five readingswere taken from each sample vial to record the ratio of atomic
Deemer et al. Chemical mixing in the bottom boundary layer
mass (AM) 28 and 40 signals. Percent coefficient of variationfor replicate readings from the same sample had to be<0.05%for the instrument to be considered stable. Three temperaturestandards verified linearity of the raw signals of N2, Ar, and N2
: Ar across the range of [N2], [Ar], and N2 : Ar measured in thisstudy. Deionized water (air-equilibrated at 24–25 8C) was thenrun as a standard every six samples, and repeat standards wereused to correct for instrument drift. The mean percent coeffi-cient of variation between replicate standard readings was0.025% (SD 0.012). The expected N2 : Ar ratio of each samplewas calculated based on the sample collection temperatureand solubility tables developed by Weiss (1970). Theseexpected ratios were compared to measured drift-corrected N2 :Ar ratios under the assumption that [Ar] varied only due tophysical factors (e.g., temperature), while [N2] varied due toboth physical and biological factors. Total N2 concentrationswere then quantified for all the samples collected as:
Total N25N2 : Armeasured
N2 : Arexpected"N2 expected (1)
where N2 : Armeasured is the drift corrected N2 : Ar ratio, andN2 : Arexpected and N2 expected are the atmospheric-equilibration-based N2 : Ar ratio and [N2], respectively, which are quantifiedbased on the temperature specific solubility of N2 and Ar.Patterns in deep water excess [N2] and [N2O] were also quanti-fied to consider spatial patterns within the water column. N2 inexcess of the expected N2 : Ar ratio is reported as excess and isconsidered a product of denitrification as in Deemer et al.(2011). N2O in excess of temperature-dependent saturationwith the atmosphere is also defined as excess and is considereda product of either nitrification or denitrification as in Deemeret al. (2011).
For both N2 and N2O sampling, care was taken to avoidgas bubble entrainment, which interferes with sample analy-sis. For N2O samples, four samples from 11 July and onesample from 26 July had to be discarded due to impropersealing or bubble formation. For N2 : Ar samples, at least oneof two replicate samples at each sampling point remained airbubble-free for all profile samples collected.
Modeling of advection-based concentration differencesDuring summer, N2 and N2O accumulate in the hypolimn-
ion of Lacamas Lake, resulting in [N2] and [N2O] that are neg-atively correlated with temperature at depths intersecting theinternal shoreline (Deemer et al. 2011; and Fig. 7 herein). Ifthese relationships hold in the internal shoreline, thenvertical differences in shoreline N2 and N2O concentrationsmay simply reflect lakewide gradients, modified by localphysical advection and mixing, with no need to invoke localN2 or N2O production. We used temperature as a tracer toinvestigate the role of physical advection and mixing ofbackground stratification in controlling vertical concentra-tion differences in nitrogenous solutes. We modeled expectedadvection-based concentrations and resultant differences
using relationships between temperature and solute concen-tration measured in the deep lake. We first determined rela-tionships between temperature and concentration outsidethe boundary layer:
Cfit5aT1b (2)
where a and b were chosen by linear regression between chemi-cal concentrations and temperatures measured at the deepwater site, at 5.5 m, 7 m, 9 m, and 11 m depth, on 19 June.Chemical concentrations at z 5 0.1 m and 0.4 m within theBBL, denoted C1fit and C2fit, were then predicted using Eq. 2and BBL temperatures measured at z 5 0.1 m and 0.4 m. Nowthe difference between the observed BBL concentration differ-ences and the difference expected given observed stratification:
is the component of the boundary layer concentration differ-ence that can not be explained by lakewide advection, andmight result from local microbial processing. We refer to thisas the residual concentration difference.
Statistical and error analysisWe performed several sensitivity analyses to determine
how individual measurement errors may affect our ability toestimate vertical differences in chemical concentrations. Tem-perature logger error may affect N2 and N2O concentrationdifference calculations because the N2 : Ar and N2O calcula-tions are temperature dependent. Reported accuracy of RBRtemperature loggers is 6 0.002 8C with a drift of less than0.002 8C yr21. To estimate the potential effect of temperaturelogger-related error, we quantified the average artificial N2 andN2O concentration difference that would result from an artifi-cial temperature gradient of 0.008 8C. In addition, the instru-ment noise floor for both the MIMS and the GC maynoticeably affect the precision of the chemical concentrationdifference estimates. We quantified the perceived concentra-tion difference that would result from overestimating the con-centration at 0.1 m and underestimating the concentration at0.4 m based on the mean instrument coefficient of variation.MIMS measurements of O2 : Ar were not used in this analysisbecause of high variation in replicate samples from single VanDorn casts (average of 10% coefficient of variation).
The silicon tubing we used to collect BBL nitrogenous gassamples is somewhat gas-permeable. We used Fick’s Law toestimate the exchange between the water column and thetube samples. This exchange, referred to as the diffusive flux,J, has units of mol m22 s21 and was quantified as
J52D@/@x
(4)
where D is the diffusion coefficient in m2 s21, @/ is the concen-tration difference in mol m23, and @x 5 0.00158 m is the thick-ness of the tubing. The diffusion coefficient was estimated
Deemer et al. Chemical mixing in the bottom boundary layer
5
using published values for N2 and N2O in silicone rubber(Robb 1968). @/ was estimated as the difference between thesurface water concentration of N2 and N2O and the concentra-tion measured at 7 m and 9 m. Concentration estimates weretaken from the deep water profiles collected on 8 June and 19June. The change in gas concentration within each sample dueto tube permeability, Dg, was then estimated as
Dg5J " SA " T
V(5)
where SA is the surface area of the entire inner-layer of thetube in m2 (0.135), T is the time the sample took to travelthrough the tube in s (64), and V is the volume of waterheld by the tube in L (0.107).
A laboratory test was conducted to confirm the N2 perme-ability of our sample tubing. 15.5 m of silicon tubing (identi-cal to the tubing used for field sampling) was immersed in abucket of deionized water and held at 10 8C overnight. Sev-eral liters of additional deionized water were set on a stirplate and allowed to equilibrate at ambient room tempera-ture overnight. The next day, triplicate samples of deionizedwater were collected from both temperature treatments byoverflushing Labco exetainers. The silicon tubing was thenused to collect triplicate samples of room temperature waterthat was drawn through 15 m of tubing immersed in the10 8C bucket. We also timed the rate at which samples weredrawn (to quantify T in Eq. 5 above). All samples were runfor N2 : Ar using MIMS and the observed change in N2 con-centration (D) of room temperature samples that were passedthrough 10 8C water was used to calculate J and solve for D.
For our statistical analysis, we treat successive concentra-tion difference measurements as uncorrelated, an assumptionsupported by direct estimation of equivalent degrees of free-dom from sample autocorrelation functions (Garrett and Pet-rie 1981). One-sample, two-tailed t-tests were used to assesswhether measured and residual N2O concentration differen-ces were significantly different from zero. One-sample, one-tailed t-tests were used to assess whether measured and resid-ual N2 concentration differences during individual measure-ment periods were significantly larger than zero. One-tailed t-tests are appropriate for this analysis (unlike in many otherecological analyses, Lombardi and Hurlburt 2009), becausewe are concerned with identifying positive (bed-elevated)concentration differences, which are consistent with N2 pro-duction. We did not interpret negative concentration differ-ences any differently from statistically insignificant positiveconcentration differences (Ruxton and Neuh!auser 2010). Thisfollows from a fundamental assumption (that is consistentwith our observations), that N2 fixation is not an importantprocesses at 8.5 m water depth (Deemer et al. 2011).
Linear relationships between temperature and both N2
and N2O were fitted using least squares regression. For allthe parametric tests described above, data were first tested toensure they met assumptions of equal variance and normal
distribution. All statistical tests were performed using R ver-sion 3.1.1 and alpha was set at 0.05.
Based on the lack of measureable autocorrelation, we esti-mated the standard deviation of the 23-h sample-meanchemical concentration difference, denoted std(G), as
std#G$5
!!!!!!!!!!!!!!!!!!XN
j51r2
j
N
vuut(6)
where N 5 number of measurement periods, and rj is thestandard error of concentration differences determined frompaired measurements within period j. Since mean chemicalconcentration differences were calculated from a large num-ber of observations (74 for N2 and 37 for N2O), significancecan be determined using a Z test for the ratio between theestimated mean concentration difference and std#G$.
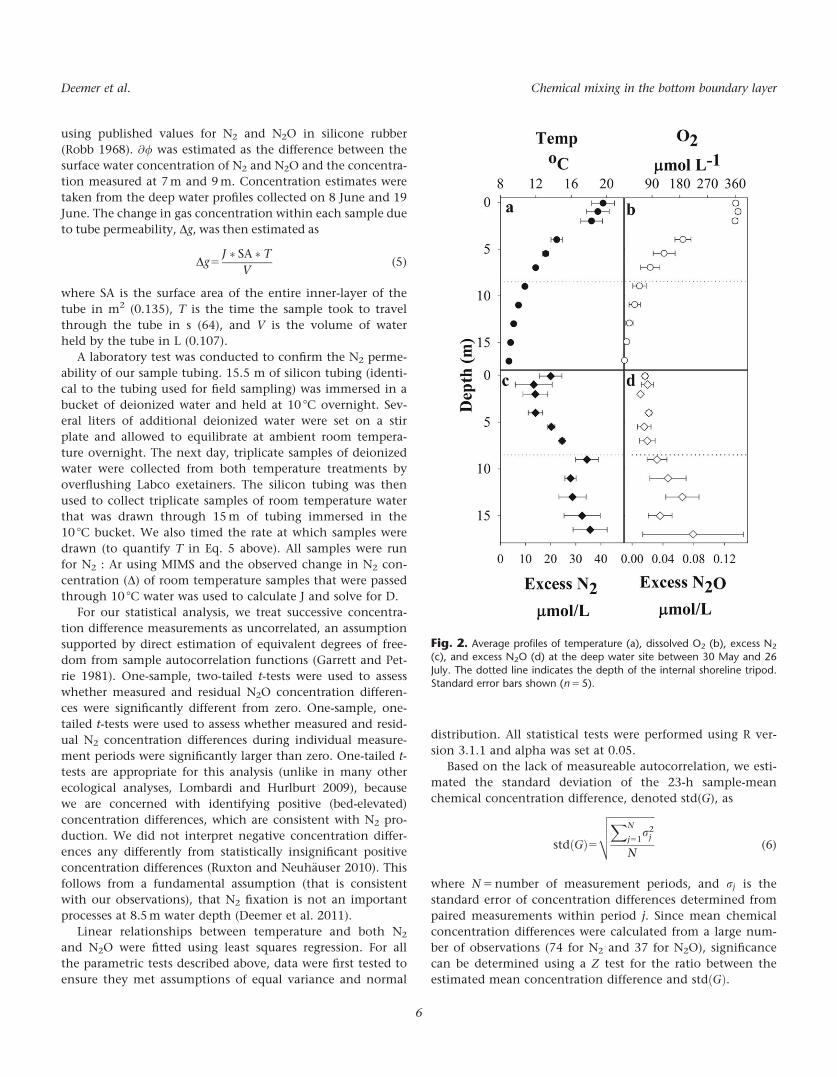
Fig. 2. Average profiles of temperature (a), dissolved O2 (b), excess N2
(c), and excess N2O (d) at the deep water site between 30 May and 26July. The dotted line indicates the depth of the internal shoreline tripod.Standard error bars shown (n 5 5).
Deemer et al. Chemical mixing in the bottom boundary layer
6
Results
Deep water profiles in Lacamas Lake showed strong thermaland chemical stratification (Fig. 2). Strong fluctuations inboth physical and chemical parameters were observed at theinternal shoreline of Lacamas Lake (Fig. 3). Temperature fluc-tuations exceeding 2 8C and O2 fluctuations exceeding 60lmol L21 were routinely observed over single wave periods.These fluctuations, together with fluctuations in near-bedstratification (Fig. 4) were largely synchronized with alonglake velocity. During the 23-h sampling period, significantBBL chemical concentration differences were mainly observedduring the first half of the sampling event and followed thearrival of a thin internal bore (Figs. 5, 6). Collapse of chemicalconcentration differences coincided with collapse of tempera-ture stratification (Fig. 6). Vertical differences in nitrogenousgas concentrations were largely explained by fluctuations inBBL temperature stratification, but significant residual
Fig. 3. Temperature measured at z 5 0.2, 0.4, 0.9, and 1.3 m from darkest line to lightest line, respectively (a), dissolved oxygen measured atz 5 0.1 m (b), hourly mean along and across lake velocities (along lake velocity in black and across lake velocity in gray, (c), temperature differencebetween z 5 0.4 m and z 5 0.1 m (d), and gradient Richardson numbers (e) within the bottom boundary layer between 20 May 2012 and 27 May2012. Gray bars represent the period from sunset to sunrise. Positive velocity values indicate upslope flow for along-lake velocities and flow towardthe northeast for across-lake velocities. Unstable stratification events are marked by stars in panel (e), and associated gradient Richardson numbers arenot plotted due to log scale.
Fig. 4. Stratification (temperature 0.4 m above bed minus temperature0.1 m above bed) vs. upslope water velocity. Each data point is a 1 haverage, all 1430 h of good data shown.
Deemer et al. Chemical mixing in the bottom boundary layer
7
concentration differences were also detected. The largest resid-ual N2 difference coincided with the lowest BBL O2 concentra-tions, whereas the largest residual N2O differences coincidedwith low-to-intermediate O2 concentrations.
Lakewide physiochemical environmentLacamas Lake was thermally stratified for the duration of
this study and the internal shoreline tripod was locatedbelow the metalimnion (Fig. 2a,b). Surface waters wereapproximately 10 8C warmer than bottom waters (average of19.59 8C and 8.98 8C, respectively) and oxygen conditionsranged from supersaturation in the surface water to anoxicconditions in the bottom water (average of 132% and 0.2%O2, respectively). Excess N2 and N2O were elevated in bot-tom waters relative to surface waters (Fig. 2c,d) and a peak inexcess [N2] was observed at 9 m depth, close to the depth ofthe internal shoreline tripod (Fig. 2c).
At the internal shoreline, hourly water temperature, veloc-ity, and O2 concentration fluctuated quasi-periodically, withdominant periods about 12–24 h (Fig. 3a–c). ADP-measuredalong-lake water velocities (u) dominated over across-lakevelocities (v) (Fig. 3c). Throughout the 62 d deployment, root-mean-square along- and across-lake velocities were 0.024 ms21
and 0.005 ms21, respectively (unless specified otherwise, veloc-ities presented were measured at z 5 0.3 m). Temperature anddissolved oxygen fluctuations were not synchronized withperiods of sunlight or darkness (white and gray regions, Fig.
3a,b), but instead followed velocity fluctuations (compare Fig.3a,c). These velocity fluctuations are caused by a lakewideinternal wave, likely forced by daily wind fluctuations associ-ated with the nearby Columbia River Gorge (Henderson andDeemer 2012). Coherence of 70% between internal shorelinemeasurements and thermistor measurements made at theother end of the lake confirm the role of lake wide internalwaves in dominating these fluctuations (Henderson unpubl.).
Internal shoreline fluctuations in temperature and ther-mal stratification were qualitatively consistent with advec-tion and tilting of isotherms by sheared up- and down-slopeflows (Fig. 1a–c). Downslope flows were generally associatedwith increasing temperature and oxygen content, whereaspulses of upslope flows were associated with rapid drops intemperature and dissolved oxygen (compare Fig. 3c with
Fig. 5. Arrival of a thin bore. Panel a: Temperature measured 0.1, 0.4,and 0.9 m above the bed (respectively thin black, thick gray, and dashedlines). Panel b: acoustic backscatter b, with trends resulting from beamspreading and attenuation removed. Panel c: upslope water velocity.Horizontal dashed lines in panels b and c indicate elevations of tempera-ture gauges. The arrival of the thin bore (marked by sudden near-bedtemperature drop, panel a), was followed by elevated near-bed back-scatter (labeled 1 in panel b), and slow upslope water velocity within0.2 m of the lakebed (labeled 2 in panel c).
Fig. 6. Along-lake velocity (positive values indicate upslope flow, (a),temperature (b), dissolved oxygen concentrations at z 5 0.1 m (c), meanNO2
centration differences (e), and N2O concentrations differences (f) withinthe BBL over a 23 h wave period. In (e) and (f), hollow diamonds showtotal measured concentration differences whereas black triangles showthe advection-based concentration differences based on temperaturemodeling. Black stars indicate measured concentration differences thatwere statistically different from zero (one sample t-test, p<0.05). Graycircles show significant residual concentration differences (where meas-ured and modeled vertical concentration difference were significantly dif-ferent by t-test, p<0.05). Gray dashed line demarcates the collapse inBBL thermal stratification. Five subintervals are also specified at the top ofthe figure: (1) arrival of thin bore, (2) sheared upslope flow, (3) smallshear and no trend in stratification, (4) strongly sheared upslope flow,and (5) downslope flow. 95% confidence intervals shown.
Deemer et al. Chemical mixing in the bottom boundary layer
8
3a,b). Flows were typically slower nearer to the bed, resultingin more stratified conditions during downslope flow and lessstratified conditions during upslope flow (Fig. 4), consistentwith our conceptual model (Fig. 1b,c). Cases of measureableunstable stratification were rare (19 of 1430 h), but alloccurred during upslope flow (Fig. 3d). Unstable stratifica-tion events were always small (see negative temperature dif-ferences in Fig. 4). Although trends were consistent with theconceptual model of Fig. 1a–c, scatter about these trends wassubstantial (Fig. 4). More complex relationships betweenvelocity and stratification were examined, but did not reducescatter (approaches tested included allowing for a time-lagged response of stratification to velocity, and relatingstratification to the shear, or to time-integrated shear).
Internal bores can explain some of the observed scatter inthe relationship between velocity and stratification. Eachinternal bore was characterized by a sudden drop in near-bedtemperature, a simultaneous change in near-bed acousticbackscatter intensity, a stepwise transition to upslope near-bed flow, and a pulse of flow away from the bed. During theentire 62 day study period, we observed 13 distinct boreswith heights between 0.4 m and 0.9 m, all associated withtemperature drops of more than a degree in less than 30 sand rapid transitions to upslope flows (on the order of a fewcm s21) at z 5 0.1 m and 0.4 m. Two cases of bores withheights exceeding 0.9 m were observed, identified by transi-tion to upslope flow throughout the bore and nearly simul-taneous stepwise temperature drops at z 5 0.1 m, 0.4 m, and0.9 m. Five additional cases were observed where stepwisetemperature drops at z 5 0.1 m were not followed by stepwisedrops at z 5 0.4 m. These cases were interpreted as bores withheights<0.4 m. A particularly thin and weakly developedbore arrived during the 23-h chemical sampling event at11:15 h on 16 June, when a near-bed temperature drop of1.4 8C (Fig. 5a) was followed by elevated near-bed backscatter(labeled 1 in Fig. 5b), and slow upslope water velocity within0.2 m of the lakebed (labeled 2 in Fig. 5c). A pulse of upwardvelocity was observed immediately following the arrival ofthe bore (not shown), indicating that warmer water waspushed up over the advancing thin, cold layer (time integra-tion of the velocity pulse yielded an upward displacement ofabout 0.3 m).
An important measure of the ability of stratification toinhibit vertical turbulent mixing is the dimensionless gradi-ent Richardson number
Ri5g#q22q1$#z22z1$
q1%#u22u1$21#v22v1$2&(7)
Here q is the hourly mean water density, calculated fromtemperature, and subscripts 1 and 2 indicate variables meas-ured at elevations z150:2 m and z250:4 m. Owing to strongnear-bed stratification, the gradient Richardson number oftenexceeded 0.25 (Fig. 3d). Such high Richardson numbers
indicate that stratification was often sufficiently strong toinhibit BBL turbulence and mixing (Monin and Yaglom,1975). In contrast, the few unstable stratification eventsmentioned above were associated with small Richardsonnumbers.
Physiochemical dynamics during 23-h sampling eventThe period of intensive chemical sampling captured
approximately one complete wave cycle, with two punctu-ated periods of upslope flow during the first half of the wavecycle, followed by a prolonged period of downslope flowduring the second half (Fig. 6a). We distinguish five subin-tervals during the period of intensive sampling (Fig. 6).Development of stratification during subinterval 1 was domi-nated by the arrival of a thin near-bed bore (shown in detailin Fig. 5, and described above). During subinterval 2, shearedupslope flow was associated with weakening stratification, asexpected (as in conceptual diagram, Fig. 1b). During subin-terval 3, shear was small (black and gray lines in Fig. 6 a layon top of each other) and there was no clear trend in stratifi-cation. During subinterval 4, strongly sheared upslope flowdeveloped, and as expected (Fig. 1b) stratification wasreduced and eventually eliminated. During the final interval,interval 5, downslope flow developed, together with steadilyincreasing stratification as expected (as in conceptual dia-gram, Fig. 1c).
Clear near-bed temperature stratification was observedduring most of the period of intensive chemical sampling(temperature averaged 0.27 8C warmer at 0.4 m off the bedthan at 0.1 m off the bed), with the exception of 18:00 h–19:00 h, when water became essentially unstratified (Fig. 6b).The collapse in thermal stratification coincided with strongupslope flow (Fig. 6a) and the arrival of colder, oxygen-depleted water (Fig. 6c). Along-lake velocities were particu-larly strongly sheared during this time (compare black andgray lines of Fig. 6a), likely promoting the loss ofstratification.
Vertical differences in chemistry during the 23-hsampling event
Variable but significant near-bed concentration differen-ces in N2 and N2O were observed in the internal shorelinewith the passing of the internal wave (Fig. 6e,f). In the caseof N2, the largest concentration differences occurred afterthe arrival of the thin bore and prior to the collapse in ther-mal stratification (compare Fig. 6b,e). In 55 of 74 samplepairs, N2 concentrations 0.1 m above the bed exceeded con-centrations 0.4 m above the bed, and all three significantlynonzero measurement sets had positive (i.e., bed-elevated)differences (one sample t-test with p<0.05, Fig. 6e). N2 aver-aged 11.4 lmol N2 L21 higher at 0.1 m off the bed than at0.4 m off the bed (Std(G) 5 2.8 lmol N2 L21, Z-score 5 4.1).For 32 of 37 sample pairs, N2O concentrations were elevatednear the bed, and there were three sets of significantly bed-elevated concentrations (one sample t-test with p<0.05, Fig.
Deemer et al. Chemical mixing in the bottom boundary layer
9
6f). N2O averaged 0.08 lmol N2O L21 higher at 0.1 m off thebed than at 0.4 m off the bed (Std(G) 5 0.004 lmol N2O L21,Z-score 5 1.93). All the significant concentration differenceswere observed following the arrival of the thin bore andprior to the collapse in stratification with the exception ofone N2O set at 2:50 h on 16 June.
lmol L21 (SE 6 0.01 lmol L21, n 5 18, Fig. 6d) and meanNO2
3 concentration differences were below the instrumentdetection limit. NH1
4 averaged 10.2 lmol L21 (Fig. 6d, SE.1.0 lmol L21, n 5 18), and the mean concentration differ-ence was 22.5 lmol NH1
4 (SE 1.4 lmol NH14 , n 5 9) with
reduced near-bed concentrations of NH14 (C1-C2<0) for
seven out of nine grab samples.
Sampling errorAssuming a maximum temperature logger-related temper-
ature gradient error of 0.008 8C, the average resulting artifi-cial N2 and N2O concentration differences are 6 0.1 lmol N2
L21 (or 2% of the mean concentration difference observed inthis study) and undetectable, respectively. Variation inrepeat sample measurements was quite high: 0.90% coeffi-cient of variation for duplicate N2 samples as comparedto'0.3% in other studies (Kana et al. 1994; Deemer et al.2011) and 3.3% for duplicate N2O samples, which may havelimited the ability to detect both N2 and N2O concentrationdifferences. For example, in the case where 0.1 m samplesare overestimated and 0.4 m samples are underestimated,artificial concentration differences of 6.0 lmol N2 L21 and0.02 lmol N2O L21 could result. Finally, in addition to highcoefficients of variation, discarded O2 : Ar samples collectedvia tube-based sampling had approximately 40% higher cal-culated O2 concentrations than those measured via thenearby optical probe. Permeability calculations, based onFick’s law, published values for the diffusion rates of gases insilicone rubber, and a direct test of diffusion rates in oursampling system suggest that at most 5.8 lmol N2 L21 and0.001 lmol N2O L21 could be lost from the samples duringcollection. Slightly more gas was likely lost from the 0.1 mtube (due to longer travel time and higher N2 concentra-tions), such that diffusional loss would weaken observedconcentration differences relative to actual field values.Hence, while sampling and analysis-associated uncertaintyreduces the accuracy and precision of our analysis, errorsgenerally would weaken observed concentration differences,but do not alter our fundamental insights and conclusions.
Deep water profiles and modeling of lateral advectionacross the internal shoreline
During the 23-h sampling event, temperatures and O2
concentrations observed within the internal shoreline corre-sponded to a layer of water, approximately 4.5 m thick inthe vertical direction, that was advected across the instru-ment deployment location. Based on the 8 June and 19 Junedeep-water profiles, internal shoreline temperatures and O2
concentrations match those recorded between approximately6.5 m and 11 m (Fig. 7a). Deep-water profiles also revealedfactor of two differences in excess N2, excess N2O, and NH1
4 ,but no large differences in the concentrations of NO2
3 acrossthis range of depths.
After correcting internal shoreline N2 and N2O concentra-tions to reflect the permeability calculations (as describedabove), average concentrations of excess N2 between 7 mand 9 m at the deep water site (24.6 lmol excess N2 L21, SD1.9, Fig. 7b) were significantly higher than within the inter-nal shoreline (19.0 lmol N2 L21, SD 9.3). Internal shorelineconcentrations of excess N2O (0.6 lmol N2O L21, SD 0.03)
Fig. 7. Mean temperature plotted against mean O2 (a), N2 (b), andN2O (c) at 11 depths from the deep water site on 8 June 2012 and 19June 2012 (black circles), and from the 23-h sampling event (white andgray circles). Internal shoreline O2 concentration measurements weremade by an optical O2 probe at z 5 0.1 m (white circle in panel a). Inter-nal shoreline N2 and N2O concentration measurements were made viatube sampling at 0.1m (white circles in panels b and c) and 0.4m (graycircles in panels b and c). Error bars represent 1 standard deviation fromthe mean.
Deemer et al. Chemical mixing in the bottom boundary layer
10
were not significantly different from concentrations between7 m and 9 m at the deep water site (0.04 excess lmol N2OL21, SD 0.02, n 5 4, Fig. 7c). This translates to higherobserved N2O : N2 ratios in the internal shoreline (0.0029)than at the deep water site (0.0016).
Temperature was strongly related to both N2 and N2Oconcentrations at the deep water site, allowing for straight-forward modeling of BBL concentration differences resultingfrom hypolimnion-wide N2 and N2O accumulation (R2>0.9,Table 1). Such “advection based” concentration differencesin N2O and N2 were larger than residual concentration dif-ferences. Averaged over the 23-h sampling period, residualconcentration differences in both N2 and N2O were not sig-nificantly different from zero. Residual N2O averaged 0.005lmol N2O L21 higher at 0.1 m off the bed than at 0.4 m offthe bed (Std(residual G) 5 0.007, Z-score 5 0.64) and 27 outof 37 residual N2O concentration differences were greaterthan 0. Residual N2-N was an average of 1.4 lmol N2 L21
higher at 0.1 m off the bed than at 0.4 m off the bed (Std(re-sidual G) 5 2.8, Z-score 5 0.49), and 38 out of 74 residual N2
concentration differences were bed-elevated. Error in residualconcentration difference estimates may have resulted fromuncertainty in the slope of the temperature vs. nitrogenousconcentration regression lines that were used to modeladvection-based concentration differences. We calculated thestandard error for this regression slope and propagated thiserror through Eq. 3. The resulting mean error was about 8%of the mean residual N2 concentration difference ( 6 0.1lmol N2 L21) and 33% of the mean residual N2O concentra-tion difference ( 6 0.002 lmol N2O L21). Detectable, statisti-cally significant residual concentration differences in bothsolutes were observed after the arrival of the thin internalbore and before the collapse in BBL stratification. For N2 adetectable residual concentration difference of 4.2 lmol N2
L21 was observed on 15 June at 14:10 h (one sample t-test,p<0.5, Fig. 6e). For N2O detectable residual concentrationdifferences of 0.019 lmol N2O L21 and 0.015 lmol N2O L21
were observed on 15 Jun at 12:40 h and 17:30 h, respectively
concentration differences corresponded to the time of lowestO2 concentrations within the BBL. Significant residual N2Oconcentration differences occurred both before and after thelow O2 period and corresponded to times of mid-range ambi-ent O2 within the BBL.
Discussion
Internal waves as drivers of boundary layer mixingWe report internal wave-induced fluctuations in both
temperature and O2 within the BBL of Lacamas’ internalshoreline. Downslope flow was associated with slow pro-longed increases in water temperature and oxygen whereassudden decreases in temperature and oxygen often occurredduring upslope flow (Fig. 3). These punctuated declines inBBL temperature and oxygen during upslope flow resultedfrom the arrival of internal bores. Some bores were particu-larly thin, extending<0.4 m above the bed. For such bores,warmer more oxygenated water is maintained in the upperlayers of the BBL resulting in the co-occurrence of strongstratification and upslope flow (Fig. 1d). This contrasts withthe weak stratification during upslope flow that is expected(Fig. 1a) and often observed in Lacamas (Fig. 4) and otherlakes (Lorke et al. 2005). Measurements of mixing are notpresented here, but mixing may be enhanced by bores (Blu-teau et al. 2011; Martini et al. 2013; Cossu and Wells 2014),or by the proximity of intense stratification to the bed,where turbulence is often relatively intense.
Temperature-based modelingThe temperature-based modeling presented here identifies
advection and mixing of lakewide stratification as a domi-nant driver of vertical differences in chemistry within theinternal shoreline BBL. Thus, vertical differences in BBLchemistry were most intense when a thin bore enhancedBBL thermal stratification, whereas vertical differences inBBL chemistry collapsed when strongly sheared upslope floweliminated thermal stratification (Fig. 6).
Despite the dominance of advection-induced concentra-tion differences, the temperature-based modeling also cap-tured potential hot moments for locally derivedconcentration differences during discrete portions of thewave cycle. Residual N2 and N2O concentration differenceswere detectable following the arrival of the thin bore andprior to the collapse in BBL stratification (Fig. 6). Potentialsources of the residual concentration differences include: (1)instantaneous production within the near-bed sediments, (2)in sediment convection, and (3) advection not representedby the temperature-based model used here.
Instantaneous production in near-bed sediments is con-sistent with the observed fluctuations in O2 concentrationsduring the wave cycle. Correspondence between high bio-logical N2 concentration differences and low BBL O2 con-centrations is expected if gradients resulted from microbial
Table 1. Least squares linear regression R2 and p values fortemperature-based modeling of dissolved solute concentrationsbetween 5.5 m and 13 m at the deep water site on 19 June. Alldata met assumptions for equal variance and normal distribu-tion. Regressions significant at a 5 0.05 are bolded
SoluteSign ofcorrelation R2 p
Mean % errorof modeledadvection-
based gradient
N2 (lmol L21) 2 1 <0.001 2.3%
N2O (lmol L21) 2 0.91 0.013 18.6%
NH14 (lmol L21) 1 .006 0.903 N.A.
NO23 (lmol L21) 2 0.246 0.395 N.A.
Deemer et al. Chemical mixing in the bottom boundary layer
11
denitrification (compare Fig. 6c,e). In addition, significantbiological N2O concentration differences occurred when O2
concentrations were in the middle of the observed range(between 60 lmol O2 L21 and 95 lmol O2 L21). Althoughno N2O samples were collected when O2 concentrationswere at their lowest, rapid microbial N2O production underintermediate O2 concentrations is consistent with thebiochemistry of N2O-producing microbes. Inefficient nitrifi-cation and denitrification are thought to occur at 60–95lmol O2 L21 because this represents the minimum oxygenthreshold for nitrification and the maximum oxygenthreshold for denitrification. N2O is a free intermediate inthe denitrification pathway, and its reduction represents thefinal and least energy-efficient step of the process such that,at high O2 concentrations, N2O reduction may be inhibited.Alternatively, nitrification can result in the production ofN2O via the oxidation of the intermediate hydroxylamineor via the nitrifier-denitrifer pathway where organisms thatoxidize ammonium to nitrate may also carry out the reduc-tion of nitrate to N2O or N2 (Wrage et al. 2001; Stein andYung 2003). One study of ammonium-oxidizing bacteria(Nitrosomonas sp.) found that these organisms can produceup to 10% N2O under low oxygen conditions (Goreau et al.1980). High BBL NO2
3 concentrations (microbial popula-tions favor the reduction of NO2
3 over N2O) are also con-sistent with active, sediment-based N2 and N2O production(Fig. 6d).
In-sediment convection may also explain the residualconcentration differences that formed following the arrivalof the thin bore. Seiche-related pore water convection mayoccur when dense, cold water washes over warmer sedi-ments and forces warmer pore water into the water col-umn. Convection has potential to dramatically increaseexchange of chemicals between sediments and the BBL(Kirillin et al. 2009). In our study, significant N2 concen-tration differences immediately follow the arrival of coldwater via upslope flow. While estimates of the timescaleover which in-sediment convection is likely to occur arebeyond the scope of our study, it is possible that convec-tion caused a release of porewater N2 into the watercolumn.
Finally, physical advection and mixing could be responsi-ble for the residual concentration differences measured dur-ing this study if the temperature-N2 and temperature-N2Orelationships used here did not successfully model such proc-esses. In this case, the residual concentration differencesmeasured within the internal shoreline would be an artifactof denitrification or N2O production elsewhere in the reser-voir. The accuracy of advection modeling might be degradedby spatial heterogeneity in water chemistry and shorter time-scale changes in solute concentrations. Observed velocitieswithin the internal shoreline BBL suggest that water isadvected about 600 m upslope and downslope during eachwave cycle. Within this footprint, relationships between
temperature, N2 and N2O may depart from the measureddeep water values, particularly in relatively shallow locations.
Internal shorelines as a potential denitrification hot spotDespite the dynamic chemical environment within the
internal shoreline, the effect of seiching on internal shore-line sediment microbial activity has rarely been studiedand we are not aware of previous in situ studies. One recentmesocosm study compared three fully oxygenated sedi-ment cores with three cores undergoing intermittentanoxic phases and found no statistical difference in themicrobial activity or chemical composition between treat-ments (Frindte et al. 2013). However, this study did notmimic the physical wave dissipation or the fluctuations intemperature and chemicals (aside from oxygen) that occursin situ during an internal wave cycle. Recently, dispropor-tionately high rates of N2 accumulation were observedwithin the anoxic metalimnion of an agriculturally influ-enced lake, especially under strong stratification (Grantzet al. 2012). Laboratory incubations revealed water-columnN2 accumulation, but metalimnion sediments were notincubated to assess their potential contribution (Grantzet al. 2012). Our analysis of vertical differences in chemis-try within the internal shoreline of Lacamas is consistentwith denitrification within internal shoreline sediments(Fig. 6e). We also document a peak in excess N2 concentra-tions within the metalimnion of the lake (Fig. 2c), whichmay result, at least partially, from the advection of N2 pro-duced within the internal shoreline. While we did notobserve large fluctuations in NO2
3 concentration within theBBL, the large fluctuations in NH1
4 and O2 may supportlocal production and subsequent consumption of oxidizedN (Fig. 6c,d).
Although limited to just a few hours of significant resid-ual differences in nitrogenous chemistry, these results sug-gest that further investigation of BBL gradients may provefruitful, particularly if residual gradients can be combinedwith estimates of turbulent diffusivity to yield biogenicfluxes (Holtappels et al. 2011). Chemical fluxes on the conti-nental shelf have been estimated from chemical gradientsusing turbulent diffusivity calculated from logarithmicboundary layer theory (McGillis et al. 2011). However, ourmeasurements of order-one Richardson numbers indicatethat mixing within 0.4 m of the bed was substantially inhib-ited by stratification, violating the assumptions of logarith-mic boundary layer theory (Monin and Yaglom 1975).Alternative models for turbulent diffusivity would likely berequired to accurately estimate fluxes in such a stronglystratified boundary layer.
As the internal shoreline represents a potentially signifi-cant areal extent and a potential hotspot for biogeochemicaltransformations, it merits additional study. The amplitude ofinternal waves in lakes is usually several meters, but canrange up to 60 m (Van Senden and Imboden 1989). More
Deemer et al. Chemical mixing in the bottom boundary layer
12
work is needed to understand the relative importance of thiszone in system-wide denitrification and overall biogeochemi-cal cycling. High temporal resolution, in situ approaches,such as the one described here, are likely to aid in under-standing the dynamics of this region.
Next stepsCurrently, in situ studies of aquatic denitrification rely on
cumbersome measurements of gas transfer velocity or arelimited to the lower water column of stratified lakes and res-ervoirs where N2 can accumulate due to water-density gra-dients (Deemer et al. 2011; Grantz et al. 2012; Beaulieu et al.2014). In principle, biogenic chemical fluxes can be esti-mated by combining the residual gradients investigated herewith estimates of turbulent diffusivity (Holtappels et al.2011; McGillis et al. 2011). The time series of vertical differ-ences in BBL N2 concentrations presented here is a first steptoward the development of such a “flux gradient” approachto estimating dentrification and other important chemicalfluxes. Flux gradient methods, which require only relativelyeasily measured mean concentrations (rather than the fastresponse measurements required for eddy covariance meth-ods), have long been used in the atmospheric boundary layer(H!ogstr!om 1996) and have recently been applied successfullyto estimate mixing of O2 in a marine BBL (McGillis et al.2011). Currently, efforts are underway to improve samplingtechniques and adapt the flux gradient approach to stratifiedconditions, for application to lakebed BBLs. The rapid varia-tion in chemical gradients observed in this study argues forthe continued development of techniques that can elucidatephysically driven biogeochemical hot spots and hotmoments at the sediment water interface.
References
Beaulieu, J. J., R. L. Smolenski, C. T. Nietch, A. Townsend-Small, M. S. Elovitz, and J. P. Schubauer-Berigan. 2014.Denitrification alternates between a source and sink ofnitrous oxide in the hypolimnion of a thermally stratifiedreservoir. Limnol. Oceanogr. 59: 495–506. doi:10.4319/lo.2014.59.2.0495
Bluteau, C. E., N. L. Jones, and G. N. Ivey. 2011. Dynamicsof a tidally-forced stratified shear flow on the continentalslope. J. Geophys. Res.: Oceans 116: C11017. doi:10.1029/2011JC007214
Bryant, L. D., C. Lorrai, D. F. McGinnis, A. Brand, A. W!uest,and J. C. Little. 2010. Variable sediment oxygen uptake inresponse to dynamic forcing. Limnol. Oceanogr. 55: 950–964. doi:10.4319/lo.2010.55.2.0950
Cossu, R., and M. G. Wells. 2014. The interaction of largeamplitude internal seiches with a shallow slopinglakebed: Observations of benthic turbulence in LakeSimcoe, Ontario, Canada. PLoS One 8: e57444. doi:10.1371/journal.pone.0057444
David, M. B., L. G. Wall, T. V. Royer, and J. L. Tank. 2006.Denitrification and the nitrogen budget of a reservoir inan agricultural landscape. Ecol. Appl. 16: 2177–2190. doi:10.1890/1051-0761(2006)016[2177:DATNBO]2.0.CO;2
Deemer, B. R., J. A. Harrison, and E. W. Whitling. 2011.Microbial dinitrogen and nitrous oxide production in asmall eutrophic reservoir: An in situ approach toquantifying hypolimnetic process rates. Limnol.Oceanogr. 56: 1189–1199. doi:10.4319/lo.2011.56.4.1189
Frindte, K., W. Eckert, K. Attermeyer, and H. P. Grossart.2013. Internal wave-induced redox shifts affect biogeo-chemistry and microbial activity in sediments: A simula-tion experiment. Biogeochemistry 113: 423–434. doi:10.1007/s10533-012-9769-1
Garrett, C., and B. Petrie. 1981. Dynamical aspects of theflow through the Strait of Belle Isle. J. Phys. Oceanogr.11: 376–393. doi:10.1175/1520-0485(1981)011<0376:DAOTFT>2.0.CO;2
Goreau, T. J., W. A. Kaplan, S. C. Wofsy, M. B. McElroy, F.W. Valois, and S. W. Watson. 1980. Production of NO2
2
and N2O by nitrifying bacteria at reduced concentrationsof oxygen. Appl. Environ. Microbiol. 40: 526–532.
Grantz, E. M., A. Kogo, and J. T. Scott. 2012. Partitioningwhole-lake DNF using in situ dinitrogen gas accumulationand intact sediment core experiments. Limnol. Oceanogr.57: 925–935. doi:10.4319/lo.2012.57.4.0925
Groffman, P. M., and others. 2006. Methods for measuringDNF: Diverse approaches to a difficult problem. Ecol. Appl.16: 2091–2122. doi:10.1890/1051-0761(2006)016[2091:MFMDDA]2.0.CO;2
Harrison, J. A., and P. A. Matson. 2003. Patterns andcontrols of nitrous oxide (N2O) emissions from drainagewaters of the Yaqui Valley, Sonora, Mexico. GlobalBiogeochemical Cycles, 17: (3), 1080, doi:10.1029/2002GB001991
Henderson, S. M., and B. R. Deemer. 2012. Verticalpropagation of lakewide internal waves. Geophys. Res.Lett. 39: L06405. doi:10.1029/2011GL050534
H!ogstr!om, U. 1996. Review of some basic characteristics ofthe atmospheric surface layer. Boundary Layer Meteorol.78: 215-246. doi:10.1007/BF00120937
Holtappels, M., M. M. M. Kuypers, M. Schl!uter, and V.Br!uchert. 2011. Measurement and interpretation of soluteconcentration gradients in the benthic boundary layer.Limnol. Oceanogr.: Methods 9: 1–13. doi:10.4319/lom.2010.9.1
Imberger, J. 1998. Flux paths in a stratified lake: A review, p.1–17. In J. Imberger [ed.], Physical processes in lakes andoceans. American Geophysical Union.
Kana, T. M., C. Darkangelo, M. D. Hunt, J. B. Oldham, G. E.Bennett, and J. C. Cornwell. 1994. Membrane inlet massspectrometer for rapid high-precision determination ofN2, O2, and Ar in environmental water samples. Anal.Chem. 66: 4166–4170. doi:10.1021/ac00095a009
Deemer et al. Chemical mixing in the bottom boundary layer
Kirillin, G., C. Engelhardt, and S. Golosov. 2009. Transientconvection in upper lake sediments produced by internalseiching. Geophys. Res. Lett. 36: L18601. doi:10.1029/2009GL040064
Lohrmann, A., B. Hackett, and L. P. Røed. 1990. Highresolution measurements of turbulence, velocity andstress using pulse-to-pulse coherent sonar. J. Atmos. Oce-anic Technol. 7: 19–37. doi:10.1175/1520-0426(1990)007<0019:HRMOTV>2.0.CO;2
Lombardi, C. M., and S. H. Hurlbert. 2009. Misprescriptionand misuse of one-tailed tests. Austral Ecol. 34: 447–468.doi:10.1111/j.1442-9993.2009.01946.x
Lorke, A., B. M!uller, M. Maerki, and A. W!uest. 2003.Breathing sediments: The control of diffusive transportacross the sediment-water interface by periodic boundary-layer turbulence. Limnol. Oceanogr. 48: 2077–2085. doi:10.4319/lo.2003.48.6.2077
Lorke, A., F. Peeters, and A. W!uest. 2005. Shear-inducedconvective mixing in bottom boundary layers on slopes.Limnol. Oceanogr. 50: 1612–1619. doi:10.4319/lo.2005.50.5.1612/pdf
Martini, K. I., M. H. Alford, E. Kunze, S. M. Kelly, and J. D.Nash. 2013. Internal bores and breaking internal tides onthe Oregon continental slope. J. Phys. Oceanogr. 43: 120–139. doi:10.1175/JPO-D-12-030.1
McGillis, W. R., C. Langdon, B. Loose, K. K. Yates, and J.Corredor. 2011. Productivity of a coral reef usingboundary layer and enclosure methods. Geophys. Res.Lett. 38: L03611. doi:10.1029/2010GL046179
Monin, A. S., and A. M. Yaglom. 1975. Statistical fluidmechanics: Mechanics of turbulence. Dover.
Robb, W. L. 1968. Thin silicone membranes- their permeationproperties and some applications. Ann. N. Y. Acad. Sci.146: 119–137. doi:10.1111/j.1749-6632.1968.tb20277.x
Rusello, P. J. 2009. A practical primer for pulse coherentinstruments. Technical Report TN-027, 673 Nortek AS.
Ruxton, G. D., and M. Neuh!auser. 2010. When should weuse one-tailed hypothesis testing? Methods Ecol. Evol. 1:114–117. doi:10.1111/j.2041-210X.2010.00014.x
Saunders, D. L., and J. Kalff. 2001. Denitrification rates in thesediments of Lake Memphremagog, Canada-USA. WaterRes. 35: 1897–1904. doi:10.1016/S0043-1354(00)00479-6
Seitzinger, S., and others. 2006. DNF across landscapes andwaterscapes: A synthesis. Ecol. Appl. 16: 2064–2090. doi:10.1890/1051-0761(2006)016[2064:DALAWA]2.0.CO;2
Stein, L. Y., and Y. L. Yung. 2003. Production, isotopiccomposition, and atmospheric fate of biologicallyproduced nitrous oxide. Annu. Rev. Earth Planet Sci. 31:329–356. doi:10.1146/annurev.earth.31.110502.080901
Taylor, J. R. 1993. Turbulence and mixing in the boundarylayer generated by shoaling internal waves. Dyn. Atmos.Oceans 19: 233–258. doi:10.1016/0377-0265(93)90038-9
Thorpe, S. A. 1992. Thermal fronts caused by internal gravitywaves reflecting from a slope. J. Phys. Oceanogr. 22: 105–108.doi:10.1175/1520-0485(1992)022<0105:TFCBIG>2.0.CO;2
Thorpe, S. A. 1999. Fronts formed by obliquely reflectinginternal waves at a sloping boundary. J. Phys. Oceanogr.29: 2462–2467. doi:10.1175/1520-0485(1999)029<2462:FFBORI>2.0.CO;2
Thorpe, S. A., and U. Lemmin. 1999. Internal waves andtemperature fronts on slopes. Ann. Geophysicae 17:1227–1234. doi:10.1007/s00585-999-1227-6
Umlauf, L., and H. Burchard. 2011. Diapycnal transport andmixing efficiency in stratified boundary layers nearsloping topography. J. Phys. Oceanogr. 41: 329–345. doi:10.1175/2010JPO4438.1
Van Senden, D. C., and D. M. Imboden. 1989. Internal seichepumping between sill-separated basins. Geophys. Astro.Fluid 48: 135–150. doi:10.1080/03091928908219530
Walter, R. K., C. B. Woodson, P. R. Leary, and S. G.Monismith. 2014. Connecting wind-driven upwelling andoffshore stratification to nearshore internal bores and oxy-gen variability. J. Geophys. Res.: Oceans 119: 3517–3534.doi:10.1002/2014JC009998
Weiss, R. F. 1970. The solubility of nitrogen, oxygen andargon in water and seawater. Deep-Sea Res. 17: 721–735.doi:10.1016/0011-7471(70)90037-9
Weiss, R. F., and B. A. Price 1980. Nitrous-oxide solubility inwater and seawater. Mar. Chem. 8: 347–359. doi:10.1016/0304-4203(80)90024-9
Winant, C. D. 1974. Internal surges in coastal waters. J. Geophys.Res. 79: 4523–4526. doi:10.1029/JC079i030p04523
Wrage, N., G. L. Velthof, M. van Beusichem, and O.Oenema. 2011. Role of nitrifier denitrification in theproduction of nitrous oxide. Soil Biol. Biochem. 33:1723–1732. doi:10.1016/S0038-0717(01)00096-7
AcknowledgementsEssential field and laboratory assistance was provided by Keith Birch-
field, Melissa Boyd, Kassi Dallavis, Alyson Day, Maria Glavin, AndrewHarwood, Allison Jacobs, Tammy Lee, Abby Lunstrum, Rebecca Martin,Michelle McCrackin, Cody Miller, Kristy and Larry Schneider, MattSchult, and Natalie Selstad. In addition, we thank Daniel Reed, twoanonymous reviewers and the WSU Writing Group for thoughtful com-ments that improved the quality of this manuscript. Funding providedby USACE IWR and by National Science Foundation (NSF) ETBC Grant#1045286, NSF DEB Grant #135211, and NSF IGERT Fellowship#0903714. Any opinions, findings, and conclusions or recommendationsexpressed in this material are those of the authors and do not necessarilyreflect the views of the funders.
Submitted 18 December 2014
Revised 08 April 2015, 08 May 2015, 21 May 2015
Accepted 22 May 2015
Associate editor: John Melack
Deemer et al. Chemical mixing in the bottom boundary layer