G LOBA L BIOG EOCH EM ICAL CYCLES, VOL. 18, G B3014, doi: I0. 1029/2003GB002194, 2004 Chemistry of burning the forest floor during the FROSTFIRE experimental burn, interior Alaska, 1999 J. W. Harden, l J. C. Neff,2'3 D. V. Sandberg, 4 M. R. Turek~ky,I R. Ottmar, s G. Gleixner, 6 T. L. Fries, 1 and K. L. Manies I Received 24 November 2003; revised 15 April 2004: accepted 24 June 2004: published 28 Augus! 2004. [i] Wildfires represent one of the most common disturbances in boreal regions, and have the potential to reduce C, N, and Hg stocks in soils while contributing to atmospheric emissions. Organic soil layers of the forest floor were sampled before and after the FROSTFIRE experimental burn in interior Alaska, and were analyzed for bulk density, major and trace elements, and organic compounds. Concentrations of carbon, nutrients, and several major and trace elements were significantly altered by the burn. Emissions of C, N, and Hg, estimated from chemical mass balance equations using Fe~ AI, and Si as stable constituents, indicated that 500 to 900 g C and up to 0 to 4 x 10- g Hg/m2 were lost from the site. Calculations of nitrogen loss range from -4 to +6 g/m 2 but were highly variable (standard deviation 19), with some samples showing increased N concentrations post-burn potentially from canopy ash. Noncombustible major nutrients such as Ca and K also were inherited from canopy ash. Thenuogravimetry indicates a loss of thermally labile C and increase.of lignin-like C in char and asia relative to unbnrned counterparts. Overall, atmospheric impacts of boreal fires include large emissions of C, N and Hg that vary greatly as a tunction of severe fire weather and its access to deep organic layers rich in C, N, and Hg. In terrestrial systems, burning rearranges the vertical distribution of nutrients in fuels and soils, the proximity of nutrients and permafrost to surface biota, and the chemical composition of soil including its nutrient and organic constituents, all of which impact C cycling. INDEX TERMS:0315 Atmospheric Composition and Structure: Biosphere/atmosphere interactions; 0330 Atmospheric Composition and Structure: Geochemical cycles; 1615 Global Change: Biogcochemical processes (4805); 1030 Geochemistry: Geochemical cycles (0330); KEYWORDS: combustion, experimental burn, boreal tbrest, black spruce, t~athcnnoss, Hg Citation: Harden, J. W., J. C. Neff. D. V. Sandbcrg, M. R. Turetsky, R. Ottmar, G. Glcixncr, T. L. Fries, and K. L. Manies (2004), Chemistry of burning the forest floor during the FROSTFIRE experime,ltal burn. inie,'ior Alaska, 1999, Global Biogeochem. Cycles, 18, GB3014, doi:l O. 1029/2003G B002194. I. Introduction [2] Emissions and ash deposition ti'om wildfires have important impacts on atmospheric and watershed chemistry [Liu et al., 2000; Van lWk et al., 1992], forest biogcochem- ical cycling [Trabaud, 1994]. and the types and rates of vegetative regrowth [Luc and Luc, 1998; Schimel and Granstrom, 1989]. Fires are particularly widespread and severe in boreal forests [Kasischke and Stocks, 2000] ~U.S. Geological Survey, Menlo Park, Calitbrnia, USA. ~'U.S. Geological Survcy. Denver F~eml Ccnlcr. Denver. Colorado, USA. ~Now at Geological Sciences and Environmental Sludles, Univcrsily of Colorado, Boulder. Colorado, USA. apacific Northwest Rescarch Station. USDA Forest Scrvice. Co~'allis. Oregon. USA. "Seattle Forestry Science LaboratoD', Seattle. Washington, USA. aMax Planck Institute lbr Biogeoehemistry,Jcna, Germany. Copyright 2004 by the American Geophysical Union. 0886-6236/04/2003GB002194512.00 and can Icad Io major changes in the elemental composition of soils and vegetation. In particular, fires can lead to combustion losses of organic matter and nutrients, changes in the availability of plant nutrients, and mobilization of particulates into the atmosphere, soils, and streams. [3] One of the most crucial issues involving fire in boreal systems is the impact of burning on carbon cycling, as fire events release CO2, CH4, and CO directly to the atmo- sphere. Reliable post-burn estimates of fire emissions are problematic, however, in part because changes must be rcconstrncted ti'onr control-experiment comparisons and control sites are difficult to identify [see. e.g., Conalzl aml h,anova. 1998; t:)'ench et al., 2000]. Changes in budgets and availability of nutrients also impact post-fire regrowth and carbon cycling. In particular, N can be lost through combustion and leaching [Wan et al., 2001]; therefbre forcsts can be limited by nitrogen availability during regrowth [I/an Cleve, 1973: Van Cleve and Oliver, 1982]. [4] Burns do not have unifornl effects on nutrients, and previous field and laboratory studies [e.g., Dyreness and Norum, 1983] have demonstrated how the heterogeneity of GB3014 I of 13 -
Transcript
G LOBA L BIOG EOCH EM ICAL CYCLES, VOL. 18, G B3014, doi: I 0. 1029/2003GB002194, 2004
Chemistry of burning the forest floor during the FROSTFIRE experimental burn, interior Alaska, 1999 J. W. Harden, l J. C. Neff, 2'3 D. V. Sandberg, 4 M. R. Turek~ky, I R. Ottmar, s
G. Gleixner, 6 T. L. Fries, 1 and K. L. Manies I
Received 24 November 2003; revised 15 April 2004: accepted 24 June 2004: published 28 Augus! 2004.
[i] Wildfires represent one of the most common disturbances in boreal regions, and have the potential to reduce C, N, and Hg stocks in soils while contributing to atmospheric emissions. Organic soil layers of the forest floor were sampled before and after the FROSTFIRE experimental burn in interior Alaska, and were analyzed for bulk density, major and trace elements, and organic compounds. Concentrations of carbon, nutrients, and several major and trace elements were significantly altered by the burn. Emissions of C, N, and Hg, estimated from chemical mass balance equations using Fe~ AI, and Si as stable constituents, indicated that 500 to 900 g C and up to 0 to 4 x 10- g Hg/m 2 were lost from the site. Calculations of nitrogen loss range from - 4 to +6 g/m 2 but were highly variable (standard deviation 19), with some samples showing increased N concentrations post-burn potentially from canopy ash. Noncombustible major nutrients such as Ca and K also were inherited from canopy ash. Thenuogravimetry indicates a loss of thermally labile C and increase.of lignin-like C in char and asia relative to unbnrned counterparts. Overall, atmospheric impacts of boreal fires include large emissions of C, N and Hg that vary greatly as a tunction of severe fire weather and its access to deep organic layers rich in C, N, and Hg. In terrestrial systems, burning rearranges the vertical distribution of nutrients in fuels and soils, the proximity of nutrients and permafrost to surface biota, and the chemical composition of soil including its nutrient and organic constituents, all of which impact C cycling. INDEX TERMS: 0315 Atmospheric Composition and Structure: Biosphere/atmosphere interactions; 0330 Atmospheric Composition and Structure: Geochemical cycles; 1615 Global Change: Biogcochemical processes (4805); 1030 Geochemistry: Geochemical cycles (0330); KEYWORDS: combustion, experimental burn, boreal tbrest, black spruce, t~athcnnoss, Hg
Citation: Harden, J. W., J. C. Neff. D. V. Sandbcrg, M. R. Turetsky, R. Ottmar, G. Glcixncr, T. L. Fries, and K. L. Manies (2004), Chemistry of burning the forest floor during the FROSTFIRE experime,ltal burn. inie,'ior Alaska, 1999, Global Biogeochem. Cycles, 18, GB3014, doi:l O. 1029/2003G B002194.
I. Introduction
[2] Emissions and ash deposition ti'om wildfires have important impacts on atmospheric and watershed chemistry [Liu et al., 2000; Van lWk et al., 1992], forest biogcochem- ical cycling [Trabaud, 1994]. and the types and rates o f vegetative regrowth [Luc and Luc, 1998; Schimel and Granstrom, 1989]. Fires are particularly widespread and severe in boreal forests [Kasischke and Stocks, 2000]
~U.S. Geological Survey, Menlo Park, Calitbrnia, USA. ~'U.S. Geological Survcy. Denver F~eml Ccnlcr. Denver. Colorado,
USA. ~Now at Geological Sciences and Environmental Sludles, Univcrsily of
Oregon. USA. "Seattle Forestry Science LaboratoD', Seattle. Washington, USA. aMax Planck Institute lbr Biogeoehemistry, Jcna, Germany.
Copyright 2004 by the American Geophysical Union. 0886-6236/04/2003GB002194512.00
and can Icad Io major changes in the elemental composition of soils and vegetation. In particular, fires can lead to combustion losses of organic matter and nutrients, changes in the availability of plant nutrients, and mobilization of particulates into the atmosphere, soils, and streams.
[3] One of the most crucial issues involving fire in boreal systems is the impact of burning on carbon cycling, as fire events release CO2, CH4, and CO directly to the atmo- sphere. Reliable post-burn estimates of fire emissions are problematic, however, in part because changes must be rcconstrncted ti'onr control-experiment comparisons and control sites are difficult to identify [see. e.g., Conalzl aml h,anova. 1998; t:)'ench et al., 2000]. Changes in budgets and availability of nutrients also impact post-fire regrowth and carbon cycling. In particular, N can be lost through combustion and leaching [Wan et al., 2001]; therefbre forcsts can be limited by nitrogen availability during regrowth [I/an Cleve, 1973: Van Cleve and Oliver, 1982].
[4] Burns do not have unifornl effects on nutrients, and previous field and laboratory studies [e.g., Dyreness and Norum, 1983] have demonstrated how the heterogeneity of
GB3014 I of 13 -
Denney
GB3014 I1ARDEN ET AI...: CtfEMISFRY OF BURNING TIlE FOREST FLOOR GB3014
6 9 ~
6 0 o .
i
5 7 ~
Figure 1. Location of sample sites in interior Alaska.
plant, soil, and moisture content affects fire behavior, post- burn nitrogen availability, and the phmt structure and rales of regrowth [Driscoll et al., 1999]. Spatial heterogeneity, post-fire mixing of soil layers, and the difficulty of recon- structing soil horizon structure all add to the complication of estimating fire effects on element concentrations.
[s] Experimental burns offer a unique opportunily to characterize fuels, burn severity, fuel consumption, and the chemical composition of fuel and combustion products. Through measurements befbre and after fire, the FROSTFIRE experimental burn [see Hinzman et al.. 2003] facilitated a dircct assessment of fire impacts on element budgets. We focus on characlerizing the physical and chemical changes to the lbrest soils and on assessing the potential for changes in both availability and mobility of multiple elements as the result of fire.
2. Methods
[6] Sampling sites are located within the Caribou Poker Watershed of the University of Alaska's Long-Term Ecological Research (LTER) site. about 60 km north of Fairbanks (Figure 1). All sites described here were placed along transects marked and sampled by the U.S. Forcst Sen, ice's Fire and Environmental Research Applications Team (FERA). Our sites included the (1) upper black spruce (UPBS) site, located in the closed black spruce canopy near Helmer's Ridge, which burned after torching the base of the slope (Figure 1), and (2) the largc black spruce (LBS) site thai also burned during the experiment; this site is more poorly drained and is located at the base of tile watershed along Poker Creek. Several olher sites were characterized but did nol burn and are not discussed in this paper.
[7] Before tile burn, a number of metal pins (reduction pins) were inserted into the soil where the top of the pin lies flush with the moss surface. Forest floor/organic soil layers were characterized according to forestry nomenclature, which we further interpreted into soil nomenclature [Canadian Agricult.ral Services Coordinating C¥)mmittee, 1998; Soil Survey SttCf 1998]: (1) live moss (LM) layers arc
green and generally contain some leaf and needle litter (Figure 2); (2) dead moss (DM) layers arc comprised of undecomposed or slightly decomposed fibric organic hori- zons that contain a larger portion of moss detritus than roots; (3) upper duff(U[)) layers vary in degree of decomposition but are layers in which roots are more abundant than recognizable moss parts; UD layers would in most cases be considered fibric (F) layers (Canadian soil system) or Oi layers (U.S. system): (4) lower duff (LD) layers have some mineral content but arc generally well decomposed with no or IFw recognizable plant parts other than roots. LD layers
, i / / iow~.~ d Jfl [0.~} iooc~r .'.u~'i (0~:,) - F ] / ' / /
Min~!~al s~)iI (A hodzc~I:] I / V
Figure 2. Schematic diagram of soil layers and sampling of ash/char layers after burning.
2 of 13
GB3014 ItARDEN El" At..: CHEMISTRY OF BURNING THE FOREST FLOOR GB3014
are mesic or humic (Canadian) horizons or Oe horizons (United States), indicating high degree of decomposition. Before the bum, samples were collected by U.S. Forcstry Sen, ice personnel and divided into the tbur soil layers (LM, DM, UD, LD). If thicker than 5 cm, layers were further subdivided.
[s] Bulk density was measured throughout the spring and stnnmer prior to thc bum. The most common method for bulk density measurements employed a metal square mea- suring 20 c m 3 with an open top and bottom. This square wns driven to the depth of ice or mineral soil to extrude soil. Material then was divided into soil layers or finer-scale depth increments (if thicker than 5 cm). In some instances, bulk density samples were excavated in situ using a three- sided metal box open to a pit thce; the depth of each layer was recorded along with the area of the sample box. Samples were weighed within 24 hours, and thcn were either air dried to a constant mass (mass lost equivalent to air-dry moisture contcnt), or placcd into a 65°C oven for 96 hours for oven-dry masses (mass lost equivalent Io oven-dry moisture contents).
[9] Within 24 hours of the bum, two sets of samples wcrc collected from the Helmer's Ridge UPBS site, including soil profiles and surface ash-char. For the profile samples, surt~ace ash-char layers wcre collected volumetrically within a set square to the depth of the lower boundary of black char using a small vacuum. Soil layers (DM, UD, LD) bclow ash and char layers were collccted volumetrically. Each profile was excavated adjacent to a reduction pin (see above) to allow us to relate soil chemical properties to estimates of firc consumption (centimeters of forest soil consumed) (Figure 2). For each soil layer/sample, we noted depth relative to the moss surPace. In addition to the profiles, we also collected a series of surthcc samples adjacent to reduction pins. This set includes only volumetric samples of the ash/uppemlost char layer (i.e., excluding deeper unburned material) and depths to mineral soil were recorded.
3. Physical and Chemical Analyses [~0] Material >2 mm and twigs/roots >1 cm diameter
were removed, and the samples were ground to pass a 100 mesh screen. Subsamples were analyzed for organic matter content by loss on ignition (LOI) by placing them in platinum crucibles and heating to 550°C for 5 hours and measuring percent mass loss. Hg concentration was measured by a XRAL Inc. digestion wi(ll a mixture of H2SO4, HNO3, HCI, and KMnO4 (5%) and K2S~.Os (5%) in a water bath tbr 1 hour. Excess KMnO4 was reduced by hydroxylamine sulfate solution, and Hg (11) was reduced by a SnC12 solution. The Hg vapor was separated and measured using a LEEMAN PS200 Aulomated Mercury Analyzer. Major, minor, and trace elements wrre measured by inductively coupled plasma-atomic emission spectrometry (ICP-AES). Samples were decomposed using a mixture of HCI, HNO3, HCIO4. and HF acids at low temperature [Crock et al., 1983]. The digested sample was aspirated into the ICP-AES discharge where the elemental emission signal was measured simulta-
neously for several elcmcnts. Calibration was performed by standardizing with digested rock reference materials and a scrics of multielement solution standards.
[11] Total percent carbon (TC) were made using either a LECO carbon determinator (WR-112) or a Fisons NA1500 clcmcntal analyzcr (EA)/Optima isotope ratio mass spec- Iromcter (IRMS). For this analysis, between 1 and 30 mg of samplc, depending on the estimated carbon concentration, was loaded into a tin capsule, and the capsule was tightly crimped to exclude atmospheric gases. Samples were then combustcd at 1000°C in a stream of oxygen. Wc also used the Fisons NAI500 EA/Optima IRMS to deten'nine the '3C and ~SN abundance. Elemental concentrations were calculatcd based on instrument responses for calibration standards, in addition to calibration materials, three standard materials were routinely included in all EA/IRMS sample runs. Standards included (1) ethylene diamine tetracetic acid EDTA) obtained from Fisons Instruments, S.p.a., (2) a marine sediment (MESS-l) issued by the Chemistry Division of the Canadian National Research Council, and (3) a river sedi,nent (NBS 1645) issued by the National Bureau of Standards (now the National Institute of Stand- ards and Technology). Precision estimates, expressed as relative standard deviation, were 3.6-6.5% tbr total carbon and 3.7--6.5% for total nitrogen. Standard deviation for taC for the standard materials was O. 16 to 0.3 per mil (see also Mantes et al. [2002] tbr more information on standards). Approximately 3% of all samples were also analyzed in duplicate. For these duplicate runs, standard deviation of duplicate runs averaged <1% for total carbon and <2% for total nitrogen.
[12] Thermogravimetry of the samples was performed with a TGA851e (Mettler-Toledo, Gicssen, Germany) according to mefllods of Gleixner et al. [2002]. About 10 nag soil was weighed into 150-~1 aluminum oxide sample cups. The samples were placcd at 60°C into the TG analyzer, which was flushed with a constant tlow of oxygen. Aftcr 25 min the sample was heated at 20°C/rain to a final temperature of 1000°C. To reach themlal equilibrium, the temperature was held for 5 min.
[13] The laC content of ground, untreated soil was mca- sured by vacuum sealing a homogenized sample containing ,-,I mg C with cupric oxide and elemental silver in a quartz tube and combusting at 850°C. The CO-. produced was purificd cryogenically and reduced to graphite using a modified reduction method with titanium hydride, zinc, and cobalt catalyst [Vogel, 1992]. The graphite target is measured dircctly for ~4C at Lawrence Livennore National Laboratory, Center lbr Accelerator Mass Spectrometry. The '4C data are expressed in Delta notation 0514C) similar to ~13C above, i.e., the deviation in the 14C/C in parts per thousand (%0) from a standard ( ( 1 4 C / C ) s t a n d a r d = 1.176 × 10⁻¹"-), with additional correction for possible IFactionation effects based on 13C [see Stuiver and Polach, 1977]. To convert bl4C values to percent Modem (pM) values, simply
14 o divide by 10 and add 100; ~ C = 0%0 (i.e., 100pM or ~4C/C = 1.176 × 10 -~2) approximately represents the ~4C/C of atmospheric CO2 in the year 1890.
[14] We used an elemental mass balance approach for calculating net loss or gain to the forest floor. This method
3 of 13
GB3014 HARDEN ET AL.: CHEMISTRY OF FIIJRNING THE FOREST FLOOR GB3014
is designed to quantify net elemental changes to the soil profile where elements can be lost (i.e.. during combustion). inherited (i.e., from dust or canopy ash), or conserved (stable relative to other elements [Brhnhall et al., 1992; White et aL. 1996]). We chose Fe, AI, and Si as stable indices for calculating elemental loss and gains during burning because these elements are not susceptible to combustion (discussed in more detail in section 4.3) yct are different in their behavior and abundance in the system. While Fe has been shown to be involved with pyrogenic reactions, it is not likely combusted during burning, its concentrations are not correlated with AI and Si. and it is abundant in both mincral and organic compounds. While Si can potentially be assimilated by plants, it is not combus- tible and is present in both organic and inorganic com- pounds. AI is also noncombustible but is more abundant in mineral than organic materials. Together, the combination of Fe, AI, and Si were used lbr the stable constituent S in the calculation of strain and tau [after Brimhall et al., 1992],
Tau COs ~ = C h / ( ( B O , , / t 3 O h ) C , , ) ) ( S t r a i n h + I) - I, ( l l
where Tau is the net gain (+) or loss ( - ) of element, BD is bulk density, and S is a stable constituent such as AI or Ash assumed to be conserved during burning: the parentheses rei~:r to the element used lbr S. The subscript u is unburned; Ihe subscript b is burned; C is the combusted element. Strain is a measure of mass change and is equal to ((BDJSb)(S,/BDb)) -- I. This equation can be rearranged as
Tau C~s) = l I - ((ChlC,)/(SblS,))] x -1, (2)
revised from White et aL [1996]. [15] Because char represents a condensed burned product,
we needed to compare charred layers to the proper unburned soil layers from which it was derived. For this, we used a "composite" depth-weighted average of the unburned soil layers by multiplying the soil constituent (%C, bulk density, %N, etc.) by the thickness of each soil layer, summing the soil constituent across all relevant soil layers (successively, starting with LM + DM, then LM + DM + UD, etc.), and dividing by total thickness. This weighting scheme was applied to the two unburned profiles at UPBS on Hehner's Ridge (see Table 4 in section 4.3). We argue that these composite data otter a better estimate of fuel composition, since a char layer found in a UD soil layer likely represents the burned products of LM, DM, and, potentially, UD layers.
4. ReSults 4.1. Physical Changes by Burning
[1~] The unburned soil layers showed increases in bulk density and many chemical constituents with depth (Table 1). The most dramatic chemical changes occurred bctween the dead moss and upper duff soil layers. Carbon concentrations stayed relatively constant throughout the live moss, dead moss. and upper duff layers, but were signifi- cantly lower in the lower duff soils (Tables I and 2). However, using a backward selection, general linear model
(SAS/SYSTAT operating system, version 4.10, 1998, from SAS Institute, Cary, North Carolina), both depth (partial R 2 = 0.1394; F = 3.63: p = 0.0531) and bulk density (R 2 = 0.4384: F = 9.37; p = 0.0099) were significant predictors of C concentrations, together explaining about 60% of the variation in %C across our unburned samples. Data agree with the regression equation for %C and bulk density of Rapalee et al. [1998] for black spruce forest soils in Manitoba.
[17] Soil layers on the tbrest floor at Helmer's Ridge averaged 14 cm in thickness (Table 1) before the burn and were reduced by an average of 9 cm (Table 2), resulting in a thickness of about 5 cm post-bum. Burned samples had slightly higher bulk densities (0.025 ± 0.007, n = 5) than unburned samples (0.016 fbr LM to 0.024 for DM) but the differences were not statistically significant (Table 2). In general, the concentrations of most elements varied by burning (burned versus unburned layers) and with depth (LM, DM, UD, and LD layers.) but did not vary by a burning-depth interaction (Table 1).
4.2. Changes in Elemental Abundance: Layering and Burning
[18] Concentrations of C, N, Ca, Mn, and P varied significantly among soil layers and with burning status, but did not vary according to a soil layer x burning interactiun (Tables 1 and 2). However, Mg varied only with burning, showing increased concentrations post-fire, and Si varied only with depth (Table 1). Unlike other elements, A1 and Hg did not change significantly in concentration with either layering or burning. As noted above, C and N concentrations increased with burning and decreased with dcpth. For thc uppermost soil layers, there was a 10 to 47% increase in C concentration and a 51 to 160% increase in N tbllowing burning. ~"~C increased with depth by 4 - 5 per nail between the uppernaost moss layers and the LD (Oa) layers (Tables I and 2).
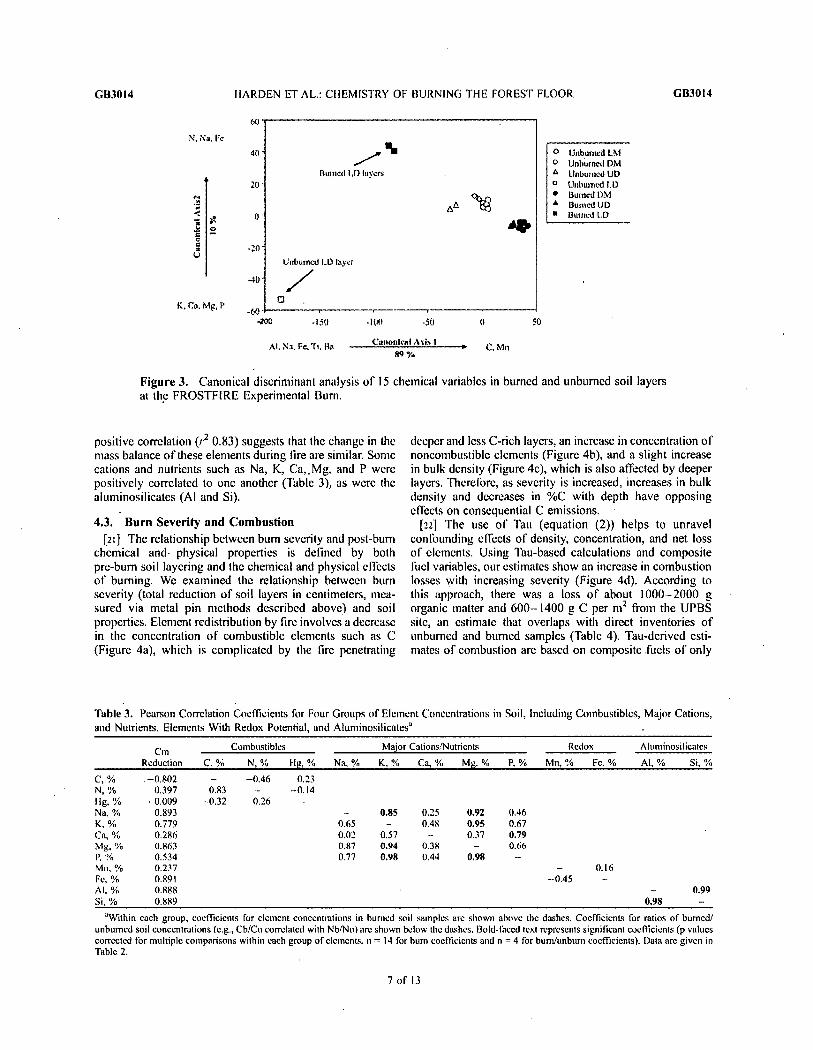
[i,)] While the tmivariate analyses described above show trends in individual chemical constituents with depth or burning, canonical discriminant analysis was used to ana- lyze 15 element concentrations sinmltaneously (Table I). "The first canonical axis was dominated by C and alumino- silicate elements and separates the soil layers, particularly the LD, from other layers (Figure 3). The second canonical axis, which is dominated by macronutrients, separates burned from unburned layers, particulady tbr LD layers. This analysis suggests that the chemistry of lower duff soil layers varies from other soil types, and highlights the importance of C, AI, and Si concentrations in separating soil chemistry with depth.
[20] Using correlation analysis to determine which chem- ical constituents behave similarly upon burning, we specif- ically tested for correlations across four groups of elements, including combustibles, major cations or nutrients, redox elements, and aluminosilicates (Table 3). C and N concen- trations in our burned samples (i 2 values above the black boxes) were not significant (Pearson's r 2 is -0 .46, but this is not significant). However, when C and N data were expressed as ratios of burned:unburned samples (for example, Cb/Cu regressed against Nb/Nu), significant and
4 of 13
¢)
m
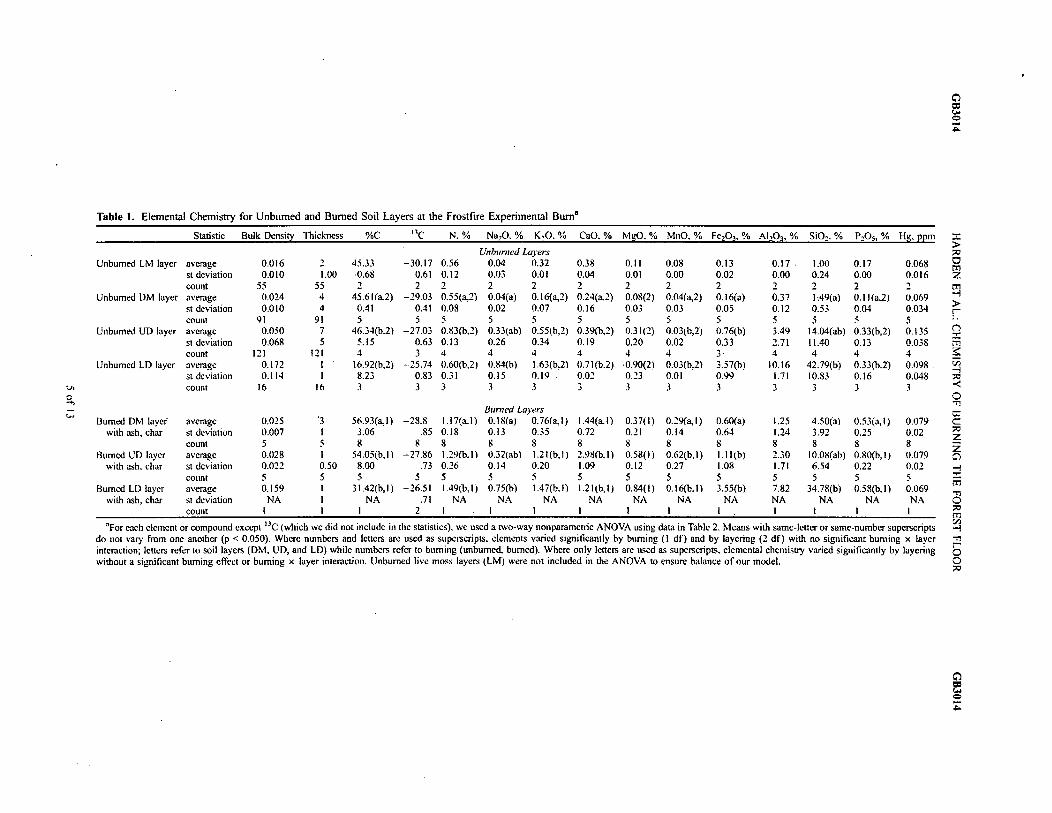
Table 1. Elemental Chemistry tbr Unburned and Burned Soil Layers at the Frostfire Experimental Burn ~
~For each element or compound except 13C (which wc did not include in the statistics), we used a two-way nonparametrie ANOVA using data in Table 2. Means with same-letter or same-number superscripts .-i do not vary from one another (p < 0.050). Where numbers and letters arc used as superscripts, elements varied signitieantly bv bumimz (I df) and by layering (2 df) with no significant burning × laver -'n interaction; letters refer to soil layers (DM. UD, and LD) while numbers refer to burning (unburned. burned). Where only letters are used as superscripts, elemental chemistry varied significantly by layering C) without a significant burning effect or burning x layer interaction. Unburned live moss layers (LM) were not included in the ANOVA to ensure balance of our model. O
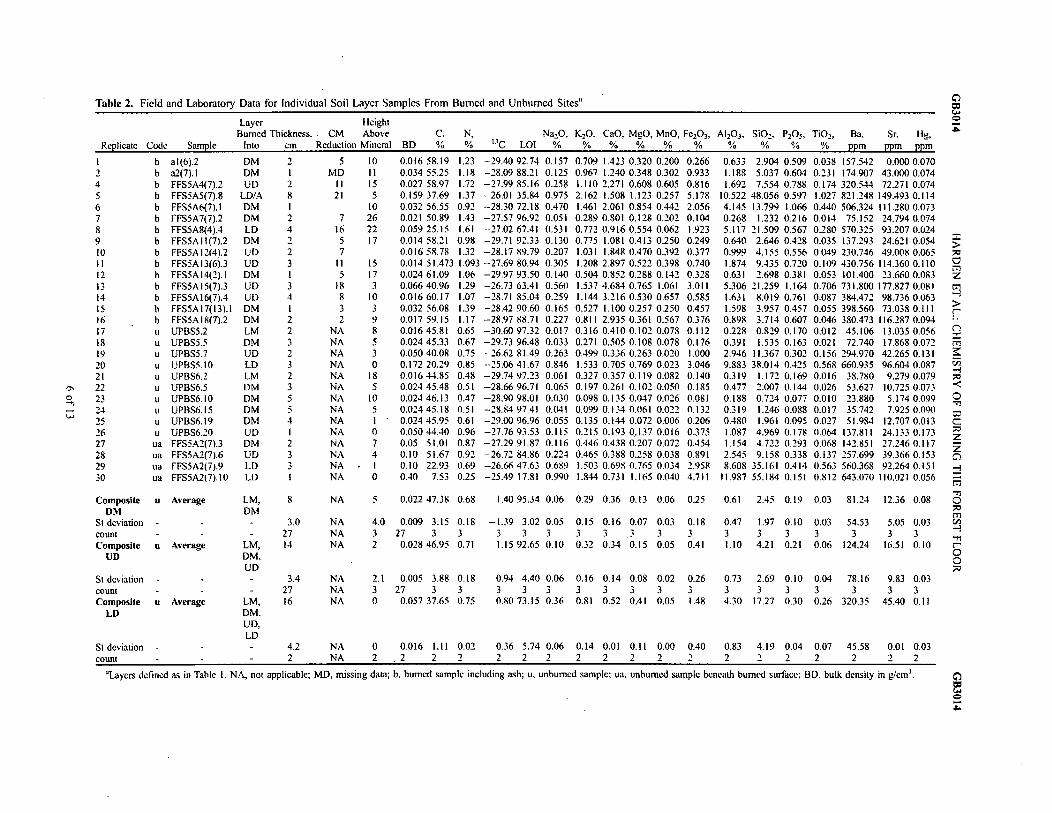
Table 2. Field and Laboratory Data for Individual Soil Layer Samples From Burned and Unburned Sites ~'
Replicate Code Sample
Layer Height Burned Thickness.. CM Above C, N, Na_,O,
Into cm Reduction Mim,n'al BD % % ~3C LOI % K20. CaO, MgO, MnO, Fe203, AI20.~. SiOz, P205, TiO2, Ba, Sr, Hg,
b a1(6).2 DM b a2(7).1 DM b FFS5A4(7).2 UD b FFS5A5(7).8 LD/A b FFS5A6(7).I DM b FFS5A7(7).2 DM b FFS5A814).4 LD b FFS5AI 1(7).2 DM b FFS5A 1214).2 UD b FFS5AI3(6).3 UD b FFS5AI4(2).I DM b FFS5AI5(7).3 UD b FFS5Al6(7).4 LID b FFS5AI7(13).I DM b FFS5AI8(7).2 DM u UPBS5.2 LM u UPBS5.5 DM u UPBS5.7 UD u UPBS5.10 LD u UPBS6.2 LM u UPBS6.5 DM u UPBS6.10 DM u UPBS6,15 DM u UPBS6.19 DM u UPBS6.20 UD ua FFSSA2(7).3 DM ua FFS5A2(7).6 UD ua FFS5A2(7).9 LD ua FFS5A217).I0 LD
:'Layers defined as in Table 1. N:~ not applicable; MD, missing data; b, burned sample including ash; u, unburned sample: ua, unburned sample beneath bumc.d surface; BD, bulk density in ~cm 3.
o Unburned LM o Unburned DM "~ Unbu,ncd LiD m Unburned LD • Burned DM • Bun~ed UD • Bumt:d I,,D
Figure 3. Canonical discriminant analysis o f 15 chemical variables in burned and unburned soil layers at the FROSTFIRE Experimental Burn.
positive correlation 0 2 0.83) suggests Ihat the change in the mass balance o f these elements during lire are similar, Some cations and nutrients such as Na, K, Ca, .Mg, and P were positively correlated to one another (Table 3), as were the aluminosilicates (AI and St).
4.3. " Burn Sever i ty and Combus t ion
[21] The relationship between bum severity and post-bum chemical and-phys ica l properties is defined by both pre-bum soil layering and the chemical and physical effects o f burning. We examined the relationship between burn severity (total reduction o f soil layers in centimeters, mea- sured via metal pin methods described above) and soil properties. Element redistribution by fire involves a decrease in the concentration o f combustible elements such as C (Figure 4a), which is complicated by the fire penetrating
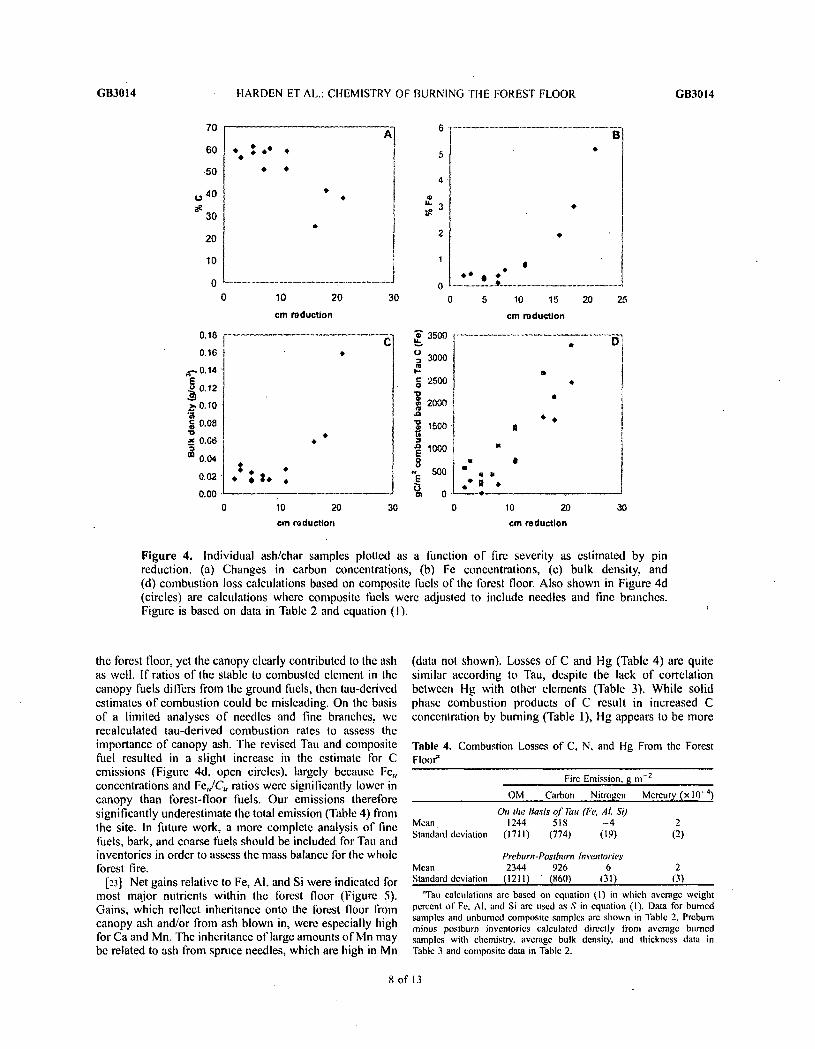
deeper and less C-rich layers, an increase in concentration o f noncombustible elements (Figure 4b), and a slight increase in bulk density (Figure 4c), which is also affected by deeper layers. Therelbre, as severity is increased, increases in bulk density and decreases in %C with depth have opposing efl'ects on consequential C emissions.
[~_z] The use o f Tau (equation (2)) helps to unravel confounding effects o f density, concentration, and net loss of elements. Using Tau-based calculations and composite fuel variables, our estimates show an increase in combustion losses with increasing severity (Figure 4d), According to this approach, there was a loss o f about 1000-2000 g organic matter and 600 -1400 g C per m 2 from the UPBS site, an estimate that overlaps with direct inventories o f unburned and burned samples (Table 4). Tau-derived esti- mates o f combustion are based on composite .fuels o f only
Table 3. Pearson Correlation Coefficients for Four Groups of Element Concentrations in Soil, Including Combustibles, Major Cations, and Nutrients, Elements With Redox Potential, and Aluminosilicates ~
Cm Combustibles M a, ior Cations,rNutrients R e d o x Aluminosilicates
Reduction C. % N, % H~, % Na..% K. % Ca, % Mt~. % P. % Mn, % Ft. % AI, % St, %
:'Within each group, coefficients for element concentrations in burned soil samples are shown above the dashes. Coefficients for ratios of burned/ unburned soil concentrations (e.g., Cb/Cu correlated with Nb/Nu) are shown below tile dashes. Bold-thced text represents significant coefficients (p values corrected for multiple comparisons within each group of clcmcnL,~, n = 14 for burn coefficients and n = 4 for bunv'unbunl coefficients). Data are given in Table 2.
7 of 13
GB3014 HARDEN ET AL.: CHEMISTRY OF BURNING THE FOREST FLOOR GB3014
70
60
50
o 40
30
20
10
0
0,18
0.16
~.-, 0 ,14
E ~0 .12
~O.lO
g o.os "o _= 0,06
=~ o+o+
0.02
0.00
• 41'
O
A
0 10 20 30
cm reduction
C
. : ; = . •
° ............................... i ................................... 5
4
2 *
t I
0 5 10 15 20 25
cm roductlon
g t .......................................... . .........
,r. + :'°°° t . + g 25oo I "
2°00 ] t
1000 =
500 = # ! .
o 0 10 20 30 10 20 30
cm reduction cm reduction
Figure 4. Individual ash/char samples plotted as a function of fire severity as estimated by pin reduction. (a) Changes in carbon concentrations, (b) Fe concentrations, (c) bulk density, and (d) combustion loss calculations based on composite fuels of the forest floor. Also shown in Figure 4d (circles) are calculations where composite lhcls were adjusted to include needles and fine branches. Figure is based on data in Table 2 and equation (1).
the forest floor, yet the canopy clearly contributed to the ash as well. If ratios of the stable to combusted element in the canopy fuels differs fi'om the ground fuels, then tau-derived estimates of combustion could be misleading. On the basis of a limited analyses of needles and fine branches, we recalculated tau-derived combustion rates to assess the importance of canopy ash. The revised Tau and composite fuel resulted in a slight increase in the estimate for C emissions (Figure 4d, open circles), largely because Fe, concentrations and Fe,JCu ratios were significantly Iowcr in canopy than tbrest-floor fuels. Our emissions theretbre significantly underestimate the total emission (Table 4) from the site. In future work, a more complete analysis of fine fuels, bark, and coarse tiJels should be included tbr Tau and inventories in order to assess the mass balance for the whole forest fire.
[+-3] Net gains relative to Fe, AI. and Si were indicated for most maior nutrients within the forest floor (Figure 5). Gains, which reflect inheritance onto the lbrest floor from canopy ash and/or from ash blown in, were especially high for Ca and Mn. The inheritance of large amounts of Mn may be related to ash ti'om spruce needles, which are high in Mn
(data not shown). Losses of C and Hg (Table 4) are quite similar according to Tau, despite the lack of correlation between Hg with other elements (Table 3). While solid phasc combustion products of C result in increased C concentration by burning (Table 1), Hg appears to be more
Table 4. Combustion Losses of C. N, and Hg From the Forest FIooP
Fire Emission. ~ m -2
OM Carbon Nitrogen Mereur~ (× 10 -4) On the Basis o f Tau (Ire, dl. Si)
Mean 1244 518 - 4 2 Standard deviation (1711) (774) (19) (2)
Preburn-Postburn Inventories Mean 2344 926 6 2 Standard deviation (1211) ' ~860) (31) (3)
~Tau calculations are based oll equation tl) in which average weight percent of Fe. AI. and Si are used as S in equation (I). Data for burned ~mpl¢.~ and unburned composite samples are shown in Table 2. Prcbum minus postbum inventories calculated directly ti'om average burned samples with chemistry, average bulk density, and thickness data in Table 3 and composite data in Table 2.
li'igure 5. Net losses of elements resulting ti'om burning of the tbrest floor, based on data in Table 2 and calculations of Tau using Fe, AI, and Si as S and using composite of unburned samples U (equation (l)). Tan values were averaged and plotted separately for bums into DM, UD, and LD layers using burned-layer averages in Table 1 and composite averages in Table 2. Standard deviations tbr these averages range from 6% net loss for C in LD bums to 36% net loss ['or Mn in DM bums.
completely combusted (Tau of 70%, Figure 5). As a result, the concentration of Hg in the burned ash ~ char sample reflects the concentration of the layer to which it burned, whereas %C reflects both the remaining layer and the charcoal that resides in the ash.
[:4] While data in Figure 5 are tau-derived estimates of combustion using the averages of St, AI, and Fe as the stable constituent, individual combustion estimates for St, A1, and Fe alone vary anywhere from +25% (case of net Fe) to -.- 17% (case of net SiX These ranges represent all of the uncertainties associated with ash inheritance, elemental variations in unburned fuel and ash, as well as measurement errors. Tau wdues within about ±25% of zero should not be considered as significantly different from zero. For exam- pie, net changes in N and, in some cases (LD bums), P, K, Ca, and Ti are less than 25%. Nutrients or combustible elements (C, Hg) are unacceptable choices as stable con- stituents as they are subject to significant change during burning. Concentrations of ash (estimated as 100% - loss on ignition at 550°C) was used by Turetsky and ~i,ider [2001 ] and is a promising candidate for a stable constituent relative to organic matter as long as %C is detemained separately, especially for soil layers. We have chosen to use Fe, AI, and Si for our stable constiluenl (equation (1)) but recognize the opportunity to further explore other elements that might separate forest floor from canopy ash as well as stoichio- nletfic relationships of burning in general.
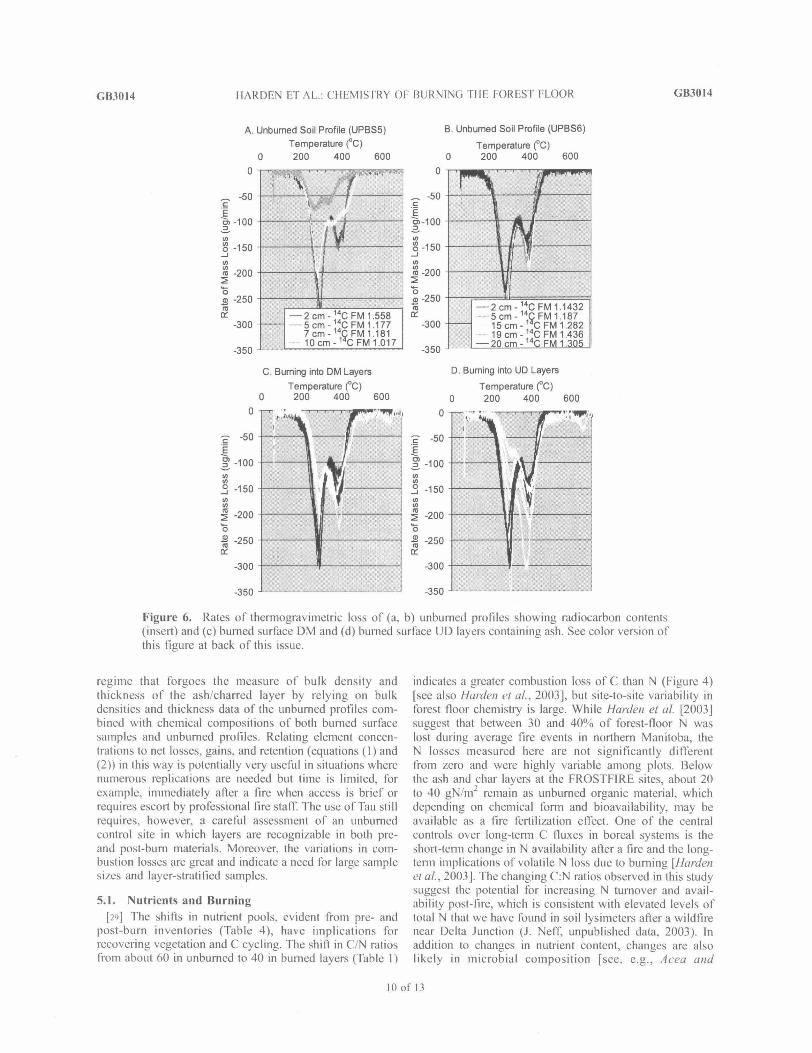
4.4. Structural Changes in Organic Matter [25] Organic layers of unburned profiles indicate two
major thernml-loss peaks that are derived from the moss and root material found near the soil surface (Figure 6a). In
one profile, these peaks persist for at least 4 decades as indicated by the enriched 14C of the bulk organics. In another profile, the deep, older layer contains only small amounts of either of the major peaks seen in shallow layers, which is a sign of decomposition. Surface asia-char layers indicate two themlal loss peaks in most cases (Figures 6c and 6d), but the first thennally labile peak occurs at a higher temperature than unburned layers (Figures 6c and 6d). The second peak is somewhat enhanced in burned samples bul also is obscured in severe fires, to almost merge with peak I (Figure 6d). The variability in peak area is greatest in the more severe fires that bumed to the U[) layers (Figure 6d).
5. Discussion
[2~,] Burning causes (1) large fluxes of combustible elements from terrestrial ecosystems to the atmosphere, (21 alteration of the physical state and arrangement of soils, and (3) changes in the chemical structure, nutrient content, and lability of residual organic matter. Changes in soil chemistry, pre- and post-burn indicate short-term fluxes of combustible elements such as C, N, and Hg (Table 4; Figure 5), and presumably O, H, and S during combustion. The loss of these elements li'om soils is accompanied by the physical "collapse" of noncombustible elements onto a thinner lbrest floor. Nutrient cycling is affected by physical rearrangement of both organic and mineral phases. The deeper organic soil layers are also impacted, both physically, through changes in density and exposure, and chemically, through inherilance of nutrients from the canopy ash. Combined with transtbrmations in structural chemistry and lability of the organic matter ("charring" effect), as well as albedo and active-layer thickening, these physical and chemical changes likely play a major role in boreal C and element cycling lbr several decades post-fire.
[27] There are basic differences in the way elements are vtdnerable to combustion. Here we used several statistical approaches to examine variations in element abundance belbre and after fire activity, including univariate models, correlation analyses, and multivariate analysis. On the basis of heterogeneity in both fuels and combustion severity, N appears to have complex and variable responses to burning ("Fables 3 and 4), perhaps in part because amino and aromatic structures can be combusted directly but can also form through coalification or distillation reactions during the wildfire. The close agreement of C and Hg combustion using Tau-calculations (Figure 5) suggests that Hg is corn- busted along with C and organic matter. While some Hg may enter the atmosphere in elemental lbnn, some Hg remains in particular tbnn in association with ash and char [Friedli et al., 2001]. However, soil Hg concentrations are not affected by burning ('Fables 1 and 3), suggesting that Hg lacks the charring eftlzcts seen for C (Table 1). Thus, while changes in weather and climate have been shown Io influence combustion, we add that various chemical and structural properties of soils can respond variably to fire activity on a relatively small scale.
[2s] Because of large spatial heterogeneity and the diffi- culty of sampling close in time to a burn, the methods presented here (use of Tau calculalions) allow a sampling
9 of 13
GB3014 flARDEN ET AI.,.: CHEMISTRY OF BURNING TItE FOREST FLOOR GB3014
A. Unbumed Soil Profile (UPBS5) B. Unbumed Soil Profile (UPBS6) Temperature (°C) Temperature (°C)
0 200 400 600 0 200 400 600 0 0 ~
-5O
E ~,~ -100
o, -150
-200
"6 -250
n -
-300
-350
C. Buming into DM Layers Temperature (°C)
0 200 400 600
~- -50 ~- E E
-lOO == == o, -15o o,
-2oo
-25o n ¢ n ,
-300
-350
-50
-100
-150
-200
-250
-300
-350
D. Burning into UD Layers
Temperature (°C) 0 200 400
0
0
600
Figure 6. Rates of thermogravimetric loss of (a, b) unburned profiles showing radiocarbon contents (insert) and (c) burned surtace DM and (d) burned surfhce UD layers containing ash, See color version of this figure at back of this issue.
regime that forgoes the measure of bulk density and thickness of the ash/charred layer by relying on bulk densities and thickness data of the unburned profiles com- bined with chemical compositions of both burned surface samples and unburned profiles. Relating element concen- trations to net losses, gains, and retention (equations (1) and (2)) in this way is potentially very" useful in situations where numerous replications are needed but time is limited, for example, inunediately after a fire when access is brief or requires escort by professional fire staff. The use of Tau still requires, however, a careful assessment of an unburned control site in which layers are recognizable in both pre- and post-burn materials. Moreover, the variations in corn- bustion losses are great and indicate a need for large s~,mple sizes and layer-stratified samples.
5.1. Nutrients and Burning [2,q The shifts in nutrient pools, evident from pre- and
post-burn inventories (Table 4), have implications tbr recovering vegetation and C cycling. The shift in C/N ratios from about 60 in unburned to 40 in burned layers (-Fable 1)
indicales a greater combustion loss of C than N (Figure 4) [see also Harden et al., 2003], but site-to-site variability in forest floor chemistl'y is large. While Harden et aL [2003] suggest that between 30 and 40% of forest-floor N was lost during average fire events in northern Manitoba, the N losses measured here are not significantly different from zero and were highly variable anaong plots. Below the ash and char layers at the FROSTFIRE sites, about 20 to 40 gN/m 2 remain as unburned organic material, which depending on chemical lbrm and bioavailability, may be available as a fire l~rtilization effect. One of the central controls over long-tenn (£ fluxes in boreal systems is the short-tern1 change in N availability after a fire and the long- tenu implications of volatile N loss due to burning [Harden et at., 2003]. The changing C:N ratios observed in this study suggest the potential for increasing N turnover and avail- ability post-fire, which is consistent with elevated levels of lotal N that we have found in soil lysirneters after a wildfire near Delta Junction (J. Neff, unpublished data, 2003). In addition to changes in nutrient content, changes are also likely in microbial composition [see, e.g., Acea and
10 of 13
GB3014 HARDEN ET AL.: CtIEMIS'I'RY OF BURNING TIIE FOREST FLOOR GB3014
-50
~-I00 == o -150
m -200
"6 .m -250 n,"
-300
-350
A. Unburned Soil Profile (UPBS5) Temperature (°C)
0 200 400 600 0
C. Burning into DM Layers Temperature (°C)
0 200 400 600
0 0
-5o ~- -5o
-lOO -lOO
o. -150 jo -150
-2oo -2oo "6 "6
-250 ~ -250 n" n,,
-300 -300
B. Unbumed Soil Profile (UPBS6)
Temperature (°C) 0 200 400 600
C FM 1.1432 52 cmCm'- 141411~, FM 1.187 t~
~ ..................... 15 cm - i C FM 1.282 ..... 19 c m - l : C FM 1.436
F M 1 0
D, Burning into UD Layers
Temperature (°C) 0 200 400 600
-350 -350
Figure 6. Rates of thermogmvimetric loss of (a, b) unburned profiles showing radiocarbon contents (insert) and (c) burned surfiace DM and (d) burned surface UD layers containing ash.
10 of 13
GB3014 HARDEN E:F AL.: CHEMISTRY OF BURNING THE FOREST FLOOR GB3014
Carballa~', 1996], and other physical effects, such as both tenaperature and available moisture in surl~ace soils, may impact nutrient cycling and availability post-fire [Viereck et aL, 1983; O'Neill et al., 2003].
[30] Across all soil layers, concentrations of P increased significantly with buming (Table I). Phosphorus concen- trations ranged from 0.7 to 10 g P/nil after the bum. Black spruce sY2stems utilize P at rates ranging from 0.02 to 0.12 g P/m/yr [Van Cleve et al., 1983], suggesting that fire-induced P fertilization can last anywhere ti'om 5 to 500 years for regrowing spruce. With greater nutrient demands, aspen would require 5 to I0 times as much P as spruce recovers, though this is expected to decline once a P stock of about 3 g P/m-" is stored in the mature aspen stand [Van Cleve et al., 1983]. While these num- bers suggest that P utilization by plants is variable, we show here that the spatial heterogeneity in ash and its P content also are variable.
5.2. Organic Matter Transformations [3t] Transformations of carbon compounds are evident
from combustion estimates and thern~ogravimetry. Schuur et al. [2003] used the isotopic composition of CO~ during the FROSTFIRE experiment to estimate combustion losses of 2.5 kg C/m". Similarly, the LOI-based combustion calcula- tion of Turetsl 9, and Welder [2001], as applied to the data of this experiment, resulted in an estimate of 3000 + 6200 g organic matter, which is 50% greater than the estimates based on Tau. Unburned live moss and dead moss layers contain about 45% C with about 97% LOI. whereas burned DM layers contain about 55°/'0 C with about 90% LOi (Tables I and 2). Thus fire alters the relationship between C and organic matter with depth in soil layers, and thernlally stabile C in ash might account Ibr differences between some combustion estimates.
[32] Thermogravilnetry lends some insights into the LOI- C shifts seen in burned samples. There is a shift of the first "thermolabile" mass-loss peak toward higher temperatures when unburned samples are compared to burned samples (Figure 6), and there is a shift at higher temperatures as well. On average, about 1.7 (:~d.91) mg of C were lost at temperatures between 550 and 1000°C for burned samples, whereas only 0.7 (+0.16) mg C were lost from the unburned layers at these high temperatures. Analyses of coal, which is derived from organic matter and fire ,ash, conventionally report mass-loss yields tbr both labile " S I " and chain or lignin-like "$2" forms [Marshall et al., 2002]. Using strict ("Rock-Eval" pyrolysis) definitions for SI (mass lost between 150 ° and 300°C) and $2 (mass lost between 300 ° and 500°C), we found the following mass loss percentages: unburned LM, DM, UD layers had 39 + 8 percent SI and 44 + 6 percent $2, whereas burned DM and UD layers (with ash) had 24 + 9 percent SI and 51 + 13 percent $2.
[33] Thermolabile fornls of Fig have been shown for temperatures <30°C, a fonn which is climatically sensitive [Martinez-Cortizas et al., 1999] and for much higher temperatures of 200 ° to 300°C, which typically indicates humus-bound or chloride-bonded Hg [Beister and Zimmer, 1998]. Our TG data (Figure 6) are consistent with the
combustion loss of, organic-bound forms of Hg. While burning of organic layers is not analogous to the genesis of coal, the effects of burning do indicate a reduction of the SI thermolabile pool and a slight increase in lignin-like [Marshall et al., 2002] structures. In the long tenn, the creation of biologically recalcitrant C pools during fires could play an important role in the decadal to millennial stabilization of carbon in these ecosystems.
[34] This "charring effect." while incomplete and hetero- geneous, necessitates a careful accounting and definition of organic carbon in unburned and burned samples in order to accurately estimate combustion losses. Fire-induced gener- ation of biologically labile and recalcitrant forms is unclear [see, e.g., Viereck et al., 1983; Acea attd Carballas, 1996; 0 'Neill et al., 2003; Schuur et al., 2003] as is correlation, if any, between thermolabile rind biologically labile forms of carbon, hnplications for microbial responses to the struc- tural transformations of organic compounds and to the element distributions are also unexplored, for example, enyzme activity requiring trace metals such as Ni may be enhanced by burning because of the enrichment of non- combustible nutrients onto the forest floor. Overall, higher C concentrations in charred material compared to unburned soils (Table 1) suggest that burning is a mechanism of C loss (Table 4). Changes in the relationship between C and organic matter concentrations, however, suggest that fires also help to contribute charcoal to the system; while someof this char may be short lived [Czimczik et al., 2003], other more stable fonns may contribute to Iong-terna terrestrial net ecosystem production.
5.3. Impacts of Combustion on Atanosphere and Terrestrial Systems
[35] Wildfire is a key agent of environmental change through its sensitivity to climate and its impact on the physical and thermal state of the soil, nutrient stocks, and nutrient availability. Physical and thermal impacts of fire are particularly profound in boreal forests because of the sensitivity of near-surface permafrost in these regions [Yoshikawa et al., 2002; Viereck et al., 1983; O'Neill et al., 2003]. The impacts of wildfire on boreal nutrients are also important because losses of N can limit the regrowth of forests after fire.
[3~,] Boreal wildfires may be a particularly large atmo- spheric source of rig [Friedli et aL, 2003]. Generally, boreal Ibrcsts are prone tO severe fires that consume much of the forest floor and that are particularly widespread [Kasischke anti Stocks', 2000]. Deeper organic layers found in wetter and colder cnvironrncnts have even greater stores of Hg than were reported for the UPBS sites in this report. For example, a poorly drained site at the base of the watershed had concentrations up to 360 ppm Hg in a lower duff Oa horizon at 35 to 29 cm depth (data not shown); with a bulk density of 0.25 g/cm 3, this layer alone could contribute 12 * 10 --'~ grin" of rig in the event of a severe fire. Like C, which in deep layers of many peats and wetlands is protected from fire in all but the driest periods [Tb/enen, 1985; Kuh~.., 1994; Harden et al., 2000; Carcaillet et aL, 2001], Hg in deep layers of wetland or pennafrost soils may reflect protection from fire by saturated conditions. In boreal
II oft3
GB3014 HARDEN ET AL.: CHEMISTRY OF BURNING THE FOREST FLOOR GB3014
lbrests, the areal extent of fires has varied tenfold as a result of summer drought cycles [Kasischke amt Stocks, 2000]. Therefore Hg emissions from these regions are potentially very large and extremely variable on decadal to century timescales when eventually the right conditions for severe fires are likely to occur. As methylaled fon'ns of Hg are found in lowland, wetland, and lacustrine settings and are a health hazard in these forms [Mahaffey, 1999], severe fires could potentially remove Hg from lowland sources and redistribute it in both ash and gaseous tbrms. Since most managed fires, however, are prescribed for wetter weather not conducive to wetland burns, the most significant redis- tribution is likely to originate from wildfires during extreme droughts of the fire season.
[37] Whether prescribed or mitigated, fires and fire man- agement policies have significant effects on atmospheric and terrestrial systems. Boreal wildfires could be a partic- ularly large atmospheric source of not only C and N but also Fig, as boreal forests are prone to severe fires that consume much of the forest floor. Implications lbr N redistribution by fire are great because most forests and rangelands include some type of fire policy and because many systems are N limited. Heterogeneity of both fuel types and fire behavior may furflter complicate our understanding of C, N, and Hg losses to fire. Therefore more data lbr landscape/fuel type/ fire behavior combinations are needed for newly burned, mature, and recovering ecosystems before we can develop predictive models and policies for estimating and managing C. N, or Hg stocks using fire.
[38] Acknowledgments. The competent organizers, fire fighters, fire escorts, and multitude of cooperative professionals made this sc.emingly small yet otherwise impossible study a reality. In addition, we are indebted to Terry Chopin and A. Dave McGuirc for inviting and hosting our late participation in the experiment, to Elliott Spiker for supporting their invitation, to USFS pct~onncl tbr welcoming and facilitating our involve- ment, and to R. Bolton, L. Hinzman, and D. Valentine for logistical support. Bill Cannon inspired the analysis of Hg in thcs'e sarnples. We flrank Jim Crock for analytical testing of Hg methods aod E. Kasischkc fbr review of an earlier draft. Funding" for this work was provided by NSF-LTER program and USGS Earth Surface Dynamics Program.
References Acea` M. J., and 1". Carballas (1996), Changes in physiological groups of
nficroorganisms in soil following wildfire. FEMS Mierobiol. Ecol., 20, 33-39.
Beistcr. H., and H. Zimmer (1998). Solubility and changes of mercury binding forms in contaminated soils alter immobilization trcatrnent, Environ. Set. TechnoLo 31, 2755--2763.
Brimhall, G. H., O. A. Chadwick, C. J. Lewis. W. Compston. I. S. Williams, K. J. Danti. W. E. Dietrich, M. E. Power. D. tlendricks, and J. Bratt (1992), Deformatioual mass transport and invasive processes in soil evo- lution. Science. 255(5045), 695-702.
Caoadian Agricultural Services Coordinating Cmnnfittee (1998). The Canadian System o f Soil Class!lh'ation, 3rd cd., 187 pp., NRC Cau. Res., Ottawa.
Careaillct, C., Y. Bergcron, E H. Richard, B. Frechette, S. Gauthier, and Y. T. Prairie (2000, Change of fire frequency in tire eastern Canadian boreal tbrests during the Holocene: Does vegetation composition or cli- mate trigger the fire regime?, J. Ecol.. 89, 930-9,16.
Conard, S. G.. and G. A. lvanova (1998), Wildfire in Russian boreal forests: Potential impacts of fire regime characteristics on emissions and global carbon balance estimates. Environ. Polha., 9& 305-313.
Crock, , J. G. F. E. Lichte, and P. H. Briggs (1983), Detcrufination of elements in National Bureau of Standards' geological reference mate- rials SRM 278 obsidian and SRM 688 hasah by inductively coupled argou plasma-atomic emission spectrometry, Geosmnd. Newsl., 7(2). 335-340.
Czimczik, C. I., C. M. Preston, M. W. I. Sehmidt, and E.-D. Schulze (2003). How surface fire in Siberian Scots pine forests affects soil organic carbon in the forest floor: Stocks, molecular strt.eture, and conversion to black carbon (charcoal), GIohal BirLt,,eo~'hem. Cj'cles, 17( I ), 1020, dot: I 0.1029/ 2002GB001956.
Driseoll, K. G., J. M. Aroccna, and H. B. Massicotte (1999), Post-fire nitrogen content and vegetation composition in sub-boreal spruce forests of British Columbia's central interior, Can. For Ecol. Manage., 121, 227.-.237.
Dyreness, C. T., anti R. A. Norum (1983), Tire effects of experimental fires on black spruce forest floors in interior Alaska, Can. J. l;'ot: Res., 13, 879--893.
French, N. H. F., E. S. Kasischkc, B. S. Lee, B. J. Stocks, and J. P. Mudd (2000), Carbon released during fires in North American boreal forests during the 1980's, in Fire. Climate Change and Carbon Cycling in North American Boreal Forests. EcwL Stud. Sel:, edited by E. S. Kasischke and B. J. Stocks. pp. 377-388, Springcr-Verlag. New York.
Friedli. H. R.. L. F. Radke. and J. Y. 'Lu (2001), Mercury in smoke ~ m biomass fires. Geophys. Res. Leo.. 28(17), 3223-3226.
Friedli, H. R., L. E Radke, R. Prescott, P. V. Hobbs, and E htha (2003), Mercury emissions from the August 2001 wildfires in Washington State and an agricuhural waste fire in Oregon and atmospheric mercury budget estimates, Global Biogeochem. C(ueles. 17(2), 1039, doi:10.1029/ 2002G B001972.
Gleixner, G.. N. Poirier, R. Bol, and G. Balesdent (2002), Molecular dynanfics of organic matter in a cultivated soil, Org. Geochem., 33, 357.-.366.
llarden, L W., S, E. Trumbore, B. J. Stocks, A. Hirseh, S. T. Gower. K. E O'Neill, and E. S. Kasischke (21X)0), The role of fire in the boreal carbon budget, (]lobal Change Biol., 6. suppl. I, 174-184.
Harden, J. W., M. Mack. H. Vcldhuis, and S. T. Gower (2003), Fire dynamics and implications for nitrugen cycling in boreal lbrests, ,1. Gee- phys. Res.. 108(D3). 8223. dot: I0.1029/2001JDO.00494.
llinzman. L. D., M. Fukuda` D. "4. Sandbcrg. E S. Chapin lit, and D. Dash (2(X)3), FROSTFIRE: An experimental approach to predicting the climate [bedbacks fi'om the changing boreal fire regime, J. Geophys. Res., 108(1 ), 8153. dot: I 0. 1029/2001JD000415.
Kasischkc, E. S., and B. J. Stocks (2000), Fire. Climate Change. and Carbon Cycling in the Boreal Forest, 461 pp.. Springcr-Verlag, New York.
Kuhry. P. (1994), "Hie role of fire in the development of Sphagnum- dominated peatlands in western boreal Canada, J. Ecol., 82, 899--910.
Liu, X., E Van Espen, F. Adanls. J. Cafiueyer, and W. Macnhaout (2000), Biomass burning in southern Africa: Individual particle characterization of atmospheric aerosols and savanna fire samples, J. Atmos. Chem.. 36, 135.
Luc, L.. and S. Luc (1998), Vegetation changes caused by recent fires in the northern boreal forest of eastern Canada. J. Veg. Sci.. 9, 483--492.
Mahaffey, K. R. (1999). Methyl mercury: A new look at the risks, Publ. Health Rep.. 114. 397--402.
Mantes. K. L.. J. W. Harden, S. R. Silva. E I.t. Briggs, and B. M. Sehmid (2002), Fate of carbon in Alaskan Landscapes" Project: Soil data from a chrouoscqucncc near Delta Junction, AK, U.S. Geol. Surv. Open File Rep., 02-62.
Marshall, C. P., G. S. Kamali Kannangam, M. A. Wilson, J.-P. Guerbois, B. Hartung-Kagi, and G. Hart (2002). Potential of thermogravimetric analysis coupE'd with mass spectrometry for the evaluation of kerogen in source rocks, Chem. Geol., 184, 185-.. 194.
Martincz-Cort izas, A., X. Pontevedra.Pombal, E. Garcia-Rdeja` J. C. Novoa- Munoz, and W. Shotyk (1999), Mercury in a Spanish peat bog: Archive of climate change and atmospheric metal deposition, Science, 284, 939- 942.
O'Neill, K. P., E. S. Kasischkc, and D. D. Richter (2003), Seasonal and decadal patterns of soil carbon uptake and emission along an age- sequence of burned black spruce stands iu irrterior Alaska, J. Geoplo~'. R~'.. 108(DI ), 8155, dot: 10.1029/2001JD000443.
Rapalce. G., S. E. Trurnbore, E. A. Davidson, J. W. Harden. arrd H. Veldhuis (199~L Soil (;arbon stocks and their rotes of accumnlation and loss in a boreal forest landscape. Global Biogeochem. Cycles. 12, 687-701.
Schimcl, J., and A. Granstrom (1989), Fire severity and vegetation response in the boreal Swedish forest, Ecologo" 77, 1436-1450.
Schuuq E. A. G., S. E. Trumborc, M. M. Mack, aud J. W. Harden (2003). Isotopic composition of carbon dioxide from a boreal forest fire: Inferring carbon loss from measurements and modeling, Global Biogeochem. (:)vies, /7(I), 1001, doi:10.1029/2001GB001840.
Soil Survey Staff(1998). Keys to Soil Tct~'onomy, 8th ed, 326 pp., U.S. Dep. of Agric.. Washington, D. C.
Stuiver, M.. and H. Polach (1977), Reporting of I'*C data, Radiocarbon, 19. 355 -363.
12 o f 13
GB3014 HARDEN ET AL.: CHEMISTRY OF BURNING THE FOREST FLOOR GB3014
Tolenen, M. (1985), Palacoecological record of local fire history from a peat deposit in SW Finland, Ann. Bot. Fenn., 22. 15-29.
Tmbaud, L. (1994). The efl~:ct of fire on nutrient losses and cycling in a Qucrcus coccit~ra garriguc (southern France). Oecoh~gia, 99, 379.
Turetsky, M. R., and R. K. Weider (2001), A direct approach and qnanti- tication of organic matter loss as a result of peatland wildlire. Can. J. Fo/: Res., 31. 363--366.
Van Cleve, K. (1973), Short-term growth response to fertilization in young quaking aspen, ./. FoJ:, 71. 758--759.
Van Cleve. K., and L. K. Oliver (1982). Growlh response of postfire quaking aspen to N, P and K fertilization, Can..I. F(m Res.. 12, 160-- 165.
~,an Clevc. K., L. Oliver, R. Schlenmcr, U A. Vicreck, and C. "!: Dymess (19831, Productivity and nutrient cycling in taiga forest ecosystems. (7an. J. Fro: Re.~'., 13. 747--766.
Van Wyk. D, B,, W. Lcsch, and W. D. Stock (1992), Fire and catchment chemical budgets, EcoL Stud Anal Synth., 93. 240-257.
Viereck, L. A., C. T. Dyrness, K. Van Clcve. and M. J. Footc (1983), Vegetatiofi, soils, and forest productivity in selected lbrest types in inter- ior Alaska, Can. J. For Res.. 13, 703-.720.
Vogel, J. S. (I 992), A rapid method for preparation of biomedical targets for AMS, Radiocarbon, 34. 344-350.
Wan. S., S. Hui, and Y. Luo (2001). Fire effects on ecosystem nitrogen dynamics: A mere-analysis, Ecol. Appl.. 11(5). 1349-1365.
White, A. F., A. E. Blum. M. S. Schulz, T. D. Bullen, J. W. Harden, and M. L. Pe tc~n (1996), Chemical weathering rates of a soil chmnose- qucncc on granitic alluvium: I. Quantification of mineralogical and surface area changes and calculation of primary silicate reaction rates, Geochim. Cosmochim. Acta, 60. 2533-2550.
Yoshikawa. K., W. R. Bolton, V. E. Romanovsky. M. Fukuda. and L. D. I linzman (2002), impacts of wildfire on the permafrost in die boreal forest,s of interior Alaska` J. Geoph.vs. Res.. 107(DI), 8148, doi: I 0.1029/ 2001J D000438.


![FOREST STRUCTURE ON BIRD SPECIES COMPOSITION IN … · on forest resources for livelihood [1]. Given the rapid population growth and ensuing increased ... unsustainable, with burning,](https://static.documents.pub/doc/80x56/5f27ad84f98f92669c4ed617/forest-structure-on-bird-species-composition-in-on-forest-resources-for-livelihood.jpg)


