34
Child Poverty Dynamics and Income Mobility in Europe Yekaterina Chzhen, Emilia Toczydlowska and Sudhanshu Handa Office of Research - Innocenti Working Paper WP-2016-16 | April 2016

Child Poverty Dynamicsand Income Mobility in Europe
Yekaterina Chzhen, Emilia Toczydlowskaand Sudhanshu Handa
Office of Research - Innocenti Working Paper
WP-2016-16 | April 2016
IWP16 - CHILD POVERTY DYNAMICS.qxp_Layout 1 12/04/16 13:22 Pagina 1

INNOCENTI WORKING PAPERS
UNICEF Office of Research Working Papers are intended to disseminate initial researchcontributions within the programme of work, addressing social, economic and institutional aspectsof the realization of the human rights of children.
The findings, interpretations and conclusions expressed in this paper are those of the authors anddo not necessarily reflect the policies or views of UNICEF.
This paper has been peer reviewed both externally and within UNICEF.
The text has not been edited to official publications standards and UNICEF accepts no responsibilityfor errors.
Extracts from this publication may be freely reproduced with due acknowledgement. Requeststo utilize larger portions or the full publication should be addressed to the Communication Unitat [email protected].
For readers wishing to cite this document we suggest the following form:
Chzhen, Y., E. Toczydlowska and S. Handa (2016). Child Poverty Dynamics and Income Mobilityin Europe, Innocenti Working Paper No.2016-16, UNICEF Office of Research, Florence.
© 2016 United Nations Children’s Fund (UNICEF)
ISSN: 1014-7837
2
IWP16 - CHILD POVERTY DYNAMICS.qxp_Layout 1 12/04/16 13:22 Pagina 2

THE UNICEF OFFICE OF RESEARCH – INNOCENTI
In 1988 the United Nations Children’s Fund (UNICEF) established a research centre to supportits advocacy for children worldwide and to identify and research current and future areasof UNICEF’s work. The prime objectives of the Office of Research are to improve internationalunderstanding of issues relating to children’s rights and to help facilitate full implementation of theConvention on the Rights of the Child in developing, middle-income and industrialized countries.
The Office aims to set out a comprehensive framework for research and knowledge withinthe organization, in support of its global programmes and policies. Through strengthening researchpartnerships with leading academic institutions and development networks in both the North andSouth, the Office seeks to leverage additional resources and influence in support of effortstowards policy reform in favour of children.
Publications produced by the Office are contributions to a global debate on children and child rightsissues and include a wide range of opinions. For that reason, some publications may notnecessarily reflect UNICEF policies or approaches on some topics. The views expressed are those ofthe authors and/or editors and are published in order to stimulate further dialogue on child rights.
The Office collaborates with its host institution in Florence, the Istituto degli Innocenti, in selectedareas of work. Core funding is provided by the Government of Italy, while financial supportfor specific projects is also provided by other governments, international institutions andprivate sources, including UNICEF National Committees.
Extracts from this publication may be freely reproduced with due acknowledgement. Requeststo translate the publication in its entirety should be addressed to: Communications Unit,[email protected].
For further information and to download or order this and other publications, please visitthe website at www.unicef-irc.org.
Correspondence should be addressed to:
UNICEF Office of Research - InnocentiPiazza SS. Annunziata, 1250122 Florence, ItalyTel: (+39) 055 20 330Fax: (+39) 055 2033 [email protected]@UNICEFInnocentifacebook.com/UnicefOfficeofResearchInnocenti
3
IWP16 - CHILD POVERTY DYNAMICS.qxp_Layout 1 12/04/16 13:22 Pagina 3

CHILD POVERTY DYNAMICS AND INCOME MOBILITY IN EUROPE
Yekaterina Chzhen, Emilia Toczydlowska, Sudhanshu HandaUNICEF Office of Research – Innocenti, Florence, Italy
Abstract:While a long-standing literature analyses cross-country variation in the incidence of child povertyin rich countries in a single year, less is known about children’s individual movements into and out oflow household income over a period of time. Using longitudinal data from the European Union Statisticson Income and Living Conditions (EU-SILC), the present study addresses this gap by analysing both incomemobility and child poverty dynamics in the EU during the recent economic crisis. It finds that income growthamong children has been generally pro-poor but not sufficiently so to put a brake on the increasing incomeinequality. There is substantial heterogeneity among the EU-SILC countries in the rates of child poverty entryand exit. Scandinavian countries tend to combine lower exit and entry rates, while Southern andEastern European countries tend to have higher rates of both poverty exit and entry. Household-level incomeevents, i.e. relative growth in employee earnings, are found to be the most important predictors of transitionsin and out of poverty, followed by employment events (i.e. changes in the number of adult workers),while the relatively rare demographic events have little bearing on child poverty transitions in the EU-SILC.
Keywords: child poverty dynamics, income mobility, EU-SILC longitudinal study.
Acknowledgements:The authors would like to thank Jonathan Bradshaw, Sara Ayllón Gatnauand Philippe Van Kerm for their helpful comments on an earlier draft of this paper.
Country Abbreviations
AT Austria
AU Australia
BE Belgium
BG Bulgaria
CH Switzerland
CY Cyprus
CZ Czech Republic
DK Denmark
EE Estonia
ES Spain
FI Finland
FR France
HR Croatia
HU Hungary
4
IS Iceland
IT Italy
LT Lithuania
LU Luxembourg
LV Latvia
MT Malta
NL Netherlands
NO Norway
PL Poland
PT Portugal
SI Slovenia
SK Slovakia
UK United Kingdom
IWP16 - CHILD POVERTY DYNAMICS.qxp_Layout 1 12/04/16 13:22 Pagina 4

TABLE OF CONTENTS
1. Introduction ......................................................................................................................... 6
2. Research on income mobility and poverty dynamics ...................................................... 6
3. Data and methods ............................................................................................................... 9
4. Results ................................................................................................................................ 14
5. Conclusion ......................................................................................................................... 27
References ............................................................................................................................... 29
Annex ....................................................................................................................................... 32
5
IWP16 - CHILD POVERTY DYNAMICS.qxp_Layout 1 12/04/16 13:22 Pagina 5

6
Child Poverty Dynamics and Income Mobility in EuropeInnocenti Working Paper 2016-16
1. INTRODUCTION
While a long-standing literature analyses cross-country variation in the incidence of child povertyin rich countries at a point in time (see Cornia and Danziger 1997; Vleminckx and Smeeding 2001;UNICEF Innocenti Research Centre 2012), less is known about child poverty dynamics – children’sindividual movements into and out of low household income over a period of time. Yet to understandthe causes and consequences of monetary child poverty and to design effective anti-povertypolicies, it matters if the same group of children remain poor or if every child experiences one briefpoverty spell. Adverse consequences of experiencing poverty are well documented and the lengthof time spent in poverty amplifies its negative impact on key child outcomes (see Brooks-Gunnand Duncan 1997), including cognitive and behavioural development.
However, cross-country comparative studies of children’s transitions in and out of low income acrossthe enlarged European Union (EU) are sorely lacking. A recent comprehensive review of incomemobility in the European Union by Van Kerm and Pi Alperin (2013) does not focus on children.Although several studies analyse child poverty dynamics in single countries (e.g. Ashworth et al. 1994for the United States (US); Ayllón 2015a for Spain; for the United Kingdom (UK) Bradshaw andHolmes 2010; Cantó and Mercader-Prats 2002; Jenkins and Schluter 2003 for Germany and the UK),cross-country studies of child poverty transitions are rare (Duncan et al. 1993; Bradbury et al. 2001).Yet a cross-national perspective provides reference points for national results. It also helps explorethe effects of varied policy environments or, at the very least, formulate relevant questions aboutpolicy effects (see Valletta 2006).
The present study aims to address these research gaps, using longitudinal data from theEuropean Union Statistics on Income and Living Conditions (EU-SILC). The analysis focuseson both income mobility and child poverty dynamics in the EU during the recent economic crisis.The study analyses the extent of mobility along deciles of the income distribution, investigates ifincome growth among children has been pro-poor and if income mobility may have offset incomeinequality among children. The study then goes on to analyse transitions in and out of incomepoverty as well as the associated effects of household-level income, employment and demographicevents in 20 EU countries, using relative country-specific poverty lines anchored in the pre-crisisperiod (i.e. 2008). The following section reviews the key literature on income mobility and povertydynamics. We then describe the data and methods used, present the results and conclude.
2. RESEARCH ON INCOME MOBILITY AND POVERTY DYNAMICS
2.1 Income mobility
To our knowledge there are no cross-country comparative studies that analyse income mobilityamong children in Europe, although there is growing income mobility literature focusing on adults.In one of the few EU-wide comparative income mobility analyses, Ayala and Sastre (2008) useddata from the European Community Household Panel (ECHP) for the period 1993-1997 to compareincome mobility in France, Germany, Italy, Spain and the UK. Based on a balanced five-year panelin each of the countries, they observe higher income volatility in Spain, Italy and the UK
IWP16 - CHILD POVERTY DYNAMICS.qxp_Layout 1 12/04/16 13:22 Pagina 6

7
Child Poverty Dynamics and Income Mobility in EuropeInnocenti Working Paper 2016-16
than in Germany and France. Mobility comparisons by Gangl (2005) involved eleven EU countriesand the United States. The study found lower levels of income mobility in Germany, Ireland, and theUnited States than in the Netherlands and Denmark. Remarkably, “low-inequality countries . . . alsotend to be the countries exhibiting the lowest degree of persistence in income inequality over time”(Gangl 2005, p. 151). Germany was an exception, as it combined low inequality with low mobility.These findings are consistent with those of Gregg and Vittori (2009) who examined the mobilityin labour earnings of individuals aged 20–64 in Denmark, Germany, Italy, Spain and the UK,also using ECHP data. Longer-term earnings inequality reduction was greatest in Denmark followedby Italy. Germany was the least mobile, with Spain and the UK in between.
What is the relationship between income mobility and income inequality? Riener (2012) investigatedthe extent to which declines in inequality are directly related to the frequency and magnitude ofrelative income variations, using ECHP data for 13 European countries. He shows a negativerelationship between total relative mobility and long-run income equalization. Higher incomemobility does not necessary imply lower inequality. The study also found that higher levels ofincome transfer, which is defined as redistribution from richer to poorer households, also meanta higher equalization of incomes in the EU-13.
Using longitudinal data for 26 EU countries from the EU-SILC 2003-2007, Van Kerm andPi Alperin (2013) illustrate that newer EU member states experience faster growth in individualincomes than older EU members and that income growth was pro-poor in all countries. They find noevidence that countries with higher (cross-sectional) inequality compensate for it with higher mobility.Hence, the findings suggest that income mobility does not reduce income inequality in the short run.
Aristei and Perugini (2015a) analyse short-term income mobility in 25 European countries andobserve a positive relationship between the countries’ income mobility and inequality and anegative one between mobility and development levels. Countries have been classified intosix groups as they share several important features. Countries with the Social-Democratic regimeshow low mobility and low inequality. On the contrary, more liberal Anglo-Saxon and Balticcountries present the highest levels of mobility. Continental European countries hold theirintermediate position. Mediterranean countries show more varied results, with Spain and Greeceapproaching the top and Italy and Portugal the bottom tails of income mobility.
Most recently, Aristei and Perugini (2015b) use longitudinal data from the EU-SILC to analyseshort-term income mobility prior to and after the economic crisis in 26 European countries focusingon the data sets covering the period 2004-2007 and 2008-2011. Using the Fields and Ok index,further decomposed into growth and a transfer component, the authors illustrate that 4 years priorto the crisis, income volatility was the highest in the countries of the Baltic region, followed byPoland and Bulgaria. In the remaining countries of Central-Eastern Europe, with the exceptionof Slovenia, mobility was close to the average of the sample recorded for the Social Democraticcountries. In most of the transition countries the growth component largely prevails over thetransfer component, reflecting their high growth rates (Aristei and Perugini 2015b, p. 137).Over the crisis the situation changed. The same countries still illustrate the highest rates of mobilitybut the rates were lower due to the shrinkage of the growth component.
IWP16 - CHILD POVERTY DYNAMICS.qxp_Layout 1 12/04/16 13:22 Pagina 7

8
Child Poverty Dynamics and Income Mobility in EuropeInnocenti Working Paper 2016-16
Alves and Martins (2012) analysis in “Mobility and Income Inequality in the European Union”, basedon information from the EU-SILC database for the period 2005-2009 illustrate that in all the countriesthere are sizeable income variations with substantial mobility between the various income deciles.Income mobility is concentrated on transitions between adjacent deciles with the smallest rates oftransitions being detected in the lowest and highest deciles of the income distribution. The evidencesuggests that lower mobility is linked to the higher age brackets and that the highest mobility,both upwards and downwards, occurs in individuals aged between 20 and 40 years.
2.2 Poverty dynamics
In a seminal work on child poverty dynamics, Bradbury et al (2001) analysed movements in and outof low income across seven industrialized countries in the mid-1990s, using data from nationallongitudinal surveys. The study demonstrated why focusing exclusively on the cross-sectional pictureof child poverty incidence may paint a misleading picture of economic disadvantage among children.However, Bradbury et al did not analyse predictors of child poverty transitions except for recordinglower poverty exit rates and higher entry rates for children in lone parent families. Yet identifyingthe key determinants of poverty transitions helps target policies more effectively. For example,if unemployment events are the main driver of transitions into poverty, unemployment benefits needto be more effective in cushioning incomes at times of job loss, but if demographic events(e.g. child birth) are the main triggers of poverty, family benefits and services have to play a larger role.
Following Bane and Ellwood’s (1983) pioneering study of non-pensioner household poverty dynamicsin the US between 1972 and 1981, the literature tends to distinguish between demographic andeconomic events as predictors of transitions into and out of poverty. Demographic events concernchanges in household needs (i.e. household size and composition) due to births, deaths,divorce/separation, moving out of the parental home, etc., while income events refer to changes inhousehold income components. Bane and Ellwood found that, although income events dominated,the effects of demographic events were non-trivial and for some groups could be particularly large forthe risks of entering poverty. A recent analysis of poverty transitions in Europe (Vandecasteele 2011)showed that the poverty-triggering effects of demographic (‘life course’) events are larger for moredisadvantaged social strata. In a study of poverty dynamics among households with children in eightindustrialized countries, using national panel surveys, Duncan et al (1993) distinguished between theeffects of demographic, employment (i.e. “job gain”; “more work”) and social insurance events(i.e. starting/stopping receiving social insurance benefits) and found that employment events werethe most important triggers of both poverty entries and exits.
Cross-national studies of poverty dynamics that rely on separate national longitudinal surveysinevitably face challenges to comparability due to different panel lengths (i.e. the number oftimes/years the same individuals/households are interviewed), measurement of income and otherkey variables as well as sampling and ‘tracing’ rules (i.e. on following up individuals who split fromtheir original households). The introduction of the European Community Household Panel (ECHP)in 1994, which covered the then EU member states and used harmonised data collection proceduresin all of them, made highly comparable cross-country analysis of poverty dynamics possible,
IWP16 - CHILD POVERTY DYNAMICS.qxp_Layout 1 12/04/16 13:22 Pagina 8

9
Child Poverty Dynamics and Income Mobility in EuropeInnocenti Working Paper 2016-16
but the panel completed in 2001. Data from the ECHP were extensively used to analyse cross-country differences in poverty dynamics, but not specifically among children. Fouarge and Layte(2005) studied welfare regime variation in household-based recurrent and persistent poverty rates,Layte and Whelan (2002) examined cross-country differences in the effects of household-levelevents on poverty transitions, Callens and Croux (2009) analysed predictors of poverty transitionsseparately for adult men and women, while Mendola et al (2009) and, more recently, Ayllon (2015b)studied poverty persistence among young adults in Europe.
There was no EU-wide longitudinal living conditions survey between 2001 and 2005, when theEU-SILC rolled out. However, as a four-year rotational panel it has a much shorter observation periodthan the ECHP. Although it is suited to studying short-term poverty transitions, it is less useful for theanalysis of longer-term trajectories in recurrent or persistent poverty (European Commission 2012,p. 164). As a first study to include the new EU member states, Polin and Raitano (2014) used theEU-SILC 2005-2007 to analyse the effects of demographic and economic events on poverty transitionsin six groups of countries (by region/welfare regime). Consistently with the literature, they foundthat economic events dominated, but demographic triggers were important to poverty entries.Andriopoulou and Tsakloglou (2015) used both the ECHP 1994-2001 and the EU-SILC 2005-2008 toanalyse the effects of employment, income (i.e. changes in earnings) and demographic events onadults’ movements in and out of poverty in all EU countries that had valid data. They found thatchanges in labour earnings of the household head is a consistent predictor of poverty transitions in allcountries, but more so in the Mediterranean ones; employment events matter more for poverty exitsthan entries; and demographic events are somewhat more important in Scandinavian countries.
The present study builds on and contributes to the comparative literature on poverty dynamics ina number of ways. First, it uses children, rather than adults or households, as units of analysis.Second, it uses cross-country comparable data from the longitudinal EU-SILC 2008-2013 for adiverse sample of 20 EU countries. Third, it focuses on the effects of employment, income anddemographic transitions on poverty entry and exit in a multivariate regression framework andanalyses their relative importance in different countries. We expect that employment income eventsdominate in all countries, but more so in Eastern and Southern European countries with lesscomprehensive social protection systems. Demographic events are not likely to bear much weightbecause of their rarer occurrence in a short observation period. To our knowledge, ours is the firstlongitudinal analysis of the effects of household-level events on child poverty transitions inthe enlarged EU during the economic crisis and the ensuing period of slow recovery and austerity.
3. DATA AND METHODS
3.1 Data
We use panel data from the EU-SILC – a large-scale household-based living conditions surveycovering all EU member states. It is a four-year rotational panel with one-fourth of the samplereplaced every year. See Iacovou and Lynn (2013) for more details about the EU-SILC rules forfollowing individuals and households from one wave to the next. Individuals who move out of the
IWP16 - CHILD POVERTY DYNAMICS.qxp_Layout 1 12/04/16 13:22 Pagina 9

10
Child Poverty Dynamics and Income Mobility in EuropeInnocenti Working Paper 2016-16
original household are not always followed up and the extent to which they are varies acrosscountries. Thus, our analysis of associations between demographic and poverty transitions needsto be interpreted with caution.
The analysis of income mobility is based on data from the following four rotations of the EU-SILC:2006-2009, 2008-2011, 2009-2012 and 2010-2013. The earliest panel represents the conditions justbefore the start of the global economic crisis, while the three most recent panels overlap withthe crisis. We then use data from the latest panel only, i.e. 2010-2013, to analyse child povertytransitions. It captures the situation during the economic crisis. Household income refers tothe calendar year preceding the interview for all EU countries except Ireland and the UK, which usecontemporary income, but there is no data for the UK in the EU-SILC 2010-2013.
For analysis of income mobility, we use 24 European countries.1We distinguish between new andold EU member states based on whether they entered the EU before 2004. We then excluded theCzech Republic, Lithuania and Poland from multivariate analysis of poverty entries because theydo not treat employee income consistently (e.g. before or after taxes and contributions) across allrespondents and all years under observation. We also excluded Norway because of the lownumbers of transitions in and out of poverty. There are thus 20 countries in the multivariate analysisof transitions into poverty, but only three countries have sufficiently large sample sizes (of at least1,000 observations) for the analysis of child poverty exits: Hungary, Italy and the UK.
3.2 Variables
The dependent variable in all our analyses is disposable household income after taxes and transfersadjusted for household size and composition using the ‘modified OECD scale’. Income mobilityanalysis relates to individual income, as each child or adult over 65 years is assigned his orher household’s income.
For the analysis of child poverty dynamics, we calculate the relative poverty lines (60% ofthe national median income) using the nationally representative cross-sectional EU-SILC 2008,then inflate the 2008 poverty lines using harmonised consumer prices indices published by Eurostatand apply them to the 2010-2013 longitudinal data to construct poverty indicators. In other words,we ‘anchor’ the poverty lines in 2008. Although we re-do the analysis using ‘floating’ relativepoverty lines based on contemporary national median incomes as a robustness check, we focuson anchored poverty because it is consistent with our income mobility analysis which is donein real, rather than nominal, terms. Moreover, since the studied period of 2010-2013 covers theeconomic crisis and the ensuing spell of slow and uneven recovery, when median incomesstagnated or fell in many countries, fixing the poverty line in a pre-crisis survey year (2008) allowsfor a more consistent comparison of living conditions over time. Thus we keep the goal posts fixedrather than moving them around.
1 Analysis of the longitudinal EU-SILC 2010-2013 and 2009-2012 data sets includes all countries of the EU-27 exceptGermany, Greece, Ireland, Romania and Sweden plus Iceland and Norway. Analysis of the longitudinalEU-SILC 2008-2011 includes all countries of the EU-27 except Germany, Greece, Ireland, Luxembourg, Romania andSweden plus Iceland and Norway. Analysis of the longitudinal EU-SILC 2006-2009 includes all countries of the EU-27except Bulgaria, Germany, Greece, Ireland, Luxembourg, Malta, Romania and Sweden plus Iceland and Norway.
IWP16 - CHILD POVERTY DYNAMICS.qxp_Layout 1 12/04/16 13:22 Pagina 10

11
Child Poverty Dynamics and Income Mobility in EuropeInnocenti Working Paper 2016-16
To model transitions into and out of poverty, we are mainly interested in the effects of employment,income and demographic events. We define employment events as changes in the number ofemployed individuals aged 16 or over (i.e. interviewed as adults in the EU-SILC) between any twoconsecutive waves, t and t+1. Using the self-reported economic status item, we define ‘work’ as anyemployment or self-employment (whether part-time or full-time) and construct a variable with thefollowing mutually exclusive categories: “same number of adults in work as last year”, “fewer adultsin work”, “more adults in work”, “still a jobless household” and “no longer a jobless household”.Thus the first three categories refer to households where at least one adult is in work at time t andthe last two categories refer to jobless households (where nobody reports employment orself-employment) at time t.
We define income events as changes in total employee income aggregated across householdmembers and divided by the ‘equivalent’ household size. Employee income is recorded in theEU-SILC as either net, gross or anything in between (e.g. net of social security contributions but notof taxes). As long as employee income is treated the same way within the same country acrossall years under observation, it does not matter whether it is net or gross because we look at relativeper cent changes in employee income between two consecutive years. We excluded theCzech Republic, Lithuania and Poland from multivariate analysis of poverty transitions due toinconsistencies in the treatment of employee income. Relative changes in equivalent employeeincome within 5 per cent are coded as “no change”, while decreases (increases) in employee incomein excess of 5 per cent are coded as decreases (increases) in non-zero employee income.Households with zero employment income in both years are coded as having “no employeeincome”, while those that had zero income at time t and any positive employment income attime t+1 are coded as having an “increase from zero employee income”.
We control for two types of demographic events, both very rare in the four-year panel: changes inthe number of children under 18 and transitions to and from lone parenthood. The vast majorityof households have the same number of children in any two consecutive waves. Increases in thenumber of children are driven by new births rather than children moving in, while decreases inthe number of children are due to 17-year-olds ‘ageing out’ from the child sample by turning 18.Most of these children remain in the same household but are no longer included as units of analysisin the estimation of child poverty transitions. We also control for whether a household has threeor more children under 18 (“large family”) at time t.
Lone parent households are those that contain one or more lone parent family unit. The vast majoritycontain just one lone parent unit. Following Chzhen and Bradshaw (2012), lone parents are individualswith their own (biological/adopted/step) children in the household but without a co-resident partner,as well as single adults living with children under 18 in the household who are not their own(e.g. grandparents with children under 18). Very few individuals make a transition to lone parenthood(through partnership dissolution or a birth/adoption without a partner) during the observation period,but some make a transition from a lone parent to couple family by having a partner move in.
IWP16 - CHILD POVERTY DYNAMICS.qxp_Layout 1 12/04/16 13:22 Pagina 11
12
Child Poverty Dynamics and Income Mobility in EuropeInnocenti Working Paper 2016-16
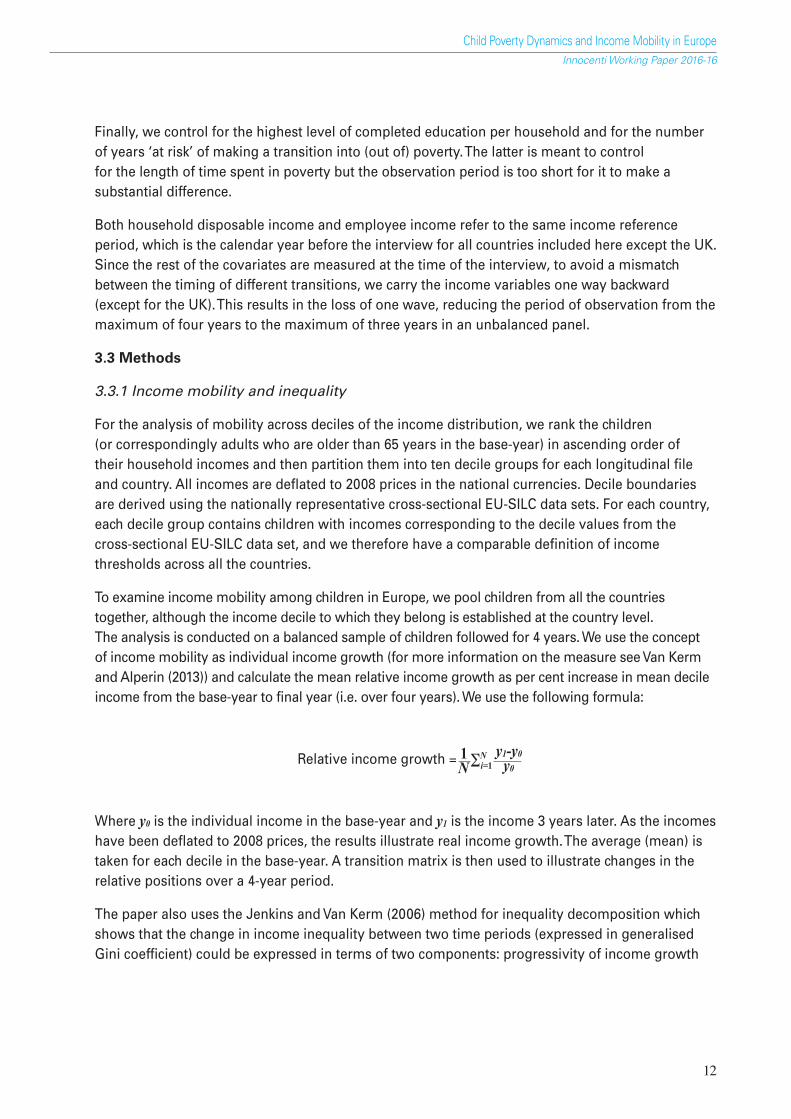
Finally, we control for the highest level of completed education per household and for the numberof years ‘at risk’ of making a transition into (out of) poverty. The latter is meant to controlfor the length of time spent in poverty but the observation period is too short for it to make asubstantial difference.
Both household disposable income and employee income refer to the same income referenceperiod, which is the calendar year before the interview for all countries included here except the UK.Since the rest of the covariates are measured at the time of the interview, to avoid a mismatchbetween the timing of different transitions, we carry the income variables one way backward(except for the UK). This results in the loss of one wave, reducing the period of observation from themaximum of four years to the maximum of three years in an unbalanced panel.
3.3 Methods
3.3.1 Income mobility and inequality
For the analysis of mobility across deciles of the income distribution, we rank the children(or correspondingly adults who are older than 65 years in the base-year) in ascending order oftheir household incomes and then partition them into ten decile groups for each longitudinal fileand country. All incomes are deflated to 2008 prices in the national currencies. Decile boundariesare derived using the nationally representative cross-sectional EU-SILC data sets. For each country,each decile group contains children with incomes corresponding to the decile values from thecross-sectional EU-SILC data set, and we therefore have a comparable definition of incomethresholds across all the countries.
To examine income mobility among children in Europe, we pool children from all the countriestogether, although the income decile to which they belong is established at the country level.The analysis is conducted on a balanced sample of children followed for 4 years. We use the conceptof income mobility as individual income growth (for more information on the measure see Van Kermand Alperin (2013)) and calculate the mean relative income growth as per cent increase in mean decileincome from the base-year to final year (i.e. over four years). We use the following formula:
Relative income growth = 1NΣNi=1
y1-y0y0
Where y0 is the individual income in the base-year and y1 is the income 3 years later. As the incomeshave been deflated to 2008 prices, the results illustrate real income growth. The average (mean) istaken for each decile in the base-year. A transition matrix is then used to illustrate changes in therelative positions over a 4-year period.
The paper also uses the Jenkins and Van Kerm (2006) method for inequality decomposition whichshows that the change in income inequality between two time periods (expressed in generalisedGini coefficient) could be expressed in terms of two components: progressivity of income growth
IWP16 - CHILD POVERTY DYNAMICS.qxp_Layout 1 12/04/16 13:22 Pagina 12

13
Child Poverty Dynamics and Income Mobility in EuropeInnocenti Working Paper 2016-16
and a measure of re-ranking. The former is an indicator of how much growth has disproportionatelybenefited individuals towards the bottom of the distribution in the initial time period. The lattercaptures how much progressive income growth has led to re-ranking between individuals, so thatthe net reduction in inequality is the difference between the two. Let G1 and G2 denote the Ginicoefficient of subsequently first and second point in time income and C1
2 denote the concentrationcoefficient for the first point in time income calculated using second point in time fractional ranks.Jenkins and Van Kerm (2006) show that:
ΔG = G2 - G1 = R - V
where R = G2 - C12 and V = G1 - C1
2
V is the measure of the progressivity and R is an index of mobility in the form of re-ranking. In theabsence of re-ranking, the reduction in inequality is exclusively determined by the size andprogressivity of the income changes illustrated by V. Hence inequality is reduced by pro-poorincome growth unless more than offset by concomitant income mobility.
3.3.2 Child poverty dynamics
To analyse children’s transitions into and out of poverty, the EU-SILC data are transformed into a‘long format’ person-period file so that each row refers to a child i in period t. First, transitionmatrixes are estimated, separately by country. This shows the raw (transition) probabilities ofmoving into poverty or remaining non-poor at time t+1 for children in households that are non-poorat time t as well as the probabilities of moving out of poverty as opposed to remaining poorat time t+1 for children in households that are poor at time t. We are particularly interested in thosewho make a transition into poverty and those who remain in poverty in two consecutive waves.The former indicates the risk of becoming poor during the relatively short observation period,while the latter indicates the persistence2 of poverty.
Discrete time event history analysis is used to estimate the probability of entering poverty (exitingfrom poverty) between any two successive sweeps, conditional on being non-poor (poor) at time t,using logistic regression models. The dependent variable in the ‘poverty entry’ model is a changefrom poverty status 0 (‘non-poor’) at time t to poverty status 1 (‘poor’) at time t+1, and the reverseis the dependent variable in the ‘exit’ model. In the ‘poverty entry’ model, for each time period twhen a household’s equivalent income is above the poverty line and so a resident child is at risk ofmoving into poverty by the following wave, there is a binary response yit showing whether inthe ensuing period the household’s income is still above that year’s poverty line (0) or belowthe poverty line (1). The latter denotes a transition into poverty. If the household no longer appearsin the study at t+1, yit is set to zero (i.e. it is a ‘right-censored’ observation). Thus, the transitionvariable yit is constructed at the level of the household, but only children under 18 are includedin the regressions. The last wave when a household is observed is used to construct the transitionvariables, but is not used in the regression analysis itself.
2 Note that we do not use the EU definition of persistent poverty here (the share of people who are currently poor andwere poor also in 2 out of the 3 previous years), since we focus on transitions between any two consecutive waves.However, we report the persistent poverty rates published by the EU in Figure 3 for comparison.
IWP16 - CHILD POVERTY DYNAMICS.qxp_Layout 1 12/04/16 13:22 Pagina 13

14
Child Poverty Dynamics and Income Mobility in EuropeInnocenti Working Paper 2016-16
Since we use an unbalanced panel, households can remain at risk of making a poverty transitionfor a different number of years. Those that were present in only one wave are all excluded fromthe analysis because there is no information about their next year’s income. Those who are presentin only two waves have incomes carried backward from the second wave but there is noinformation about making a transition by the third wave, so they are also censored (yit= 0 for allof them and, therefore, they drop out from the regression estimation). Only households in the UKcan remain in the analysis if they are observed in two waves only. Households with validinformation in all four waves can be at risk of moving into or out of poverty for one, two or threewaves in the UK and for one or two waves in the rest of the countries.
4. RESULTS
4.1 Household income mobility among children
Figure 1 (page 15) presents household income growth across deciles of the distribution for childrenunder 18 in EU countries for four periods: 2006-2009, 2008-2011, 2009-2012 and 2010-2013. (Table A1in the Annex shows the same estimates in non-graphical format). Mean relative income growthrates have been calculated for each base-year decile group. In each period, income growth amongchildren is clearly pro-poor: relative (per cent) income growth is highest in the poorest decile,although the pattern is slightly different for each of the four periods considered. Mean incomegrowth in the poorest decile slowed down over time: it went from 212% between 2008 and 2011to 122% between 2009 and 2012 and 146% between 2010 and 2013. It has to be noted that high ratesof mean income growth in the bottom decile have to be interpreted with great caution becausethey are likely to be influenced by the ‘regression to the mean’3 and by the fact that small absolutechanges from a very low base appear as large changes in relative terms.
Generally, relative real income growth among children was greater between 2008 and 2011than between 2009 and 2012 or 2010 and 2013. There is one exception: between 2010 and 2013income growth in the richest decile was positive (7 per cent) and, therefore, higher than in the othertwo time periods when it was negative. This shows variation in income growth patterns over thecrisis, with relatively higher rates of income growth in the first years of the crisis. The analysis alsoillustrates that prior to the crisis, relative income growth in households with children wasconsiderably higher in each income decile (see real income growth, 2006-2009 in Figure 1).Hence, economic crisis had a negative impact on aggregate income growth in households withchildren in each decile with the exception of the richest decile which, in contrast to previously,showed a positive income growth between 2010 and 2013.
Figure A1 in the Annex illustrates the relative income growth for the elderly by decile prior and duringthe economic crisis. The income growth was pro-poor in each time period considered, with muchhigher percentage growth before the crisis than during the crisis. The growth rates are declining
3 If income is extremely low in one year, it is likely to be less extreme the next time it is measured, thus moving closerto its long-term average. Year-on-year income fluctuations tend to be larger at the lower and higher ends ofthe income distribution.
IWP16 - CHILD POVERTY DYNAMICS.qxp_Layout 1 12/04/16 13:22 Pagina 14

15
Child Poverty Dynamics and Income Mobility in EuropeInnocenti Working Paper 2016-16
with each decile. For instance, between 2010 and 2013 the relative income growth among the elderly inthe EU was on average 98 per cent of initial income in the poorest decile, 15 per cent in the seconddecile, 9 per cent in the third decile and falling in the remaining deciles. The average rates of incomegrowth by decile among adults aged over 65 were lower than among children in each time period.
Figure 1 – Mean real income growth among children, by base-year decile group, by period
Source: EU-SILC Longitudinal 2006-2009; 2008-2011; 2009-2012; 2010-2013.
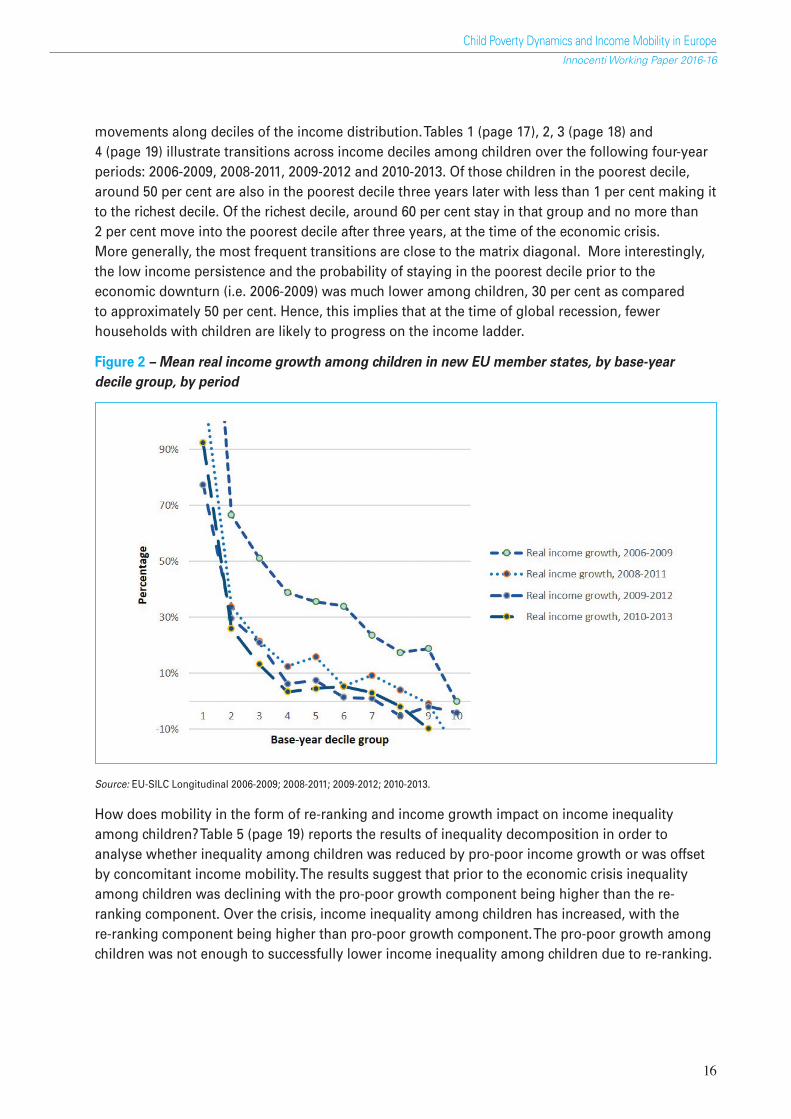
Are there differences between the new and old EU member states? Figures 2 (page 16) and3 (page 17) illustrate the per cent real income growth in households with children in each incomedecile for different time periods (see also Tables A2 and A3 in the Annex). The new EU memberstates show higher income growth than the old EU member states in each income decile withtwo important exceptions. Income growth in the poorest decile was higher in the old EU memberstates than in new EU member states in each time period considered over the crisis. However,prior to the crisis aggregate income growth in the poorest decile was higher in the new memberthan in the old member states, 205 per cent as compared to 142 per cent. This implies that,over the crisis, the incomes of the poorer children were better protected in old EU member statesthat in new EU member states. Also, in the latest period the mean income growth in the richestdecile was higher and positive for old EU member states but not for new EU members stateswhich constantly experienced aggregate income loss in the richest two deciles over the crisis.
It is not always the same children that remain in the bottom and top decile. As the income ofthe household increases (or alternatively decreases) over time, movement across income decilestakes place. It is of interest to what extent children may be stuck in the bottom end of incomedistribution and to what extent they move up and down the household income ladder.The mobility process may be represented by the transition matrix. Here, mobility refers to
IWP16 - CHILD POVERTY DYNAMICS.qxp_Layout 1 12/04/16 13:22 Pagina 15
16
Child Poverty Dynamics and Income Mobility in EuropeInnocenti Working Paper 2016-16
movements along deciles of the income distribution. Tables 1 (page 17), 2, 3 (page 18) and4 (page 19) illustrate transitions across income deciles among children over the following four-yearperiods: 2006-2009, 2008-2011, 2009-2012 and 2010-2013. Of those children in the poorest decile,around 50 per cent are also in the poorest decile three years later with less than 1 per cent making itto the richest decile. Of the richest decile, around 60 per cent stay in that group and no more than2 per cent move into the poorest decile after three years, at the time of the economic crisis.More generally, the most frequent transitions are close to the matrix diagonal. More interestingly,the low income persistence and the probability of staying in the poorest decile prior to theeconomic downturn (i.e. 2006-2009) was much lower among children, 30 per cent as comparedto approximately 50 per cent. Hence, this implies that at the time of global recession, fewerhouseholds with children are likely to progress on the income ladder.
Figure 2 – Mean real income growth among children in new EU member states, by base-yeardecile group, by period
Source: EU-SILC Longitudinal 2006-2009; 2008-2011; 2009-2012; 2010-2013.
How does mobility in the form of re-ranking and income growth impact on income inequalityamong children? Table 5 (page 19) reports the results of inequality decomposition in order toanalyse whether inequality among children was reduced by pro-poor income growth or was offsetby concomitant income mobility. The results suggest that prior to the economic crisis inequalityamong children was declining with the pro-poor growth component being higher than the re-ranking component. Over the crisis, income inequality among children has increased, with there-ranking component being higher than pro-poor growth component. The pro-poor growth amongchildren was not enough to successfully lower income inequality among children due to re-ranking.
IWP16 - CHILD POVERTY DYNAMICS.qxp_Layout 1 12/04/16 13:22 Pagina 16

Figure 3 – Mean real income growth among children in old EU member states, by base yeardecile group, by period
Source: EU-SILC Longitudinal 2006-2009; 2008-2011; 2009-2012; 2010-2013.
Table 1 –Transitions across income deciles among children between 2008 and 2011a
1 2 3 4 5 6 7 8 9 10
1 50.44 18.26 9.88 7.11 4.82 3.41 2.09 1.31 1.27 1.412 23.89 25.63 17.32 11.74 7.79 5.18 3.28 2.26 1.95 0.973 12.68 18.41 23.29 15.92 10.77 8.59 4.56 2.55 2.28 0.954 10.25 10.3 15.42 18.31 17.22 10.63 9.05 4.9 2.62 1.315 6.26 7.41 9.99 14.83 20.04 15.54 11.97 7.8 4.72 1.436 3.19 5.04 7.15 9.85 14.13 19.27 17.0 13.64 7.47 3.257 3.01 3.29 4.69 7.81 9.99 15.9 18.81 18.58 12.28 5.648 1.78 2.64 3.38 3.93 6.82 9.89 14.31 21.07 24.63 11.559 2.17 1.41 1.79 2.69 4.92 6.27 7.93 16.75 28.64 27.4310 1.45 1.11 0.87 3.14 2.62 1.8 4.71 6.98 15.24 62.07
Source: EU-SILC Longitudinal 2008-2011.
a The transitions have been estimated on a balanced sample of children followed over 4 years. The decile boundarieshave been based upon cross sectional EU-SILC datasets.
17
Child Poverty Dynamics and Income Mobility in EuropeInnocenti Working Paper 2016-16
IWP16 - CHILD POVERTY DYNAMICS.qxp_Layout 1 12/04/16 13:22 Pagina 17

18
Child Poverty Dynamics and Income Mobility in EuropeInnocenti Working Paper 2016-16
Table 2 –Transitions across income deciles among children between 2009 and 2012
1 2 3 4 5 6 7 8 9 10
1 53.32 18.64 10.09 6.74 4 2.65 1.77 1.26 1.02 0.512 22.22 28.99 19.55 9.85 7.58 4.75 2.83 2.17 0.91 1.163 12.88 21.21 21.26 16.5 11.7 6.64 4.39 2.91 1.48 1.024 7.79 12.59 16.9 21.91 16.01 8.48 7.74 4.42 2.84 1.325 3.59 8.45 11.84 16.14 22.12 14.68 11.89 5.82 3.74 1.726 3.8 4.54 6.52 10.89 20.14 20.76 15.2 10.55 6.13 1.477 2.74 2.96 5.59 7.15 10.38 17.9 19.89 19.3 10.81 3.288 1.85 2.2 3.64 5.32 8.09 12.72 16.76 25.66 17.63 6.139 1.57 1.11 2.61 3.07 3.53 5.69 9.8 20.78 32.75 19.0810 2.07 0.88 0.88 1.88 0.94 3.27 4.77 8.92 15.26 61.12
Source: EU-SILC Longitudinal 2009-2012.
Table 3 –Transitions across income deciles among children between 2010 and 2013
1 2 3 4 5 6 7 8 9 10
1 51.04 21.47 10.09 7.27 3.79 1.71 1.06 1.43 1.3 0.832 23.92 29.97 18.6 9.99 6.55 4.23 2.9 2.17 1.13 0.543 12.27 21.69 22.55 17.89 10.14 6.34 3.09 2.43 2.38 1.224 7.48 13.61 22.38 20.55 15.12 8.93 6.46 2.96 1.61 0.915 4.32 6.2 12.96 20.59 21.61 14.08 10.52 5.39 2.95 1.376 3.35 3.91 7.05 11.36 17.55 23.54 16.13 9.94 5.02 2.137 1.4 2.43 4.19 7.51 11.81 20.15 24.86 15.54 8.08 4.048 1.36 2.49 3.61 3.61 6.04 11.83 19.88 27.4 18.4 5.389 1.77 1.33 1.96 2.34 3.41 6.06 8.65 24.07 35.19 15.2210 1.61 1.42 0.74 1.92 1.67 1.98 4.21 7.67 18.92 59.86
Source: EU-SILC Longitudinal 2010-2013.
IWP16 - CHILD POVERTY DYNAMICS.qxp_Layout 1 12/04/16 13:23 Pagina 18

19
Child Poverty Dynamics and Income Mobility in EuropeInnocenti Working Paper 2016-16
Table 4 – Transitions across income deciles among children between 2006 and 2009
1 2 3 4 5 6 7 8 9 10
1 29.56 20.48 16.74 8.78 7.66 5.59 4.43 3.06 2.11 1.592 11.34 18.51 19.17 13.87 13.26 9.37 5.15 4.64 2.91 1.783 6.72 12.23 15.83 15.98 13.54 12.66 7.89 7.11 5.5 2.534 5.08 6.04 11.78 16.9 16.7 15.08 12.44 6.7 6.85 2.445 3.72 5.05 5.68 9.35 15.72 17.79 16.2 12.85 8.71 4.946 1.74 3.03 3.47 5.04 11.26 18.54 18.49 18.15 12.27 8.017 1.99 1.29 3.27 5.53 7.09 10.84 17.61 24.69 18.95 8.758 1.15 1.03 1.88 2.97 4.9 5.75 14.35 22.03 28.81 17.139 1.55 1.42 1.1 1.55 2.72 4.47 5.18 14.51 31.28 36.210 1.65 1.18 0.47 1.65 1.41 2.36 3.06 5.26 14.06 68.89
Source: EU-SILC Longitudinal 2006-2009.
Table 5 – Decomposition of inequality into pro-poor growth and mobility componentsamong children, by period
Decomposition of inequality change into pro-poor growth and mobility components
Country Initial S-Gini Final S-Gini Change in inequality Re-ranking Pro-poor growth
2006-2009 0.783 0.771 -0.012 0.022 0.033
2008-2011 0.772 0.771 0 0.027 0.027
2009-2012 0.771 0.779 0.008 0.017 0.009
2010-2013 0.756 0.763 0.007 0.023 0.016
Source: EU-SILC Longitudinal 2006-2009; 2008-2011; 2009-2012; 2010-2013.
IWP16 - CHILD POVERTY DYNAMICS.qxp_Layout 1 12/04/16 13:23 Pagina 19

Child Poverty Dynamics and Income Mobility in EuropeInnocenti Working Paper 2016-16
20
Table 6 –Transition into poverty - below 60% of the 2008 median in real terms (average marginal effects from logistic regression models)
AT BE BG CY DK EE ES FI FR HU
Years at risk (ref: one)
Two -0.02 -0.03* -0.02 -0.00 -0.02 -0.02 -0.01 -0.02*** 0.04 0.02Three
HH work status transition (ref: same number in work)
Fewer adults in work 0.04 0.05* 0.10* 0.03 0.03 0.08** 0.08** 0.03* 0.02 0.09**More adults in work -0.03 -0.03* -0.00 -0.00 0.17* -0.01 0.04 -0.01 -0.00 -0.01Still a jobless household -0.01 -0.03** 0.14 0.23* -0.03 0.37* 0.10 0.05 -0.01 0.36***No longer a jobless household 0.13 0.17 0.03 0.07 0.03 0.36** 0.08 0.06 0.17 0.10*
Change in employee income (ref: no change)
No employee income 0.48*** 0.28*** -0.02 0.06 0.20 0.39 0.12* 0.05 0.30 -0.03*Increase from zero employee income 0.14 0.12 0.02 0.43* 0.44* 0.01 0.14 0.06Increase in employee income 0.01 -0.00 -0.07 -0.01 0.04 -0.01 -0.04** -0.01 -0.04 -0.01Decrease in employee income 0.13*** 0.07*** 0.02 0.14*** 0.08** 0.18*** 0.07*** 0.03* 0.07 0.10***
Number of children (ref: Same number)
More children in HH 0.06 -0.01 0.09 -0.04 0.13 -0.05** 0.04 0.00 -0.08*** 0.10*Fewer children in HH -0.01 0.07* 0.02 0.00 0.08 0.04 -0.06*** 0.01 -0.01 -0.003 or more children at t (ref: 1 or 2) 0.06* 0.03 0.11 0.03 0.03 0.08** 0.03 0.01 0.07 0.07**
Transition to lone parenthood (ref: not a lone parent)
Becomes a lone parent 0.00 0.11 0.04 0.04 0.02Remains a lone parent HH 0.01 -0.00 0.08 -0.00 0.20 0.05 0.05 -0.01 -0.01 -0.01No longer a lone parent HH 0.18 0.01 -0.04*** 0.01 -0.02 -0.01 -0.05 0.13
Highest level of education in HH (ref: lower secondary or below)
Upper secondary 0.03 0.01 -0.09 0.05 -0.10 -0.05 -0.08*** -0.07 0.00 -0.15**Further/higher -0.02 -0.04 -0.12* -0.03 -0.09 -0.07 -0.08*** -0.09 -0.09 -0.23***
Pseudo R-squared 0.270 0.463 0.379 0.223 0.346 0.459 0.238 0.181 0.243 0.311Observations 1,524 1,613 947 1,903 1,278 1,132 2,519 3,604 1,949 2,813
Source: EU-SILC Longitudinal 2010-2013 (version 01.06.2016). Personal base weights used. Clustering at household level accounted for.***p<0.001; **p<0.01; *p<0.05.
IWP16 APPENDIX.qxp_Layout 1 12/04/16 11:44 Pagina 20
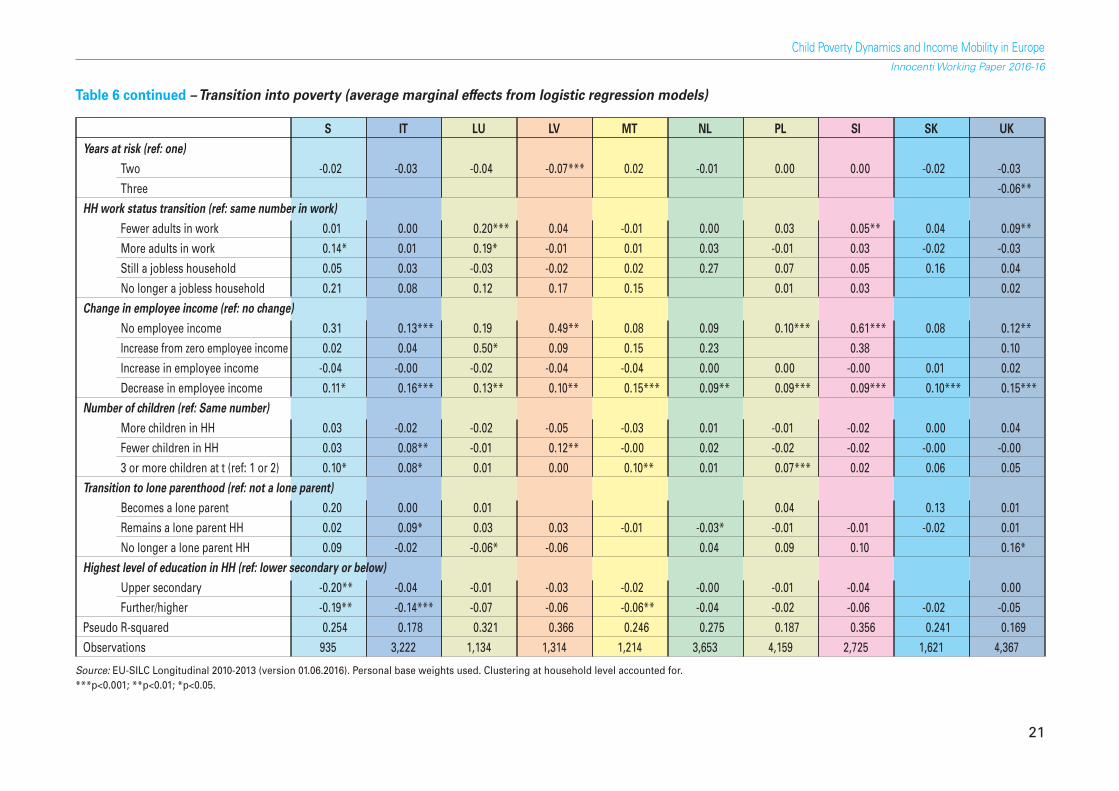
Table 6 continued –Transition into poverty (average marginal effects from logistic regression models)
S IT LU LV MT NL PL SI SK UK
Years at risk (ref: one)
Two -0.02 -0.03 -0.04 -0.07*** 0.02 -0.01 0.00 0.00 -0.02 -0.03Three -0.06**
HH work status transition (ref: same number in work)
Fewer adults in work 0.01 0.00 0.20*** 0.04 -0.01 0.00 0.03 0.05** 0.04 0.09**More adults in work 0.14* 0.01 0.19* -0.01 0.01 0.03 -0.01 0.03 -0.02 -0.03Still a jobless household 0.05 0.03 -0.03 -0.02 0.02 0.27 0.07 0.05 0.16 0.04No longer a jobless household 0.21 0.08 0.12 0.17 0.15 0.01 0.03 0.02
Change in employee income (ref: no change)
No employee income 0.31 0.13*** 0.19 0.49** 0.08 0.09 0.10*** 0.61*** 0.08 0.12**Increase from zero employee income 0.02 0.04 0.50* 0.09 0.15 0.23 0.38 0.10Increase in employee income -0.04 -0.00 -0.02 -0.04 -0.04 0.00 0.00 -0.00 0.01 0.02Decrease in employee income 0.11* 0.16*** 0.13** 0.10** 0.15*** 0.09** 0.09*** 0.09*** 0.10*** 0.15***
Number of children (ref: Same number)
More children in HH 0.03 -0.02 -0.02 -0.05 -0.03 0.01 -0.01 -0.02 0.00 0.04Fewer children in HH 0.03 0.08** -0.01 0.12** -0.00 0.02 -0.02 -0.02 -0.00 -0.003 or more children at t (ref: 1 or 2) 0.10* 0.08* 0.01 0.00 0.10** 0.01 0.07*** 0.02 0.06 0.05
Transition to lone parenthood (ref: not a lone parent)
Becomes a lone parent 0.20 0.00 0.01 0.04 0.13 0.01Remains a lone parent HH 0.02 0.09* 0.03 0.03 -0.01 -0.03* -0.01 -0.01 -0.02 0.01No longer a lone parent HH 0.09 -0.02 -0.06* -0.06 0.04 0.09 0.10 0.16*
Highest level of education in HH (ref: lower secondary or below)
Upper secondary -0.20** -0.04 -0.01 -0.03 -0.02 -0.00 -0.01 -0.04 0.00Further/higher -0.19** -0.14*** -0.07 -0.06 -0.06** -0.04 -0.02 -0.06 -0.02 -0.05
Pseudo R-squared 0.254 0.178 0.321 0.366 0.246 0.275 0.187 0.356 0.241 0.169Observations 935 3,222 1,134 1,314 1,214 3,653 4,159 2,725 1,621 4,367
Source: EU-SILC Longitudinal 2010-2013 (version 01.06.2016). Personal base weights used. Clustering at household level accounted for.***p<0.001; **p<0.01; *p<0.05.
Child Poverty Dynamics and Income Mobility in EuropeInnocenti Working Paper 2016-16
21
IWP16 APPENDIX.qxp_Layout 1 12/04/16 11:44 Pagina 21

22
Child Poverty Dynamics and Income Mobility in EuropeInnocenti Working Paper 2016-16
4.2 Poverty dynamics
Figure 4 shows poverty transition probabilities across 24 countries between any two consecutivewaves over the 2010-2013 period. It plots the probability of moving into poverty for children under18 who started out as non-poor as well as the probability of remaining in poverty for those whostarted out as poor. The poverty entry probability ranges from under 2 per cent in Denmark andNorway to just over 10 per cent in Estonia, Iceland, Italy and the UK. Thus, one in 10 children fell intopoverty in these countries each year between 2010 and 2013. The probability of remaining in povertyranges from 31 per cent in Norway to 83 per cent in Portugal. In other words, while 69 per centof children move out of poverty in Norway each year, only 17 per cent do so in Portugal.Although countries with higher entry rates tend to have lower exit rates (i.e. higher rates ofremaining in poverty), there are some exceptions. For instance, Iceland and the UK combine someof the highest exit rates (i.e. one of the lowest rates of remaining in poverty) with some ofthe highest poverty entry rates in the comparison, suggesting a large degree of mobility in and outof poverty between any two waves over the 2010-2013 period.
Figure 4 –Yearly child poverty transitions between 2010 and 2013
Source: EU-SILC Longitudinal 2010-2013 (version 01.06.2016).
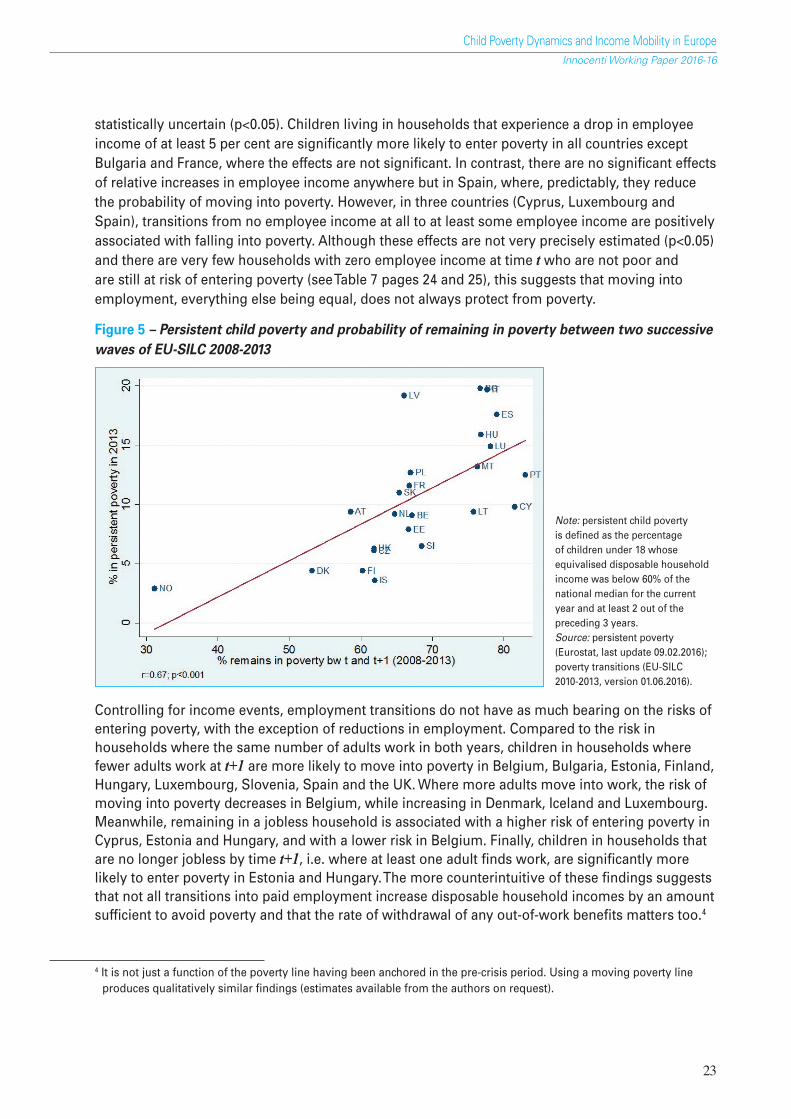
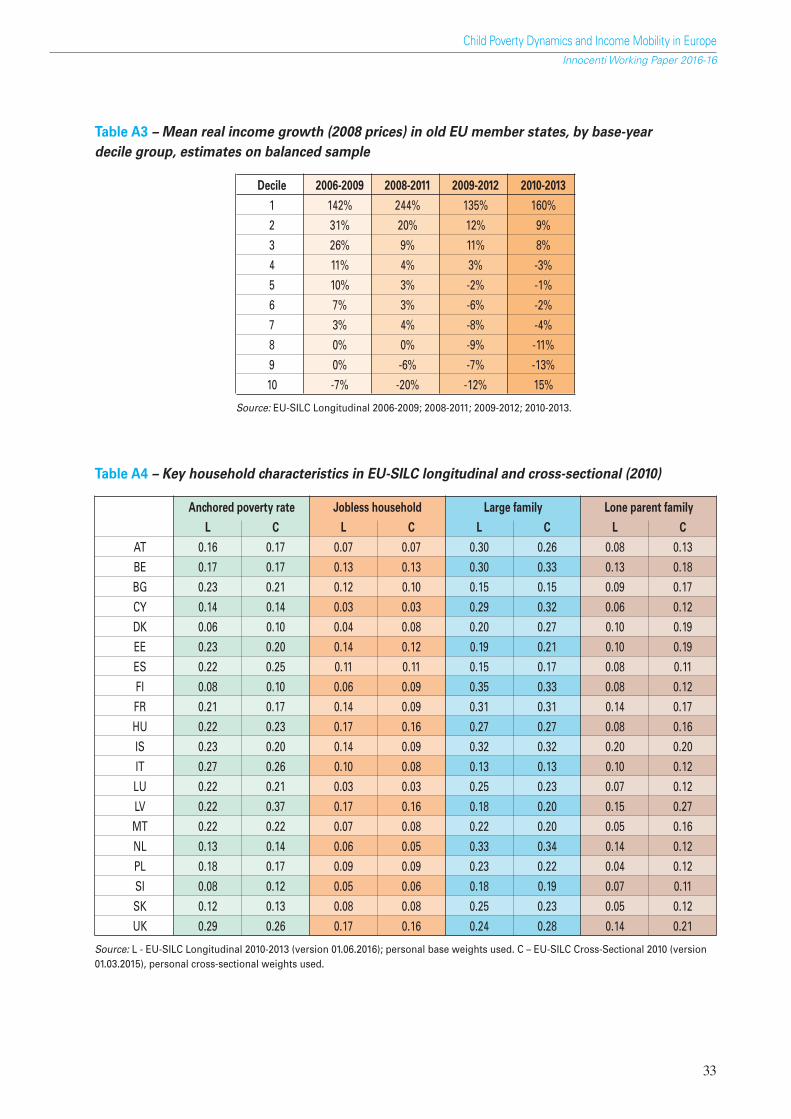
Countries with high rates of remaining in anchored poverty (i.e. low exit rates) tend to have higherrates of persistent poverty in 2013 (Figure 5 page 20). Persistent poverty is defined by Eurostatas remaining in poverty (with household income below 60% of contemporary median income)in the current year and at least two out of three preceding years. Scandinavian countries as well asAustria and the UK tend to have lower rates of persistent poverty and higher exit rates,while Bulgaria, Hungary, Italy, Latvia, Luxembourg and Spain tend to have higher rates ofpersistent poverty and lower exit rates.
Table 6 (pages 21 and 22) shows average marginal effects from country-specific logistic regressionsof anchored poverty entry. As expected, income events have by far the largest net effects on theprobability of entering poverty for children who are not poor at time t. Everything else being equal,children who live in households with no employee income in both periods (t and t+1) aresignificantly more likely to be poor in in Austria, Belgium, Italy, Latvia, Poland, Slovenia, Spain andthe UK. The effect is negative in Hungary, but it is small (3 percentage points) and somewhat
IWP16 - CHILD POVERTY DYNAMICS.qxp_Layout 1 12/04/16 13:23 Pagina 22
23
Child Poverty Dynamics and Income Mobility in EuropeInnocenti Working Paper 2016-16
statistically uncertain (p<0.05). Children living in households that experience a drop in employeeincome of at least 5 per cent are significantly more likely to enter poverty in all countries exceptBulgaria and France, where the effects are not significant. In contrast, there are no significant effectsof relative increases in employee income anywhere but in Spain, where, predictably, they reducethe probability of moving into poverty. However, in three countries (Cyprus, Luxembourg andSpain), transitions from no employee income at all to at least some employee income are positivelyassociated with falling into poverty. Although these effects are not very precisely estimated (p<0.05)and there are very few households with zero employee income at time t who are not poor andare still at risk of entering poverty (see Table 7 pages 24 and 25), this suggests that moving intoemployment, everything else being equal, does not always protect from poverty.
Figure 5 – Persistent child poverty and probability of remaining in poverty between two successivewaves of EU-SILC 2008-2013
Note: persistent child povertyis defined as the percentageof children under 18 whoseequivalised disposable householdincome was below 60% of thenational median for the currentyear and at least 2 out of thepreceding 3 years.Source: persistent poverty(Eurostat, last update 09.02.2016);poverty transitions (EU-SILC2010-2013, version 01.06.2016).
Controlling for income events, employment transitions do not have as much bearing on the risks ofentering poverty, with the exception of reductions in employment. Compared to the risk inhouseholds where the same number of adults work in both years, children in households wherefewer adults work at t+1 are more likely to move into poverty in Belgium, Bulgaria, Estonia, Finland,Hungary, Luxembourg, Slovenia, Spain and the UK. Where more adults move into work, the risk ofmoving into poverty decreases in Belgium, while increasing in Denmark, Iceland and Luxembourg.Meanwhile, remaining in a jobless household is associated with a higher risk of entering poverty inCyprus, Estonia and Hungary, and with a lower risk in Belgium. Finally, children in households thatare no longer jobless by time t+1, i.e. where at least one adult finds work, are significantly morelikely to enter poverty in Estonia and Hungary. The more counterintuitive of these findings suggeststhat not all transitions into paid employment increase disposable household incomes by an amountsufficient to avoid poverty and that the rate of withdrawal of any out-of-work benefits matters too.4
4 It is not just a function of the poverty line having been anchored in the pre-crisis period. Using a moving poverty lineproduces qualitatively similar findings (estimates available from the authors on request).
IWP16 - CHILD POVERTY DYNAMICS.qxp_Layout 1 12/04/16 13:23 Pagina 23

Child Poverty Dynamics and Income Mobility in EuropeInnocenti Working Paper 2016-16
24
Table 7 – Unweighted means of predictors in Table 6 (not in poverty at time t)
AT BE BG CY DK EE ES FI FR HU
Years at risk One 0.72 0.72 0.72 0.67 0.70 0.75 0.70 0.72 0.73 0.78Two 0.28 0.28 0.28 0.33 0.30 0.25 0.30 0.28 0.27 0.22Three
HH work status transition Same number in work 0.74 0.81 0.75 0.79 0.77 0.70 0.78 0.74 0.81 0.76Fewer adults in work 0.11 0.08 0.13 0.11 0.12 0.11 0.12 0.09 0.07 0.08More adults in work 0.11 0.06 0.07 0.09 0.08 0.14 0.06 0.13 0.08 0.10Still a jobless household 0.02 0.04 0.04 0.01 0.01 0.01 0.02 0.02 0.02 0.04No longer a jobless household 0.02 0.01 0.01 0.00 0.02 0.03 0.02 0.02 0.02 0.03
Change in employee income (ref: no change)No change 0.27 0.21 0.13 0.34 0.34 0.21 0.32 0.24 0.33 0.22No employee income 0.02 0.06 0.03 0.04 0.01 0.01 0.05 0.02 0.01 0.05Increase from zero employee income 0.01 0.01 0.02 0.01 0.00 0.00 0.01 0.01 0.01 0.02Increase in employee income 0.49 0.44 0.58 0.29 0.36 0.47 0.24 0.50 0.35 0.38Decrease in employee income 0.21 0.28 0.24 0.31 0.28 0.31 0.39 0.23 0.30 0.33
Number of children in HHSame number of children in HH 0.86 0.86 0.86 0.84 0.83 0.81 0.89 0.17 0.86 0.86More children in HH 0.03 0.04 0.03 0.03 0.05 0.05 0.03 0.05 0.03 0.02Fewer children in HH 0.10 0.10 0.11 0.13 0.12 0.14 0.08 0.13 0.10 0.12Number of children in HH at tOne or two 0.73 0.73 0.94 0.70 0.74 0.72 0.89 0.65 0.74 0.763 or more 0.27 0.27 0.06 0.30 0.26 0.28 0.11 0.35 0.26 0.24
Transition to lone parenthood (ref: not a lone parent)Not a lone parent 0.90 0.87 0.96 0.96 0.95 0.93 0.93 0.91 0.89 0.90Becomes a lone parent 0.00 0.01 0.00 0.01 0.00 0.01 0.01 0.00 0.00 0.01Remains a lone parent HH 0.09 0.10 0.04 0.03 0.04 0.03 0.05 0.05 0.08 0.08No longer a lone parent HH 0.01 0.02 0.00 0.00 0.02 0.02 0.01 0.01 0.03 0.01
Highest level of education in HHLower secondary or below 0.05 0.10 0.12 0.04 0.02 0.04 0.19 0.02 0.04 0.05Upper secondary 0.45 0.24 0.46 0.37 0.32 0.46 0.25 0.31 0.42 0.54Further/higher 0.51 0.66 0.42 0.59 0.67 0.50 0.56 0.67 0.53 0.40
IWP16 APPENDIX.qxp_Layout 1 12/04/16 11:44 Pagina 24

Child Poverty Dynamics and Income Mobility in EuropeInnocenti Working Paper 2016-16
25
Table 7 continued – Unweighted means of predictors in Table 6 (not in poverty at time t)
IS IT LU LV MT NL PL SI SK UK
Years at risk One 0.73 0.78 0.73 0.75 0.71 0.73 0.70 0.72 0.69 0.69Two 0.27 0.22 0.27 0.25 0.29 0.27 0.30 0.28 0.31 0.23Three 0.08
HH work status transition Same number in work 0.66 0.80 0.83 0.64 0.82 0.87 0.77 0.82 0.78 0.75Fewer adults in work 0.12 0.09 0.07 0.14 0.06 0.05 0.08 0.09 0.08 0.10More adults in work 0.19 0.07 0.07 0.15 0.09 0.07 0.09 0.07 0.13 0.11Still a jobless household 0.02 0.02 0.02 0.04 0.03 0.01 0.04 0.01 0.01 0.05No longer a jobless household 0.02 0.02 0.01 0.02 0.01 0.00 0.02 0.01 0.00 0.02
Change in employee income (ref: no change)No change 0.20 0.29 0.30 0.16 0.31 0.39 0.25 0.28 0.27 0.53No employee income 0.01 0.10 0.04 0.03 0.06 0.02 0.09 0.01 0.03 0.09Increase from zero employee income 0.01 0.02 0.01 0.01 0.02 0.00 0.00 0.01 0.00 0.03Increase in employee income 0.62 0.26 0.40 0.50 0.41 0.38 0.34 0.37 0.43 0.36Decrease in employee income 0.17 0.34 0.25 0.30 0.20 0.20 0.31 0.33 0.27 0.36Number of children in HHSame number of children in HH 0.81 0.87 0.86 0.83 0.85 0.87 0.85 0.82 0.78 0.86More children in HH 0.04 0.03 0.03 0.05 0.02 0.03 0.03 0.04 0.03 0.05Fewer children in HH 0.15 0.10 0.11 0.12 0.13 0.10 0.12 0.15 0.19 0.09
Number of children in HH at tOne or two 0.70 0.89 0.74 0.83 0.84 0.69 0.75 0.80 0.81 0.763 or more 0.30 0.11 0.26 0.17 0.16 0.31 0.25 0.20 0.19 0.24
Transition to lone parenthood (ref: not a lone parent)Not a lone parent 0.93 0.92 0.93 0.88 0.97 0.91 0.94 0.97 0.96 0.85Becomes a lone parent 0.01 0.01 0.01 0.00 0.00 0.00 0.00 0.00 0.00 0.01Remains a lone parent HH 0.06 0.05 0.06 0.09 0.03 0.08 0.04 0.02 0.002 0.11No longer a lone parent HH 0.01 0.02 0.01 0.03 0.00 0.01 0.01 0.01 0.04 0.02
Highest level of education in HHLower secondary or below 0.09 0.15 0.15 0.05 0.34 0.04 0.02 0.03 0.00 0.04Upper secondary 0.24 0.52 0.45 0.39 0.27 0.33 0.59 0.51 0.59 0.38Further/higher 0.67 0.33 0.40 0.56 0.39 0.63 0.39 0.46 0.41 0.59
IWP16 APPENDIX.qxp_Layout 1 12/04/16 11:44 Pagina 25
26
Child Poverty Dynamics and Income Mobility in EuropeInnocenti Working Paper 2016-16
Effects of demographic events are relatively rare, although children in large families havesignificantly higher baseline risks of entering poverty in Austria, Estonia, Hungary, Iceland, Italy,Malta and Poland. A new birth in the household increases the risk of moving into povertyin Hungary, but reduces it in Estonia and France. When the number of children falls, the risk ofa poverty entry decreases in Spain, but increases in Belgium, Italy and Latvia.5When the householdtype changes from lone parent to couple family, the risk of entering poverty decreases in Denmarkand Luxembourg but increases in the UK, suggesting that not all partnerships help avoid poverty.Remaining a lone parent in two successive waves increases the risk of poverty entry in Italy butreduces it in the Netherlands.
Children in households with more educated adults have a significantly lower baseline risk ofentering poverty in Bulgaria, Hungary, Iceland, Malta and Spain.
Table 8 (page 27) shows the results of poverty exit models for selected countries. Only those withsufficiently large samples of children ‘at risk’ of exiting poverty are included: Hungary, Italy and theUK. Income events are just as important to poverty exits as to poverty entries. In all three countries,increases in employee income (both from zero and non-zero income) between time t and t+1 areassociated with significantly higher probabilities of moving out of poverty by t+1, everything elsebeing equal. As expected, employment events also matter. Having an additional adult move intowork (for non-jobless households) is associated with significantly higher chances of exiting povertyin Italy and the UK, with no significant effect in Hungary. Remaining a jobless household decreasesthe chances of moving out of poverty in Hungary and the UK, with no significant effect in Italy.
Although demographic transitions do not appear to influence the risks of moving out of poverty,having three or more children in the household decreases the probability of exiting poverty inHungary and the UK. Children in households with higher educated adults are significantlymore likely to move out of poverty in Hungary, with no significant net effects in Italy or the UK.
5The results for Latvia need to be interpreted with caution because the longitudinal sample is not fully representative ofthe population (see Table 4 in the Annex).
IWP16 - CHILD POVERTY DYNAMICS.qxp_Layout 1 12/04/16 13:23 Pagina 26

Table 8 –Transition from poverty (average marginal effects from logistic regression models)
HU IT UK
Years at risk (ref: one)
Two -0.10* -0.07 -0.07Three 0.03HH work status transition (ref: same number in work)Fewer adults in work -0.09 -0.07 -0.15More adults in work 0.17 0.24* 0.19**Still a jobless household -0.19** -0.07 -0.28***No longer a jobless household -0.03 -0.10 -0.15
Change in employee income (ref: no change)
No employee income -0.00 0.03 0.08Increase from zero employee income 0.31* 0.23* 0.38***Increase in employee income 0.26*** 0.16* 0.34***Decrease in employee income -0.04 0.01 0.05
Number of children (ref: same number)
More children in HH 0.15 -0.03 0.06Fewer children in HH 0.09 -0.07 -0.083 or more children at t (ref: 1 or 2) -0.10* -0.03 -0.12**
Transition to lone parenthood (ref: not a lone parent)
Becomes a lone parent -0.09 -0.00 0.07Remains a lone parent HH 0.02 -0.07 0.08No longer a lone parent HH 0.18 -0.05 0.07
Highest level of education in HH (ref: lower secondary or below)
Upper secondary 0.04 0.01 -0.04Further/higher 0.35** 0.16 -0.04Pseudo R-squared 0.291 0.106 0.206Observations 987 1,122 1,373
Source: EU-SILC Longitudinal 2010-2013 (version 01.06.2016). Personal base weights used. Clustering at household level accounted for.***p<0.001; **p<0.01; *p<0.05.
5. CONCLUSION
The present study is the first analysis of longitudinal data from the EU-SILC to examine incomemobility and child poverty dynamics in the EU during the recent economic crisis. It finds thatincome growth among children has been generally pro-poor but not sufficiently so to put a brakeon the increasing income inequality. Relative growth in children’s real disposable householdincomes was greater before the crisis and in the beginning of the crisis (between 2008 and 2011)than in the later period (between 2009 and 2012, or 2010 and 2013). However, incomes ofthe richest decile contracted before the crisis and during its earlier phase but then grew between2010 and 2013. This illustrates the differential impact of the recent economic crisis along the incomedistribution: while the lowest incomes were protected, the middle lost a lot of ground and the topdid better at the end of the crisis than before the crisis.
27
Child Poverty Dynamics and Income Mobility in EuropeInnocenti Working Paper 2016-16
IWP16 - CHILD POVERTY DYNAMICS.qxp_Layout 1 12/04/16 13:23 Pagina 27

28
Child Poverty Dynamics and Income Mobility in EuropeInnocenti Working Paper 2016-16
There is substantial heterogeneity among the EU-SILC countries in the rates of child poverty entryand exit. Scandinavian countries tend to combine lower exit and entry rates, while Southern andEastern European countries tend to have higher rates of both exit and entry. Household-levelincome events, i.e. relative growth in employee earnings, are found to be the most importantpredictors of transitions into and out of poverty. Children living in households with no income fromemployment, as well as in households that experience a drop in employee income of at least5 per cent, are consistently at a high risk of entering poverty. Meanwhile, employment eventshave less of an impact, except reductions in the number of employed adults, which consistentlyincreases the risk of poverty entries. Demographic events, which are quite rare in the short EU-SILCpanel, have little bearing on child poverty transitions in the EU-SILC.
Our results demonstrate that the longitudinal EU-SILC can be used for the study of short-termincome mobility and poverty dynamics among children, with several important caveats.First, small country-level sample sizes preclude any detailed analysis of income mobility acrossdeciles of the disposable income distribution for children within countries. Grouping countriesby region increases the sample size, but the results can no longer be attributed to specific countries.Second, demographic events are too rare in a four-year rotational panel to make a substantialdifference to estimated child poverty transitions, but income and employment events aresufficiently frequent. Moreover, the lack of consistency in ‘tracing rules’ across countries makessome types of demographic transitions difficult to detect (e.g. young adults leaving parental home).Third, in most countries the sample sizes of children in poverty are not large enough for modellingtransitions out of poverty in a multivariate framework, although there are sufficient sample sizesfor modelling transitions into poverty. Fourth, a four-year panel is too short for identifying the startof a poverty spell for households who are already poor at the start of the observation period.Finally, the limited type and number of variables recorded in the longitudinal database restrictpotential uses of the EU-SILC panel. For example, the ‘country of birth’ variable collected inthe cross-sectional EU-SILC is not present in the longitudinal version. Addressing some ofthese issues in data collection and harmonisation would considerably improve the value of theEU-SILC to the analysis of income mobility and poverty dynamics.
IWP16 - CHILD POVERTY DYNAMICS.qxp_Layout 1 12/04/16 13:23 Pagina 28
29
Child Poverty Dynamics and Income Mobility in EuropeInnocenti Working Paper 2016-16
REFERENCES
Alves, N., & Martins, C. (2012). Mobility and income inequality in the European Union and inPortugal. Banco de Portugal Economic Bulletin.
Andriopoulou, E., & Tsakloglou, P. (2015). Mobility into and out of poverty in Europe in the 1990s andthe precrisis period: The role of income, demographic and labour market events. Antwerp:Herman Deleeck Centre for Social Policy, University of Antwerp.
Aristei, D., & Perugini, C. (2015a). Income Mobility in the New EU Member States. In C. Perugini & F.Pompei (Eds.), Inequalities During and After Transition in Central and Eastern Europe (pp. 119–143). London: Palgrave Macmillan UK.
Aristei, D., & Perugini, C. (2015b). The drivers of income mobility in Europe. Economic Systems,39(2), 197–224.
Ashworth, K., Hill, M., & Walker, R. (1994). Patterns of childhood poverty: New challenges for policy.Journal of Policy Analysis and Management, 13(4), 658–680. doi:10.2307/3325492
Ayala, L., & Sastre, M. (2008). The structure of income mobility: empirical evidence from fiveEU countries. Empirical Economics, 35(3), 451–473.
Ayllón, S. (2015a). Childhood, poverty and economic crisis. Barcelona: “La Caixa” Foundation.
Ayllón, S. (2015b). Youth poverty, employment, and leaving the parental home in Europe. Review ofIncome and Wealth, 61(4), 651–676.
Bane, M. J., & Ellwood, D. T. (1983). Slipping into and out of poverty: The dynamics of spells.Journal of Human Resources, 21(1), 1–23.
Bradbury, B., Jenkins, S. P., & Micklewright, J. (Eds.). (2001). The dynamics of child poverty inindustrialised countries. Cambridge University Press. Accessed 11 March 2016
Bradshaw, J., & Holmes, J. (2010). Child poverty in the first five years of life. In J. Hansen, H. Joshi,& S. Dex (Eds.), Children of the 21st century: the first five years. The UK Millennium CohortSeries (Vol. 2, pp. 13–31). Bristol: The Policy Press.
Brooks-Gunn, J., & Duncan, G. J. (1997). The effects of poverty on children. The future of children,55–71.
Callens, M., & Croux, C. (2009). Poverty Dynamics in Europe A Multilevel Recurrent Discrete-TimeHazard Analysis. International Sociology, 24(3), 368–396. doi:10.1177/0268580909102913
Cantó, O., & Mercader-Prats, M. (2002). Child Poverty in Spain from the 70’s to the 90’s: a static anddynamic approach. Journal of Applied Social Sciences Studies (Schmollers Jahrbuch), 121(4), 2002.
Chzhen, Y., & Bradshaw, J. (2012). Lone parents, poverty and policy in the European Union. Journalof European Social Policy, 22(5), 487–506.
Cornia, G. A., & Danziger, S. (1997). Child poverty and deprivation in the industrialized countries,l945-1995. Oxford University Press. Accessed 4 April 2014
IWP16 - CHILD POVERTY DYNAMICS.qxp_Layout 1 12/04/16 13:23 Pagina 29
30
Child Poverty Dynamics and Income Mobility in EuropeInnocenti Working Paper 2016-16
Duncan, G. J., Gustafsson, B., Hauser, R., Schmauss, G., Messinger, H., Muffels, R., et al. (1993).Poverty dynamics in eight countries. Journal of Population Economics, 6(3), 215–234.
European Commission. (2012). Employment and social developments in Europe in 2012. Brussels:European Commission.
Fields, G. S. & Ok, E. A. (1999). The measurement of income mobility: An introduction to theliterature. In J. Silber (Ed.) Handbook on income inequality measurement (pp. 557-596).Norwell, MA: Kluwer Academic Publishers.
Fouarge, D., & Layte, R. (2005). Welfare regimes and poverty dynamics: the duration and recurrenceof poverty spells in Europe. Journal of Social Policy, 34(03), 407–426.
Gangl, M. (2005). Income inequality, permanent incomes, and income dynamics comparing Europeto the United States. Work and Occupations, 32(2), 140–162.
Gregg, P., & Vittori, C. (2009). Earnings mobility in Europe: Global and disaggregate measures.Bristol: CMPO, University of Bristol.
Iacovou, M., & Lynn, P. (2013). Implications of the EU-SILC following rules, and theirimplementation, for longitudinal analysis. ISER Working Paper Series.http://www.econstor.eu/handle/10419/91696. Accessed 8 March 2016
Jenkins, S. P., & Schluter, C. (2003). Why Are Child Poverty Rates Higher in Britain than in Germany?A Longitudinal Perspective. The Journal of Human Resources, 38(2), 441–465.
Jenkins, S. P., & Van Kerm, P. (2006). Trends in income inequality, pro-poor income growth, andincome mobility. Oxford Economic Papers, 58(3), 531–548.
Layte, R., & Whelan, C. T. (2002). Moving in and out of poverty: the impact of welfare regimes onpoverty dynamics in the EU. Institute for Social and Economic Research, University of Essex.
Mendola, D., Busetta, A., & Aassve, A. (2009). What keeps young adults in permanent poverty?A comparative analysis using ECHP. Social science research, 38(4), 840–857.
Polin, V., & Raitano, M. (2014). Poverty Transitions and Trigger Events across EU Groups of Countries:Evidence from EU-SILC. Journal of Social Policy, 43(04), 745–772.doi:10.1017/S0047279414000270
Riener, G. (2012). Inequality and mobility of household incomes in Europe: evidence from the ECHP.Applied Economics, 44(3), 279–288.
UNICEF Innocenti Research Centre. (2012). Measuring child poverty: New league tables of childpoverty in the world’s rich countries (Innocenti Report Card No. 10). Florence: UNICEF InnocentiResearch Centre.
Valletta, R. G. (2006). The Ins and Outs of Poverty in Advanced Economies: Government Policy andPoverty Dynamics in Canada, Germany, Great Britain, and the United States. Review of Incomeand Wealth, 52(2), 261–284.
IWP16 - CHILD POVERTY DYNAMICS.qxp_Layout 1 12/04/16 13:23 Pagina 30

31
Child Poverty Dynamics and Income Mobility in EuropeInnocenti Working Paper 2016-16
Vandecasteele, L. (2011). Life course risks or cumulative disadvantage? The structuring effect ofsocial stratification determinants and life course events on poverty transitions in Europe.European Sociological Review, 27(2), 246–263.
Van Kerm, P., & Pi Alperin, M. N. (2013). Inequality, growth and mobility: The intertemporaldistribution of income in European countries 2003–2007. Economic Modelling, 35, 931–939.
Vleminckx, K., & Smeeding, T. M. (2001). Child Well-being, Child Poverty and Child Policy in ModernNations: What Do We Know?The Policy Press.
IWP16 - CHILD POVERTY DYNAMICS.qxp_Layout 1 12/04/16 13:23 Pagina 31

32
Child Poverty Dynamics and Income Mobility in EuropeInnocenti Working Paper 2016-16
ANNEX
Table A1 – Mean real income growth (2008 prices), by base-year decile group, estimates onbalanced sample
Decile Children Over age 65
2010-2013 2009-2012 2008-2011 2006-2009 2010-2013 2009-2012 2008-2011 2006-2009
1 146% 122% 212% 159% 98% 84% 103% 149%2 13% 16% 23% 39% 15% 15% 19% 30%3 9% 13% 12% 31% 9% 12% 10% 23%4 -2% 3% 5% 15% 6% 6% 6% 11%5 0% 0% 6% 15% 0% 1% 0% 16%6 -1% -4% 3% 13% 1% -1% 0% 9%7 -2% -6% 5% 7% -5% 1% -1% 5%8 -9% -8% 1% 3% -7% -2% -1% 4%9 -13% -5% -5% 4% -8% 6% -2% 7%10 7% -9% -19% -6% -17% -17% -12% -4%
Source: EU-SILC Longitudinal 2006-2009; 2008-2011; 2009-2012; 2010-2013.
Table A2 – Mean real income growth (2008 prices) in new EU member states, by base-yeardecile group, estimates on balanced sample
Decile 2006-2009 2008-2011 2009-2012 2010-2013
1 205% 114% 77% 92%2 67% 34% 30% 26%3 51% 22% 21% 13%4 39% 12% 6% 3%5 36% 16% 7% 5%6 34% 5% 1% 5%7 24% 9% 1% 3%8 17% 4% -5% -2%9 19% -1% -2% -10%10 0% -17% -4% -17%
Source: EU-SILC Longitudinal 2006-2009; 2008-2011; 2009-2012; 2010-2013.
IWP16 - CHILD POVERTY DYNAMICS.qxp_Layout 1 12/04/16 13:23 Pagina 32
33
Child Poverty Dynamics and Income Mobility in EuropeInnocenti Working Paper 2016-16
Table A3 – Mean real income growth (2008 prices) in old EU member states, by base-yeardecile group, estimates on balanced sample
Decile 2006-2009 2008-2011 2009-2012 2010-2013
1 142% 244% 135% 160%2 31% 20% 12% 9%3 26% 9% 11% 8%4 11% 4% 3% -3%5 10% 3% -2% -1%6 7% 3% -6% -2%7 3% 4% -8% -4%8 0% 0% -9% -11%9 0% -6% -7% -13%10 -7% -20% -12% 15%
Source: EU-SILC Longitudinal 2006-2009; 2008-2011; 2009-2012; 2010-2013.
Table A4 – Key household characteristics in EU-SILC longitudinal and cross-sectional (2010)
Anchored poverty rate Jobless household Large family Lone parent family
L C L C L C L C
AT 0.16 0.17 0.07 0.07 0.30 0.26 0.08 0.13BE 0.17 0.17 0.13 0.13 0.30 0.33 0.13 0.18BG 0.23 0.21 0.12 0.10 0.15 0.15 0.09 0.17CY 0.14 0.14 0.03 0.03 0.29 0.32 0.06 0.12DK 0.06 0.10 0.04 0.08 0.20 0.27 0.10 0.19EE 0.23 0.20 0.14 0.12 0.19 0.21 0.10 0.19ES 0.22 0.25 0.11 0.11 0.15 0.17 0.08 0.11FI 0.08 0.10 0.06 0.09 0.35 0.33 0.08 0.12FR 0.21 0.17 0.14 0.09 0.31 0.31 0.14 0.17HU 0.22 0.23 0.17 0.16 0.27 0.27 0.08 0.16IS 0.23 0.20 0.14 0.09 0.32 0.32 0.20 0.20IT 0.27 0.26 0.10 0.08 0.13 0.13 0.10 0.12LU 0.22 0.21 0.03 0.03 0.25 0.23 0.07 0.12LV 0.22 0.37 0.17 0.16 0.18 0.20 0.15 0.27MT 0.22 0.22 0.07 0.08 0.22 0.20 0.05 0.16NL 0.13 0.14 0.06 0.05 0.33 0.34 0.14 0.12PL 0.18 0.17 0.09 0.09 0.23 0.22 0.04 0.12SI 0.08 0.12 0.05 0.06 0.18 0.19 0.07 0.11SK 0.12 0.13 0.08 0.08 0.25 0.23 0.05 0.12UK 0.29 0.26 0.17 0.16 0.24 0.28 0.14 0.21
Source: L - EU-SILC Longitudinal 2010-2013 (version 01.06.2016); personal base weights used. C – EU-SILC Cross-Sectional 2010 (version01.03.2015), personal cross-sectional weights used.
IWP16 - CHILD POVERTY DYNAMICS.qxp_Layout 1 12/04/16 13:23 Pagina 33

34
Child Poverty Dynamics and Income Mobility in EuropeInnocenti Working Paper 2016-16
Figure A1 – Mean real income growth among adults age 65 and over by base year decile group,by period
Source: EU-SILC Longitudinal 2006-2009; 2008-2011; 2009-2012; 2010-2013.
IWP16 - CHILD POVERTY DYNAMICS.qxp_Layout 1 12/04/16 13:23 Pagina 34


