Childhood Overweight in Childhood Overweight in Sacramento County, Sacramento County, 2001 2001 Cassius Lockett, Ph.D., MS Cassius Lockett, Ph.D., MS Epidemiology Program Manager Epidemiology Program Manager Epidemiology Services Epidemiology Services Department of Health and Human Services Department of Health and Human Services Sacramento County Sacramento County
Transcript
Childhood Overweight in Childhood Overweight in Sacramento County,Sacramento County, 2001 2001
Cassius Lockett, Ph.D., MSCassius Lockett, Ph.D., MS
Epidemiology Program ManagerEpidemiology Program Manager
Epidemiology ServicesEpidemiology Services
Department of Health and Human ServicesDepartment of Health and Human Services
Sacramento CountySacramento County
OverviewOverview
• Public Health Importance• Defining BMI • Results• Summarize
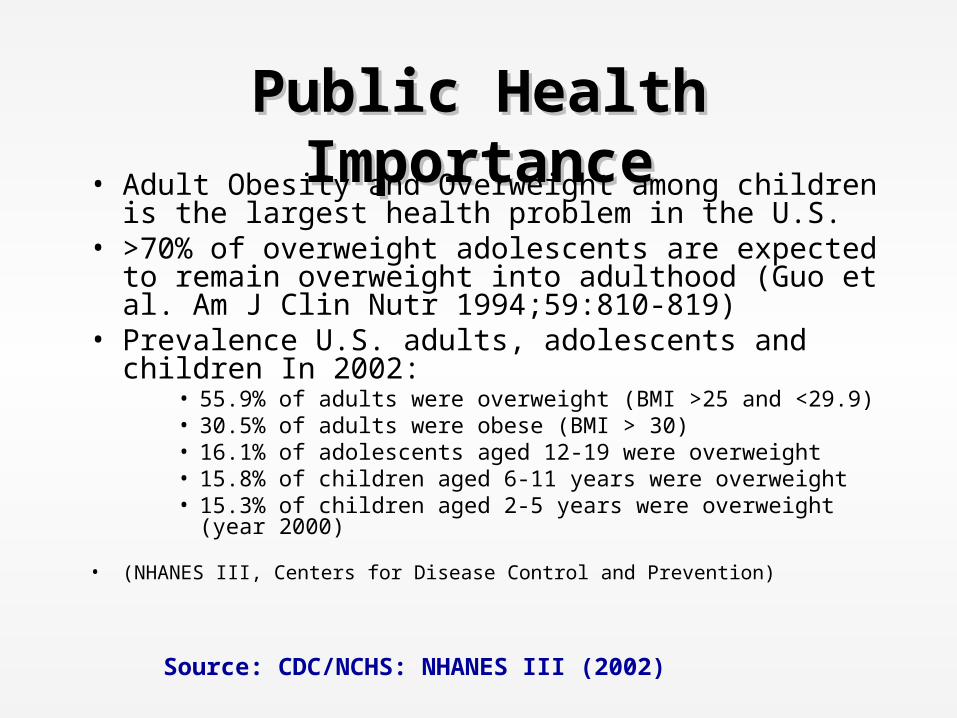
Public Health Public Health ImportanceImportance• Adult Obesity and Overweight among children
is the largest health problem in the U.S.• >70% of overweight adolescents are expected
to remain overweight into adulthood (Guo et al. Am J Clin Nutr 1994;59:810-819)
• Prevalence U.S. adults, adolescents and children In 2002:
• 55.9% of adults were overweight (BMI >25 and <29.9)• 30.5% of adults were obese (BMI > 30)• 16.1% of adolescents aged 12-19 were overweight• 15.8% of children aged 6-11 years were overweight• 15.3% of children aged 2-5 years were overweight (year
2000)
• (NHANES III, Centers for Disease Control and Prevention)
Source: CDC/NCHS: NHANES III (2002)
Public Health Public Health ImportanceImportance
• Trends in U.S. adults, adolescents and children increasing – From 1988-1994 to 1999-2000:
• Children aged 2-5 years-increased from 7.2% to 10.4%
– 44.4% increase• Children aged 6-11 years-increased from 11.3%
to 15.3%– 35.4% increase
• Children aged 12-19 years-increased from 10.5% to 15.5%
– 47.6% increase
Source: CDC/NCHS: NHANES III (1988-94, 1999-2000)
Defining BMIDefining BMI
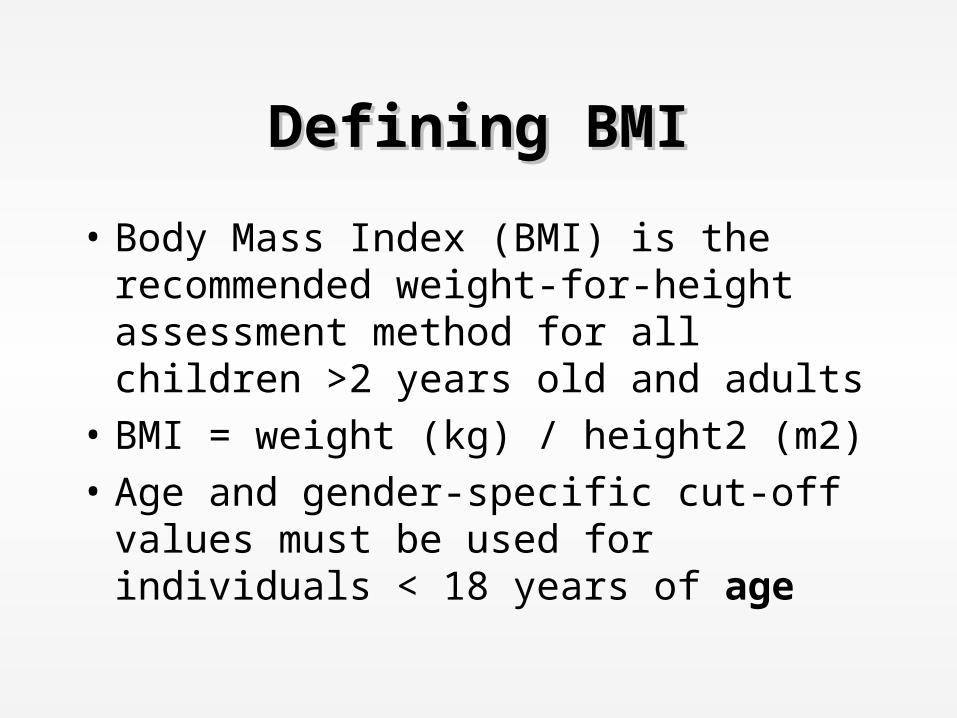
• Body Mass Index (BMI) is the recommended weight-for-height assessment method for all children >2 years old and adults
• BMI = weight (kg) / height2 (m2) • Age and gender-specific cut-off
values must be used for individuals < 18 years of age
Defining OverweightDefining Overweight
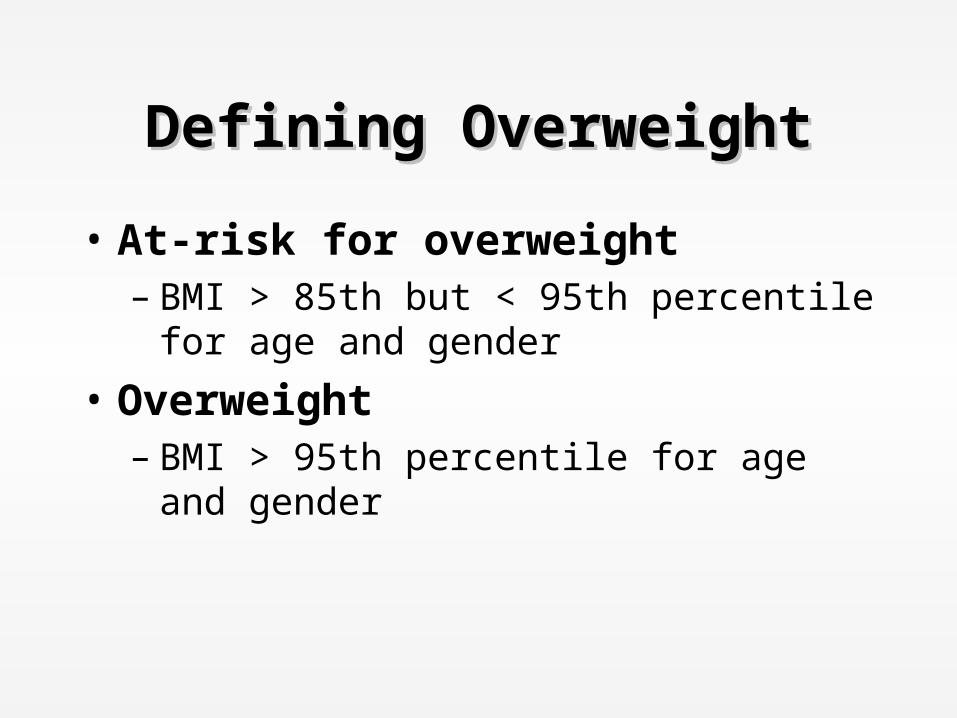
• At-risk for overweight – BMI > 85th but < 95th percentile for
age and gender
• Overweight – BMI > 95th percentile for age and
gender
California Health Interview California Health Interview Survey (CHIS)Survey (CHIS)
• 2001 population based survey for CA civilian, non-institutionalized pop
• Largest health survey in California• Provides pop-based estimates for CA
Counties• Major content includes
– Health related behaviors, health status and conditions, health insurance coverage and access to health care services
RESULTSRESULTS
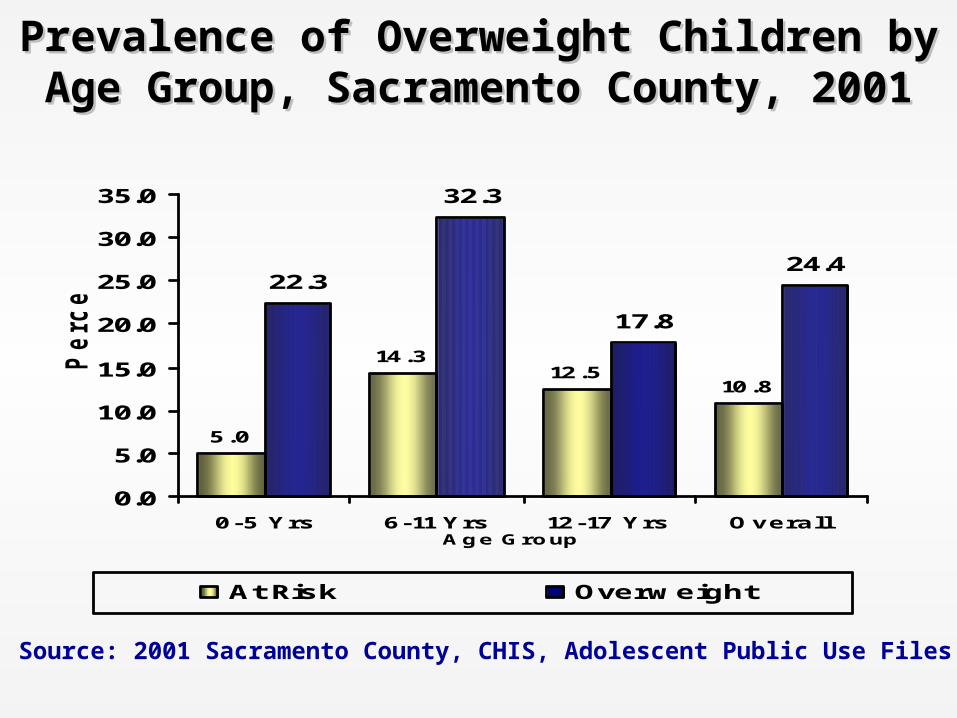
Prevalence of Overweight Children by Prevalence of Overweight Children by Age Group, Sacramento County, 2001Age Group, Sacramento County, 2001
Source: 2001 Sacramento County, CHIS, Adolescent Public Use Files
5.0
14.312.5
10.8
22.3
32.3
17.8
24.4
0.0
5.0
10.0
15.0
20.0
25.0
30.0
35.0
0-5 Yrs 6-11 Yrs 12-17 Yrs OverallAge Group
Percen
t
At Risk Overweight
Prevalence of Overweight Children by Prevalence of Overweight Children by Age and Sex, Sacramento County, Age and Sex, Sacramento County,
20012001
Source: 2001 Sacramento County, CHIS, Adolescent Public Use Files
4.8 5.223.4 21.312.0 17.3
28.4 37.3
16.0 8.9
22.8 12.5
0.0
10.0
20.0
30.040.0
50.0
60.0
70.0
80.0
Percen
t
0-5 Yrs 6-11 Yrs 12-17 Yrs
Physical ActivityPhysical Activity
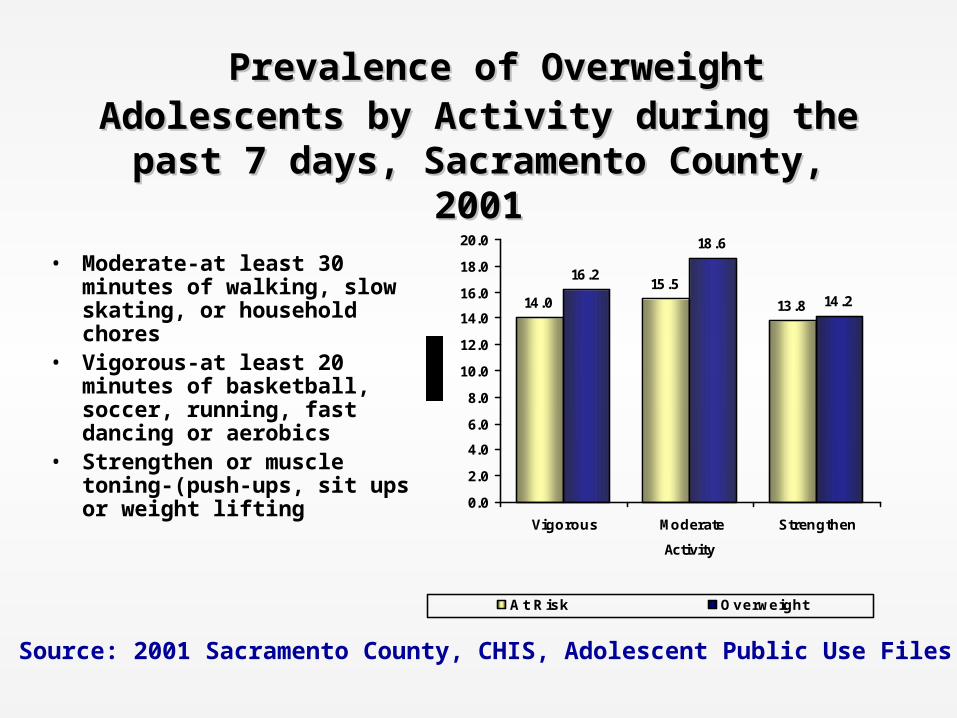
Prevalence of Overweight Prevalence of Overweight Adolescents by Activity during the Adolescents by Activity during the past 7 days, Sacramento County, past 7 days, Sacramento County,
20012001• Moderate-at least 30
minutes of walking, slow skating, or household chores
• Vigorous-at least 20 minutes of basketball, soccer, running, fast dancing or aerobics
• Strengthen or muscle toning-(push-ups, sit ups or weight lifting
14.015.5
13.8
16.2
18.6
14.2
0.0
2.0
4.0
6.0
8.0
10.0
12.0
14.0
16.0
18.0
20.0
Vigorous Moderate Strengthen
Activity
At Risk Overweight
Source: 2001 Sacramento County, CHIS, Adolescent Public Use Files
Television Viewing and Television Viewing and Video Game HoursVideo Game Hours
Prevalence of Overweight Adolescents by Prevalence of Overweight Adolescents by Television Viewing and Video Game Playing Television Viewing and Video Game Playing
M-F, Sacramento County, 2001M-F, Sacramento County, 2001
Source: 2001 Sacramento County, CHIS, Adolescent Public Use Files
66.2
33.8
26.1
73.9
0.0
10.0
20.0
30.0
40.0
50.0
60.0
70.0
80.0
1-2 Hrs 3 + HrsHour
At Risk Overweight
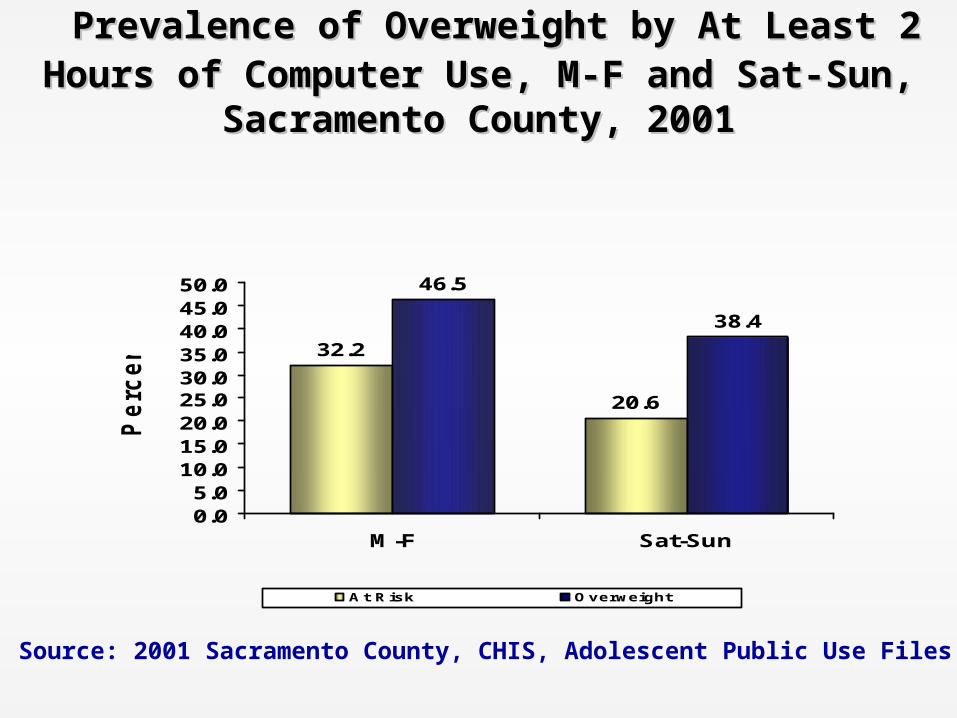
Prevalence of Overweight by At Least 2 Prevalence of Overweight by At Least 2 Hours of Computer Use, M-F and Sat-Sun, Hours of Computer Use, M-F and Sat-Sun,
Sacramento County, 2001Sacramento County, 2001
Source: 2001 Sacramento County, CHIS, Adolescent Public Use Files
32.2
20.6
46.5
38.4
0.05.0
10.015.020.025.030.035.040.045.050.0
M-F Sat-Sun
Pe
rce
nt
At Risk Overweight
Self Reported Food and Self Reported Food and Beverage IntakeBeverage Intake
Prevalence of Food and Beverage Prevalence of Food and Beverage Consumption, Sacramento County, 2001Consumption, Sacramento County, 2001
Source: 2001 Sacramento County, CHIS, Adolescent Public Use Files
67.560.8
24.2
49.853.8
0.0
10.0
20.0
30.0
40.0
50.0
60.0
70.0
80.0
Prevalence of Soda Consumption among Prevalence of Soda Consumption among Overweight Children by Age Group, Overweight Children by Age Group,
Sacramento, County 2001Sacramento, County 2001
Source: 2001 Sacramento County, CHIS, Adolescent Public Use Files
14.5
28.6
23.7
47.5
0.0
5.0
10.0
15.0
20.0
25.0
30.0
35.0
40.0
45.0
50.0
2-5 Years 6-11 Years
Pe
rce
nt
At Risk Overweight
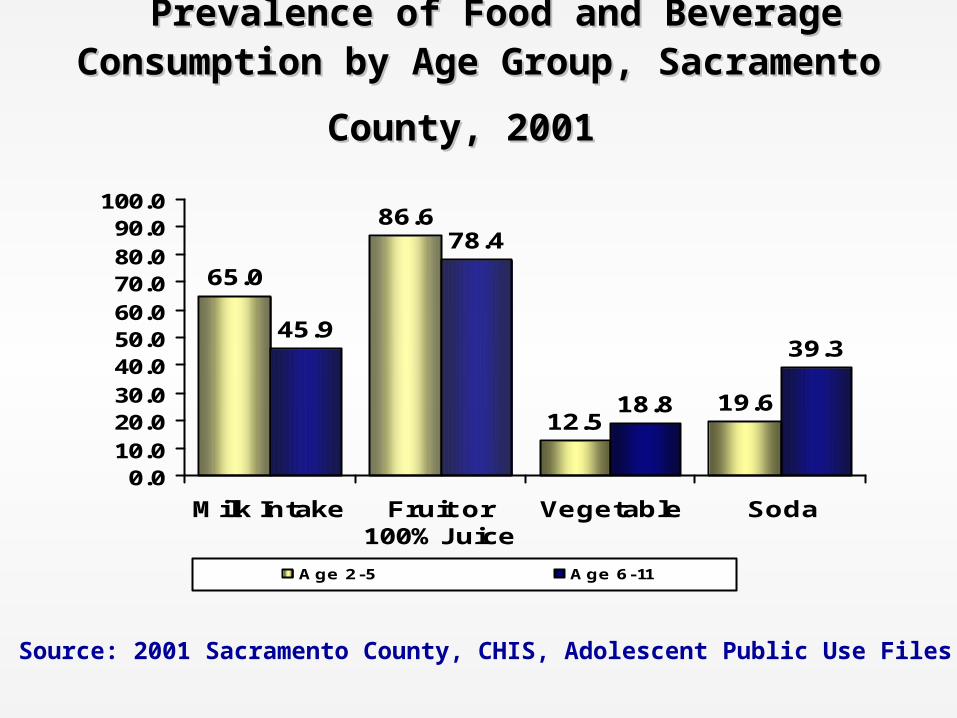
Prevalence of Food and BeveragePrevalence of Food and Beverage Consumption by Age Group, Sacramento Consumption by Age Group, Sacramento
County, 2001County, 2001
Source: 2001 Sacramento County, CHIS, Adolescent Public Use Files
65.0
86.6
12.519.6
45.9
78.4
18.8
39.3
0.010.020.030.040.050.060.070.080.090.0
100.0
Milk Intake Fruit or100% Juice
Vegetable Soda
Age 2-5 Age 6-11
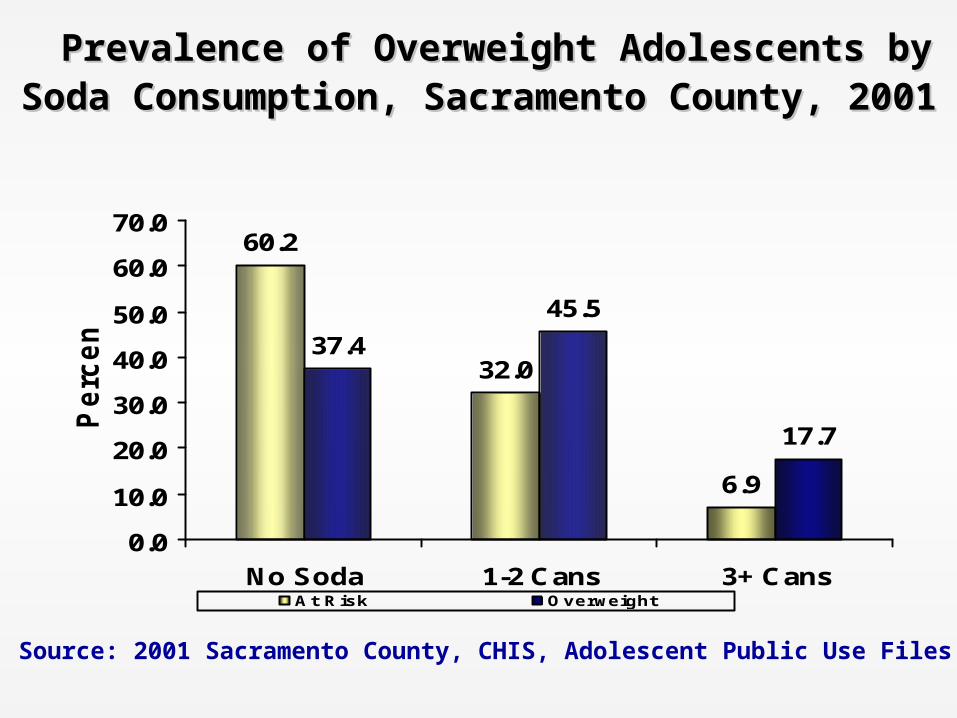
Prevalence of Overweight Adolescents by Prevalence of Overweight Adolescents by Soda Consumption, Sacramento County, Soda Consumption, Sacramento County,
20012001
Source: 2001 Sacramento County, CHIS, Adolescent Public Use Files
60.2
32.0
6.9
37.4
45.5
17.7
0.0
10.0
20.0
30.0
40.0
50.0
60.0
70.0
No Soda 1-2 Cans 3+ Cans
Pe
rce
nt
At Risk Overweight
Type of Insurance & Type of Insurance & Poverty LevelPoverty Level
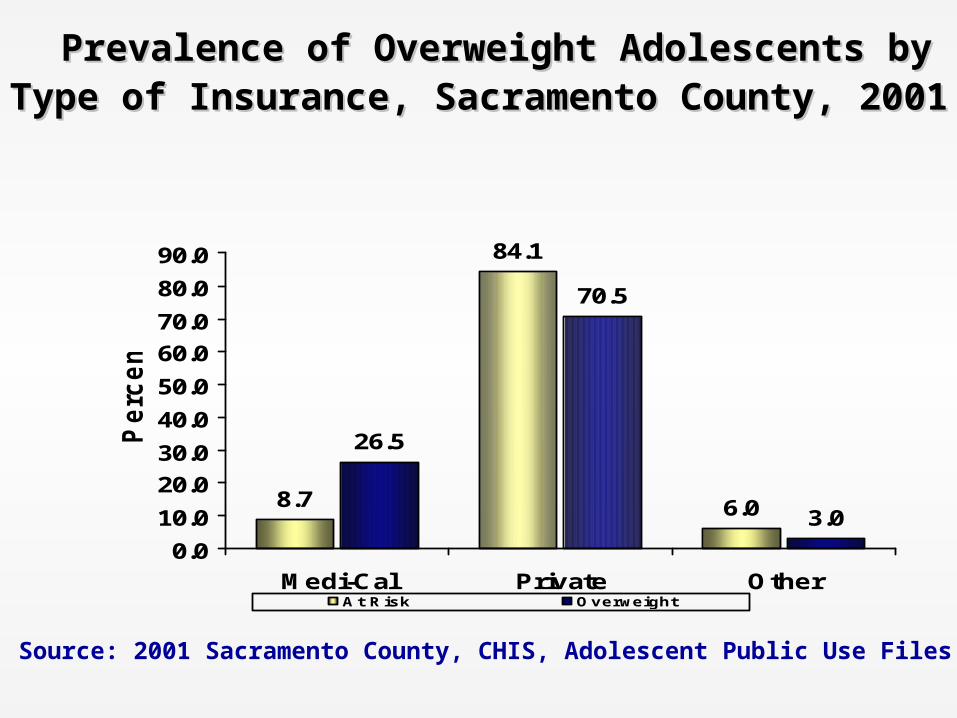
Prevalence of Overweight Adolescents by Prevalence of Overweight Adolescents by Type of Insurance, Sacramento County, Type of Insurance, Sacramento County,
20012001
Source: 2001 Sacramento County, CHIS, Adolescent Public Use Files
8.7
84.1
6.0
26.5
70.5
3.0
0.0
10.0
20.0
30.0
40.0
50.0
60.0
70.0
80.0
90.0
Medi-Cal Private Other
Pe
rce
nt
At Risk Overweight
Prevalence of Overweight among Children Prevalence of Overweight among Children by Federal Poverty Level, Sacramento by Federal Poverty Level, Sacramento
County, 2001County, 2001
Source: 2001 Sacramento County, CHIS, Adolescent Public Use Files
5.2
27.9
20.6
46.2
20.3 18.416.2
45.2
0.05.0
10.015.0
20.025.0
30.035.0
40.045.0
50.0
Less than100%
100-199% 200-299% 300% &Above
Perc
en
t
Age 2-5 Age 6-11
Prevalence of Adolescent Overweight by Prevalence of Adolescent Overweight by Federal Poverty Level, Sacramento County, Federal Poverty Level, Sacramento County,
20012001
Source: 2001 Sacramento County, CHIS, Adolescent Public Use Files
Why? Allows the estimation of risk or odds of overweight, while controlling for confounders such as age, sex, soda consumption,
etc SIMULTANEOUSLY
Multiple Logistic Regression of Overweight Multiple Logistic Regression of Overweight Among All Children aged 2-17 years, Among All Children aged 2-17 years,
Sacramento County, 2001 Sacramento County, 2001
Source: 2001 Sacramento County, CHIS, Adolescent Public Use Files
Risk MarkersRisk Markers AORAOR 95% CI95% CI
Federal Poverty Level (<100%)
3.05 2.74 – 3.38
Medi-Cal Insurance 2.97 2.74-3.22
Soda Intake (1+ Cans) 1.94 1.89 – 1.99
Fruit intake (3+ Servings)
0.86 0.84 – 0.89
Milk intake (4+ Servings)
0.77 0.74 – 0.80
Vegetable intake (3+ Servings)
0.76 0.72-0.79
Multiple Logistic Regression for Multiple Logistic Regression for Overweight. Children aged 2-11 years, Overweight. Children aged 2-11 years,
Sacramento County, 2001 Sacramento County, 2001
Source: 2001 Sacramento County, CHIS, Adolescent Public Use Files
Multiple Logistic Regression of Overweight Multiple Logistic Regression of Overweight Among Adolescents aged 12-17 years, Among Adolescents aged 12-17 years,
Sacramento County, 2001 Sacramento County, 2001
Source: 2001 Sacramento County, CHIS, Adolescent Public Use Files
Risk MarkersRisk Markers AORAOR 95% CI95% CI Federal Poverty Level (<100%)
15.82 14.66 – 17.80
Television Viewing M-F (2+ Hours)
5.84 5.44-6.26
Soda Intake (1+ Cans) 5.79 5.43 – 6.18
Computer Use M-F (2+ Hours)
2.79 2.63-2.96
Vegetable intake (3+ Servings)
0.88 0.81-0.95
Moderate Physical Activity (at least 30 minutes)
0.39 0.36-0.42
Milk intake (4+ Servings) 0.19 0.17 – 0.22
Muscle Strengthening Activity
0.17 0.16 – 0.19
LimitationsLimitations• Subject to at least 5 limitations
– First, CHIS excludes individuals without telephones, therefore may have underestimated percent overweight
– Second, data is self reported thus validity of data is unknown
– Third, small sample size—thus some comparable estimates may be unreliable (e.g. percentage of overweight Latino males not accurate)
– Fourth-excludes individuals with cell phones exclusively (younger, etc)
– Fifth-the response rate is low (less than 40%)
SummarySummary
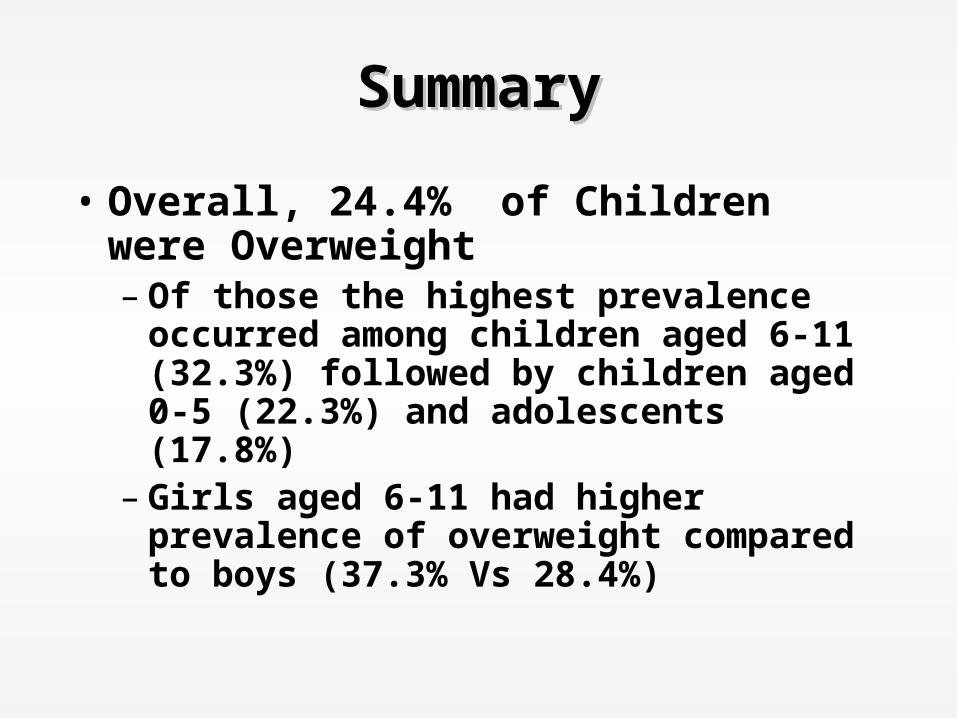
• Overall, 24.4% of Children were Overweight– Of those the highest prevalence
occurred among children aged 6-11 (32.3%) followed by children aged 0-5 (22.3%) and adolescents (17.8%)
– Girls aged 6-11 had higher prevalence of overweight compared to boys (37.3% Vs 28.4%)
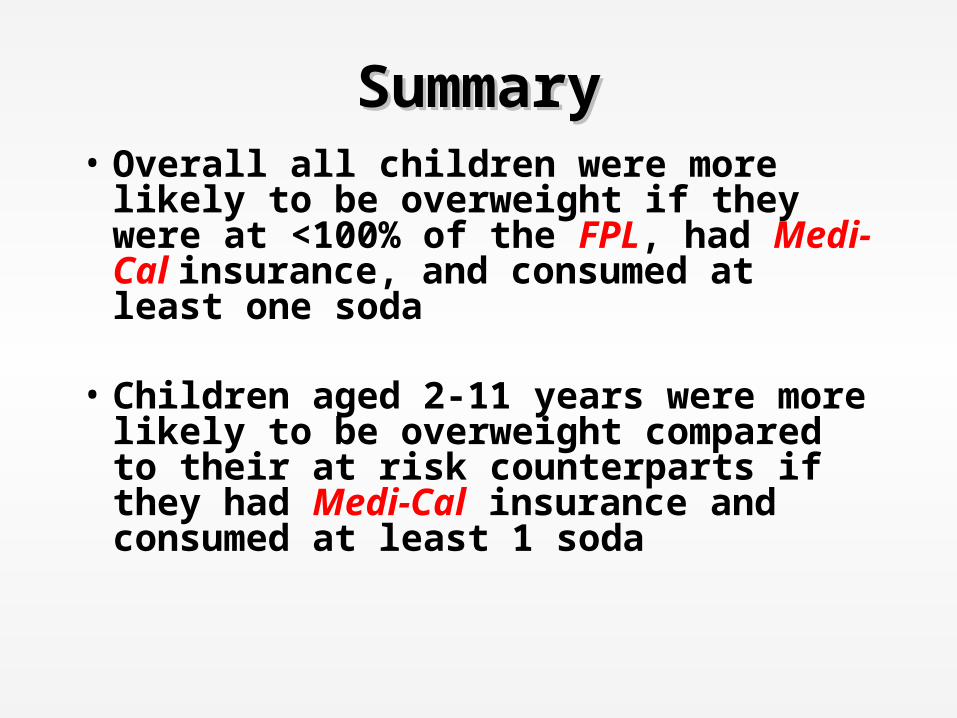
SummarySummary• Overall all children were more
likely to be overweight if they were at <100% of the FPL, had Medi-Cal insurance, and consumed at least one soda
• Children aged 2-11 years were more likely to be overweight compared to their at risk counterparts if they had Medi-Cal insurance and consumed at least 1 soda
SummarySummary• Adolescents were more likely to be
overweight compared to their at risk counterparts if were at < 100% of the FPL, viewed 2 or more hours of television or video games M-F, consumed at least one soda and used a computer at least 2 hours daily M-F.
• Milk intake, muscle strengthening, fruit intake, vegetable intake and moderate physical activity (at least 30 minutes daily) were associated with children being less likely to be overweight