China/Hong Kong | China Energy Please read the analyst certification and other important disclosures on last page Sinopec Kantons (934 HK) 8 October 2013 Embarking on a colossal transformation Sinopec Kantons’ (SK) recent acquisitions reaffirm its commitment to becoming a global logistics play on oil, petroleum and petrochemical transportation that will service a major portion of China’s imported demand. We expect the company to capitalize on its large net cash position of around HK$2b to pursue further acquisitions in 2013 and 2014. We forecast SK will achieve EPS CAGR growth of 42% in 2013-2015F (and at a 2014 P/E of 20x), underpinned by organic expansion, which is better than many listed infrastructure or logistics peers. On a DCF basis, we estimate SK’s target price at HK$8.70 (before any new acquisitions), offering attractive potential upside of 27%. Analysts Dr. Peter So (852) 2532 6786 [email protected]Rocky Zhang (852) 2532 2411 [email protected]
Transcript
China/Hong Kong | China Energy
Please read the analyst certification and other important disclosures on last page
Sinopec Kantons (934 HK) 8 October 2013
Embarking on a colossal transformation Sinopec Kantons’ (SK) recent acquisitions reaffirm its commitment to becoming a global logistics play on oil, petroleum and petrochemical transportation that will service a major portion of China’s imported demand. We expect the company to capitalize on its large net cash position of around HK$2b to pursue further acquisitions in 2013 and 2014.
We forecast SK will achieve EPS CAGR growth of 42% in 2013-2015F (and at a 2014 P/E of 20x), underpinned by organic expansion, which is better than many listed infrastructure or logistics peers. On a DCF basis, we estimate SK’s target price at HK$8.70 (before any new acquisitions), offering attractive potential upside of 27%.
Embarking on a colossal transformation Company Rating:
Outperform (initiation)
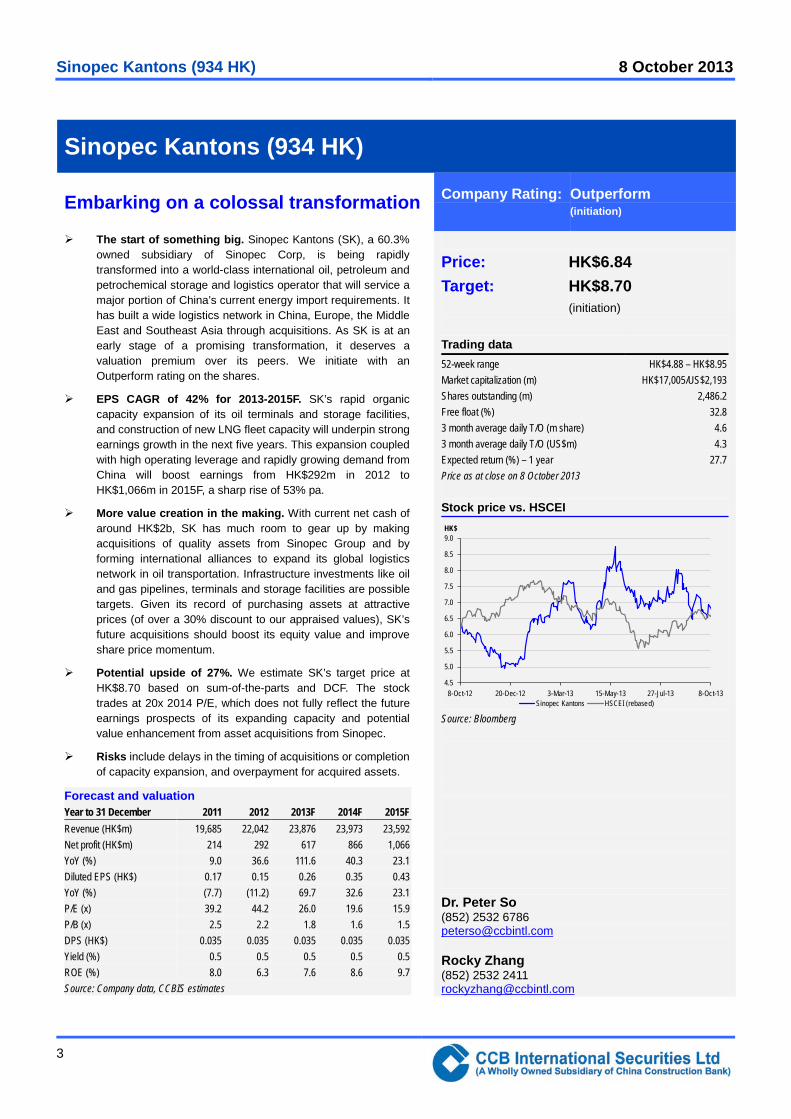
The start of something big. Sinopec Kantons (SK), a 60.3% owned subsidiary of Sinopec Corp, is being rapidly transformed into a world-class international oil, petroleum and petrochemical storage and logistics operator that will service a major portion of China’s current energy import requirements. It has built a wide logistics network in China, Europe, the Middle East and Southeast Asia through acquisitions. As SK is at an early stage of a promising transformation, it deserves a valuation premium over its peers. We initiate with an Outperform rating on the shares.
EPS CAGR of 42% for 2013-2015F. SK’s rapid organic capacity expansion of its oil terminals and storage facilities, and construction of new LNG fleet capacity will underpin strong earnings growth in the next five years. This expansion coupled with high operating leverage and rapidly growing demand from China will boost earnings from HK$292m in 2012 to HK$1,066m in 2015F, a sharp rise of 53% pa.
More value creation in the making. With current net cash of around HK$2b, SK has much room to gear up by making acquisitions of quality assets from Sinopec Group and by forming international alliances to expand its global logistics network in oil transportation. Infrastructure investments like oil and gas pipelines, terminals and storage facilities are possible targets. Given its record of purchasing assets at attractive prices (of over a 30% discount to our appraised values), SK’s future acquisitions should boost its equity value and improve share price momentum.
Potential upside of 27%. We estimate SK’s target price at HK$8.70 based on sum-of-the-parts and DCF. The stock trades at 20x 2014 P/E, which does not fully reflect the future earnings prospects of its expanding capacity and potential value enhancement from asset acquisitions from Sinopec.
Risks include delays in the timing of acquisitions or completion of capacity expansion, and overpayment for acquired assets.
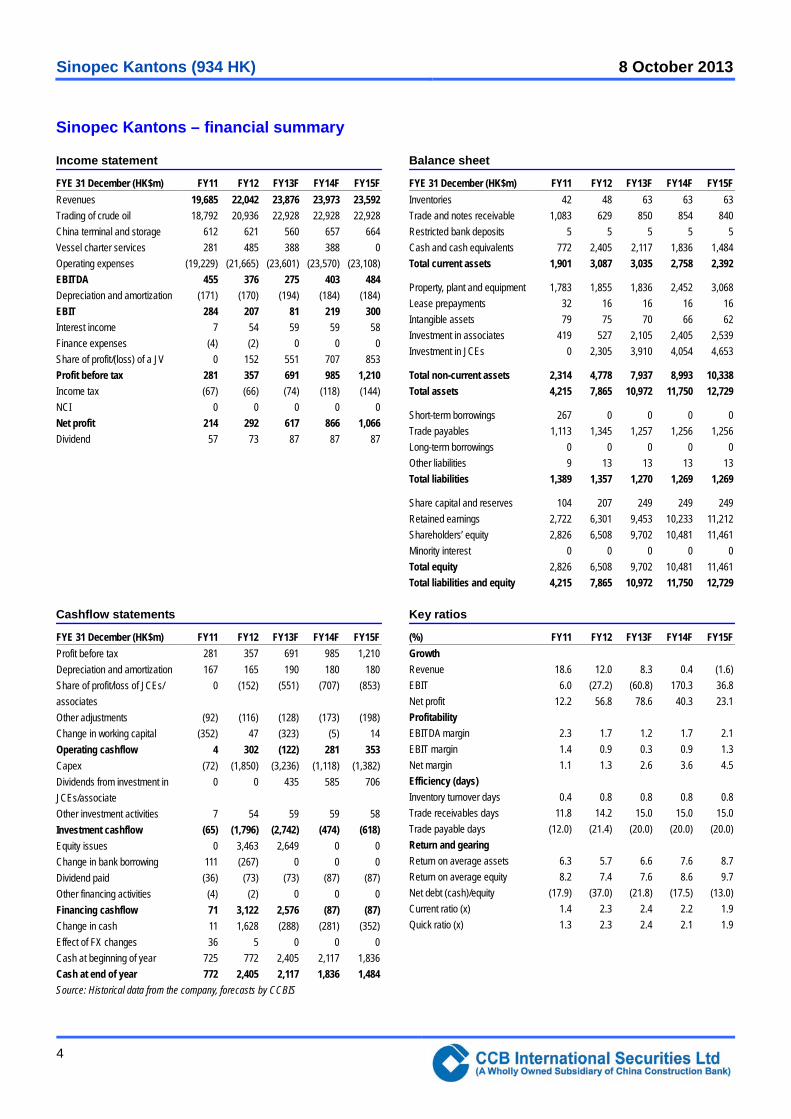
FYE 31 December (HK$m) FY11 FY12 FY13F FY14F FY15F Profit before tax 281 357 691 985 1,210 Depreciation and amortization 167 165 190 180 180 Share of profit/loss of JCEs/ associates
0 (152) (551) (707) (853)
Other adjustments (92) (116) (128) (173) (198) Change in working capital (352) 47 (323) (5) 14 Operating cashflow 4 302 (122) 281 353 Capex (72) (1,850) (3,236) (1,118) (1,382) Dividends from investment in JCEs/associate
0 0 435 585 706
Other investment activities 7 54 59 59 58 Investment cashflow (65) (1,796) (2,742) (474) (618) Equity issues 0 3,463 2,649 0 0 Change in bank borrowing 111 (267) 0 0 0 Dividend paid (36) (73) (73) (87) (87) Other financing activities (4) (2) 0 0 0 Financing cashflow 71 3,122 2,576 (87) (87) Change in cash 11 1,628 (288) (281) (352) Effect of FX changes 36 5 0 0 0 Cash at beginning of year 725 772 2,405 2,117 1,836 Cash at end of year 772 2,405 2,117 1,836 1,484
(%) FY11 FY12 FY13F FY14F FY15F Growth Revenue 18.6 12.0 8.3 0.4 (1.6) EBIT 6.0 (27.2) (60.8) 170.3 36.8 Net profit 12.2 56.8 78.6 40.3 23.1 Profitability EBITDA margin 2.3 1.7 1.2 1.7 2.1 EBIT margin 1.4 0.9 0.3 0.9 1.3 Net margin 1.1 1.3 2.6 3.6 4.5 Efficiency (days) Inventory turnover days 0.4 0.8 0.8 0.8 0.8 Trade receivables days 11.8 14.2 15.0 15.0 15.0 Trade payable days (12.0) (21.4) (20.0) (20.0) (20.0) Return and gearing Return on average assets 6.3 5.7 6.6 7.6 8.7 Return on average equity 8.2 7.4 7.6 8.6 9.7 Net debt (cash)/equity (17.9) (37.0) (21.8) (17.5) (13.0) Current ratio (x) 1.4 2.3 2.4 2.2 1.9 Quick ratio (x) 1.3 2.3 2.4 2.1 1.9
Source: Historical data from the company, forecasts by CCBIS
Sinopec Kantons (934 HK) 8 October 2013
5
Executive summary
Sinopec Kantons’ (SK) principal activities are crude oil trading, the operation of crude oil terminals and logistics services. The company is backed by Sinopec Corporation, one of the three-largest integrated oil services companies in China, which not only controls 60.33% of SK but is also SK’s key customer. Sinopec Corporation has been injecting assets into SK since 2011. We initiate coverage with an Outperform rating on the stock based on the following factors.
A unique play on China’s rising demand for energy
SK provides unique exposure to investment in China’s crude oil terminals and logistics activities in major global oil trading and distributing centers. As a listed specialized subsidiary of Sinopec Group, SK enjoys good service demand from Sinopec, which accounts for a major portion of China’s imported crude oil (65% in 2012). China’s growing demand for energy and petrochemicals and its expanding investment in overseas energy projects will be potent drivers of future revenue growth at SK.
High entry barriers limit competitive threat
The establishment of capital intensive oil terminals or storage facilities is tightly regulated by the Chinese authorities as well as governments overseas. This regulatory hurdle serves as an imposing entry barrier that reduces the threat of excess competition and earnings uncertainty. SK will benefit from steadily growing demand for energy in China as the domestic economy improves. In our view, SK’s lower earnings risk and good growth prospects justify a premium rating over its peers.
High operating leverage, but low financial risk
SK’s logistics business has high operating leverage with low variable costs, enabling it to enjoy improving margins and ROE as throughput volume for the oil terminals steadily increases in step with the expanding oil refining output of SK’s customers. SK, after its rights issue and share placement in 2012 and 2013 currently has net cash of close to HK$2b. This puts it in position to take advantage of lucrative business opportunities should they arise. In our view, SK has considerable headroom to gear up and increase return on equity while boosting equity value.
New earnings drivers
Since 2011, SK has acquired nine projects in China, the Middle East, Europe and Indonesia, some of which are undertaking further capacity expansion. Completion of this new capacity in 2013-2016F will significantly enhance SK’s earnings growth momentum. From 2015F, its new business in LNG vessel operations will become another earnings driver. In addition to organic growth, SK’s cash-rich position enables it to acquire more assets like oil pipelines with which to expand its earnings base.
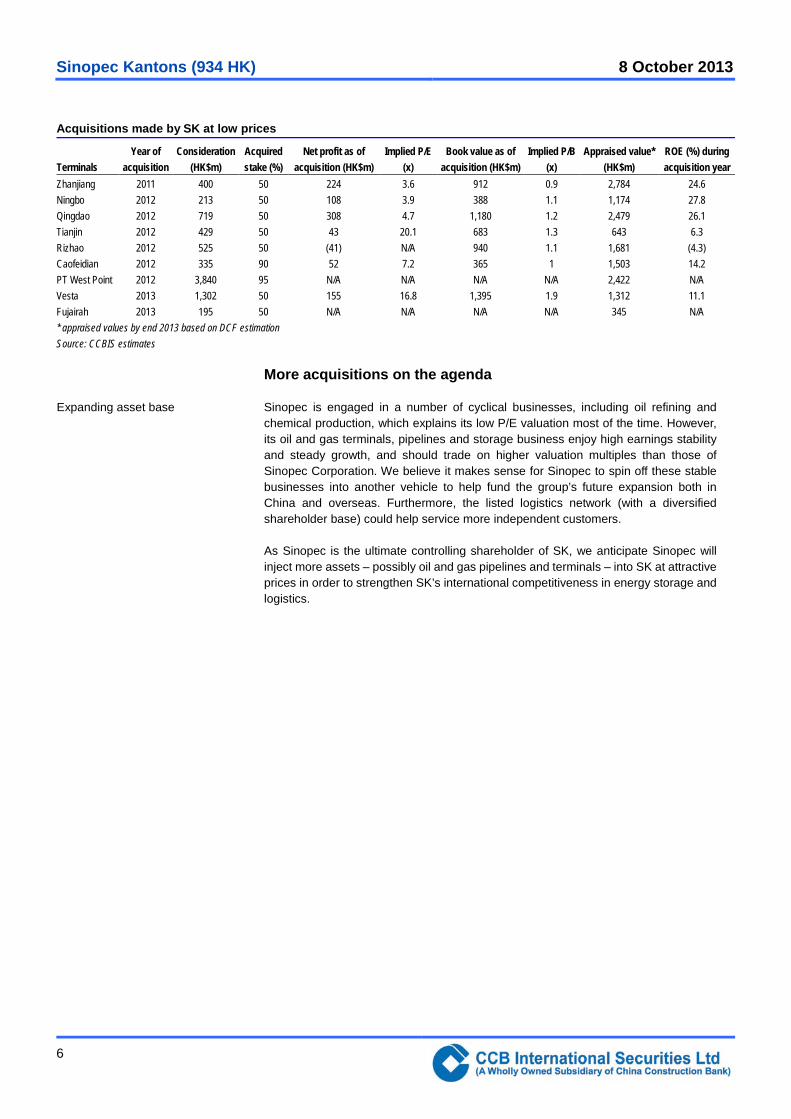
Good track record of acquiring assets at low prices
The following table shows the consideration SK paid and the valuation of the assets it acquired over past two years. Projects operated or acquired by SK have been reporting solid profit margins and ROE, and have contributed good cashflows to the group. On a both a P/E and P/B basis, the offer prices were attractive.
Sinopec is engaged in a number of cyclical businesses, including oil refining and chemical production, which explains its low P/E valuation most of the time. However, its oil and gas terminals, pipelines and storage business enjoy high earnings stability and steady growth, and should trade on higher valuation multiples than those of Sinopec Corporation. We believe it makes sense for Sinopec to spin off these stable businesses into another vehicle to help fund the group’s future expansion both in China and overseas. Furthermore, the listed logistics network (with a diversified shareholder base) could help service more independent customers.
As Sinopec is the ultimate controlling shareholder of SK, we anticipate Sinopec will inject more assets – possibly oil and gas pipelines and terminals – into SK at attractive prices in order to strengthen SK’s international competitiveness in energy storage and logistics.
Expanding asset base
Sinopec Kantons (934 HK) 8 October 2013
7
Risks
1. Delays in the completion of new projects. Major projects like the Fujairah Project in the Middle East and the PT West Point Project in Indonesia, are scheduled to be completed by end-2014F and mid-2016F, respectively. If there are any delays in these projects, SK’s earnings and value will be affected.
2. Delay in acquisitions of new assets from Sinopec. The market expects SK’s acquisitions to be realized in 2013-2014F. Any delay could disappoint the market and precipitate a fall in the share price.
3. Unattractive prices for acquisitions of new assets. If the offer prices for SK’s acquisitions are higher than expected (i.e. over 2.5x book value), it could disappoint the market and put downward pressure on the share price.
4. Fall in demand due to economic cycles. SK’s various business activities, notably crude oil trading and oil transportation, could be affected by the economic downturn, which might lower both oil prices and demand.
Sinopec Kantons (934 HK) 8 October 2013
8
Valuation
We apply a sum-of-the-parts (SOTP) method to estimate SK’s fair value based on its existing businesses together with a discounted cashflow method (DCF) to appraise the company’s existing projects. In our conservative projections, we have not incorporated any value enhancement associated with potential acquisitions. We estimate the 12-month target price for SK at HK$8.70, equivalent to 25x 2014F P/E. The stock is trading at a 30% discount to the target price.
SOTP valuation
Based on a combined SOTP and DCF methodology, we estimate SK’s fair value to be HK$8.72 per share (or 25x 2014 P/E), based on a weighted average cost of capital of 9.0% and a long-term growth rate of 1.0% along with a low debt-to-equity capital structure of 5.0%. Due to the stable nature of SK’s future cashflows, the share has a low beta value, we estimate at 0.8 (similar to the utility of infrastructure companies). Underpinned by the potential for value accretive acquisitions, we expect SK’s share price to trade towards the fair value, and we therefore set a 12-month target price of HK$8.70 for SK.
Should the company be able to finance future growth with more debt to lower its weighted average cost of capital, the company’s fair value should improve accordingly.
Valuation of Sinopec Kantons
Value (HK$m) Value per share (HK$) China’s terminals and storage facilities 14,681 5.9 Huade 4,417 1.8 Zhanjiang 2,784 1.1 Ningbo 1,174 0.5 Qingdao 2,479 1.0 Tianjin 643 0.3 Rizhao 1,681 0.7 Tangshan Caofeidian 1,503 0.6 Overseas terminal and storage facilities 4,079 1.6 PT West Point Project, Indonesia 2,422 1.0 Fujairah Project, Middle East 345 0.1 Vesta Project, Europe 1,312 0.5 LNG vessels 797 0.3 East China LNG Shipping 55 0.0 China Energy Shipping 742 0.3 Net cash (end-2013) 2,117 0.9 Total 21,674 8.72 Source: CCBIS estimates
Target price = HK$8.70/share
Sinopec Kantons (934 HK) 8 October 2013
9
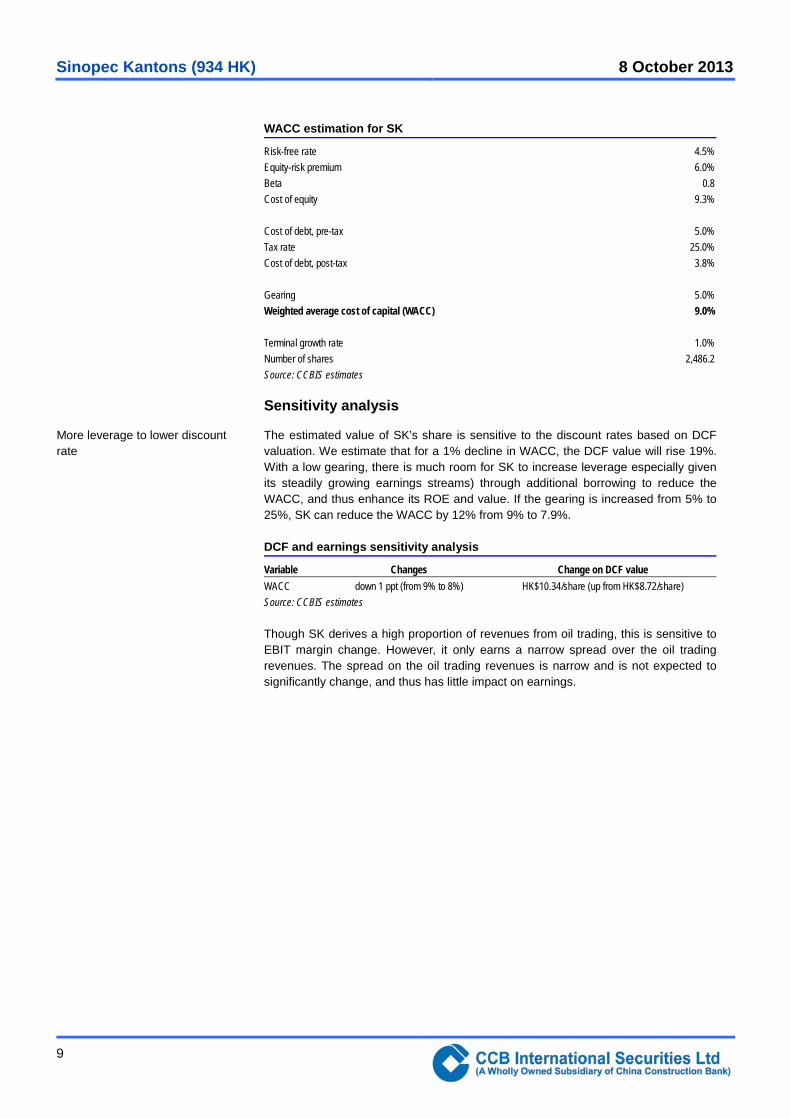
WACC estimation for SK
Risk-free rate 4.5% Equity-risk premium 6.0% Beta 0.8 Cost of equity 9.3% Cost of debt, pre-tax 5.0% Tax rate 25.0% Cost of debt, post-tax 3.8% Gearing 5.0% Weighted average cost of capital (WACC) 9.0% Terminal growth rate 1.0% Number of shares 2,486.2 Source: CCBIS estimates
Sensitivity analysis
The estimated value of SK’s share is sensitive to the discount rates based on DCF valuation. We estimate that for a 1% decline in WACC, the DCF value will rise 19%. With a low gearing, there is much room for SK to increase leverage especially given its steadily growing earnings streams) through additional borrowing to reduce the WACC, and thus enhance its ROE and value. If the gearing is increased from 5% to 25%, SK can reduce the WACC by 12% from 9% to 7.9%.
DCF and earnings sensitivity analysis
Variable Changes Change on DCF value WACC down 1 ppt (from 9% to 8%) HK$10.34/share (up from HK$8.72/share) Source: CCBIS estimates
Though SK derives a high proportion of revenues from oil trading, this is sensitive to EBIT margin change. However, it only earns a narrow spread over the oil trading revenues. The spread on the oil trading revenues is narrow and is not expected to significantly change, and thus has little impact on earnings.
More leverage to lower discount rate
Sinopec Kantons (934 HK) 8 October 2013
10
Peer comparison
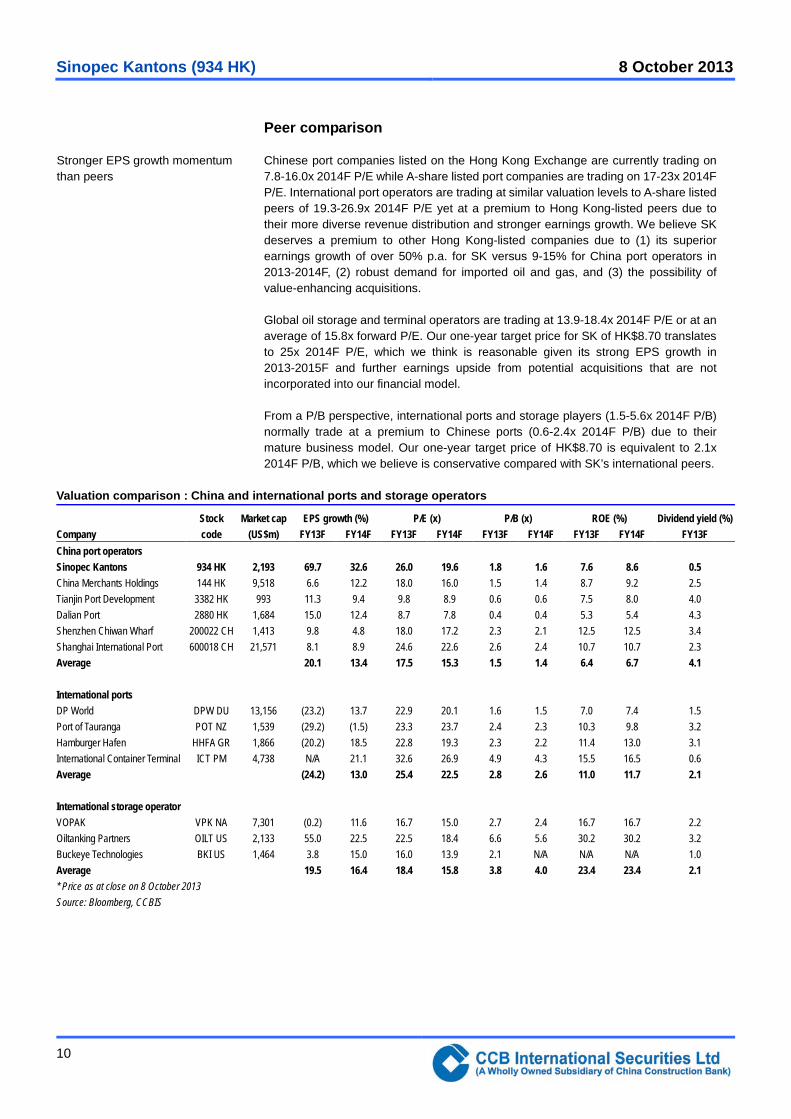
Chinese port companies listed on the Hong Kong Exchange are currently trading on 7.8-16.0x 2014F P/E while A-share listed port companies are trading on 17-23x 2014F P/E. International port operators are trading at similar valuation levels to A-share listed peers of 19.3-26.9x 2014F P/E yet at a premium to Hong Kong-listed peers due to their more diverse revenue distribution and stronger earnings growth. We believe SK deserves a premium to other Hong Kong-listed companies due to (1) its superior earnings growth of over 50% p.a. for SK versus 9-15% for China port operators in 2013-2014F, (2) robust demand for imported oil and gas, and (3) the possibility of value-enhancing acquisitions.
Global oil storage and terminal operators are trading at 13.9-18.4x 2014F P/E or at an average of 15.8x forward P/E. Our one-year target price for SK of HK$8.70 translates to 25x 2014F P/E, which we think is reasonable given its strong EPS growth in 2013-2015F and further earnings upside from potential acquisitions that are not incorporated into our financial model.
From a P/B perspective, international ports and storage players (1.5-5.6x 2014F P/B) normally trade at a premium to Chinese ports (0.6-2.4x 2014F P/B) due to their mature business model. Our one-year target price of HK$8.70 is equivalent to 2.1x 2014F P/B, which we believe is conservative compared with SK’s international peers.
Valuation comparison : China and international ports and storage operators
Stock Market cap EPS growth (%) P/E (x) P/B (x) ROE (%) Dividend yield (%) Company code (US$m) FY13F FY14F FY13F FY14F FY13F FY14F FY13F FY14F FY13F China port operators Sinopec Kantons 934 HK 2,193 69.7 32.6 26.0 19.6 1.8 1.6 7.6 8.6 0.5 China Merchants Holdings 144 HK 9,518 6.6 12.2 18.0 16.0 1.5 1.4 8.7 9.2 2.5 Tianjin Port Development 3382 HK 993 11.3 9.4 9.8 8.9 0.6 0.6 7.5 8.0 4.0 Dalian Port 2880 HK 1,684 15.0 12.4 8.7 7.8 0.4 0.4 5.3 5.4 4.3 Shenzhen Chiwan Wharf 200022 CH 1,413 9.8 4.8 18.0 17.2 2.3 2.1 12.5 12.5 3.4 Shanghai International Port 600018 CH 21,571 8.1 8.9 24.6 22.6 2.6 2.4 10.7 10.7 2.3 Average 20.1 13.4 17.5 15.3 1.5 1.4 6.4 6.7 4.1 International ports DP World DPW DU 13,156 (23.2) 13.7 22.9 20.1 1.6 1.5 7.0 7.4 1.5 Port of Tauranga POT NZ 1,539 (29.2) (1.5) 23.3 23.7 2.4 2.3 10.3 9.8 3.2 Hamburger Hafen HHFA GR 1,866 (20.2) 18.5 22.8 19.3 2.3 2.2 11.4 13.0 3.1 International Container Terminal ICT PM 4,738 N/A 21.1 32.6 26.9 4.9 4.3 15.5 16.5 0.6 Average (24.2) 13.0 25.4 22.5 2.8 2.6 11.0 11.7 2.1 International storage operator VOPAK VPK NA 7,301 (0.2) 11.6 16.7 15.0 2.7 2.4 16.7 16.7 2.2 Oiltanking Partners OILT US 2,133 55.0 22.5 22.5 18.4 6.6 5.6 30.2 30.2 3.2 Buckeye Technologies BKI US 1,464 3.8 15.0 16.0 13.9 2.1 N/A N/A N/A 1.0 Average 19.5 16.4 18.4 15.8 3.8 4.0 23.4 23.4 2.1 * Price as at close on 8 October 2013 Source: Bloomberg, CCBIS
Stronger EPS growth momentum than peers
Sinopec Kantons (934 HK) 8 October 2013
11
Potential acquisitions to further enhance NAV
Impressive value creating asset acquisitions
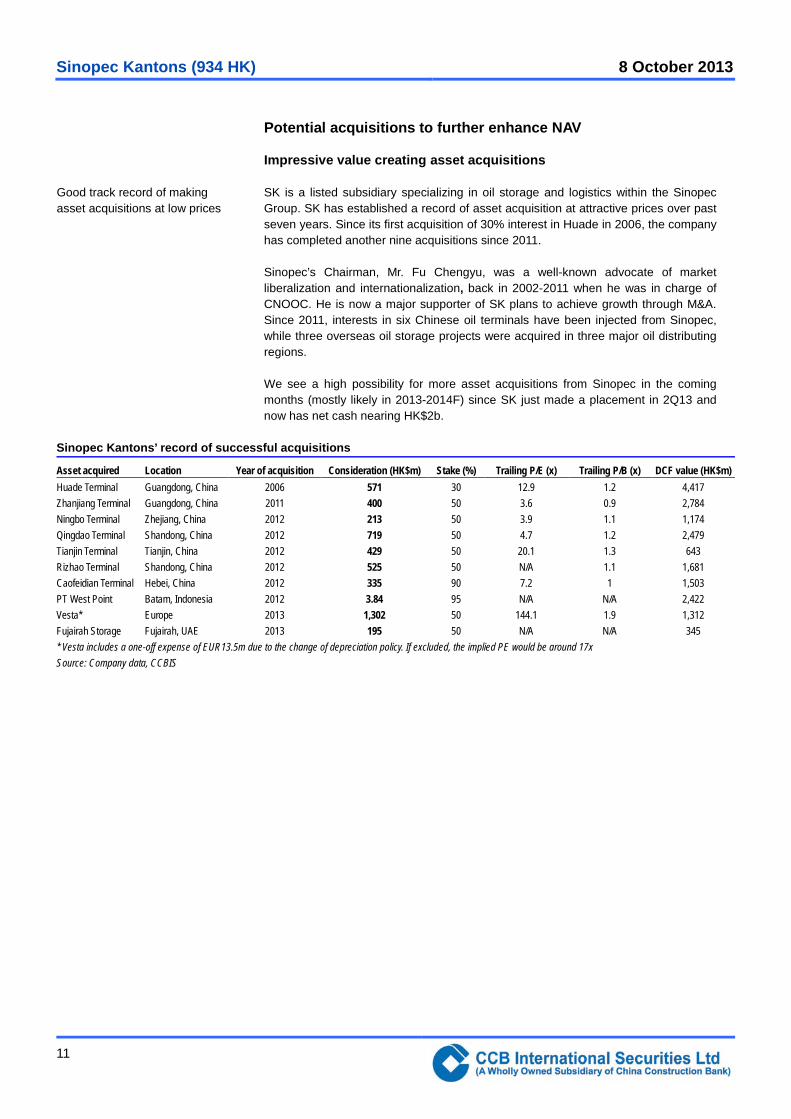
SK is a listed subsidiary specializing in oil storage and logistics within the Sinopec Group. SK has established a record of asset acquisition at attractive prices over past seven years. Since its first acquisition of 30% interest in Huade in 2006, the company has completed another nine acquisitions since 2011.
Sinopec’s Chairman, Mr. Fu Chengyu, was a well-known advocate of market liberalization and internationalization, back in 2002-2011 when he was in charge of CNOOC. He is now a major supporter of SK plans to achieve growth through M&A. Since 2011, interests in six Chinese oil terminals have been injected from Sinopec, while three overseas oil storage projects were acquired in three major oil distributing regions.
We see a high possibility for more asset acquisitions from Sinopec in the coming months (mostly likely in 2013-2014F) since SK just made a placement in 2Q13 and now has net cash nearing HK$2b.
Sinopec Kantons’ record of successful acquisitions
Asset acquired Location Year of acquisition Consideration (HK$m) Stake (%) Trailing P/E (x) Trailing P/B (x) DCF value (HK$m) Huade Terminal Guangdong, China 2006 571 30 12.9 1.2 4,417 Zhanjiang Terminal Guangdong, China 2011 400 50 3.6 0.9 2,784 Ningbo Terminal Zhejiang, China 2012 213 50 3.9 1.1 1,174 Qingdao Terminal Shandong, China 2012 719 50 4.7 1.2 2,479 Tianjin Terminal Tianjin, China 2012 429 50 20.1 1.3 643 Rizhao Terminal Shandong, China 2012 525 50 N/A 1.1 1,681 Caofeidian Terminal Hebei, China 2012 335 90 7.2 1 1,503 PT West Point Batam, Indonesia 2012 3.84 95 N/A N/A 2,422 Vesta* Europe 2013 1,302 50 144.1 1.9 1,312 Fujairah Storage Fujairah, UAE 2013 195 50 N/A N/A 345 * Vesta includes a one-off expense of EUR13.5m due to the change of depreciation policy. If excluded, the implied PE would be around 17x Source: Company data, CCBIS
Good track record of making asset acquisitions at low prices
Sinopec Kantons (934 HK) 8 October 2013
12
Value accretive acquisitions boost stock price performance
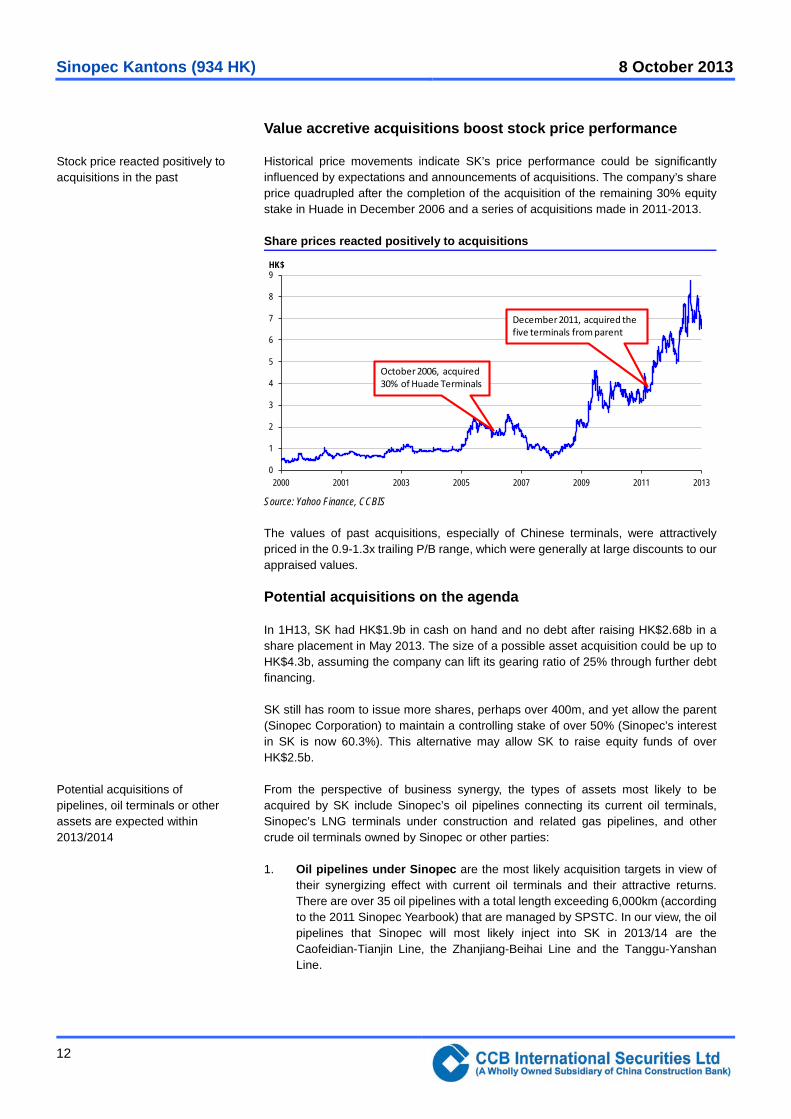
Historical price movements indicate SK’s price performance could be significantly influenced by expectations and announcements of acquisitions. The company’s share price quadrupled after the completion of the acquisition of the remaining 30% equity stake in Huade in December 2006 and a series of acquisitions made in 2011-2013.
Share prices reacted positively to acquisitions
0
1
2
3
4
5
6
7
8
9
2000 2001 2003 2005 2007 2009 2011 2013
HK$
October 2006, acquired 30% of Huade Terminals
5ecember 2011, acquired the five terminals from parent
Source: Yahoo Finance, CCBIS
The values of past acquisitions, especially of Chinese terminals, were attractively priced in the 0.9-1.3x trailing P/B range, which were generally at large discounts to our appraised values.
Potential acquisitions on the agenda
In 1H13, SK had HK$1.9b in cash on hand and no debt after raising HK$2.68b in a share placement in May 2013. The size of a possible asset acquisition could be up to HK$4.3b, assuming the company can lift its gearing ratio of 25% through further debt financing.
SK still has room to issue more shares, perhaps over 400m, and yet allow the parent (Sinopec Corporation) to maintain a controlling stake of over 50% (Sinopec’s interest in SK is now 60.3%). This alternative may allow SK to raise equity funds of over HK$2.5b.
From the perspective of business synergy, the types of assets most likely to be acquired by SK include Sinopec’s oil pipelines connecting its current oil terminals, Sinopec’s LNG terminals under construction and related gas pipelines, and other crude oil terminals owned by Sinopec or other parties:
1. Oil pipelines under Sinopec are the most likely acquisition targets in view of their synergizing effect with current oil terminals and their attractive returns. There are over 35 oil pipelines with a total length exceeding 6,000km (according to the 2011 Sinopec Yearbook) that are managed by SPSTC. In our view, the oil pipelines that Sinopec will most likely inject into SK in 2013/14 are the Caofeidian-Tianjin Line, the Zhanjiang-Beihai Line and the Tanggu-Yanshan Line.
Stock price reacted positively to acquisitions in the past
Potential acquisitions of pipelines, oil terminals or other assets are expected within 2013/2014
Sinopec Kantons (934 HK) 8 October 2013
13
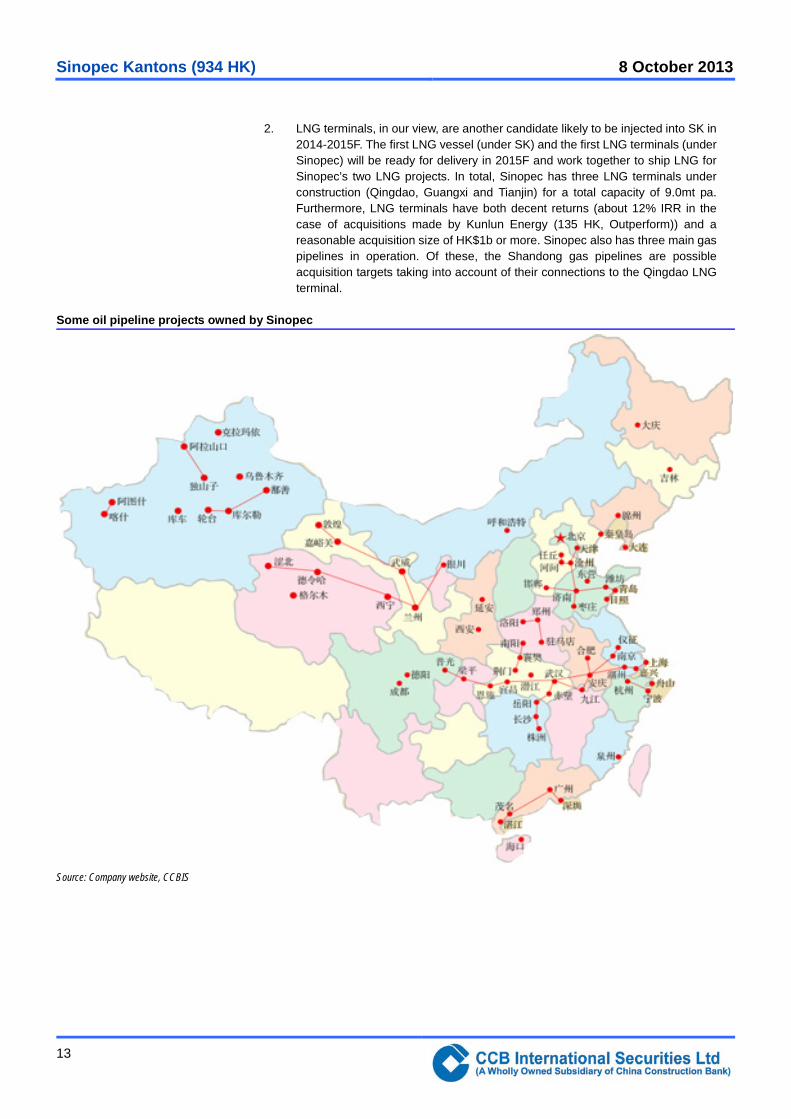
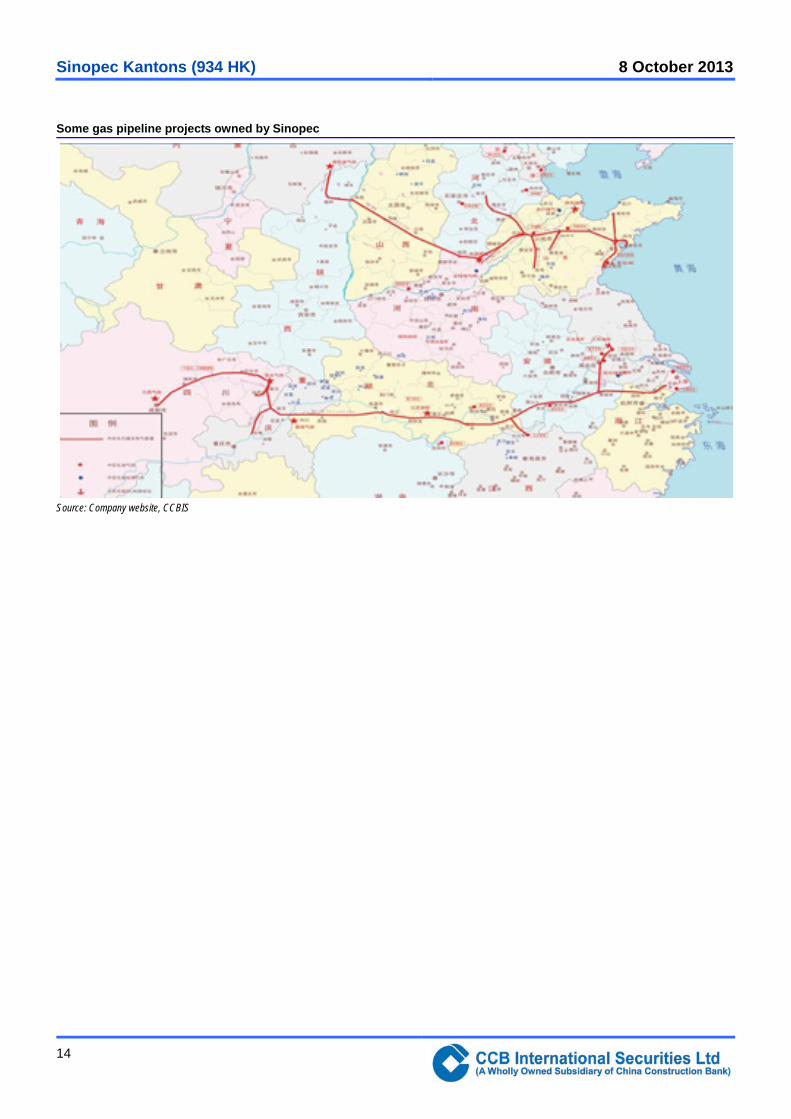
2. LNG terminals, in our view, are another candidate likely to be injected into SK in 2014-2015F. The first LNG vessel (under SK) and the first LNG terminals (under Sinopec) will be ready for delivery in 2015F and work together to ship LNG for Sinopec’s two LNG projects. In total, Sinopec has three LNG terminals under construction (Qingdao, Guangxi and Tianjin) for a total capacity of 9.0mt pa. Furthermore, LNG terminals have both decent returns (about 12% IRR in the case of acquisitions made by Kunlun Energy (135 HK, Outperform)) and a reasonable acquisition size of HK$1b or more. Sinopec also has three main gas pipelines in operation. Of these, the Shandong gas pipelines are possible acquisition targets taking into account of their connections to the Qingdao LNG terminal.
Some oil pipeline projects owned by Sinopec
Source: Company website, CCBIS
Sinopec Kantons (934 HK) 8 October 2013
14
Some gas pipeline projects owned by Sinopec
Source: Company website, CCBIS
Sinopec Kantons (934 HK) 8 October 2013
15
Business activities of Sinopec Kantons
SK, listed on the Hong Kong Stock Exchange in 1999, is engaged in
1. Crude oil trading
2. Crude oil terminal services in China and overseas (crude oil transportation via pipelines, loading, unloading and storage)
3. Vessel chartering services for crude oil transportation and floating oil storage
The company is 60.33% owned by Sinopec Group via UNIPEC (refer to appendix III for the detailed shareholder structure of SK group). UNIPEC, one of the largest oil trading companies in the world, is principally engaged in the import of crude oil, the import and export of oil products and oil processing for Sinopec Group, and in the international oil trading business.
Crude oil trading
The low-margin crude oil trading business (below 1.0% EBIT margin since 2008) accounted for the bulk of SK’s revenue in 1H13 (96.6%) but had a negative contribution to operating profit.
SK’s revenue breakdown in 1H13
Trading of crude oil97%
China terminaland storage
2%
Vessel charter services1%
Source: CCBIS
Crude oil trading contributed 97% revenue but little to profit
Sinopec Kantons (934 HK) 8 October 2013
16
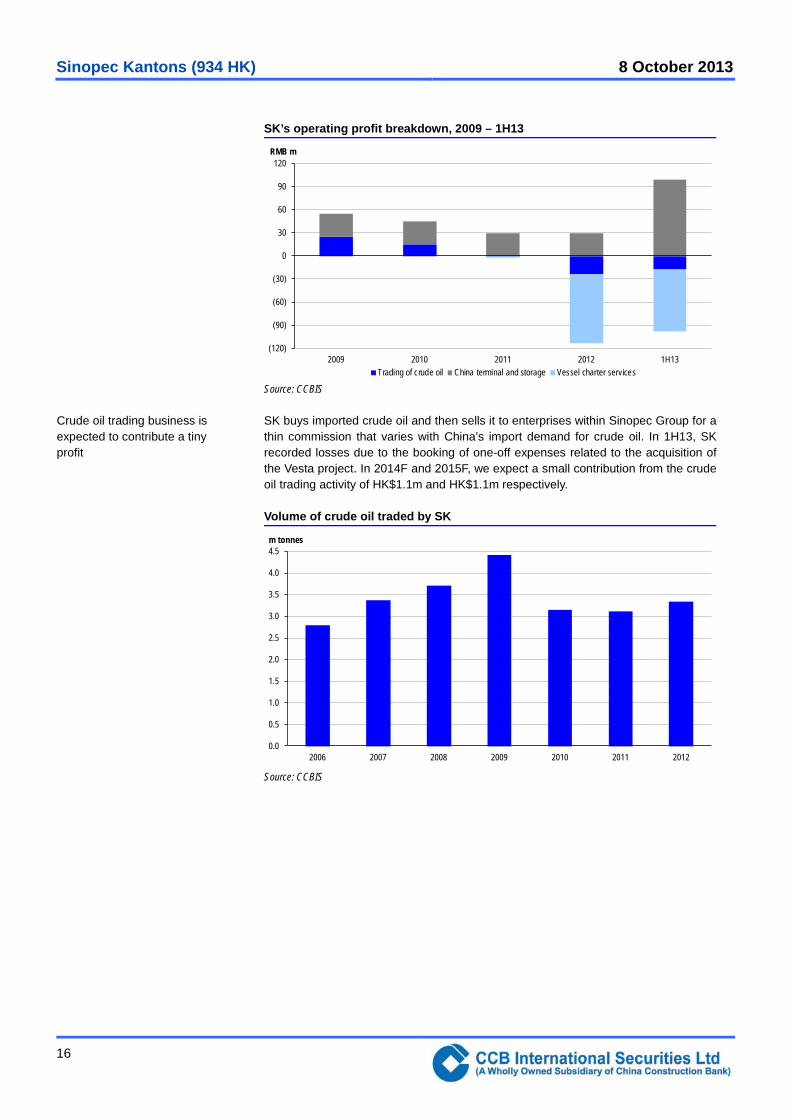
SK’s operating profit breakdown, 2009 – 1H13
(120)
(90)
(60)
(30)
0
30
60
90
120
2009 2010 2011 2012 1H13
RMB m
Trading of crude oil China terminal and storage Vessel charter services Source: CCBIS
SK buys imported crude oil and then sells it to enterprises within Sinopec Group for a thin commission that varies with China’s import demand for crude oil. In 1H13, SK recorded losses due to the booking of one-off expenses related to the acquisition of the Vesta project. In 2014F and 2015F, we expect a small contribution from the crude oil trading activity of HK$1.1m and HK$1.1m respectively.
Volume of crude oil traded by SK
0.0
0.5
1.0
1.5
2.0
2.5
3.0
3.5
4.0
4.5
2006 2007 2008 2009 2010 2011 2012
m tonnes
Source: CCBIS
Crude oil trading business is expected to contribute a tiny profit
Sinopec Kantons (934 HK) 8 October 2013
17
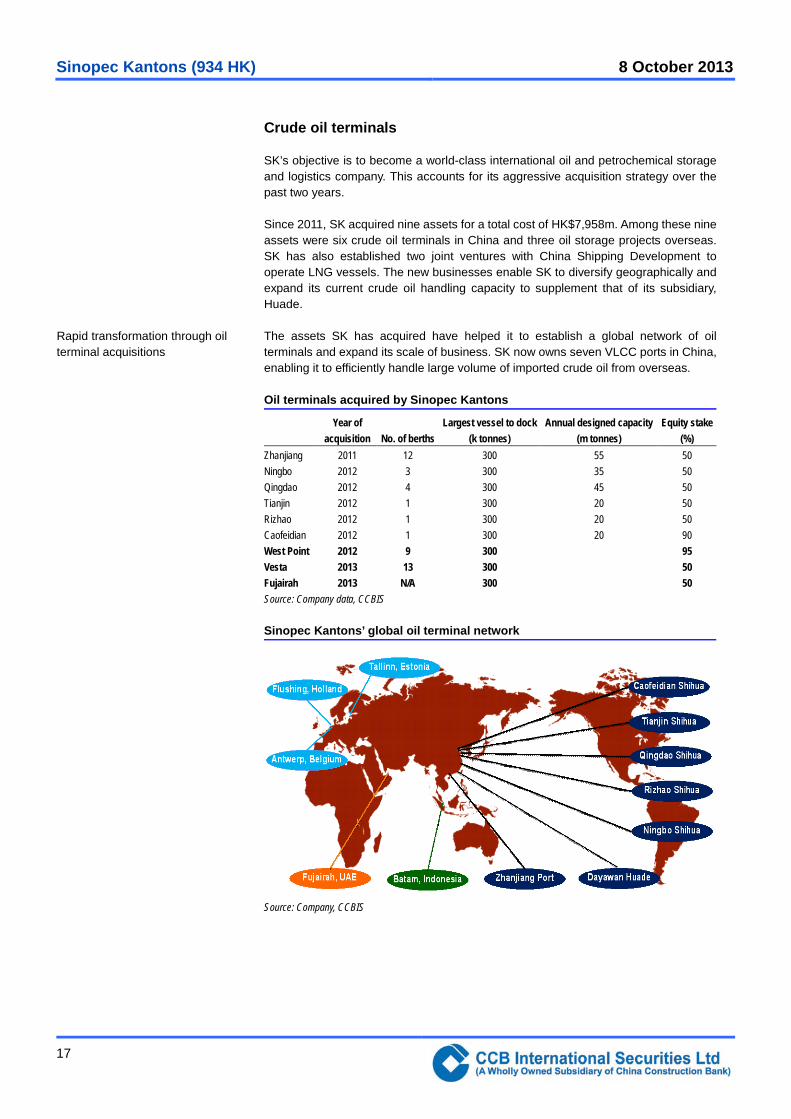
Crude oil terminals
SK’s objective is to become a world-class international oil and petrochemical storage and logistics company. This accounts for its aggressive acquisition strategy over the past two years.
Since 2011, SK acquired nine assets for a total cost of HK$7,958m. Among these nine assets were six crude oil terminals in China and three oil storage projects overseas. SK has also established two joint ventures with China Shipping Development to operate LNG vessels. The new businesses enable SK to diversify geographically and expand its current crude oil handling capacity to supplement that of its subsidiary, Huade.
The assets SK has acquired have helped it to establish a global network of oil terminals and expand its scale of business. SK now owns seven VLCC ports in China, enabling it to efficiently handle large volume of imported crude oil from overseas.
Rapid transformation through oil terminal acquisitions
Sinopec Kantons (934 HK) 8 October 2013
18
Selective oil terminals/storage facilities held by SK
Huade (100% owned)
Huade is responsible for the operation of the Huizhou Crude Oil Jetty, which is engaged in crude oil unloading, storage and transmission activities. The jetty complex, located at Mabianzhou Island in Huizhou Guangdong, provides oil tanker handling, storage and pipeline transmission facilities. It has two berths and can dock 250k tonnage tankers. The storage oil tanks have a total capacity of 800k m3 connected to Sinopec Guangzhou Branch.
Zhan Jiang Port Petrochemical Jetty Co (50% owned)
The Zhan Jiang Port is one of the 25 main ports of China connecting southwest and southern China to other regions. SK holds a 50% stake in Zhan Jiang Port Petrochemical Jetty, which provides logistics services including storage, logistics, jetty and distribution of oil and petrochemical products. It owns 12 berths, and is able to dock 300k tonnage ships. Annual throughput capacity is 55m tonnes.
In addition, the project owns 59 storage tanks (including 52 oil tanks and 3 gas tanks), with a total storage capacity of over half a million cubic meters. It serves refineries at Maoming, Zhan Jiang, Bei Hai and southwest China.
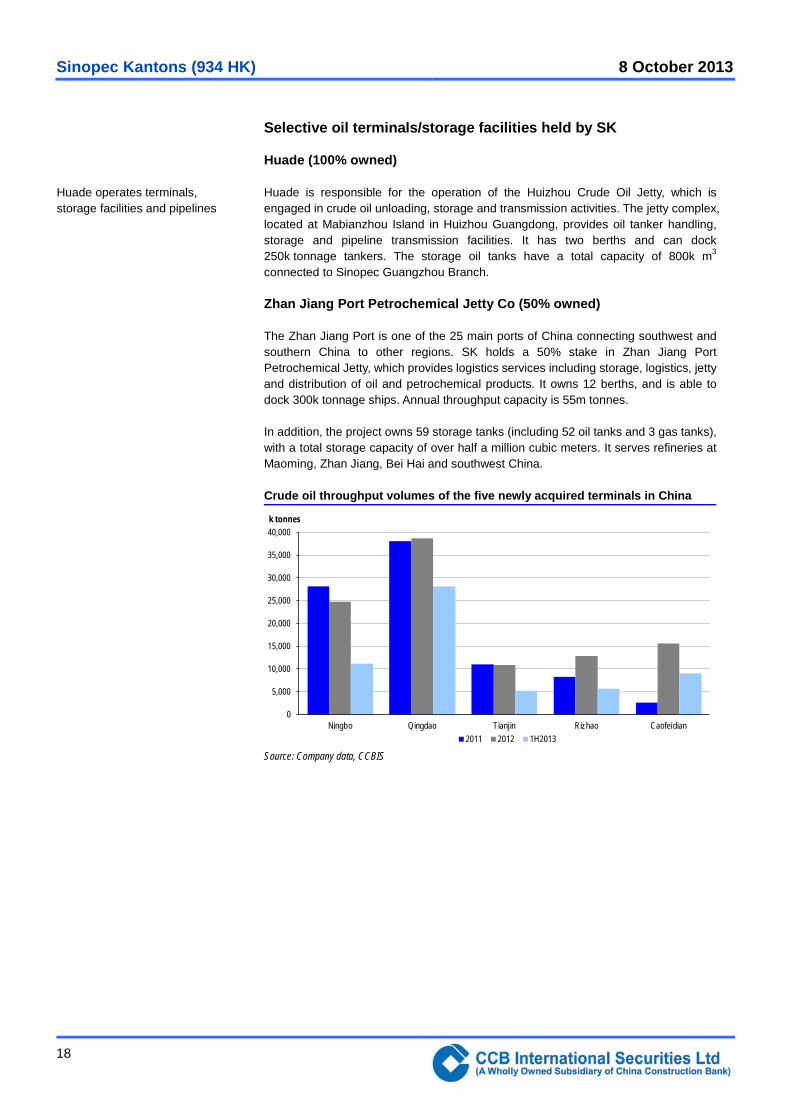
Crude oil throughput volumes of the five newly acquired terminals in China
0
5,000
10,000
15,000
20,000
25,000
30,000
35,000
40,000
Ningbo Qingdao Tianjin Rizhao Caofeidian
k tonnes
2011 2012 1H2013 Source: Company data, CCBIS
Huade operates terminals, storage facilities and pipelines
Sinopec Kantons (934 HK) 8 October 2013
19
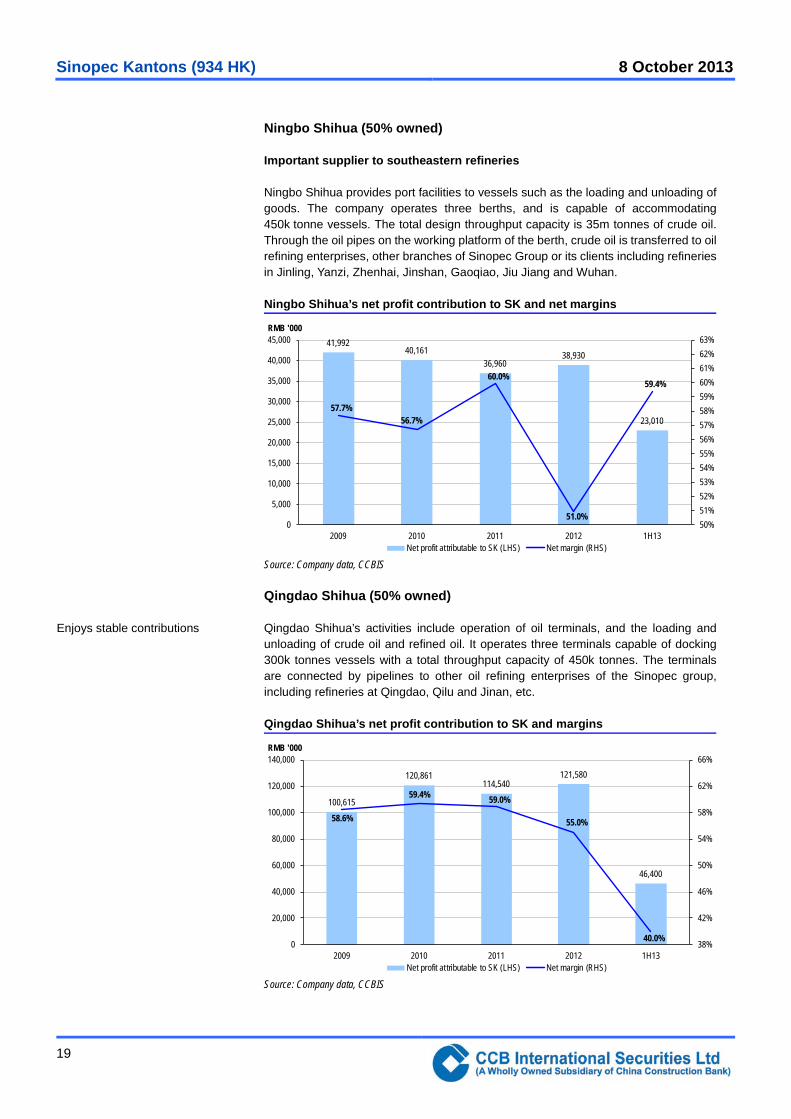
Ningbo Shihua (50% owned)
Important supplier to southeastern refineries
Ningbo Shihua provides port facilities to vessels such as the loading and unloading of goods. The company operates three berths, and is capable of accommodating 450k tonne vessels. The total design throughput capacity is 35m tonnes of crude oil. Through the oil pipes on the working platform of the berth, crude oil is transferred to oil refining enterprises, other branches of Sinopec Group or its clients including refineries in Jinling, Yanzi, Zhenhai, Jinshan, Gaoqiao, Jiu Jiang and Wuhan.
Ningbo Shihua’s net profit contribution to SK and net margins
41,99240,161
36,96038,930
23,01057.7%
56.7%
60.0%
51.0%
59.4%
50%51%52%53%54%55%56%57%58%59%60%61%62%63%
0
5,000
10,000
15,000
20,000
25,000
30,000
35,000
40,000
45,000
2009 2010 2011 2012 1H13
RMB '000
Net profit at tributable to SK (LHS) Net margin (RHS) Source: Company data, CCBIS
Qingdao Shihua (50% owned)
Qingdao Shihua’s activities include operation of oil terminals, and the loading and unloading of crude oil and refined oil. It operates three terminals capable of docking 300k tonnes vessels with a total throughput capacity of 450k tonnes. The terminals are connected by pipelines to other oil refining enterprises of the Sinopec group, including refineries at Qingdao, Qilu and Jinan, etc.
Qingdao Shihua’s net profit contribution to SK and margins
100,615
120,861114,540
121,580
46,400
58.6%
59.4% 59.0%
55.0%
40.0% 38%
42%
46%
50%
54%
58%
62%
66%
0
20,000
40,000
60,000
80,000
100,000
120,000
140,000
2009 2010 2011 2012 1H13
RMB '000
Net profit at tributable to SK (LHS) Net margin (RHS) Source: Company data, CCBIS
Enjoys stable contributions
Sinopec Kantons (934 HK) 8 October 2013
20
Tianjin Port Shihua (50% owned)
The joint venture operates one crude oil terminal capable of docking 300k tonne vessels with total annual capacity of 20m tonnes of crude oil. It serves refineries at Tianjin, Yanshan, Shijiazhuang, Cangzhou and northern China.
Tianjin Port Shihua’s net profit contribution to SK and margins
2,216
22,96523,950
12,360
5,980
5.2%
34.5%
60.0% 51.0%
59.4%
0%
10%
20%
30%
40%
50%
60%
70%
0
3,000
6,000
9,000
12,000
15,000
18,000
21,000
24,000
27,000
2009 2010 2011 2012 1H13
RMB '000
Net profit at tributable to SK (LHS) Net margin (RHS) Source: CCBIS
Rizhao Shihua (50% owned)
Rizhao Shihua operates a 300k tonnes crude oil terminal at Rizhao Port Lanshan North Port Area. It has a design capacity of 20m tonnes of crude oil. The company serves refineries at Jiu Jiang, Jingmen, Luoyang and Wuhan.
Rizhao Shihua’s net profit contribution to SK and margins
(668)
3,9283,572
60.0%
51.0%
59.4%
50%
52%
54%
56%
58%
60%
62%
(1,200)(800)(400)
0400800
1,2001,6002,0002,4002,8003,2003,6004,0004,400
2011 2012 1H13
Euro '000
Net profit at tributable to SK (LHS) Net margin (RHS) Source: Company data, CCBIS
Tianjin Port’s net margin has been picking up since 2009
Rizhao Port began to contribute to net profit in 2012
Sinopec Kantons (934 HK) 8 October 2013
21
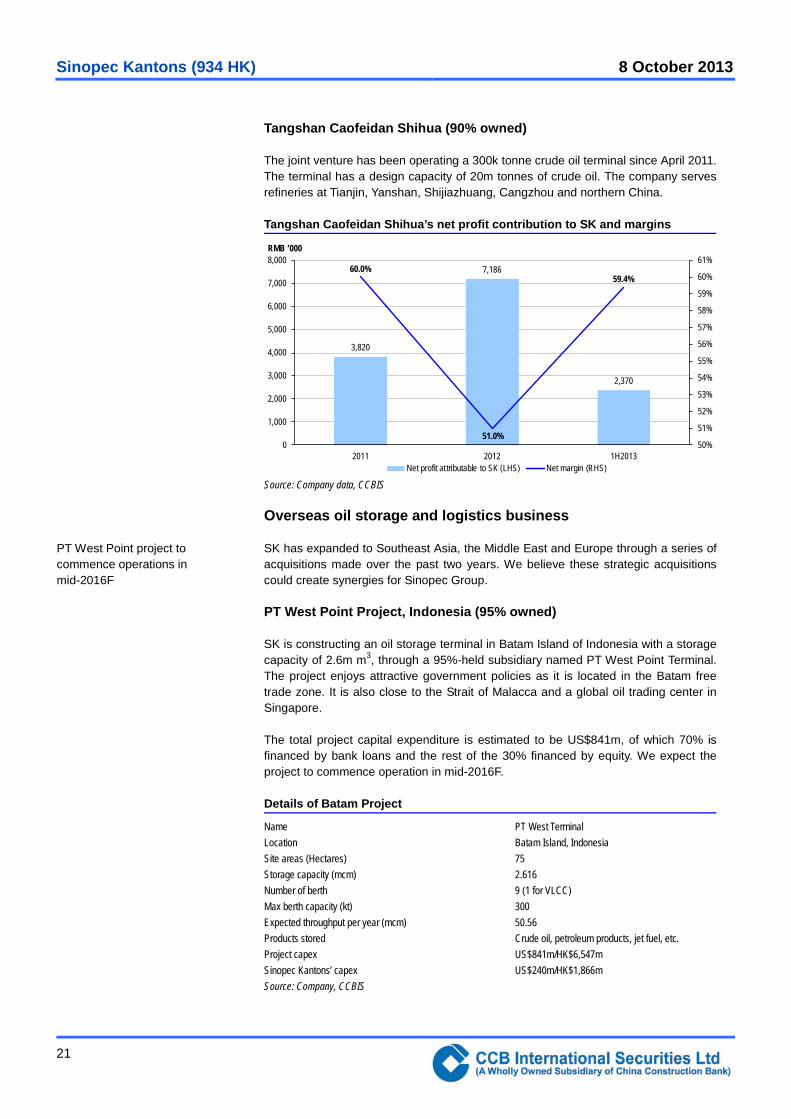
Tangshan Caofeidan Shihua (90% owned)
The joint venture has been operating a 300k tonne crude oil terminal since April 2011. The terminal has a design capacity of 20m tonnes of crude oil. The company serves refineries at Tianjin, Yanshan, Shijiazhuang, Cangzhou and northern China.
Tangshan Caofeidan Shihua’s net profit contribution to SK and margins
3,820
7,186
2,370
60.0%
51.0%
59.4%
50%
51%
52%
53%
54%
55%
56%
57%
58%
59%
60%
61%
0
1,000
2,000
3,000
4,000
5,000
6,000
7,000
8,000
2011 2012 1H2013
RMB '000
Net profit at tributable to SK (LHS) Net margin (RHS) Source: Company data, CCBIS
Overseas oil storage and logistics business
SK has expanded to Southeast Asia, the Middle East and Europe through a series of acquisitions made over the past two years. We believe these strategic acquisitions could create synergies for Sinopec Group.
PT West Point Project, Indonesia (95% owned)
SK is constructing an oil storage terminal in Batam Island of Indonesia with a storage capacity of 2.6m m3, through a 95%-held subsidiary named PT West Point Terminal. The project enjoys attractive government policies as it is located in the Batam free trade zone. It is also close to the Strait of Malacca and a global oil trading center in Singapore.
The total project capital expenditure is estimated to be US$841m, of which 70% is financed by bank loans and the rest of the 30% financed by equity. We expect the project to commence operation in mid-2016F.
Details of Batam Project
Name PT West Terminal Location Batam Island, Indonesia Site areas (Hectares) 75 Storage capacity (mcm) 2.616 Number of berth 9 (1 for VLCC) Max berth capacity (kt) 300 Expected throughput per year (mcm) 50.56 Products stored Crude oil, petroleum products, jet fuel, etc. Project capex US$841m/HK$6,547m Sinopec Kantons’ capex US$240m/HK$1,866m Source: Company, CCBIS
PT West Point project to commence operations in mid-2016F
Sinopec Kantons (934 HK) 8 October 2013
22
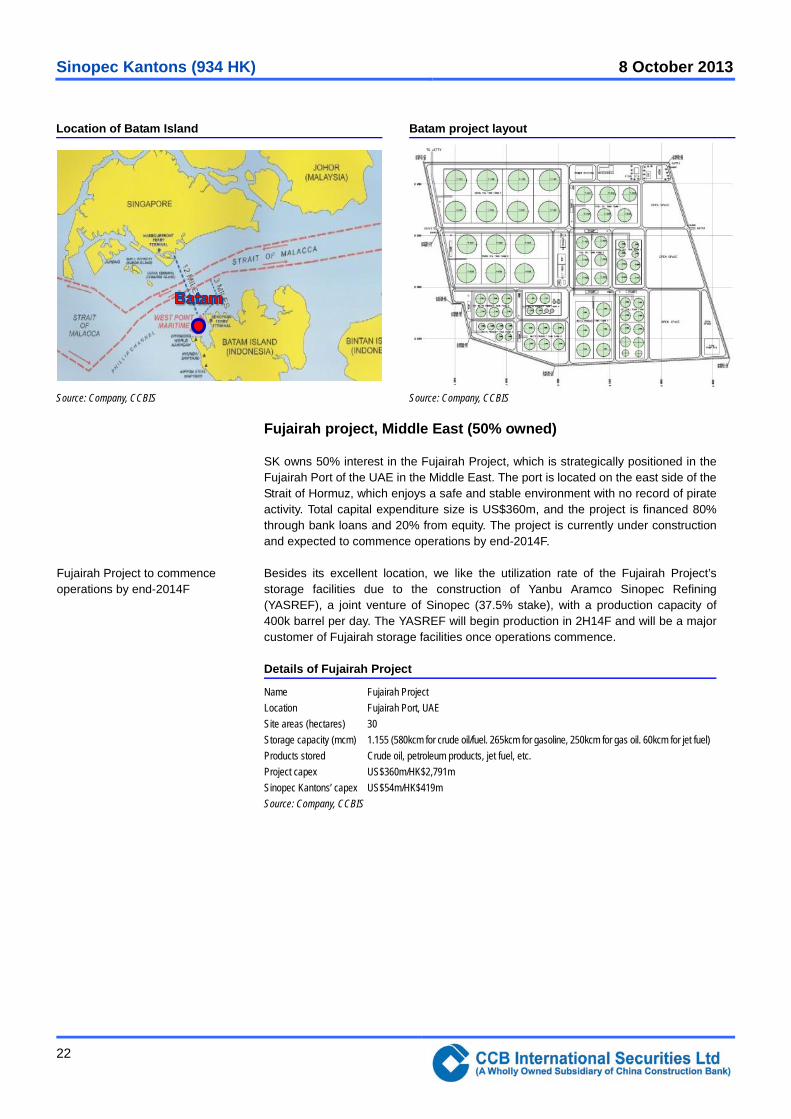
Location of Batam Island Batam project layout
Source: Company, CCBIS Source: Company, CCBIS
Fujairah project, Middle East (50% owned)
SK owns 50% interest in the Fujairah Project, which is strategically positioned in the Fujairah Port of the UAE in the Middle East. The port is located on the east side of the Strait of Hormuz, which enjoys a safe and stable environment with no record of pirate activity. Total capital expenditure size is US$360m, and the project is financed 80% through bank loans and 20% from equity. The project is currently under construction and expected to commence operations by end-2014F.
Besides its excellent location, we like the utilization rate of the Fujairah Project’s storage facilities due to the construction of Yanbu Aramco Sinopec Refining (YASREF), a joint venture of Sinopec (37.5% stake), with a production capacity of 400k barrel per day. The YASREF will begin production in 2H14F and will be a major customer of Fujairah storage facilities once operations commence.
Details of Fujairah Project
Name Fujairah Project Location Fujairah Port, UAE Site areas (hectares) 30 Storage capacity (mcm) 1.155 (580kcm for crude oil/fuel. 265kcm for gasoline, 250kcm for gas oil. 60kcm for jet fuel) Products stored Crude oil, petroleum products, jet fuel, etc. Project capex US$360m/HK$2,791m Sinopec Kantons’ capex US$54m/HK$419m Source: Company, CCBIS
Fujairah Project to commence operations by end-2014F
Sinopec Kantons (934 HK) 8 October 2013
23
Location of Fujairah port Fujairah terminal layout
Source: Company, CCBIS Source: Company, CCBIS
Vesta Project, Europe (50% owned)
SK completed acquisition of a 50% equity stake in Vesta Project on 2 April 2013 for a consideration of HK$1,302m. The deal expands SK’s footprint in a core oil trading area of Europe. Prior to the acquisition, Vesta was wholly owned by Mercuria Energy Group, one of the world’s largest independent energy trading companies.
The Vesta Project has three major oil storage terminals, namely the Antwerp Terminal in Belgium, the Flushing Terminal in the Netherlands and the Tallinn Terminal in Estonia. Located in prime locations in the Baltic and ARA (“Amsterdam-Rotterdam-Antwerp”, the world’s second-largest petrochemical cluster after the Houston Ship Channel), all three terminals have well-established water and inland transportation networks to major refineries in Europe.
The oil storage business is the major revenue contributor to Vesta Project (53% of 2010 total revenue), while its jetty services and transportation services contributed 21% and 18% to its revenue in 2010, respectively. The current business model provides stable cashflow to shareholders and is able to immediately contribute earnings to SK.
Revenue breakdown of Vesta (2010)
Storage services53%
Jetty services21%
Transportation services18%
Other services8%
Source: Company data, CCBIS
Vesta project provides stable cashflow and an immediate contribution to earnings
Sinopec Kantons (934 HK) 8 October 2013
24
Operation details of Vesta Terminals
City location of terminals Antwerp Flushing Tallinn Total Country Belgium Netherland Estonia Storage capacity (kcm) 827 391 406 1,624 Heated shell capacity (kcm) 202 34 316 552 Number of tanks 65 33 35 133 Number of berth 5 3 5 13 Max berth capacity (kt) 160 50 N/A Max water draft of terminal (m) 15 12 17 Products stored Petroleum products Petroleum products Petroleum products and crude oil Investment/consideration HK$1,302.1m for 50% equity JV partner Mercuria Energy Group Source: Company data, CCBIS
Vesta Terminal Flushing in Netherland Vesta Terminal Tallinn in Estonia
Source: Company, CCBIS Source: Company, CCBIS
Vessel charter business and LNG vessel projects
SK chartered three VLCC vessels back in 2011 from international ship owners under 3+2 contracts (3 years plus 2 years optional) while leasing to charterers on the spot market. Due to the continuous decline in oil tanker spot rates over the past two years, the vessel charter business recorded a net loss of HK$89m and HK$60m in 2012 and 1H13. We forecast the company will terminate its vessel charter business in 2015F after the expiry of its current charter contracts, though SK may choose to extend the contract by two years for one of the charters at a lower rate.
Looking beyond 2014F, SK’s recently constructed LNG vessels will be the major contributor to its future logistics business. In 2010, the company formed two joint ventures with China Shipping LNG Investment Company to build a total of 10 vessels for Sinopec Group.
We expect the first vessel to be delivered in 2015F and all 10 vessels to commence operations by early 2018F. Given Sinopec Group is the only customer, we believe vessel demand is well protected at the different stages of SK’s business cycle. We estimate total capital expenditure of the two projects will amount to US$2.6b and IRR will be over 8%.
A new contributor from 2015F
Sinopec Kantons (934 HK) 8 October 2013
25
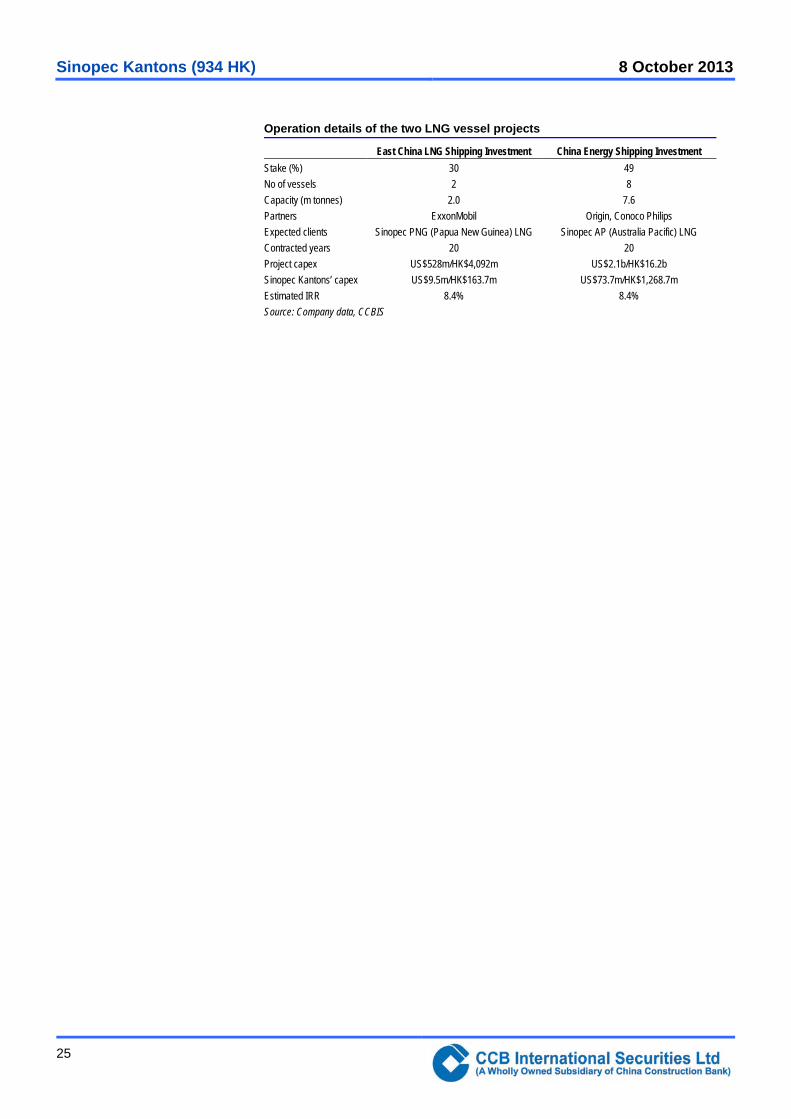
Operation details of the two LNG vessel projects
East China LNG Shipping Investment China Energy Shipping Investment Stake (%) 30 49 No of vessels 2 8 Capacity (m tonnes) 2.0 7.6 Partners ExxonMobil Origin, Conoco Philips Expected clients Sinopec PNG (Papua New Guinea) LNG Sinopec AP (Australia Pacific) LNG Contracted years 20 20 Project capex US$528m/HK$4,092m US$2.1b/HK$16.2b Sinopec Kantons’ capex US$9.5m/HK$163.7m US$73.7m/HK$1,268.7m Estimated IRR 8.4% 8.4% Source: Company data, CCBIS
Sinopec Kantons (934 HK) 8 October 2013
26
Prospect: Best positioned for China’s growing demand for oil and LNG
China secures energy supplies through more imports and overseas acquisitions
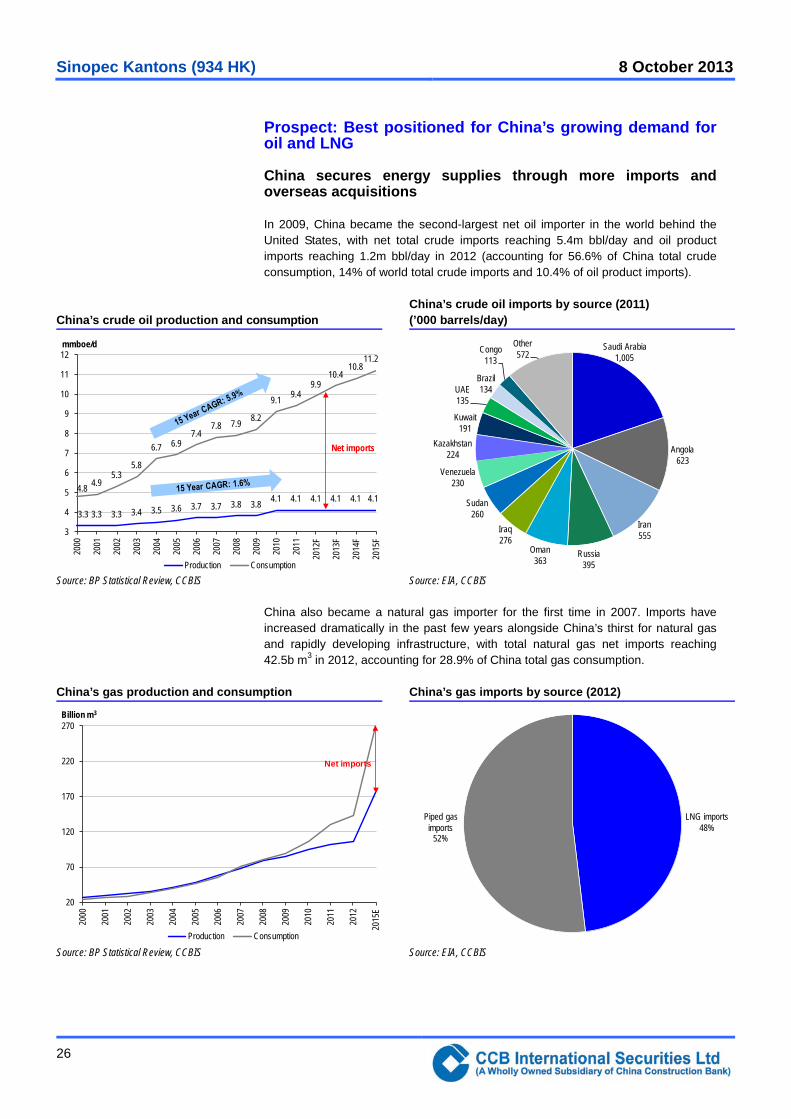
In 2009, China became the second-largest net oil importer in the world behind the United States, with net total crude imports reaching 5.4m bbl/day and oil product imports reaching 1.2m bbl/day in 2012 (accounting for 56.6% of China total crude consumption, 14% of world total crude imports and 10.4% of oil product imports).
China’s crude oil production and consumption
China’s crude oil imports by source (2011) (’000 barrels/day)
Source: BP Statistical Review, CCBIS Source: EIA, CCBIS
China also became a natural gas importer for the first time in 2007. Imports have increased dramatically in the past few years alongside China’s thirst for natural gas and rapidly developing infrastructure, with total natural gas net imports reaching 42.5b m3 in 2012, accounting for 28.9% of China total gas consumption.
China’s gas production and consumption China’s gas imports by source (2012)
20
70
120
170
220
270
2000
2001
2002
2003
2004
2005
2006
2007
2008
2009
2010
2011
2012
2015
E
Billion m3
Production Consumption
Net imports
LNG imports
48%Piped gas
imports52%
Source: BP Statistical Review, CCBIS Source: EIA, CCBIS
Sinopec Kantons (934 HK) 8 October 2013
27
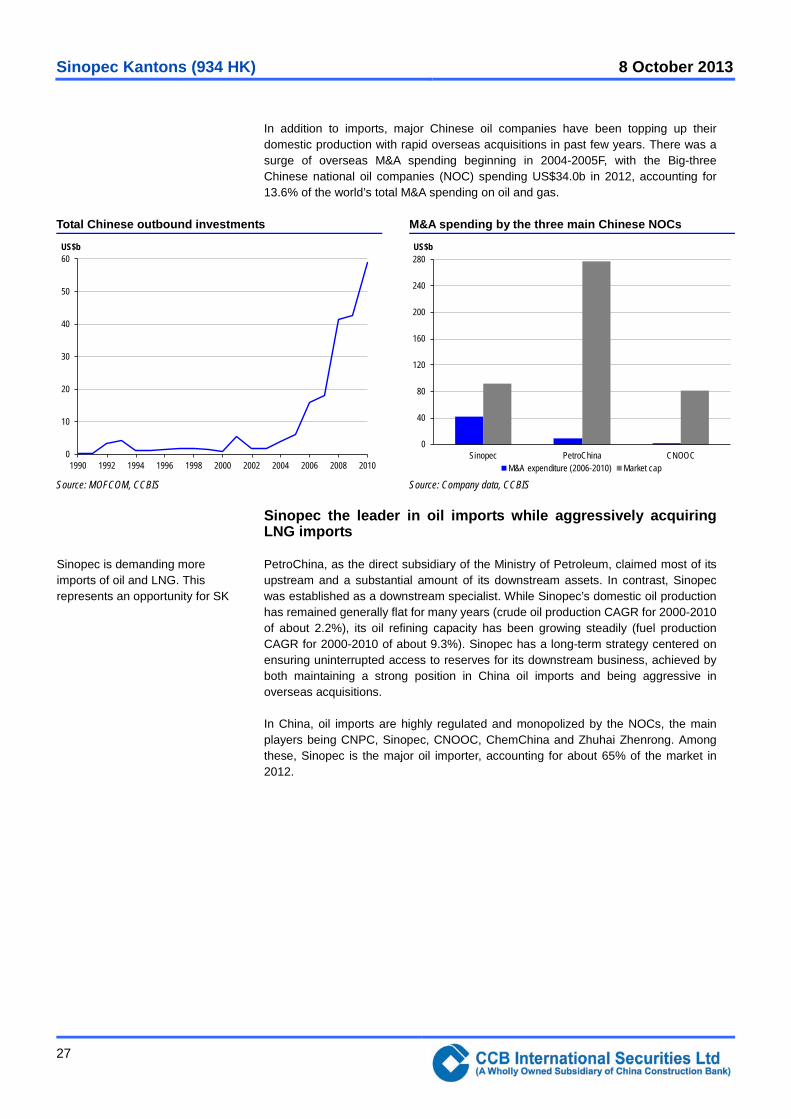
In addition to imports, major Chinese oil companies have been topping up their domestic production with rapid overseas acquisitions in past few years. There was a surge of overseas M&A spending beginning in 2004-2005F, with the Big-three Chinese national oil companies (NOC) spending US$34.0b in 2012, accounting for 13.6% of the world’s total M&A spending on oil and gas.
Total Chinese outbound investments M&A spending by the three main Chinese NOCs
M&A expenditure (2006-2010) Market cap Source: MOFCOM, CCBIS Source: Company data, CCBIS
Sinopec the leader in oil imports while aggressively acquiring LNG imports
PetroChina, as the direct subsidiary of the Ministry of Petroleum, claimed most of its upstream and a substantial amount of its downstream assets. In contrast, Sinopec was established as a downstream specialist. While Sinopec’s domestic oil production has remained generally flat for many years (crude oil production CAGR for 2000-2010 of about 2.2%), its oil refining capacity has been growing steadily (fuel production CAGR for 2000-2010 of about 9.3%). Sinopec has a long-term strategy centered on ensuring uninterrupted access to reserves for its downstream business, achieved by both maintaining a strong position in China oil imports and being aggressive in overseas acquisitions.
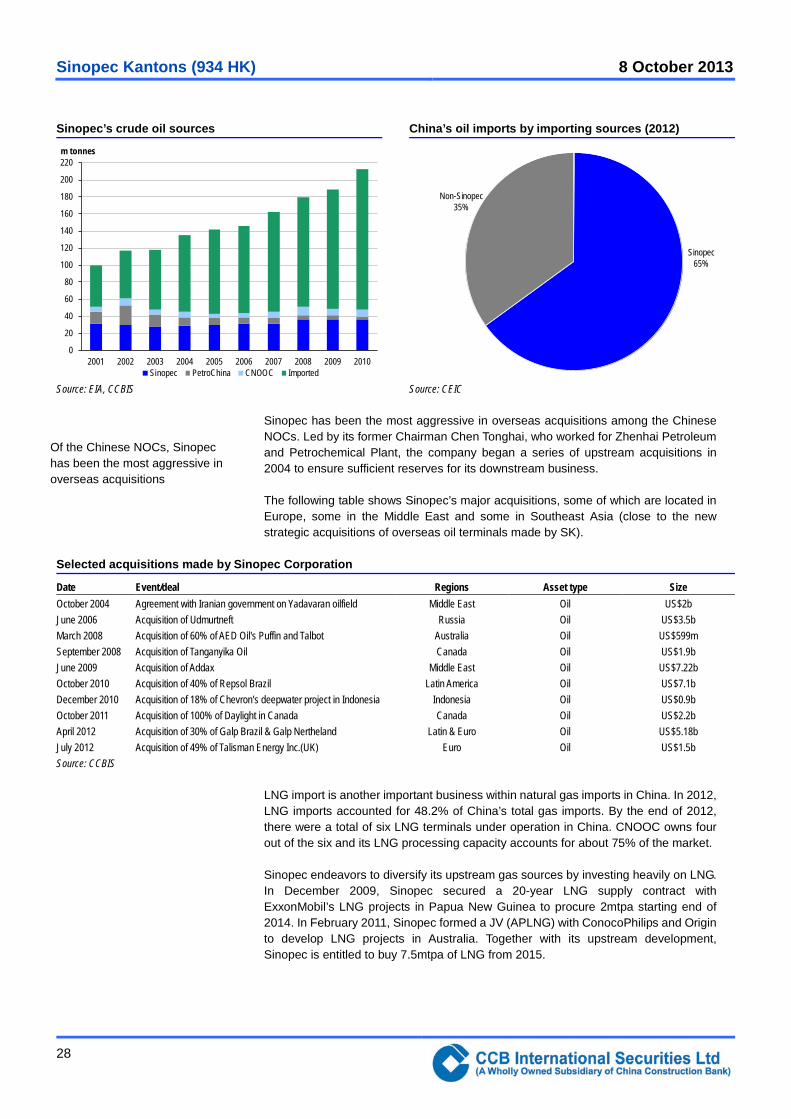
In China, oil imports are highly regulated and monopolized by the NOCs, the main players being CNPC, Sinopec, CNOOC, ChemChina and Zhuhai Zhenrong. Among these, Sinopec is the major oil importer, accounting for about 65% of the market in 2012.
Sinopec is demanding more imports of oil and LNG. This represents an opportunity for SK
Sinopec has been the most aggressive in overseas acquisitions among the Chinese NOCs. Led by its former Chairman Chen Tonghai, who worked for Zhenhai Petroleum and Petrochemical Plant, the company began a series of upstream acquisitions in 2004 to ensure sufficient reserves for its downstream business.
The following table shows Sinopec’s major acquisitions, some of which are located in Europe, some in the Middle East and some in Southeast Asia (close to the new strategic acquisitions of overseas oil terminals made by SK).
Selected acquisitions made by Sinopec Corporation
Date Event/deal Regions Asset type Size October 2004 Agreement with Iranian government on Yadavaran oilfield Middle East Oil US$2b June 2006 Acquisition of Udmurtneft Russia Oil US$3.5b March 2008 Acquisition of 60% of AED Oil's Puffin and Talbot Australia Oil US$599m September 2008 Acquisition of Tanganyika Oil Canada Oil US$1.9b June 2009 Acquisition of Addax Middle East Oil US$7.22b October 2010 Acquisition of 40% of Repsol Brazil Latin America Oil US$7.1b December 2010 Acquisition of 18% of Chevron’s deepwater project in Indonesia Indonesia Oil US$0.9b October 2011 Acquisition of 100% of Daylight in Canada Canada Oil US$2.2b April 2012 Acquisition of 30% of Galp Brazil & Galp Nertheland Latin & Euro Oil US$5.18b July 2012 Acquisition of 49% of Talisman Energy Inc.(UK) Euro Oil US$1.5b Source: CCBIS
LNG import is another important business within natural gas imports in China. In 2012, LNG imports accounted for 48.2% of China’s total gas imports. By the end of 2012, there were a total of six LNG terminals under operation in China. CNOOC owns four out of the six and its LNG processing capacity accounts for about 75% of the market.
Sinopec endeavors to diversify its upstream gas sources by investing heavily on LNG. In December 2009, Sinopec secured a 20-year LNG supply contract with ExxonMobil’s LNG projects in Papua New Guinea to procure 2mtpa starting end of 2014. In February 2011, Sinopec formed a JV (APLNG) with ConocoPhilips and Origin to develop LNG projects in Australia. Together with its upstream development, Sinopec is entitled to buy 7.5mtpa of LNG from 2015.
Of the Chinese NOCs, Sinopec has been the most aggressive in overseas acquisitions
Sinopec Kantons (934 HK) 8 October 2013
29
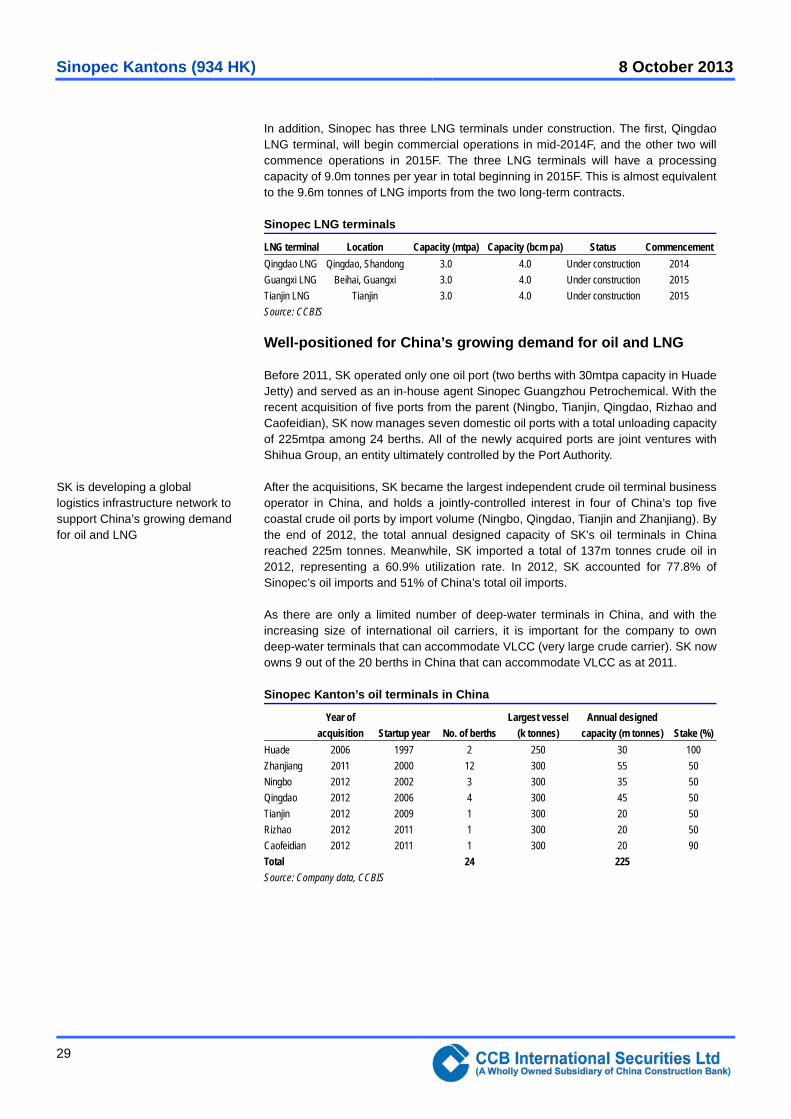
In addition, Sinopec has three LNG terminals under construction. The first, Qingdao LNG terminal, will begin commercial operations in mid-2014F, and the other two will commence operations in 2015F. The three LNG terminals will have a processing capacity of 9.0m tonnes per year in total beginning in 2015F. This is almost equivalent to the 9.6m tonnes of LNG imports from the two long-term contracts.
Sinopec LNG terminals
LNG terminal Location Capacity (mtpa) Capacity (bcm pa) Status Commencement Qingdao LNG Qingdao, Shandong 3.0 4.0 Under construction 2014 Guangxi LNG Beihai, Guangxi 3.0 4.0 Under construction 2015 Tianjin LNG Tianjin 3.0 4.0 Under construction 2015 Source: CCBIS
Well-positioned for China’s growing demand for oil and LNG
Before 2011, SK operated only one oil port (two berths with 30mtpa capacity in Huade Jetty) and served as an in-house agent Sinopec Guangzhou Petrochemical. With the recent acquisition of five ports from the parent (Ningbo, Tianjin, Qingdao, Rizhao and Caofeidian), SK now manages seven domestic oil ports with a total unloading capacity of 225mtpa among 24 berths. All of the newly acquired ports are joint ventures with Shihua Group, an entity ultimately controlled by the Port Authority.
After the acquisitions, SK became the largest independent crude oil terminal business operator in China, and holds a jointly-controlled interest in four of China’s top five coastal crude oil ports by import volume (Ningbo, Qingdao, Tianjin and Zhanjiang). By the end of 2012, the total annual designed capacity of SK’s oil terminals in China reached 225m tonnes. Meanwhile, SK imported a total of 137m tonnes crude oil in 2012, representing a 60.9% utilization rate. In 2012, SK accounted for 77.8% of Sinopec’s oil imports and 51% of China’s total oil imports.
As there are only a limited number of deep-water terminals in China, and with the increasing size of international oil carriers, it is important for the company to own deep-water terminals that can accommodate VLCC (very large crude carrier). SK now owns 9 out of the 20 berths in China that can accommodate VLCC as at 2011.
SK is developing a global logistics infrastructure network to support China’s growing demand for oil and LNG
Sinopec Kantons (934 HK) 8 October 2013
30
China and SK’s VLCC crude oil ports Sinopec Kantons’ share of China oil imports in 2012
Sinopec Kantons
51%
Other terminals under Sinopec
14%
Terminals under PetroChina and
other35%
Source: Company, CCBIS Source: CCBIS
SK has not only built a leading position in coastal oil terminals in China, but has also developed a global network of oil jetties by acquiring terminal assets in three strategic locations in Europe, the Middle East and Indonesia.
Sinopec Kantons (934 HK) 8 October 2013
31
Potential acquisitions in 2013-2014F
Mr. Fu Chengyu, who transferred to Sinopec Group as Chairman in mid-2011, will draw upon his expertise in capital markets to restructure Sinopec Group. We believe Mr. Fu will enhance the efficiency of the group, given his 30-years of experience with CNOOC, specializing in acquisitions, restructurings, spin-off listings and international market development.
It is likely that Sinopec Group will develop its business along similar lines to CNOOC, one with four highly profitable and independently-listed entities post restructuring while the parent company houses businesses with higher levels of risk or unprofitable operations.
We noted that Sinopec Group is accelerating the restructuring of its business operations. In mid-2012, Sinopec officially began to restructure its refining and petrochemical engineering business and in the process formed a company called Sinopec Engineering, which was listed on the Hong Kong Exchange in May 2013.
As a listed subsidiary of Sinopec Group specializing in crude oil trading, storage and transportation, SK has become the largest crude oil terminal business operator in China and one of the largest in Asia. SK already acquired equity interest in five crude oil terminal operators in China from Sinopec Group in 2012. In our view, the asset injection of Sinopec to its one and only red-chip-listed subsidiary is a vital step for Mr. Fu to optimize and to foster a new capital platform. The acquisition embodied Sinopec’s determination to strengthen and expand SK.
In our view, SK will continue acquiring strategic asset from its parent and/or overseas to become one of the largest oil terminals and LNG shipping business players in Asia. Potential asset acquisitions may include crude oil terminals, LNG terminals, and oil/gas pipelines from Sinopec Group or overseas.
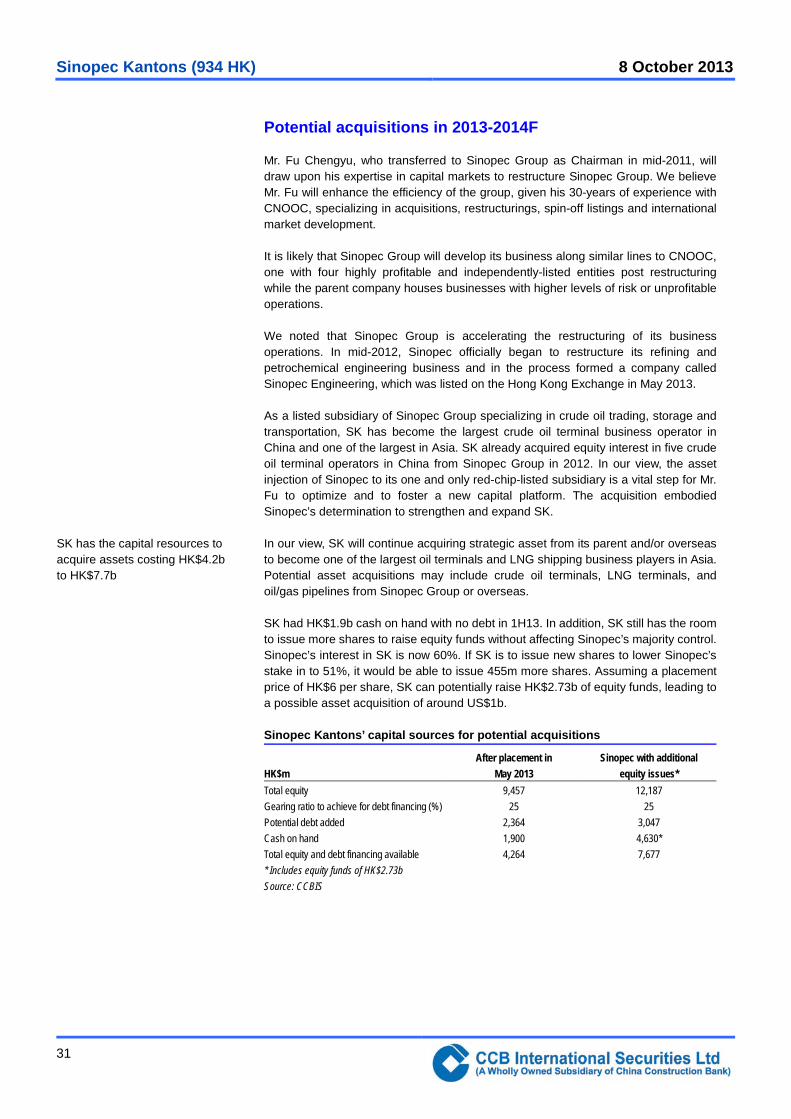
SK had HK$1.9b cash on hand with no debt in 1H13. In addition, SK still has the room to issue more shares to raise equity funds without affecting Sinopec’s majority control. Sinopec’s interest in SK is now 60%. If SK is to issue new shares to lower Sinopec’s stake in to 51%, it would be able to issue 455m more shares. Assuming a placement price of HK$6 per share, SK can potentially raise HK$2.73b of equity funds, leading to a possible asset acquisition of around US$1b.
Sinopec Kantons’ capital sources for potential acquisitions
HK$m After placement in
May 2013 Sinopec with additional
equity issues* Total equity 9,457 12,187 Gearing ratio to achieve for debt financing (%) 25 25 Potential debt added 2,364 3,047 Cash on hand 1,900 4,630* Total equity and debt financing available 4,264 7,677 * Includes equity funds of HK$2.73b Source: CCBIS
SK has the capital resources to acquire assets costing HK$4.2b to HK$7.7b
Sinopec Kantons (934 HK) 8 October 2013
32
Oil pipelines-the most likely target for acquisition
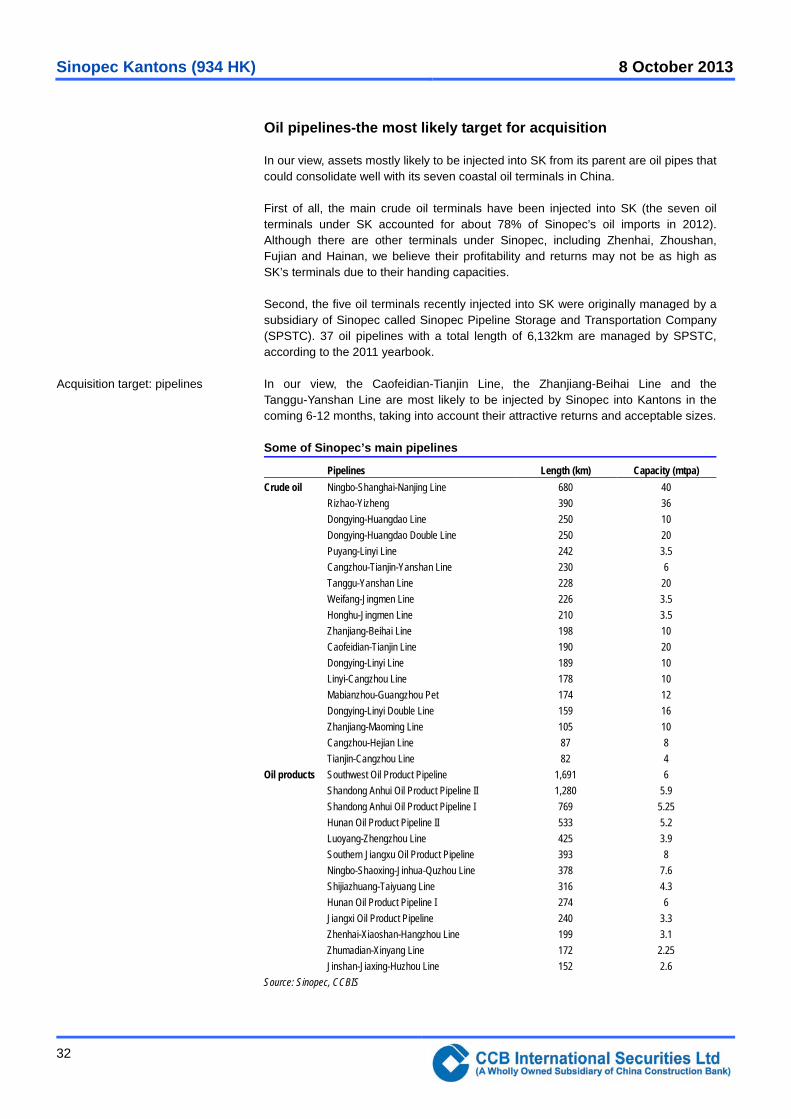
In our view, assets mostly likely to be injected into SK from its parent are oil pipes that could consolidate well with its seven coastal oil terminals in China.
First of all, the main crude oil terminals have been injected into SK (the seven oil terminals under SK accounted for about 78% of Sinopec’s oil imports in 2012). Although there are other terminals under Sinopec, including Zhenhai, Zhoushan, Fujian and Hainan, we believe their profitability and returns may not be as high as SK’s terminals due to their handing capacities.
Second, the five oil terminals recently injected into SK were originally managed by a subsidiary of Sinopec called Sinopec Pipeline Storage and Transportation Company (SPSTC). 37 oil pipelines with a total length of 6,132km are managed by SPSTC, according to the 2011 yearbook.
In our view, the Caofeidian-Tianjin Line, the Zhanjiang-Beihai Line and the Tanggu-Yanshan Line are most likely to be injected by Sinopec into Kantons in the coming 6-12 months, taking into account their attractive returns and acceptable sizes.
Some of Sinopec’s main pipelines
Pipelines Length (km) Capacity (mtpa) Crude oil Ningbo-Shanghai-Nanjing Line 680 40 Rizhao-Yizheng 390 36 Dongying-Huangdao Line 250 10 Dongying-Huangdao Double Line 250 20 Puyang-Linyi Line 242 3.5 Cangzhou-Tianjin-Yanshan Line 230 6 Tanggu-Yanshan Line 228 20 Weifang-Jingmen Line 226 3.5 Honghu-Jingmen Line 210 3.5 Zhanjiang-Beihai Line 198 10 Caofeidian-Tianjin Line 190 20 Dongying-Linyi Line 189 10 Linyi-Cangzhou Line 178 10 Mabianzhou-Guangzhou Pet 174 12 Dongying-Linyi Double Line 159 16 Zhanjiang-Maoming Line 105 10 Cangzhou-Hejian Line 87 8 Tianjin-Cangzhou Line 82 4 Oil products Southwest Oil Product Pipeline 1,691 6 Shandong Anhui Oil Product Pipeline II 1,280 5.9 Shandong Anhui Oil Product Pipeline I 769 5.25 Hunan Oil Product Pipeline II 533 5.2 Luoyang-Zhengzhou Line 425 3.9 Southern Jiangxu Oil Product Pipeline 393 8 Ningbo-Shaoxing-Jinhua-Quzhou Line 378 7.6 Shijiazhuang-Taiyuang Line 316 4.3 Hunan Oil Product Pipeline I 274 6 Jiangxi Oil Product Pipeline 240 3.3 Zhenhai-Xiaoshan-Hangzhou Line 199 3.1 Zhumadian-Xinyang Line 172 2.25 Jinshan-Jiaxing-Huzhou Line 152 2.6 Source: Sinopec, CCBIS
Acquisition target: pipelines
Sinopec Kantons (934 HK) 8 October 2013
33
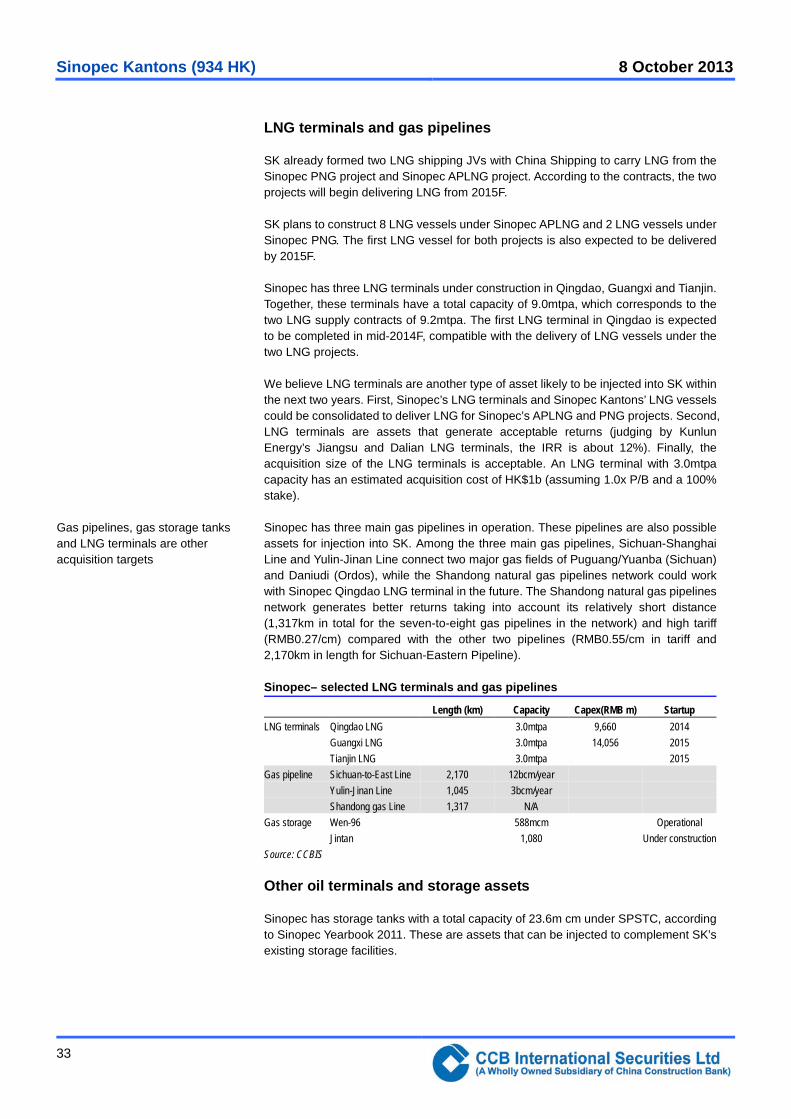
LNG terminals and gas pipelines
SK already formed two LNG shipping JVs with China Shipping to carry LNG from the Sinopec PNG project and Sinopec APLNG project. According to the contracts, the two projects will begin delivering LNG from 2015F.
SK plans to construct 8 LNG vessels under Sinopec APLNG and 2 LNG vessels under Sinopec PNG. The first LNG vessel for both projects is also expected to be delivered by 2015F.
Sinopec has three LNG terminals under construction in Qingdao, Guangxi and Tianjin. Together, these terminals have a total capacity of 9.0mtpa, which corresponds to the two LNG supply contracts of 9.2mtpa. The first LNG terminal in Qingdao is expected to be completed in mid-2014F, compatible with the delivery of LNG vessels under the two LNG projects.
We believe LNG terminals are another type of asset likely to be injected into SK within the next two years. First, Sinopec’s LNG terminals and Sinopec Kantons’ LNG vessels could be consolidated to deliver LNG for Sinopec’s APLNG and PNG projects. Second, LNG terminals are assets that generate acceptable returns (judging by Kunlun Energy’s Jiangsu and Dalian LNG terminals, the IRR is about 12%). Finally, the acquisition size of the LNG terminals is acceptable. An LNG terminal with 3.0mtpa capacity has an estimated acquisition cost of HK$1b (assuming 1.0x P/B and a 100% stake).
Sinopec has three main gas pipelines in operation. These pipelines are also possible assets for injection into SK. Among the three main gas pipelines, Sichuan-Shanghai Line and Yulin-Jinan Line connect two major gas fields of Puguang/Yuanba (Sichuan) and Daniudi (Ordos), while the Shandong natural gas pipelines network could work with Sinopec Qingdao LNG terminal in the future. The Shandong natural gas pipelines network generates better returns taking into account its relatively short distance (1,317km in total for the seven-to-eight gas pipelines in the network) and high tariff (RMB0.27/cm) compared with the other two pipelines (RMB0.55/cm in tariff and 2,170km in length for Sichuan-Eastern Pipeline).
Gas pipeline Sichuan-to-East Line 2,170 12bcm/year Yulin-Jinan Line 1,045 3bcm/year Shandong gas Line 1,317 N/A Gas storage Wen-96 588mcm Operational Jintan 1,080 Under construction Source: CCBIS
Other oil terminals and storage assets
Sinopec has storage tanks with a total capacity of 23.6m cm under SPSTC, according to Sinopec Yearbook 2011. These are assets that can be injected to complement SK’s existing storage facilities.
Gas pipelines, gas storage tanks and LNG terminals are other acquisition targets
Sinopec Kantons (934 HK) 8 October 2013
34
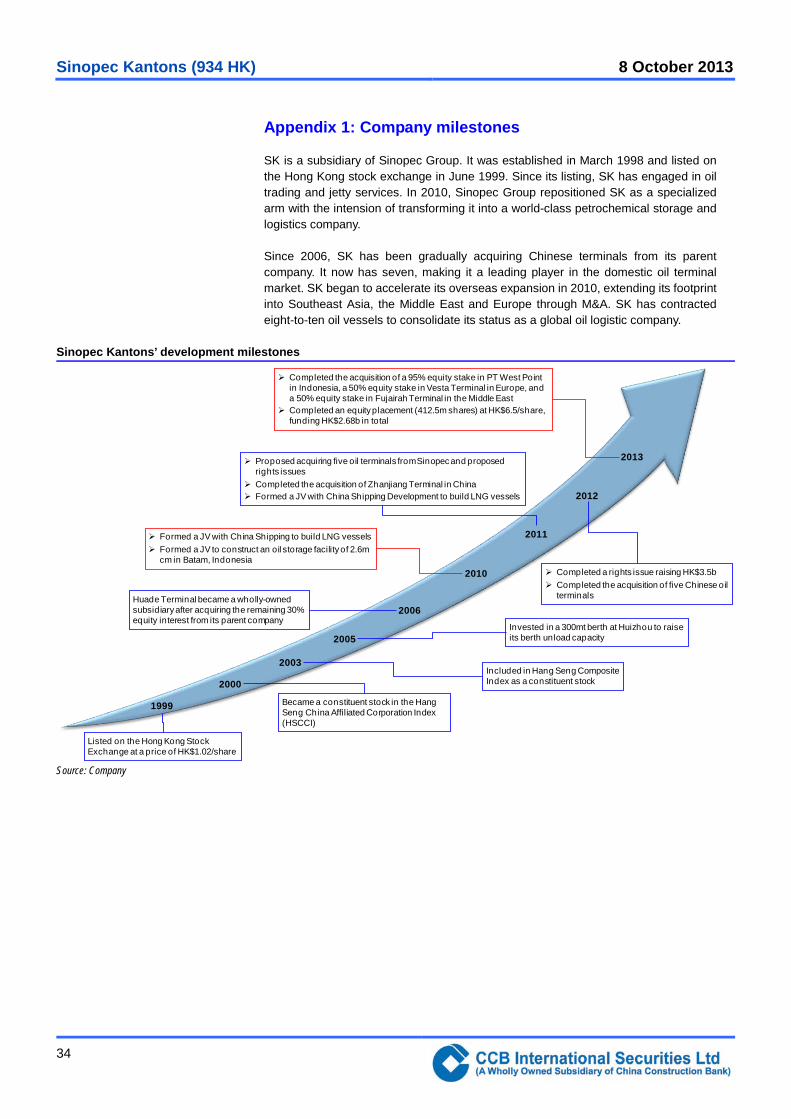
Appendix 1: Company milestones
SK is a subsidiary of Sinopec Group. It was established in March 1998 and listed on the Hong Kong stock exchange in June 1999. Since its listing, SK has engaged in oil trading and jetty services. In 2010, Sinopec Group repositioned SK as a specialized arm with the intension of transforming it into a world-class petrochemical storage and logistics company.
Since 2006, SK has been gradually acquiring Chinese terminals from its parent company. It now has seven, making it a leading player in the domestic oil terminal market. SK began to accelerate its overseas expansion in 2010, extending its footprint into Southeast Asia, the Middle East and Europe through M&A. SK has contracted eight-to-ten oil vessels to consolidate its status as a global oil logistic company.
Sinopec Kantons’ development milestones
1999
2000
2005
2006
2010
2013
2012
2011
Became a constituent stock in the Hang Seng China Affiliated Corporation Index (HSCCI)
Listed on the Hong Kong Stock Exchange at a price of HK$1.02/share
Huade Terminal became a wholly-owned subsidiary after acquiring the remaining 30% equity interest from its parent company
Proposed acquiring five oil terminals from Sinopec and proposed rights issues
Completed the acquisition of Zhanjiang Terminal in China Formed a JV with China Shipping Development to build LNG vessels
Completed a rights issue raising HK$3.5b Completed the acquisition of five Chinese oil
terminals
Formed a JV with China Shipping to build LNG vessels Formed a JV to construct an oil storage facility of 2.6m
cm in Batam, Indonesia
Completed the acquisition of a 95% equity stake in PT West Point in Indonesia, a 50% equity stake in Vesta Terminal in Europe, and a 50% equity stake in Fujairah Terminal in the Middle East
Completed an equity placement (412.5m shares) at HK$6.5/share, funding HK$2.68b in total
2003
Invested in a 300mt berth at Huizhou to raise its berth unload capacity
Included in Hang Seng Composite Index as a constituent stock
Source: Company
Sinopec Kantons (934 HK) 8 October 2013
35
Appendix 2: Management profile
Mr. Dai Zhao Ming, age 47, Chairman of SK. Mr. Dai is a senior economist and holds a doctoral degree in economics. He joined Sinopec Guangzhou Petrochemical Complex in August 1990 and served as deputy section chief, section chief, deputy director of Planning Department, and deputy chief economist of Sinopec Guangzhou Petrochemical Complex successively. Since December 1996, Mr. Dai had served as general manager of Sinomart KTS Development Co. Ltd. and from March 1998, he served as managing director of Sinopec Kantons Holdings Limited. From March 2004, he served as Deputy General Manager of China International United Petroleum & Chemicals Co. Ltd. Since 2005, Mr. Dai has been General Manager and Executive Director of China International United Petroleum & Chemicals Co. Ltd. Mr. Dai has been the chairman of the company since October 2008.
Mr. Zhu Zeng Qing, age 57, Deputy Chairman of SK. Mr. Zhu is a senior accountant with a degree from Technical College of Zhejiang Jin Hua Supply and Sales School in July 1980. He was also a graduate of business management at University of Ningbo in July 2005. He was successively deputy head and then head of the finance division of Zhenhai Refining & Chemical Company from February 1991 to November 2000; deputy chief accountant and chief accountant of Zhenhai Refining & Chemical Company from December 2000 to November 2005; and deputy officer of the finance department of China Petroleum & Chemical Corporation since December 2005. Mr. Zhu has been the Deputy Chairman of SK since April 2007.
Mr. Zhu Jian Min, age 48, Executive Director of SK. Mr. Zhu is a senior engineer and holds a doctoral degree in industrial studies. He has extensive experience in corporate management. He graduated from China Textile University in July 1992. Mr. Zhu has been an Executive Director of the Company since March 2004.
Mr. Tan Ke Fei, age 45, Executive Director of SK. Mr. Tan holds a Bachelor’s Degree in Arts and a Bachelor’s Degree in Law. He is a practicing lawyer and possesses substantial legal and foreign trade management experience. Mr. Tan has been an Executive Director of SK since April 2007.
Mr. Zhou Feng, age 47, Executive Director of SK, Mr. Zhou has a Master’s Degree in Business Administration and has a professional qualification as a senior accountant. He graduated from chemical engineering from Eastern China Polytechnic University in July 1987. Mr. Zhou has been an Executive Director of SK since April 2004.
Mr. Ye Zhi Jun, age 46, Managing Director of SK, Mr. Ye holds a Master’s Degree in Business Administration and was an engineer. Mr. Ye has been a Managing Director of SK since January 2002.
Sinopec Kantons (934 HK) 8 October 2013
36
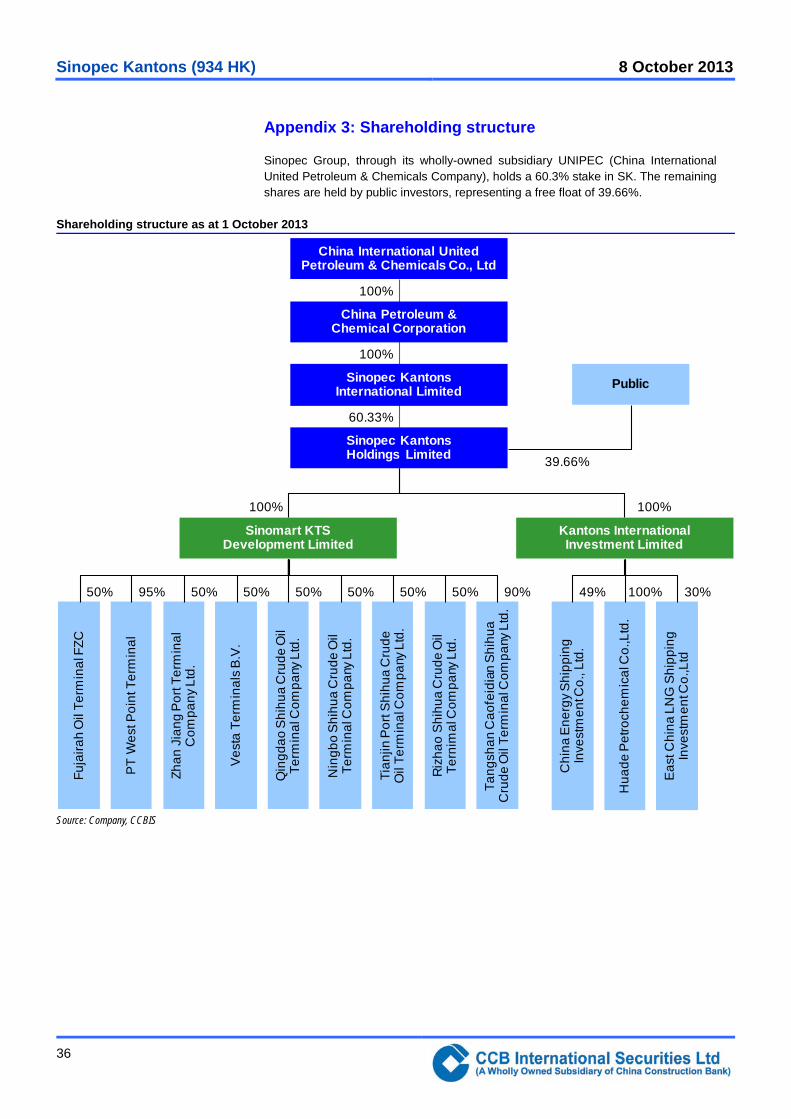
Appendix 3: Shareholding structure
Sinopec Group, through its wholly-owned subsidiary UNIPEC (China International United Petroleum & Chemicals Company), holds a 60.3% stake in SK. The remaining shares are held by public investors, representing a free float of 39.66%.
Shareholding structure as at 1 October 2013
60.33%
100%
100%
50% 50% 50%50%95% 90%50% 50% 30%49%
100%
39.66%
100%
China Petroleum &Chemical Corporation
Sinopec KantonsHoldings Limited
Sinopec KantonsInternational Limited
China International UnitedPetroleum & Chemicals Co., Ltd
Public
50% 100%
Kantons InternationalInvestment Limited
Sinomart KTSDevelopment Limited
Zhan
Jia
ng P
ort T
erm
inal
Com
pany
Ltd
.
PT
Wes
t Poi
nt T
erm
inal
Fuja
irah
Oil
Term
inal
FZC
Qin
gdao
Shi
hua
Cru
de O
ilTe
rmin
al C
ompa
ny L
td.
Ves
ta T
erm
inal
s B
.V.
Nin
gbo
Shi
hua
Cru
de O
ilTe
rmin
al C
ompa
ny L
td.
Tian
jin P
ort S
hihu
a C
rude
Oil
Term
inal
Com
pany
Ltd
.
Riz
hao
Shi
hua
Cru
de O
ilTe
rnim
al C
ompa
ny L
td.
Tang
shan
Cao
feid
ian
Shi
hua
Cru
de O
il Te
rmin
al C
ompa
ny L
td.
Chi
na E
nerg
y S
hipp
ing
Inve
stm
ent C
o., L
td.
Hua
de P
etro
chem
ical
Co.
,Ltd
.
Eas
t Chi
na L
NG
Shi
ppin
g In
vest
men
t Co.
,Ltd
Source: Company, CCBIS
Prince Frog International (1259 HK) 24 September 2013
Rating definitions Outperform (O) – expected return > 10% over the next twelve months
Neutral (N) – expected return between -10% and 10% over the next twelve months
Underperform (U) – expected return < -10% over the next twelve months
Analyst certification: The author(s) of this document, hereby declare that: (i) all of the views expressed in this document accurately reflect his personal views about any and all of the subject securities or issuers and were prepared in an independent manner; and (ii) no part of any of his compensation was, is, or will be directly or indirectly related to the specific recommendations or views expressed in this document; and (iii) he receives no insider information/non-public price-sensitive information in relation to the subject securities or issuers which may influence the recommendations made by him. The author(s) of this document further confirm that (i) neither he nor his respective associate(s) (as defined in the Code of Conduct for Persons Licensed by or Registered with the Securities and Futures Commission issued by the Hong Kong Securities and Futures Commission) has dealt in or traded in the securities covered in this document within 30 calendar days prior to the date of issue of this document or will so deal in or trade such securities within 3 business days (as defined in the Securities and Futures Ordinance (Chapter 571 of the Laws of Hong Kong) after the date of issue of this document; (ii) neither he nor his respective associate(s) serves as an officer of any of the companies covered in this document; and (iii) neither he nor his respective associate(s) has any financial interests in the securities covered in this document.
Disclaimers: This document is prepared by CCB International Securities Limited. CCB International Securities Limited is a wholly-owned subsidiary of CCB International (Holdings) Limited (“CCBIH”) and China Construction Bank Corporation (“CCB”). Information herein has been obtained from sources believed to be reliable but CCB International Securities Limited, its affiliates and/or subsidiaries (collectively “CCBIS”) do not guarantee, represent and warrant (either express or implied) its completeness or accuracy or appropriateness for any purpose or any person whatsoever. Opinions and estimates constitute our judgment as of the date of this document and are subject to change without notice. CCBIS seeks to update its research as appropriate, but various regulations may prevent it from doing so. Besides certain industry reports published on a periodic basis, the large majority of reports are published at irregular intervals as appropriate according to the analyst's judgment. Forecasts, projections and valuations are inherently speculative in nature and may be based on a number of contingencies. Readers should not regard the inclusion of any forecasts, projections and valuations in this document as a representation or warranty by or on behalf of CCBIS that these forecasts, projections or valuations or their underlying assumptions will be achieved. Investment involves risk and past performance is not indicative of future results. Information in this document is not intended to constitute or be construed as legal, financial, accounting, business, investment, tax or any professional advice for any prospective investors and should not be relied upon in that regard. This document is for informational purposes only and should not be treated as an offer or solicitation for the purchase or sale of any products, investments, securities, trading strategies or financial instruments of any kind in any jurisdiction. CCBIS makes no representations on the availability of the securities covered in this document (or related investment) to the recipients. The securities described herein may not be eligible for sale in all jurisdictions or to certain categories of investors. Neither CCBIS nor any other persons accept any liability whatsoever for any loss or damages (whether direct, indirect, incidental, exemplary, compensatory, punitive, special or consequential) arising from any use of this document or its contents or otherwise arising in connection therewith. Securities, financial instruments or strategies mentioned herein may not be suitable for all investors. The opinions and recommendations herein do not take into account prospective investors’ financial circumstances, investment objectives, or particular needs and are not intended as recommendations of particular securities, financial instruments or strategies to any prospective investors. The recipients of this document should consider this document as only a single factor in marking their investment decision and shall be solely responsible for making their own independent investigation of the business, financial condition and prospects of companies referred to in this document. Readers are cautioned that (i) the price and value of securities referred to in this document and the income derived from them may fluctuate; (ii) past performance is not a guide to future performance; (iii) any analysis, ratings and recommendations made in this document are intended for long-term (at least for 12 months) and is not linked to a near-term assessment of the likely performance of the securities or companies in question. In any event, future actual results may differ materially from those set forth in any forward-looking statements herein; (iv) future returns are not guaranteed, and a loss of original capital may occur; and (v) fluctuations in exchange rates may adversely affect the value, price or income of any security or related instrument referred to in this document. It should be noted that this document covers only those securities or companies as specified herein and does not extend to any derivative instruments thereof, the value of which may be affected by many factors and may not correspond with the value of the underlying securities. Trading in these instruments is considered risky and are not suitable for all investors. While all reasonable care has been taken to ensure that the facts stated herein are accurate and that the forward-looking statements, opinions and expectations contained herein are based on fair and reasonable assumptions, CCBIS has not been able to verify independently such facts or assumptions and CCBIS shall not be liable for the accuracy, completeness or correctness thereof and no representation or warranty is made, express or implied, in this regard. All pricing referred to in this document is as of the close of local market for the securities discussed, unless otherwise stated and for information purposes only. There is no representation that any transaction can or could have been effected at those prices, and any prices do not necessarily reflect CCBIS’ internal books and records or theoretical model-based valuations and may be based on certain assumptions. Different assumptions could result in substantially different results. Any statements which may be contained herein attributed to a third- party represent CCBIS’ interpretation of the data, information and/or opinions provided by that third party either publicly or through a subscription service, and such use and interpretation have not been reviewed or endorsed by the third party. Reproduction and distribution of these third party contents in any form is prohibited except with the prior written consent of such third party. The recipients must make their own assessments of the relevance, accuracy and adequacy of the information contained in this document and make such independent investigation as they may consider necessary or appropriate for such purpose.
Prince Frog International (1259 HK) 24 September 2013
Recipients should seek independent legal, financial, accounting, business, investment and/or tax advice if they have any doubt about the contents of this document and satisfy themselves prior to making any investment decision that such investment is in line with their own investment objectives and horizons.
Use of hyperlinks to other internet sites or resources (if any) as referred to in this document is at users’ own risk. They are provided solely for the purpose of convenience and information and the content of these internet sites or resources does not in any way form part of this document. The contents, accuracy, opinion expressed, and other links provided at these sites are not investigated, verified, monitored, or endorsed by CCBIS. CCBIS expressly disclaims any responsibility for and does not guarantee, represent and warrant (either express or implied) the completeness, accuracy, appropriateness, availability or security of information found on these websites. Users of these websites are solely responsible for making all enquiries, investigation and risk assessment before proceeding with any online or offline access or transaction with any of these third parties. All activities conducted by users via or at these websites are at their own risk. CCBIS does not guarantee the security of any information users may forward or be requested to provide to any third parties via these websites. Users are deemed to have irrevocably waived any claims against CCBIS for any loss or damage suffered as a result of any access to or interaction with any of these websites.
Upon request CCBIS may provide specialized research products or services to certain customers focusing on the prospects for specific securities as compared with other covered securities over varying time horizons or under differing market conditions. While the views expressed in these situations may not always be directionally consistent with the long-term views expressed in the analyst's published research, CCBIS has procedures in place to prevent selective disclosure and will update the relevant readers when our views has changed. CCBIS also has procedures in place to identify and manage potential conflicts of interest that may arise in connection with its research business and services. Chinese Wall procedures are also in place to ensure that any confidential and/or price sensitive information is properly handled. CCBIS will use its best endeavors to comply with the relevant laws and regulations in this respect. Nevertheless, the recipients should be aware that CCB, CCBIS, their affiliates and/or their officers, directors and employees may do business with the issuer(s) of the securities covered in this document, including investment banking business or direct investment business or may hold interest in (and/or later add or dispose) such securities (or in any related investment) for themselves and/or on behalf of their clients from time to time. As a result, investors should be aware that CCBIS may have a conflict of interest that could affect the objectivity of this document and CCBIS will not assume any responsibility in respect thereof. Further, the information contained herein may differ or be contrary to opinions expressed by other associates of CCBIS or other members of the CCB or CCBIH group of companies.
This document is for the information of the institutional and professional customers of CCBIS only and should not be distributed to retail customers. This document is not directed at you if CCBIS is prohibited or restricted by any legislation or regulation in any jurisdiction from making it available to you. You should satisfy yourself before reading it that CCBIS is permitted to provide research material concerning investments to you and that you are permitted and entitled to receive and read the document under relevant legislation and regulations. In particular, this document is only distributed to certain US Persons to whom CCBIS is permitted to distribute according to US securities laws, but cannot otherwise be distributed or transmitted, whether directly or indirectly, into the US or to any other US person. This document also cannot be distributed or transmitted, whether directly or indirectly, into Japan and Canada and not to the general public in the People’s Republic of China (for the purpose of this document, excluding Hong Kong, Macau and Taiwan) unless under applicable laws.
Any unauthorized reproduction or redistribution by any means to any persons, in whole or in part of this document is strictly prohibited and CCBIS accepts no liability whatsoever for the actions of third parties in distributing this research report.
If this document has been distributed by electronic transmission, such as e-mail, then such transmission cannot be guaranteed to be secure or error-free as information could be intercepted, corrupted, lost, destroyed, arrive late or incomplete, or contain viruses. CCBIS therefore does not accept liability for any errors or omissions in the contents of this document, which may arise as a result of electronic transmission.
The disclosures contained in this document prepared by CCBIS shall be governed by and construed in accordance with the laws of Hong Kong.
Copyright 2013 CCBIS. The signs, logos and insignia used in this research report and the company name “CCB International Securities Limited” are the registered and unregistered trademarks of CCB, CCBIH and/or CCBIS. All rights are hereby reserved. All material presented in this document, unless indicated otherwise, is under copyright to CCBIS. This document or any portion hereof may not be reproduced, sold or redistributed without the written consent of CCBIS.
CCB International Securities Limited 12/F, CCB Tower, 3 Connaught Road, Central, Hong Kong Tel: (852) 2532 6100 / Fax: (852) 2537 0097