29
China’s Emergence as a Market Economy: Achievements and Challenges OECD contribution to the China Development Forum 20-21 March 2011, Beijing March 2011
China’s Emergence as a Market Economy: Achievements and Challenges
OECD contribution to the China Development Forum20-21 March 2011, Beijing
March 2011© Centaur
www.oecd.org/china
1
Contents
Ackowledgements 2
Preface 3
Introduction 4
China in the global economy 4
The global economic context 4
China as a driver of world growth 6
An economy in transformation 7
China’s current account surplus and foreign exchange mountain 8
Looking to the future: the 12th Economic Plan 10
Strengthening social policies 10
Rejuvenating the economy and making it more innovation-oriented 12
Developing a modern industrial system and improving core competitiveness 13
Lowering inequalities 14
Promoting income growth in rural areas 17
Promoting balanced development amongst regions with prudent urbanisation 18
The role of fiscal policy in reaching the goals of the 12th Plan 18
Challenges to sustain fast yet steady economic development 20
Monetary policy and framework 20
Exchange rate policy 23
The next stage in opening up the economy 24
Concluding remarks 25
Bibliography 26

This paper has been published under the responsibility of the OECD Secretary General.
Ackowledgements
This paper was prepared by Richard Herd, Vincent Koen and Paul van den Noord of the Economics Department of the OECD. They would like to express their appreciation for the work of their colleagues from other parts of the OECD that has been acknowledged in the bibliography. Irène Hors and Gabriela Ramos provided valuable comments to an earlier draft.
For any further information please contact Richard Herd ([email protected]).
3
Preface
Ten years ago, on the eve of the 2001 slowdown, the world economy was expanding at a rate of close to 5% and China accounted for just over one tenth of that growth. Last year, as the world bounced back from the worst recession since the Great Depression, and growth was once again close to 5%, China contributed almost one third of global growth. In the meantime, it had become the world’s second-largest economy.
Ten years ago, China’s current account surplus stood at less than 2% of GDP, and its foreign exchange reserves at $166 billion, or 14% of GDP. Last year, China’s current account surplus exceeded 5% of GDP, down sharply from its 2007 double-digit peak, but still too high for comfort, while foreign exchange reserves towered at $2.85 trillion, or half of China’s GDP.
This dazzling list of summary statistics could go on and on, and indeed far more are provided in this year’s OECD background paper prepared for the CDRF’s China Development Forum. They illustrate tremendous economic achievements and benefits since China’s WTO accession almost ten years ago, both domestically and for the rest of the world. At the same time, these numbers point to some enduring challenges.
One of the major challenges for the next ten years relates to urbanisation – a striking dimension of China’s rapid ongoing transformation on which this year’s China Development Forum focuses. Continued urbanisation will boost incomes, consumption and the size of the service sector, thereby increasing the domestic market and helping to deal with external imbalances. But it calls for further labour market and social policy reforms, to facilitate internal migration and reduce inequality. Some of these, notably in the areas of pensions, health care and the provision of education for migrants’ families, carry a sizeable price tag. However, China has plenty of fiscal space to fund them – in stark contrast with so many OECD countries. Moreover, such reforms deliver economic and social dividends of their own.
Harmonious urbanisation also raises other challenges, not least on the environmental front. Making the right choices in this respect should help to reach China’s energy intensity reduction targets.
China also faces some more immediate economic challenges, particularly on the inflation front – like some other prominent non-OECD economies. Monetary policy is being tightened through various channels, but faster exchange rate appreciation and greater reliance on interest rates would also serve to contain inflation, while contributing to the easing of global imbalances.
The OECD has been working closely with China for over a decade, and we have learned a lot from each other. The OECD offers a unique forum where China can deepen its dialogue with other economies and set out its perspectives on the global challenges facing the world. We also work hand in hand with other international organisations, including in the context of the G20, to find specific ways to address these challenges.
We very much look forward to stepped-up enhanced engagement with China, as the fate of our member countries and China becomes ever more interdependent. The China Development Forum is no doubt one of the most prestigious and effective venues for this cooperation.
Angel GurríaSecretary-General
4
Introduction
Almost ten years ago, on 11 December 2001, China became the 143rd member of the World Trade Organisation (WTO) – a milestone in its integration with the world economy (OECD, 2002). Since then its economy has continued to deliver double-digit growth, underpinned by a rapid expansion of trade and deep structural change. However, imbalances have surfaced at times in the domestic economy, partly because of a long-standing inclination to make only limited use of the exchange rate as an instrument of economic management. Not unexpectedly, rapid economic development and opening up has presented policymakers with new challenges. This has led to an intensified dialogue with partners, both on a bilateral and on a multilateral basis. In addition, increased exposure to world trade and the vagaries of the global economic cycle have led China’s policymakers to give greater emphasis to strengthening domestic demand over the past three years and even more so in the new 12th Five Year Plan.
In a longer-term perspective, growth needs to turn more inclusive, not least by further strengthening the social security system. China will also have to manage rapid urbanisation with the associated transformation of the labour market and reduce inequality, notably in the rights of locally-born residents and new arrivals in the major metropolitan areas. The country also needs to tackle the adverse environmental consequences of sustained rapid economic expansion – another prominent objective in the 12th Plan, which is very much in the spirit of the OECD’s Green Growth Initiative (OECD, 2010a). Success in meeting these goals will have favourable knock-on effects on the global economy as a whole.
Against this backdrop, the present paper first depicts the development and massive transformation of the Chinese economy over the past two decades. Next it turns to China’s macroeconomic and financial policy challenges. Subsequently it addresses China’s longer-term challenges – most of which are in fact felt already today and suggests a number of reforms that would help to successfully implement the 12th Five Year Plan.
China in the global economy
Since China entered the WTO, its economy has become one of the most powerful engines of world growth. Its share in global output soared, making it the world’s second-largest economy at market exchange rates, and putting it on course to become the world’s largest soon at purchasing power parity (PPP) rates. The emergence of China as a market economy has benefited the global economy enormously, but also entailed challenges as countries had to adjust to the sudden increase in the global supply of low-skilled labour. The speed of the integration of China into the world economy, coupled with excess demand worldwide, pushed up China’s current account surplus, to as much as 11% of GDP by 2007. It has shrunk since, however, and the authorities apparently seek to bring it down to around 4% of GDP.
The global economic context
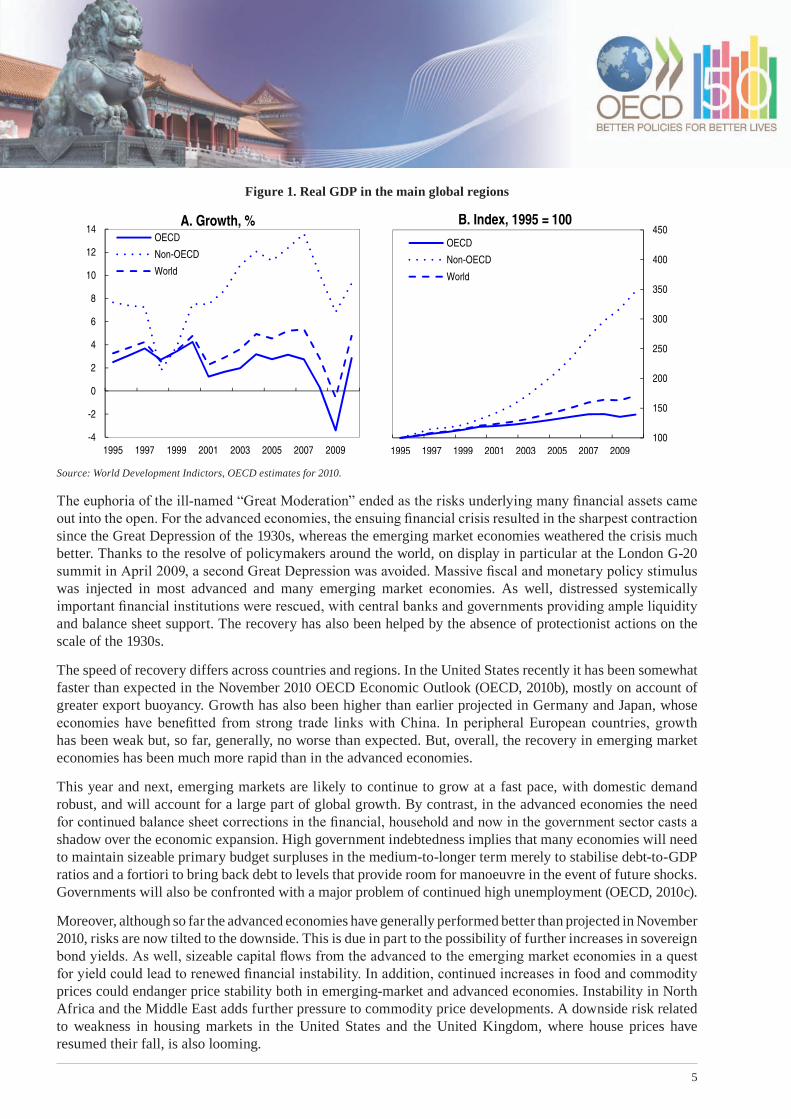
The decade since China’s WTO accession can be subdivided in three: the upswing in the wake of a phase of over-investment, the “Great Recession” of 2008-09 and the subsequent recovery (Figure 1). For the advanced economies, the decade started with a hangover following a long boom in physical and financial investment. The subsequent upswing was driven by consumption rather than investment. Personal outlays, especially on housing services, were boosted by financial innovation that obscured the risks taken by borrowers when interest rates were low. As a result, saving fell to unsustainably low levels in the United States and a number of other countries, even as financial institutions and households alike took on ever more leverage. In this context, real estate prices skyrocketed.
5
Figure 1. Real GDP in the main global regions
-4
-2
0
2
4
6
8
10
12
14
1995 1997 1999 2001 2003 2005 2007 2009
A. Growth, %OECD
Non-OECD
World
100
150
200
250
300
350
400
450
1995 1997 1999 2001 2003 2005 2007 2009
B. Index, 1995 = 100
OECD
Non-OECD
World
Source: World Development Indictors, OECD estimates for 2010.
The euphoria of the ill-named “Great Moderation” ended as the risks underlying many financial assets came out into the open. For the advanced economies, the ensuing financial crisis resulted in the sharpest contraction since the Great Depression of the 1930s, whereas the emerging market economies weathered the crisis much better. Thanks to the resolve of policymakers around the world, on display in particular at the London G-20 summit in April 2009, a second Great Depression was avoided. Massive fiscal and monetary policy stimulus was injected in most advanced and many emerging market economies. As well, distressed systemically important financial institutions were rescued, with central banks and governments providing ample liquidity and balance sheet support. The recovery has also been helped by the absence of protectionist actions on the scale of the 1930s.
The speed of recovery differs across countries and regions. In the United States recently it has been somewhat faster than expected in the November 2010 OECD Economic Outlook (OECD, 2010b), mostly on account of greater export buoyancy. Growth has also been higher than earlier projected in Germany and Japan, whose economies have benefitted from strong trade links with China. In peripheral European countries, growth has been weak but, so far, generally, no worse than expected. But, overall, the recovery in emerging market economies has been much more rapid than in the advanced economies.
This year and next, emerging markets are likely to continue to grow at a fast pace, with domestic demand robust, and will account for a large part of global growth. By contrast, in the advanced economies the need for continued balance sheet corrections in the financial, household and now in the government sector casts a shadow over the economic expansion. High government indebtedness implies that many economies will need to maintain sizeable primary budget surpluses in the medium-to-longer term merely to stabilise debt-to-GDP ratios and a fortiori to bring back debt to levels that provide room for manoeuvre in the event of future shocks. Governments will also be confronted with a major problem of continued high unemployment (OECD, 2010c).
Moreover, although so far the advanced economies have generally performed better than projected in November 2010, risks are now tilted to the downside. This is due in part to the possibility of further increases in sovereign bond yields. As well, sizeable capital flows from the advanced to the emerging market economies in a quest for yield could lead to renewed financial instability. In addition, continued increases in food and commodity prices could endanger price stability both in emerging-market and advanced economies. Instability in North Africa and the Middle East adds further pressure to commodity price developments. A downside risk related to weakness in housing markets in the United States and the United Kingdom, where house prices have resumed their fall, is also looming.

6
In the near term there is a need for monetary policy in the advanced economies to remain very accommodating throughout 2011 and for the degree of accommodation to be scaled back in the course of 2012. This will help to offset the contractionary effects of fiscal consolidation. However, the rise in inflation driven by commodity price increases is likely to prompt calls for some frontloaded tightening of monetary policy. A challenge for monetary authorities will be to balance the risk of lower activity and higher prices in the face of an adverse supply shock hitting still fragile economies.
A substantive stimulus to growth can therefore only come from structural reforms. Structural reforms can boost growth and, at the same time, facilitate fiscal consolidation. For example, increasing the retirement age can raise labour utilisation while mitigating the budget pressures resulting from ageing societies. Moving to national or international best practices in the provision of health and educational services can boost public-sector efficiency and thus create room for cutting expenditure in these areas. More generally, all productivity-enhancing product-market reforms also have the potential to increase tax revenues. If tax hikes are necessary, these should be restricted to areas that are known to be the least harmful for growth such as consumption and property taxes (Arnold et al., 2011).
China as a driver of world growth
Two decades ago, China accounted for slightly less than 4% of world GDP at PPP exchange rates (Figure 2). By the time it entered the WTO it was already the world’s second largest economy, accounting for 7% of global activity. Sustained rapid economic growth since pushed up China’s share to 13% by 2010.
Figure 2. China’s share in global GDP
0
2
4
6
8
10
12
14
16
18
20
22
24
26
0
2
4
6
8
10
12
14
16
18
20
22
24
26
1980 1982 1984 1986 1988 1990 1992 1994 1996 1998 2000 2002 2004 2006 2008 2010
% of world GDP PPP% of world GDP PPP
China USA Japan
Source: World Development Indicators and OECD estimates for 2010.
Accordingly, China’s contribution to global growth has been increasing exponentially, from 5% in 1980 to 12% in 2000 and 30% in 2010. Almost 1½ percentage points of the projected growth of 4-4½ per cent of the world economy in 2011-12 is accounted for by China. China’s economic cycle is increasingly influenced by and induces fluctuations in the rest of the world, and in OECD economies in particular. This is witnessed by the rising share of Chinese imports in the exports of the rest of the world, and its acceleration following China’s WTO entry (Figure 3). Up to 2001, China’s importance as a market for the rest of the world had been growing at 0.2 percentage points per year; since then, it has grown three times faster. The share of Chinese exports in other countries imports has accelerated even more, reaching 11% by 2010.

7
Figure 3. Chinese foreign trade as a share of other countries’ tradeTrade flows are measured at constant prices, using 2005 market exchange rates
0
2
4
6
8
10
12
0
2
4
6
8
10
12
1992 1993 1994 1995 1996 1997 1998 1999 2000 2001 2002 2003 2004 2005 2006 2007 2008 2009 2010
%%
Imports Exports
Source: OECD Economic Outlook 88 database.
Note: In the case of imports, the share is measured as a percentage of other countries’ exports and vice versa.
An economy in transformation
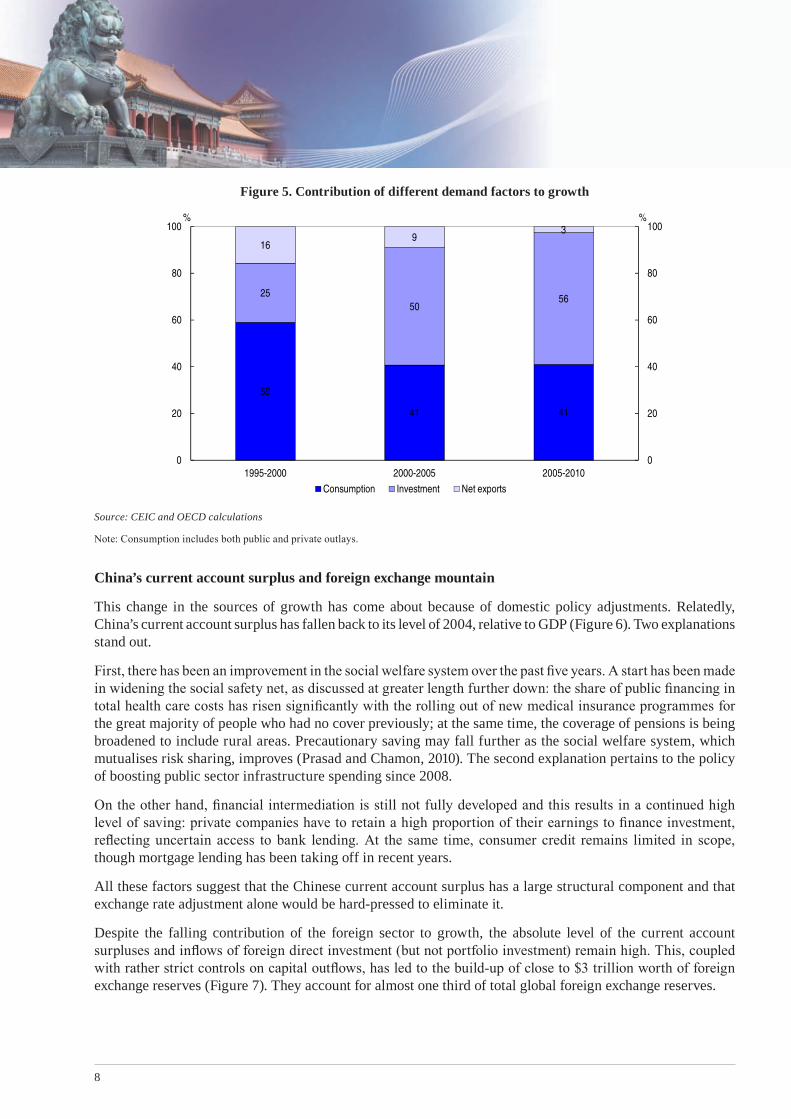
China’s exceptional growth performance is underpinned by a rapid expansion of the capital stock coupled with solid efficiency gains (Figure 4). While the aggregate growth in the input of labour was small, there has been a massive change in the quality of the labour force, as universal nine year education was achieved, helping a massive reallocation of labour away from (low-productivity) agriculture towards services and manufacturing. High growth has been made possible by very favourable supply side factors but finding the demand to match the increase in supply has also been important. While over the past 15 years, external demand has at times been the principal driving force of the economy, on the whole, domestic demand has played that role, and increasingly so (Figure 5).
Figure 4. Supply-side factors contributing to GDP growth
4 7 5 3
43
5952 54
53
34 42 43
0
20
40
60
80
100
0
20
40
60
80
100
1990-1995 1995-2000 2000-2005 2005 -2010
%%
Labour contribution Capital contribution Productivity contribution
Source: OECD estimates.
8
Figure 5. Contribution of different demand factors to growth
59
41 41
2550
56
169
3
0
20
40
60
80
100
0
20
40
60
80
100
1995-2000 2000-2005 2005-2010
%%
Consumption Investment Net exports
Source: CEIC and OECD calculations
Note: Consumption includes both public and private outlays.
China’s current account surplus and foreign exchange mountain
This change in the sources of growth has come about because of domestic policy adjustments. Relatedly, China’s current account surplus has fallen back to its level of 2004, relative to GDP (Figure 6). Two explanations stand out.
First, there has been an improvement in the social welfare system over the past five years. A start has been made in widening the social safety net, as discussed at greater length further down: the share of public financing in total health care costs has risen significantly with the rolling out of new medical insurance programmes for the great majority of people who had no cover previously; at the same time, the coverage of pensions is being broadened to include rural areas. Precautionary saving may fall further as the social welfare system, which mutualises risk sharing, improves (Prasad and Chamon, 2010). The second explanation pertains to the policy of boosting public sector infrastructure spending since 2008.
On the other hand, financial intermediation is still not fully developed and this results in a continued high level of saving: private companies have to retain a high proportion of their earnings to finance investment, reflecting uncertain access to bank lending. At the same time, consumer credit remains limited in scope, though mortgage lending has been taking off in recent years.
All these factors suggest that the Chinese current account surplus has a large structural component and that exchange rate adjustment alone would be hard-pressed to eliminate it.
Despite the falling contribution of the foreign sector to growth, the absolute level of the current account surpluses and inflows of foreign direct investment (but not portfolio investment) remain high. This, coupled with rather strict controls on capital outflows, has led to the build-up of close to $3 trillion worth of foreign exchange reserves (Figure 7). They account for almost one third of total global foreign exchange reserves.

9
Figure 6. Current account balances
-8
-6
-4
-2
0
2
4
6
8
10
12
-8
-6
-4
-2
0
2
4
6
8
10
12
1994 1996 1998 2000 2002 2004 2006 2008 2010
% of GDP% of GDP
United States China
Japan Germany
Euro area excluding Germany
Source: OECD Economic Outlook 88 database.
Figure 7. The balance of payments and foreign exchange reserves
-100
0
100
200
300
400
500
600
2003 2004 2005 2006 2007 2008 2009 2010
USD Bn A. The balance of paymentsCB
Net FDI
Portfolio
Reserves
0
500
1000
1500
2000
2500
3000
0
5
10
15
20
25
30
35
40
45
50
Jan-94 Jan-97 Jan-00 Jan-03 Jan-06 Jan-09
USD Bn % of GDPB. Foreign exchange reservesAs a % of GDP (right scale)
Level (left scale)
Source: CEIC
In China, capital controls essentially prevent foreign currency inflows and the recycling abroad of the current account surpluses by the private sector. The government is thus forced to acquire the foreign currency inflow in order to stabilise the market. Most of the reserves are then invested in dollar securities. As they accumulate, China is constrained in its investment choices as diversification could entail significant negative valuation effects on its holdings of bonds (the so-called “dollar trap”). Attempts at diversification would be costly for China and would also have major spillover effects as occurred in the 1930s when France progressively switched its reserves (then half of the world’s total) from sterling to dollars and then to gold. Continued accumulation of reserves is potentially costly for China and for the world economy. The attempt to seek higher returns led to the creation of a sovereign wealth fund in 2007, whose scale remains limited so far, however.
While the bulk of its overseas investment is in the form of bonds, China has increasingly made foreign direct investments. In 2009, these accounted for 4% of global FDI, still well below its share in world trade and output. The flow of investment has increased markedly and has been predominately directed to emerging economies
10
to the extent that the final destination of outflows can be determined (OECD, 2008). This reflects a growing orientation to seeking raw materials. Even within the OECD area, Australia and Canada account for half of the China’s outward FDI between 2005 and 2009.
Looking to the future: the 12th Economic Plan
The 12th Five Year Plan, running from 2011 to 2015, envisages strong, stable growth together with a progressive change in the structure of the economy. Policies will be oriented to changing the comparative advantage of the economy away from labour-intensive towards more dynamic and technologically-based industries. At the same time, the Plan puts great emphasis on generating more equitable growth across the different regions, between rural and urban areas and within urban areas. It acknowledges that increasing domestic demand and improving the income distribution will require a comprehensive development of social services. The rest of the paper looks at the key structural elements of the 12th Plan and then at how to ensure steady economic growth.
Strengthening social policies
China’s population is set to age fast, owing to low fertility and rising life expectancy. The one-child policy introduced in 1980 brought the fertility rate down to under 1.5, below most high-income OECD countries. This is well below the sustainable fertility rate, which would have to be higher in China than elsewhere due to the low proportion of girls amongst total births. Ageing in China is driven largely by low fertility and has not yet reached the phase when the life expectancy of the elderly rises, but this will change. The old-age dependency ratio (defined as the ratio of the elderly to those aged 15 to 46) is projected to reach 0.24 in 2030, up from 0.11 in 2010. By 2050, the dependency ratio may well exceed 0.43.
Rapid urbanisation will bring its own ageing-related challenges. With ongoing migration of the younger cohorts to urban areas, the increase in the old-age dependency ratio will be more pronounced in rural than in urban areas, exceeding 0.6 by 2050 (versus 0.3 in urban areas). This is a level similar to that expected for OECD countries with low fertility rates such as Germany, Italy and Japan, but without – as yet – the institutional support system available in those countries. In addition, in rural areas, the average working life is 10 years longer than in urban areas, where the employment rate in the 60-64 age range has fallen to 25%, about half that in the major OECD countries (aside from France where it is even lower).
The low urban employment rate appears to be linked to the prevalence of pensions in urban areas. In rural areas, the nature of income support of the elderly is completely different. A fundamental legacy from recent Chinese history is the entrenched view that land and family will provide for the economic safety of rural residents. However, the reality is changing rapidly. Youth are leaving the land with the result that older people cannot maintain farms.. It will be difficult to maintain existing family-based support systems in rural areas when the elderly are likely to be concentrated there. Meanwhile, in urban areas, it will be difficult to keep migrants’ pensions on a different basis to those with urban residence permits when a majority of urban habitants are likely to be migrants.
There have been attempts to organise rural pension schemes but they have so far failed to achieve the expected results. There are also challenges related to urban old-age support schemes, where reforms undertaken in the late-1990s have markedly lowered the pension wealth of individuals and probably raised the saving rate of urban households. Meanwhile, for government employees replacement rates have not fallen in the same way as for enterprise workers. The cost of their pensions has risen significantly and has reached 1% of GDP, almost half the cost of the enterprise system despite covering less than one quarter of the number of employees.
A number of initiatives have been taken in recent years to reform pension arrangements in China. However, pensions are very segmented with different regimes for the rural, urban and public sectors, as well as within each of them. The segmentation of the basic pension system raises issues of efficiency, in that labour mobility

11
is impeded due to a lack of portability, and fairness, to the extent that seniority in one sector is not recognised for pension purposes after the individual moves to another sector. Another challenge is that under current rules, effective replacement rates are fairly low and projected to decline further, both for rural and urban residents. Poor coverage, even for those in cities, accentuates the problem of relative poverty amongst the elderly (Figure 8). This may be politically difficult to sustain in a rapidly ageing society, where the elderly live less and less with their descendents.
Figure 8. Relative poverty among the elderly% of elderly with income below half of the median income
0 5 10 15 20 25 30
China (urban)Mexico
Chinese TaipeiUnited States
SloveniaUnited Kingdom
IrelandRussia
IsraelItaly
GermanyNetherlands
CanadaEstonia
LuxembourgHungarySwedenNorwayPolandFinland
Source: Saunders (2007)
During the period of the 12th Plan challenges will arise as to the distribution of the fiscal costs for providing pension in the countryside: with an ageing countryside, the present arrangements imply that much of the additional burden would be shouldered at sub-national levels by local governments with insufficient resources. These challenges can be addressed by gradually consolidating the various regimes, increasing retirement ages and shifting more of the cost of rural pensions to the central government.
Health care is another area which needs to be given priority in the period of the 12th Plan. The past few decades have seen a significant improvement in the health status of China’s population and, overall, health outcomes are not so different from lower-income OECD countries such as Mexico and Turkey, despite lower incomes in China (Herd et al., 2010b). Over the past several years China has also achieved significant progress in the pursuit of universal coverage of health insurance in urban areas and significantly expanded coverage for rural residents. However, poor health outcomes persist in lower-income areas and severe problems remain among migrant families in urban areas.
There are also challenges associated with China’s health care system. The government has stepped up investment in medical facilities over the past decade. In urban areas, the number of hospitals grew by close to one quarter between 2000 and 2008 with the number of beds rising by almost as much. However, the trend worldwide has been to increase care at the primary level and reduce it at the level of hospitals. China’s new reform programme makes a start in this direction with the expansion of community health centres. If there were enough of these, they could act as a network for primary care and serve as a cheaper method of treating chronic illnesses than hospitals. In rural regions, however, community health centres lack credibility with the population. Patients prefer to go to hospitals as the doctors offering primary care have low levels of qualification. Working in health centres needs to be more attractive for the ample supply of new graduates.

12
The management and operating practices of hospitals also need to change. In some respects hospitals resemble old-style SOEs, operating under a soft budget constraint with high deficits resulting in greater subsidies while profitable hospitals receive no funds.
The government has successfully rolled out two massive health insurance programmes in recent years. They increased the share of the population with some form of medical insurance from 10% to 90%. In rural areas, the increase in coverage of what is a voluntary programme has exceeded expectations. A problem though is that much higher reimbursement rates are needed to reduce poverty in the face of catastrophic diseases. But in the poorer parts of the country, where these problems are most severe, hiking contributions might not be possible. Much greater central government involvement in financing is therefore required. In urban areas problems also persist. Many cities have wanted to keep costs down and so have not extended coverage to employees without cover, presumably on the ground that the employer should have joined the compulsory, but poorly enforced, social security medical insurance system. As a result, migrants generally still cannot benefit from health insurance, which clearly hampers labour mobility and is not an equitable outcome.
Overall, improving the coverage and depth of social policies should help reduce the level of precautionary saving in the economy and so aid the growth of domestic demand.
Rejuvenating the economy and making it more innovation-oriented
The key in moving the economy away from labour intensive-industries over the period of the 12th Plan will be improving the capability of the economy to innovate. The resources devoted to science and technology in China have expanded rapidly in recent years and it now ranks amongst the top countries in total R&D spending and the number of researchers. However, R&D intensity remains low compared to OECD countries (1½ per cent of GDP as opposed to an OECD average of 2.2%). This is especially so in high-tech industries, where for the most part firms are engaged in assembly work. Consequently they do not need a large R&D base and continue to rely heavily on foreign-sourced technology embodied in foreign direct investment and imported inputs (OECD, 2010d). Indeed, the R&D activity of the high-tech sector in China is only equivalent to that of the low-tech sector in advanced countries. As these industries become more mature, some purely Chinese firms are emerging and putting significant downward pressures on industry margins.
Making the changes necessary to improve performance further during the 12th Plan will require changing some of the framework conditions for innovation as they are insufficiently conducive to market-led innovation. In particular, those parts of the framework relating to corporate governance; the financing of R&D and technology-based entrepreneurship and enforcement of intellectual property rights need improvement. This could create the necessary conditions for the operation of an open system of innovation in which indigenous innovation capabilities and R&D-intensive foreign investment could be mutually reinforcing. The public support system for R&D and some aspects of the institutional arrangements of the national innovation system do not yet sufficiently encourage increased R&D efforts and their translation into innovative outcomes. Except in some targeted areas, such as nanotechnology, there is still a wide gap between a relatively small basic research sector and massive technology development activities (OECD, 2008).
To be effectively implemented, a strategy of increasing the sophistication of manufacturing and services requires a well educated labour force. China has gone a long way in investing in human capital. By 2009, the education to age 15 had become universal. Moreover, almost three-quarters of children attend senior secondary schools to the age of 18. In the more developed parts of the country, such as Shanghai, nearly all resident children stay at school to 18 and a significant effort is made to educate migrant children. This has been coupled with syllabus reform and the recruitment of well-qualified teachers (OECD, 2010f). The overall result is that children from Shanghai score extremely well on the PISA international comparisons of achievements (OECD, 2010g). During the 12th Plan a determined effort is needed to upgrade the quality of education in the poorer parts of the country, where qualifications of teachers are much lower than in the East (United Nations Development Programme, 2008).
13
Developing a modern industrial system and improving core competitiveness
The 12th Plan envisages creating a stronger and more modern economic base for the country. A healthy and expanding private sector will be a key to achieving this goal. In May 2010, the State Council issued “Several Opinions on Encouraging and Guiding the Healthy Development of Private Investment”, with a view to reinforce the commitments made in 2005 to open a number of sectors to competition and to facilitate the raising of private capital. Cross region and cross industry mergers, acquisitions and reorganisations are to be launched, while the proportion of state owned capital in state controlled enterprises is to be reduced. One of the specific objectives is to open up sectors such as telecommunications, banking and electricity – so far dominated by public enterprises – to private investment. Indeed, some of these sectors exhibit insufficient competition.
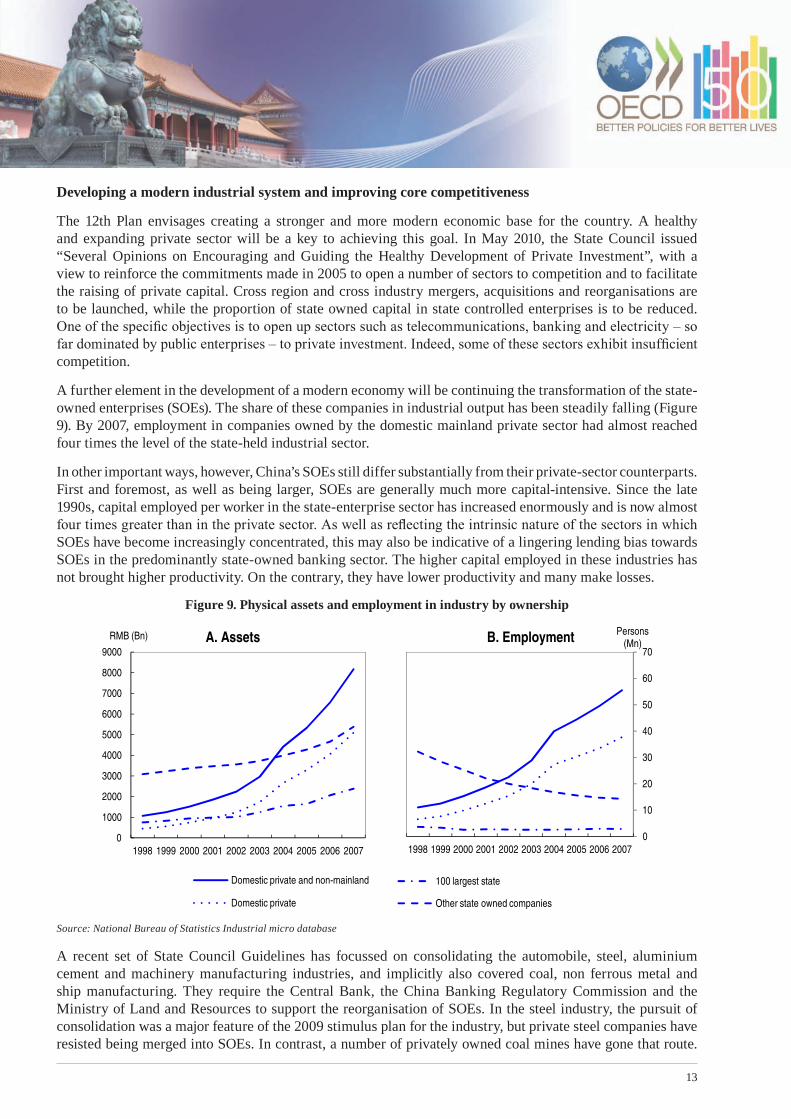
A further element in the development of a modern economy will be continuing the transformation of the state-owned enterprises (SOEs). The share of these companies in industrial output has been steadily falling (Figure 9). By 2007, employment in companies owned by the domestic mainland private sector had almost reached four times the level of the state-held industrial sector.
In other important ways, however, China’s SOEs still differ substantially from their private-sector counterparts. First and foremost, as well as being larger, SOEs are generally much more capital-intensive. Since the late 1990s, capital employed per worker in the state-enterprise sector has increased enormously and is now almost four times greater than in the private sector. As well as reflecting the intrinsic nature of the sectors in which SOEs have become increasingly concentrated, this may also be indicative of a lingering lending bias towards SOEs in the predominantly state-owned banking sector. The higher capital employed in these industries has not brought higher productivity. On the contrary, they have lower productivity and many make losses.
Figure 9. Physical assets and employment in industry by ownership
0
1000
2000
3000
4000
5000
6000
7000
8000
9000
1998 1999 2000 2001 2002 2003 2004 2005 2006 2007
RMB (Bn) A. Assets
Domestic private and non-mainland
Domestic private
0
10
20
30
40
50
60
70
1998 1999 2000 2001 2002 2003 2004 2005 2006 2007
Persons (Mn)B. Employment
100 largest state
Other state owned companies
Source: National Bureau of Statistics Industrial micro database
A recent set of State Council Guidelines has focussed on consolidating the automobile, steel, aluminium cement and machinery manufacturing industries, and implicitly also covered coal, non ferrous metal and ship manufacturing. They require the Central Bank, the China Banking Regulatory Commission and the Ministry of Land and Resources to support the reorganisation of SOEs. In the steel industry, the pursuit of consolidation was a major feature of the 2009 stimulus plan for the industry, but private steel companies have resisted being merged into SOEs. In contrast, a number of privately owned coal mines have gone that route.
14
While the new Guidelines remove bans on cross province mergers, these are proving difficult to achieve. Most of the plans are being implemented by provincial governments and they are reluctant to share tax revenues with other provinces. Local governments have to report their plans for the consolidation of these industries to the Ministry of Industry and Information Technology, which hopes to increase industry concentration ratios by 2015. This consolidation process will be particularly important in reducing the number of loss-making and low-productivity firms in these sectors.
Further changes are needed in the state-owned sector. At present, SOEs are organised in a holding company structure with a high degree of diversification. Profits from the various operating companies are remitted to the holding company and then re-invested by the holding company structure. The institution (SASAC) overseeing these holding companies has sought to limit their diversification but has been unable to restrict them to their core areas of competence. For example, many industrial holding companies have property development subsidiaries. Indeed, Chinese SOEs are among the most diversified in the world (Fan et al., 2008). The ability of the firms to fund this diversification stems from the very small dividends they pay to their ultimate owner: the State.
The SOEs owned by the central government are structured in the shape of a pyramid. At the top there are 120 group (holding) companies. Underneath, there are a large number of subsidiary companies, including a significant number that are listed on stock exchanges. The quoted subsidiaries distribute a share of profits that is in line with, or even higher, than that of private companies. The dividends from these subsidiaries flow upwards to the holding companies. By contrast, the holding companies only pay small dividends to the Ministry of Finance of (no more than 5% of post-tax profits, depending on the sector). These dividends paid by the holding companies to the Ministry of Finance are earmarked for re-investment in the agency that oversees SOEs (SASAC). Consequently, even these small dividends are returned to the SOEs rather than being used to finance overall government expenditure.
In total, the post-tax profits of SOEs amounted to 5% of GDP in 2010, but only a tiny fraction of this amount was transferred to the Ministry of Finance (0.1% of GDP). In so far as a normal payout ratio is of the order of 30% to 40%, the government has been foregoing income amounting to 6% of total government revenues in 2010. For 2011, the government envisages raising the share of profits that is distributed to the government to 15% for energy, telecom and tobacco companies, and 10% for transportation and metal-producing companies, with the remaining holding companies paying 5%. Thus a key to limiting unprofitable diversification and improving the income of the government will be to ensure that a much higher proportion of profit is paid to the government and not returned to the SOE sector during the period of the 12th Plan.
Lowering inequalities
China’s emergence as a market economy and vigorous economic growth has been very successful in reducing poverty. Two decades ago, 60% of the population lived in absolute poverty. By 2010, the number had fallen to 10% (World Bank, 2010). In absolute terms, the fall has been even more spectacular. Since 1990, China accounts for four-fifths of the global decline in the numbers living in absolute poverty. Even so, the challenge going forward is to ensure that growth is sufficiently inclusive, i.e. benefits all strands of society, rural and urban, those who work and are retired, those in good health and the less fortunate, migrants and non-migrants alike. This raises issues of equity, but also of efficiency as the economic transformation of China demands an exceptional flexibility of its labour force. To keep the incentives for flexibility strong it needs to be properly rewarded and risks of hardship properly insured for all. New approaches to reducing poverty will be needed as geographic criteria cease to be relevant and the poor can be found in better-off areas. In particular, poverty amongst young children in poor areas results in stunted growth, high rates of anaemia and low academic achievement. Dietary supplements and better pre-school education have been found to solve these problems at relatively low cost (Lu, 2011).

15
Figure 10. China’s household income distributionProbability of household income being within a given CNY 50 interval (1990 urban prices)
2008
20001991 0.00
0.01
0.02
0.03
0.04
0.05
0.06
0
300
600
900
1200
1500
1800
2100
2400
2700
3000
3300
3600
3900
4200
4500
4800
5100
5400
5700
6000
6300
6600
6900
Source: Herd (2010), using the Chotikapanich et al. (2007) method and source data from NBS.
As the role of the market in the economy grew, income inequalities between households increased considerably in China. Prior to the start of liberalisation, the income distribution was very compressed (Figure 10). The rural income distribution began to change following the individualisation of agricultural production in the early 1980s. In urban areas, the movement started later, in the early 1990s, as the economy opened to foreign trade and the state-owned sector shrank. Returns to education began to increase and the number of jobs in SOEs with egalitarian pay structures and life-time welfare benefits fell. Not surprisingly, inequality increased. Even so, it does not appear that high by international standards (Figure 11). Moreover in recent years, inequality has stabilised, to the extent that it is correctly measured by official statistics. There are causes for concern, however: the continuing gap between urban and rural incomes, inadequate health care coverage, discrimination against migrant workers and low pensions for the elderly.

16
Figure 11. Household inequality compared internationallyGini coefficient of inequality, using household per capita income adjusted for family size
(except for non-OECD countries, where household income is measured per capita) Mid-2000s for OECD countries, 2007 for non-members
0.0 0.1 0.2 0.3 0.4 0.5 0.6 0.7 0.8
DenmarkSweden
LuxembourgAustria
Czech RepublicSlovak Republic
FinlandBelgium
NetherlandsSwitzerland
NorwayIcelandFrance
HungaryGermanyAustralia
KoreaCanada
SpainJapan
GreeceIreland
New ZealandUnited Kingdom
China urbanItaly
PolandUnited States
PortugalIsrael
China nationalTurkey
IndonesiaMexicoRussia
India (rural)ChileBrazil
South Africa
Source: Herd (2010)
While there is substantial evidence that the level of inequality in urban areas has been stabilising in recent years, there are many areas where inequalities persist and whose resolution during the period of the 12th Plan would improve social harmony.
The household registration system in China produces a two-tier labour market in urban areas: those with a local residence permit (hukou) enjoy considerable privileges over migrant workers without such status (Herd, Koen and Reutersward, 2010). This has provided flexibility in local labour markets, since non-resident workers typically have fixed-term contracts or no contract at all and can be easily dismissed or accept pay cuts in times of distress. However, it also deters workers from rural areas to move to urban areas even if that would raise economic welfare and personal wellbeing. Furthermore, it contributes to persistent rural-urban and urban-urban inequality.
Over 200 million people have been drawn into urban areas through official or unofficial migration despite various obstacles to labour mobility, including the registration system and the associate restrictions to social service access. The total number of rural-to-urban migrants without a local hukou is estimated at 74 million. In urban areas, unofficial migrants represent 80% of workers in construction and 68% in manufacturing. Unofficial migrants in urban areas represent 39% of the urban labour force and nearly 46% of non-agricultural employment.
17
Nearly all discussion of rural-to-urban migration focuses on unofficial migration, but over time official migration from rural to urban areas has been larger. Official conversion from rural to urban status is granted by various government departments and concerns mainly university students, communist party cadres and people leaving the military. Official rural-to-urban migrants are markedly different form unofficial migrants. They are well integrated into the local economy and earn 50% more than unofficial migrants.
The hukou registration system has gradually evolved and has become somewhat more flexible. However, few migrant workers can obtain a local (urban) hukou as this would require meeting conditions (such as a high income, good education levels and ownership of their own housing) that are out of their reach. Most migrants work in the private sector of the labour market, without labour contracts. Minimum wage legislation is often not respected and contributions to the social security system not paid at all. The 2008 labour laws provide the basis for giving the employee more recourse to law, but this does not deter illegal labour market activity. Contract law may seem very strict by OECD standards, but the most severe conditions are for the termination of indefinite contracts. However, only 20% of urban employees hold such a contract and most of these people work for the civil service or SOEs. Action is needed during the 12th Plan period to open up SOE recruitment to all persons with appropriate qualifications.
Promoting income growth in rural areas
Although geographical inequality has stabilised or even eased in recent years, it is high by international standards. The United States is about the same size as China, but the Gini coefficient for per capita GDP across states is half of that across Chinese provinces. This should be qualified though as consumption levels differ less across provinces, given that cross-border migrants tend to remit a significant portion of their income to their home province. Moreover, inter-province inequality is mostly attributable to inequalities between urban and rural areas and differences between provinces in the degree of urbanisation.
Three factors can account for almost three-quarters of the gap between rural and urban households: i) the average education level of urban households is much higher; ii) the age premiums decline after 45 in rural areas reflecting greater emphasis on purely manual labour whereas the experience premium dominates in urban areas; and iii) the higher number of dependants in rural households. Urban-rural inequalities can also be seen in the types of income. While the urban-rural gap between labour income per household is relatively small for a given skill and age level, that for pension income and the imputed income from homeownership are much greater. This reflects the unequal coverage of urban and rural households, both for pensions and social assistance (see below). The inequality in pension coverage means that rural residents have a much longer working life than urban dwellers (Herd et al., 2010a).
The key to increasing incomes in rural areas though is to increase the productivity of farms. A second wave of reform is needed which could provide similar results to reforms introduced some 30 years ago. A change in the system of land ownership should be introduced. The underlying ownership of the land could remain with the collective but smallholders should be allowed to have ownership rights that are similar to those offered to urban residents. In particular, they should be entitled to fully transferable use-rights to their land that would be inviolable for a period of 70 years. With more secure tenure, the average farm household (which currently possesses use-rights for 0.6 hectare of farmland and 0.06 hectare of residential land) would have considerable assets. In order for farmers to make long-term, productivity-enhancing and income-generating investments on land, enhanced access to medium or long-term credit is key and so farmland use-rights should become mortgageable. With well-enshrined rights, farmers would also receive better compensation when the government acquires their land-rights by using the compulsory acquisition laws (OECD, 2009).

18
Promoting balanced development amongst regions with prudent urbanisation
Policies so far have mostly aimed at narrowing the income gap between the sparsely populated and underdeveloped West and the more prosperous and fast-growing East. For example, the goals of the Western Development Plan introduced at the start of the 10th Five-Year Plan (2001-05) were to improve infrastructures for communication and water conservation, strengthen environmental protection, adjust the industrial structure and foster growth poles in the West. The thrust of the expenditure has been on large capital-intensive projects designed to lower the cost of making resources of the West available to the East. Government policy has also emphasised opening up the West to foreign companies and stimulating exports from the area. Foreign direct investment in the West is only just over one third that in the rest of the economy relative to the regional product, while SOEs account for almost double the share of industrial value added compared with the rest of the country.
While the poorer parts of the country shared in the growth of national prosperity, there was little evidence until recently that the gap between the poorer and richer parts of the country was narrowing. In the past two to three years, however, clear evidence of catch-up has occurred. The poorer central and western areas have been growing more rapidly than coastal areas. Three factors have helped this development: i) the stimulus plan favoured construction projects in these areas; ii) the commodity boom has boosted mining activities; and iii) wage growth has been rapid in coastal areas, prompting relocation of industry into areas further away from the coast.
Migrants can now register as temporary urban residents and the right of the police to expel unofficial migrants was abolished in 2003. The right of migrants to have temporary registration in cities led to a marked acceleration in population movement. However, in larger towns, migrants registering as temporary residents do not have the same rights as those with a permanent residence permit. The hukou system thus remains a major constraint on migration and hence urbanisation.
The evidence for China is that it has too many cities with too few people. There is a shortfall of cities in the population range of 1 to 10 million, with consequent loss of agglomeration economies (Henderson, 2009). Indeed, given its income level, China is under-urbanised (OECD, 2005). The experience of the OECD area is that market economies evolve into structures where 70% of the population live in predominately urban areas with over 1.5 million inhabitants (OECD, 2010e). Moreover, China has a strict hierarchical administrative approach to the management of cities which favours the very largest cities in terms of infrastructure. This restricts the growth of other cities, with large costs in terms of foregone productivity.
One of the most important bottlenecks to agglomeration economies in China’s cities and suburban areas are distortions in land markets that constrain the availability of serviced land, drive up the price of available land, and hence limit the locational choices of enterprises and households. In core cities the old practice of administratively designating land-use rights to state-owned enterprises is changing, but in many places not fast enough to respond to new demands for land (Kamal-Chaoui et al., 2009). Sustaining rapid growth will require continued urbanisation. The flow of labour out of agriculture, and the movement to urban areas, still has a long way to go. Further rapid urbanisation, as envisaged in 12th Plan, hinges on the removal of barriers to the free flow of labour, but will also require implementation of the government’s programme to create a larger supply of social housing.
The role of fiscal policy in reaching the goals of the 12th Plan
In the context of the 12th Plan, fiscal policy will have to fulfil two roles. First, it will need to preserve sufficient capacity to act in the event of unexpected adverse shocks. Secondly, it will need to provide sufficient resources to increase expenditure on the Plan’s many social goals.
19
In line with its response to the Asian Crisis in the late 1990s, China responded to the recent crisis with fiscal stimulus far greater than in OECD countries. As a result, the economy was kept on a rapid growth path. A large part of the stimulus package involved off-budget expenditure by local authorities. The extent of the increase in the on-budget deficit was limited but public expenditure still rose by nearly 3% of GDP in 2009, in addition of the rise in off-budget expenditure. The authorities have since begun to rebuild their margin for manoeuvre, with the government deficit already falling to under 2% of GDP in 2010.
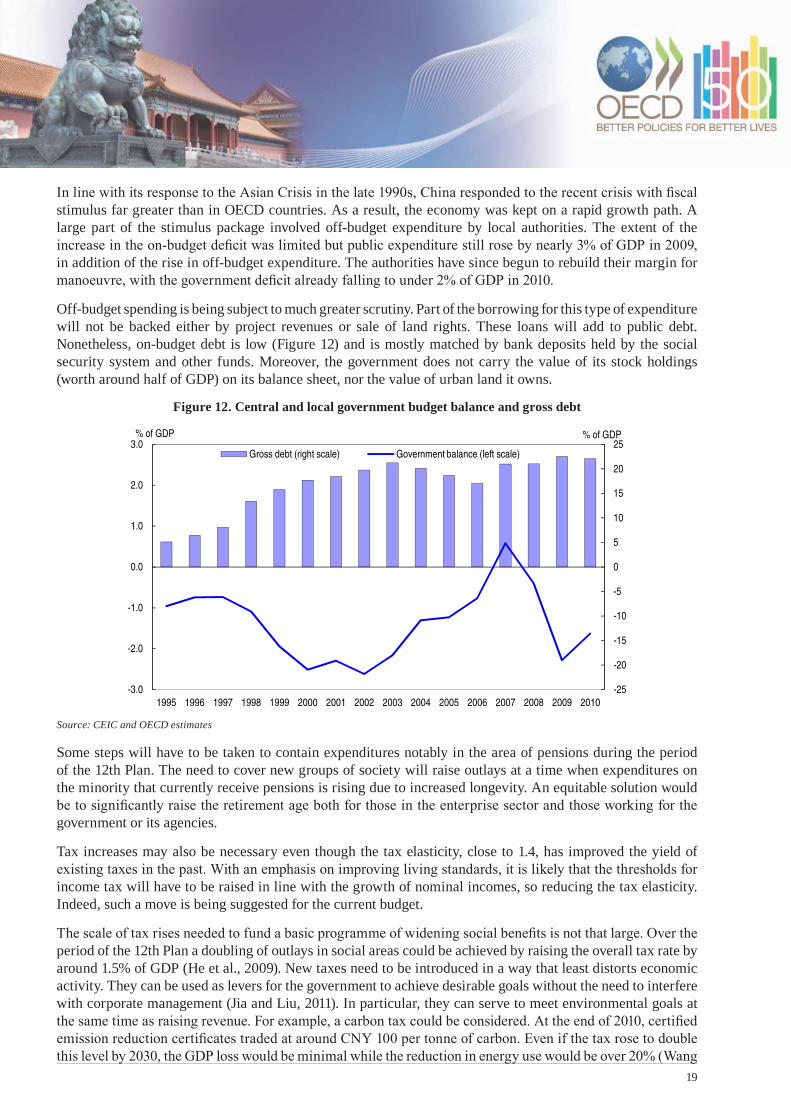
Off-budget spending is being subject to much greater scrutiny. Part of the borrowing for this type of expenditure will not be backed either by project revenues or sale of land rights. These loans will add to public debt. Nonetheless, on-budget debt is low (Figure 12) and is mostly matched by bank deposits held by the social security system and other funds. Moreover, the government does not carry the value of its stock holdings (worth around half of GDP) on its balance sheet, nor the value of urban land it owns.
Figure 12. Central and local government budget balance and gross debt
-25
-20
-15
-10
-5
0
5
10
15
20
25
-3.0
-2.0
-1.0
0.0
1.0
2.0
3.0
1995 1996 1997 1998 1999 2000 2001 2002 2003 2004 2005 2006 2007 2008 2009 2010
% of GDP% of GDP
Gross debt (right scale) Government balance (left scale)
Source: CEIC and OECD estimates
Some steps will have to be taken to contain expenditures notably in the area of pensions during the period of the 12th Plan. The need to cover new groups of society will raise outlays at a time when expenditures on the minority that currently receive pensions is rising due to increased longevity. An equitable solution would be to significantly raise the retirement age both for those in the enterprise sector and those working for the government or its agencies.
Tax increases may also be necessary even though the tax elasticity, close to 1.4, has improved the yield of existing taxes in the past. With an emphasis on improving living standards, it is likely that the thresholds for income tax will have to be raised in line with the growth of nominal incomes, so reducing the tax elasticity. Indeed, such a move is being suggested for the current budget.
The scale of tax rises needed to fund a basic programme of widening social benefits is not that large. Over the period of the 12th Plan a doubling of outlays in social areas could be achieved by raising the overall tax rate by around 1.5% of GDP (He et al., 2009). New taxes need to be introduced in a way that least distorts economic activity. They can be used as levers for the government to achieve desirable goals without the need to interfere with corporate management (Jia and Liu, 2011). In particular, they can serve to meet environmental goals at the same time as raising revenue. For example, a carbon tax could be considered. At the end of 2010, certified emission reduction certificates traded at around CNY 100 per tonne of carbon. Even if the tax rose to double this level by 2030, the GDP loss would be minimal while the reduction in energy use would be over 20% (Wang
20
et al., 2011). The tax yield would amount to 1.2% of GDP, based on 2009 emissions. Thus, the introduction of a carbon tax would go a long way to meeting the target of the 12th Plan of achieving a 17% reduction in carbon dioxide emissions per unit of GDP. Such an approach would be preferable to administrative actions to reduce energy consumption that were taken in an arbitrary fashion in an attempt to meet the targets of the 11th Plan in the second half of 2010 (Yang et al., 2011).
In addition, existing tax rates on the value of extracted natural resources, which are low, could be increased. For instance, with an oil price of $100 per barrel, oil production in China is worth 2.5% of GDP but currently only one-twentieth of this amount is paid to the government.
Another area where there is scope for increasing taxation with little negative impact on resource allocation is the taxation of real estate, through a property tax. Such a tax should aim to consolidate the current plethora of taxes and fees on property construction. By some accounts, there are 120 different taxes and fees on development work (An and Wang, 2005). A property tax would raise significant tax revenues for cities that will need to increase social spending on those without local hukous to the level spent on other residents. By raising the cost of holding empty property, it could damp speculative demand for housing and limit house price exuberance. It is not clear though that this would result in lower total outlays on housing. It is only if property taxes were not fully capitalised that outlays on housing would fall (Li and Song, 2008). However, a number of institutional arrangements would need to be improved, notably property registration and the training of property valuers (Tang et al., 2010).
Challenges to sustain fast yet steady economic development
The 12th Plan will also aim at providing a stable macro-economic environment. With China’s recovery preceding that of the other major economies, and with limited economic slack, exiting the highly stimulative crisis response policies became an issue in the course of 2010. These stimulus policies resulted in a major jump in the money supply and in public-sector infrastructure outlays. Activity quickly responded and by mid-2009 was once again expanding at a double-digit pace. In all economies it is hard to estimate the extent to which capacity is being fully used. This difficulty is compounded, in China, by the ongoing rapid transformation of its economy. However, both the estimated output gap and the OECD composite leading indicator suggest that the economy is operating above capacity. So does the acceleration of inflation. Thus the near-term challenge is how best to tighten policy in order to ensure that inflation eases back towards the authorities’ longer-term target of 3%.
Monetary policy and framework
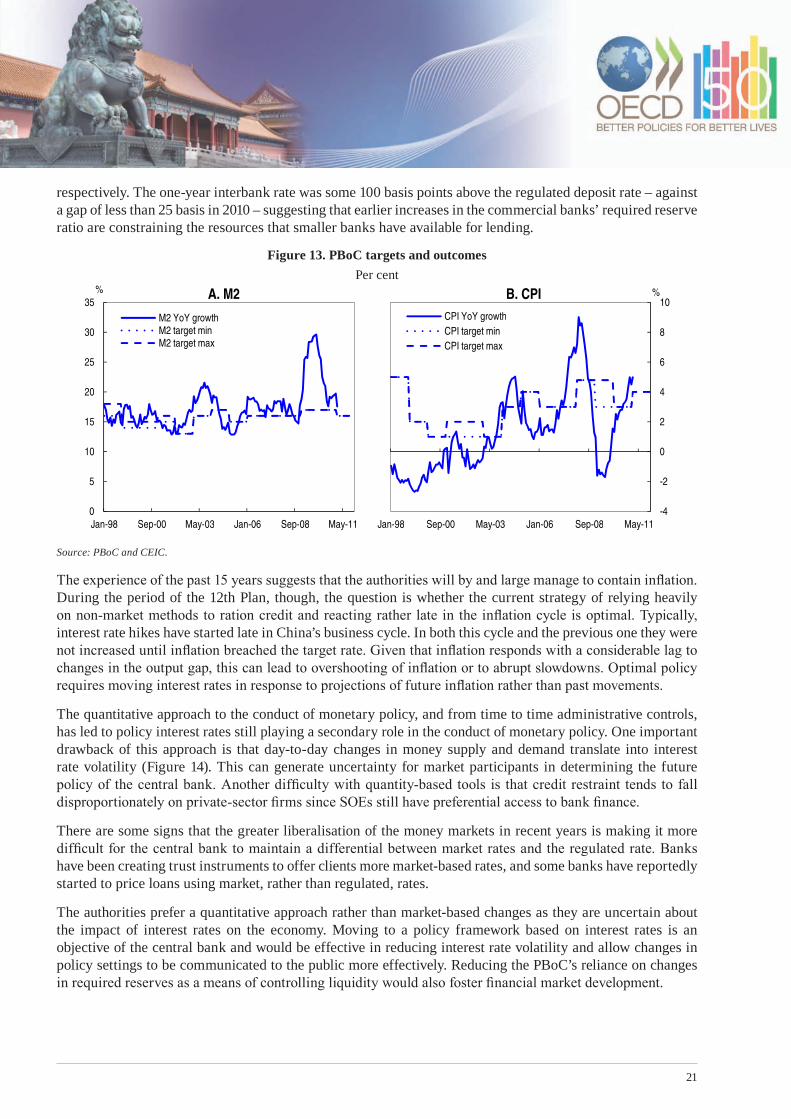
The People’s Bank of China (PBoC) has run monetary policy by setting annual money supply targets. This has not enabled it to meet its inflation targets very well, even though the latter are for the annual average inflation rate and set at the beginning of the year in question rather than in a completely forward-looking fashion. Thus, inflation targets have tended to move in line with actual inflation (Figure 13). Inflation targets have been undershot and overshot, partly reflecting commodity price volatility, given the sizeable share of food in the CPI. The immediate challenge for the authorities now is to contain inflationary pressure without extensive recourse to price controls. Following a brief episode of deflation at the trough of the crisis, inflation has been veering up. CPI inflation rose to around 5% in late 2010. Moreover, inflation is broad-based, affecting investment goods as well as food. A number of policies have been introduced in an attempt to reduce the growth of food prices and these have delinked domestic wheat prices from world prices (Jones and Kwiecinski, 2010) but on the whole the authorities have relied on monetary policy tools. The PBoC embarked on a tightening cycle, with a succession of hikes in reserve requirements but so far only modest hikes in policy-determined interest rates – by February 2011, the regulated one-year bank deposit and lending rates stood at 3.0% and 6.06%,
21
respectively. The one-year interbank rate was some 100 basis points above the regulated deposit rate – against a gap of less than 25 basis in 2010 – suggesting that earlier increases in the commercial banks’ required reserve ratio are constraining the resources that smaller banks have available for lending.
Figure 13. PBoC targets and outcomes Per cent
0
5
10
15
20
25
30
35
Jan-98 Sep-00 May-03 Jan-06 Sep-08 May-11
% A. M2
M2 YoY growthM2 target minM2 target max
-4
-2
0
2
4
6
8
10
Jan-98 Sep-00 May-03 Jan-06 Sep-08 May-11
%B. CPICPI YoY growthCPI target minCPI target max
Source: PBoC and CEIC.
The experience of the past 15 years suggests that the authorities will by and large manage to contain inflation. During the period of the 12th Plan, though, the question is whether the current strategy of relying heavily on non-market methods to ration credit and reacting rather late in the inflation cycle is optimal. Typically, interest rate hikes have started late in China’s business cycle. In both this cycle and the previous one they were not increased until inflation breached the target rate. Given that inflation responds with a considerable lag to changes in the output gap, this can lead to overshooting of inflation or to abrupt slowdowns. Optimal policy requires moving interest rates in response to projections of future inflation rather than past movements.
The quantitative approach to the conduct of monetary policy, and from time to time administrative controls, has led to policy interest rates still playing a secondary role in the conduct of monetary policy. One important drawback of this approach is that day-to-day changes in money supply and demand translate into interest rate volatility (Figure 14). This can generate uncertainty for market participants in determining the future policy of the central bank. Another difficulty with quantity-based tools is that credit restraint tends to fall disproportionately on private-sector firms since SOEs still have preferential access to bank finance.
There are some signs that the greater liberalisation of the money markets in recent years is making it more difficult for the central bank to maintain a differential between market rates and the regulated rate. Banks have been creating trust instruments to offer clients more market-based rates, and some banks have reportedly started to price loans using market, rather than regulated, rates.
The authorities prefer a quantitative approach rather than market-based changes as they are uncertain about the impact of interest rates on the economy. Moving to a policy framework based on interest rates is an objective of the central bank and would be effective in reducing interest rate volatility and allow changes in policy settings to be communicated to the public more effectively. Reducing the PBoC’s reliance on changes in required reserves as a means of controlling liquidity would also foster financial market development.

22
Figure 14. Official and money market interest rates
0
2
4
6
8
10
12
0
2
4
6
8
10
12
Mar
-98
Sep-
98
Mar
-99
Sep-
99
Mar
-00
Sep-
00
Mar
-01
Sep-
01
Mar
-02
Sep-
02
Mar
-03
Sep-
03
Mar
-04
Sep-
04
Mar
-05
Sep-
05
Mar
-06
Sep-
06
Mar
-07
Sep-
07
Mar
-08
Sep-
08
Mar
-09
Sep-
09
Mar
-10
Sep-
10
Mar
-11
% pa% pa
Rate paid on excess reserves
Rate on borrowing from the central bank
7-day repo rate
Source: CEIC
Moreover, there is evidence that the Chinese economy has become sufficiently sensitive to variations in interest rates to warrant a move away from a quantity-based to an interest-rate based monetary policy. With the rapid development of the private sector there appears to be an interest rate channel operating through the user cost of capital as well as a credit channel through firms’ balance sheets and collateral (Conway et al., 2010). The impact of monetary policy on consumption is probably still small, but it has been growing over the past decade as well. In particular the housing market has become a significant channel through which interest rates affect the real economy, owing to a re-orientation of the banking system towards more commercial lending practices following housing market reforms in the late 1990s. This increase in mortgage lending has been one the factors pushing up housing prices to very high levels. The banking regulator and the central bank have responded to the risks that this could pose by a number of regulatory changes. These form the beginnings of the macro-prudential policy that China is initiating (Zhou, 2010).
Just as importantly, there is also evidence that inflation responds to movement in the balance of supply and demand in the economy and to the movements of the exchange rate.
Therefore, inflation appears to be controllable through the use of market-related instruments and there is a case for moving towards an inflation target during the period of the 12th Plan. Incorporating a credible inflation objective into the PBoC’s monetary policy framework would yield a number of benefits. An inflation objective is transparent and easily understood by the public. When monetary policy is credible, an inflation objective can help drive inflation expectations.
Moving China’s monetary policy framework in this direction would, however, require a range of improvements in other areas. Policies that attempt to influence inflation by controlling individual prices would need a rethink and China’s macroeconomic statistics would need to continue to improve. The issue of central bank operational independence would also need to be addressed so as to allow the PBoC to generate the credibility it needs to influence inflation expectations. The State Council would still set the strategic objectives, but leave implementation to the PBoC. In the medium term, monetary policy should focus increasingly on the goal of price stability, even if that involved slightly more volatility in output.
23
Exchange rate policy
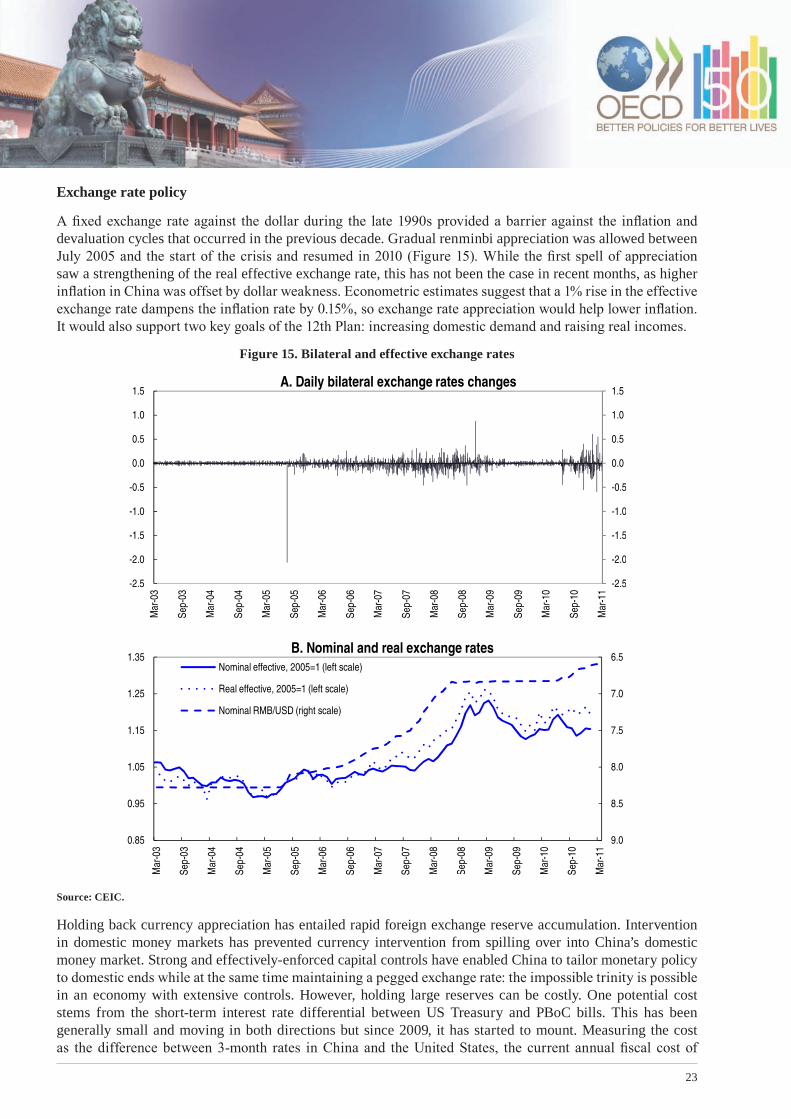
A fixed exchange rate against the dollar during the late 1990s provided a barrier against the inflation and devaluation cycles that occurred in the previous decade. Gradual renminbi appreciation was allowed between July 2005 and the start of the crisis and resumed in 2010 (Figure 15). While the first spell of appreciation saw a strengthening of the real effective exchange rate, this has not been the case in recent months, as higher inflation in China was offset by dollar weakness. Econometric estimates suggest that a 1% rise in the effective exchange rate dampens the inflation rate by 0.15%, so exchange rate appreciation would help lower inflation. It would also support two key goals of the 12th Plan: increasing domestic demand and raising real incomes.
Figure 15. Bilateral and effective exchange rates
-2.5
-2.0
-1.5
-1.0
-0.5
0.0
0.5
1.0
1.5
-2.5
-2.0
-1.5
-1.0
-0.5
0.0
0.5
1.0
1.5
Mar
-03
Sep-
03
Mar
-04
Sep-
04
Mar
-05
Sep-
05
Mar
-06
Sep-
06
Mar
-07
Sep-
07
Mar
-08
Sep-
08
Mar
-09
Sep-
09
Mar
-10
Sep-
10
Mar
-11
A. Daily bilateral exchange rates changes
6.5
7.0
7.5
8.0
8.5
9.00.85
0.95
1.05
1.15
1.25
1.35
Mar
-03
Sep-
03
Mar
-04
Sep-
04
Mar
-05
Sep-
05
Mar
-06
Sep-
06
Mar
-07
Sep-
07
Mar
-08
Sep-
08
Mar
-09
Sep-
09
Mar
-10
Sep-
10
Mar
-11
B. Nominal and real exchange ratesNominal effective, 2005=1 (left scale)
Real effective, 2005=1 (left scale)
Nominal RMB/USD (right scale)
Source: CEIC.
Holding back currency appreciation has entailed rapid foreign exchange reserve accumulation. Intervention in domestic money markets has prevented currency intervention from spilling over into China’s domestic money market. Strong and effectively-enforced capital controls have enabled China to tailor monetary policy to domestic ends while at the same time maintaining a pegged exchange rate: the impossible trinity is possible in an economy with extensive controls. However, holding large reserves can be costly. One potential cost stems from the short-term interest rate differential between US Treasury and PBoC bills. This has been generally small and moving in both directions but since 2009, it has started to mount. Measuring the cost as the difference between 3-month rates in China and the United States, the current annual fiscal cost of

24
sterilisation is over 1.5% of GDP. Part of this cost is passed onto the banking sector as the interest rate paid by the PBoC on required reserves is typically lower than interest rates prevailing in the money market. In addition, the central bank has incurred substantial losses due to the appreciation of the currency against the dollar, although it is not threatened with a shortage of equity.
In conclusion, the greatly increased dependence of the Chinese economy of foreign trade movements and the increased reliance of the economy on the private sector suggests that more weight ought to be put on market-related instruments, including the exchange rate, during the period of the 12th Plan.
The next stage in opening up the economy
The 12th Plan calls for greater opening-up of the economy in the next five years. The opening-up of the economy with respect to foreign trade and inward direct investment has largely been achieved, even if there are a few areas where progress could be made. Outward foreign direct investment has soared in the past five years and even rose very slightly in 2009 when other countries’ FDI nearly halved.
Capital transactions represent the next area where opening-up could occur. One channel would be to pursue greater internationalisation of the currency. The authorities have been experimenting in this direction, in collaboration with the Hong Kong Monetary Authority (HKMA). Any individual or company with trade relations with mainland China can open a renminbi bank account in Hong Kong, China. The HKMA ensures that the banking system does not lend the money back to the mainland or Chinese companies that will remit the currency to the mainland. A limited number of renminbi-denominated bonds have been issued for banks to purchase. However, at end 2010, the total stock of renminbi deposits in Hong Kong was less than $50 billion. The objective of the government in allowing this market (where interest rates differ from those on the mainland) is to gain experience in a more developed financial market. However, the market still lacks liquidity, which may make it difficult to start trading renminbi-denominated shares of mainland Chinese companies.
A greater use of the renminbi in international trade and financial transaction can only come with the gradual introduction of capital account convertibility. Foreign firms can now hold renminbi balances for trade settlement purposes. However, banks only have a limited range of assets in which to invest these deposits, so making returns to depositors unattractive. A full developed internationalisation of the currency would require that banks be able to lend the currency to mainland borrowers. This, at present, is only possible within very limited quotas.
Another channel would be to relax controls over capital flows. Currently, the market for Chinese equities continues to be split between the domestic market and non-mainland markets such as Hong Kong, China. Arbitrage is not possible between the two markets, though the price discrepancies between the two markets have been falling. For a bank to invest directly in the mainland market it has to be approved as an institutional investor and granted part of a quota of currency allowed for this purpose, amounting to $30 billion. Bond markets are still completely closed. Liberalisation of financial flows may only occur gradually but should take place on market-based principles. For example, the quotas for financial investment could be gradually increased and allocated through market-clearing auctions.
At some point with internationalisation of the renminbi or opening of the capital account, the authorities would have to choose between a quasi-fixed exchange rate and retaining sovereignty over monetary policy. If the renminbi was fully internationalised, then maintaining a fixed exchange rate against the US dollar, or even a managed peg, would require following the monetary policy of the United States. A small flexible economy, such as Hong Kong, China is able to maintain such a regime, at the cost of large changes in prices from time to time. For a large economy (such as China) with an internationalised currency, and a business cycle that is not synchronised with that of the United States, a fixed exchange rate is unlikely to be optimal for jobs or inflation.

25
So at some point, greater internationalisation of the currency will require a much more flexible exchange rate. However, few expect the renminbi to become fully convertible in the next few years, despite the growing share of world trade and direct investment accounted for by China (Wu et al., 2010).
Concluding remarks
For the past three years, the government has successfully focussed on increasing domestic demand. The new 12th Plan is likely to put at its heart to increase the share of consumption in GDP. Indeed, one of its ambitions is to reduce the large gap between China’s share of world output and its share of world consumption (Liu, 2010). In this respect, urbanisation is seen as key. To that end, it will be important to encourage the growth of urban jobs, so that agricultural workers can move to cities and gradually become full urban residents, having the right to appropriate health, education and other public services.
In addition to ensuring continued rapid productivity growth, the supply side of the economy is to be improved by concentrating resources on seven new strategic industries (new-generation information technology, energy-saving and environmental protection, new energy, biotechnology, high-end equipment manufacturing, new materials and new-energy cars). These sectors, some of which are geared towards greener growth, are expected to account for 8% of GDP by the end of the Plan period. The Plan also aims to encourage the development of business services and to boost the share of the tertiary sector in GDP by four percentage points. Finally, the government is aiming for a major reduction in energy consumption and carbon dioxide emissions per unit of output.
Now that China has a per capita income of $4 000, the government is concerned to avoid the so-called middle-income trap. Of the countries that were middle-income in 1960, almost three-quarters had remained middle-income or had regressed to low-income by 2009. Hence, it cannot be taken for granted that a country reaching middle-income status will subsequently move to the high-income group. Japan, Korea and number of European countries have successfully made this transition. For China to do likewise, the momentum of the economic reforms will need to be maintained.

26
Bibliography
• An, T. and H. Wang (2005), “Research of China Housing Market Development and Real Estate Tax System Reform”, Jingji Yanjiu Cankao (Review of Economic Research), Vol. 26, No. 43.
• Arnold, J., B. Brys, C. Heady, Å. Johansson, C. Schwellnus and L. Vartia (2011), “Tax Policy for Economic Recovery and Growth”, Economic Journal, Vol. 121, Issue 550.
• Bernanke, B., C. Bertaut, L. P. DeMarco and S. Kamin (2011), “International Capital Flows and the Returns to Safe Assets in the United States, 2003-2007”, Board of Governors of the Federal Reserve System, International Finance Discussion Papers, No. 1014.
• Chotikapanich, D., D.S. Prasada Rao and K. Tang (2007), “Estimating Income Inequality in China Using Grouped Data and the Generalized Beta Distribution”, Review of Income and Wealth, Vol. 53, No. 1.
• Conway, P., T. Chalaux and R. Herd (2010), “Reforming China’s Monetary Policy Framework to Meet Domestic Objectives”, OECD Economics Department Working Papers, No. 768.
• Fan, J.P.H., J. Huang, F. Oberholzer-Gee, T. Smith and M. Zhao (2008), “Diversification of Chinese Companies: An International Comparison”, Chinese Management Studies, Vol. 2, Issue 1.
• He, P., Y. Wang and L. Shi (2009), “Public Financing of Social Welfare Programs in China”, Chapter 12 of The China Development Report 2008/09: Constructing a Developmental Social Welfare System for All, China Development Research Foundation, Beijing.
• Henderson, J. (2009), “Urbanization in China: Policy Issues and Options”, China Economic Research and Advisory Programme, Center for International Development at Harvard University, Cambridge. MA.
• Herd, R. (2010), “A Pause in the Growth of Inequality in China?”, OECD Economics Department Working Papers, No. 748.
• Herd, R., V. Koen and A. Reutersward (2010), “China’s Labour Market in Transition: Job Creation, Migration and Regulation”, OECD Economics Department Working Papers, No. 749.
• Herd, R., Y.-W. Hu and V. Koen (2010a), “Providing Greater Old-Age Security in China”, OECD Economics Department Working Papers, No. 750.
• Herd, R., Y.-W. Hu and V. Koen (2010b), “Improving China’s Health Care System”, OECD Economics Department Working Papers, No. 751.
• Jia, K. and W. Liu (2011), “China’s Fiscal Policies during the Post-Crisis Era”, Paper from the Research Institute for Fiscal Science, Ministry of Finance, produced as a background report for the 2010-2011 China Development Report, CDRF, Beijing.
• Jones, D. and A. Kwiecinski (2010), “Policy Responses in Emerging Economies to International Agricultural Commodity Price Surges”, OECD Food, Agriculture and Fisheries Working Papers, No. 34.
• Kamal-Chaoui, L., E. Leman and Z. Rufei (2009), “Urban Trends and Policy in China”, OECD Regional Development Working Papers, 2009/1.
• Li, D. and S. Song (2008), “Property Tax in Urban China”, China and the World Economy, Vol. 16, No. 4.
• Liu, H. (2010), “The New Five Year Plan”, Interview of Vice Minister of the Office of the Leading Group on the Economy and Finance, Caixin, 8 November.
27
• Lu, M. (2011), Poverty Eradication in China: A New Phase, China Development Research Foundation.
• OECD (2002), China in the World Economy: The Domestic Policy Challenges, Paris.
• OECD (2005), OECD Economic Survey of China, Paris.
• OECD (2008) Investment Policy Reviews: China, Paris.
• OECD (2008), OECD Reviews of Innovation Policy, China, Paris.
• OECD (2009), OECD reviews of Rural Policy: China, Paris
• OECD (2010a), “Green Growth Strategy Interim Report: Implementing our Commitment for A Sustainable Future”, May, Paris.
• OECD (2010b), OECD Economic Outlook No. 88, Paris.
• OECD (2010c), 2010 OECD Employment Outlook: Moving Beyond the Jobs Crisis, Paris.
• OECD (2010d), OECD Economic Survey of China, Paris.
• OECD (2010e), “Trends in Urbanisation and Urban Policies”, in OECD Countries: What Lessons for China?, Background report for the CDRF, Paris.
• OECD (2010f) “Shanghai and Hong Kong: Two Distinct Examples of Education Reform in China” in Strong Performers and Successful Reformers in Education: Lessons from Pisa for the United States, Paris
• OECD (2010g), PISA 2009 Volume I, What Students Know and Can Do: Student Performance in Reading, Mathematics and Science, Paris.
• Prasad, E. and M. Chamon (2010), “Why are Saving Rates of Urban Households in China Rising?”, American Economic Journal: Macroeconomics, Vol. 2, No. 1.
• Saunders, P. (2007), “Comparing Poverty Among Older People in Urban China Internationally”, China Quarterly, Vol. 190.
• Tang, B.S., S. W. Wong and S. C. Liu (2010), “Institutions, Property Taxation and Local Government Finance in China”, Journal of Urban Studies, Vol. 17, No. 4.
• United Nations Development Programme (2008), China Human Development Report 2007/08: Access for all: Basic Public Services for 1.3 billion People, Xinhua Publishing, Beijing.
• Wang, J.N., C.Z. Ge, G. Yan, K.J. Jiang, L.C. Liu and Z. Dong (2011), “The Design on China’s Carbon Tax to Mitigate Climate Change”, Working Paper, Energy Research Institute, National Development and Reform Commission and China Academy for Environmental Planning, Beijing.
• World Bank (2010), Global Monitoring: The Millennium Development Goals after the Crisis, Washington DC.
• Wu, F., R. Pan and D. Wang (2010), “The Renminbi’s Potential to Become a Global Currency”, China and the World Economy, Vol. 18, No. 1.
• Yang, F., Y. Hou and J. Li (2011), “China Needs Higher Targets”, ChinaDialogue, 3 March.
• Zhou, X. (2010), “Macro-Prudential Policy – An Asian Perspective”, Opening remarks of the Governor of the Peoples’ Bank of China at the High Level Seminar on “Macro-prudential policy: Asian perspective”, Shanghai, 18 October.

China’s Emergence as a Market Economy: Achievements and Challenges
OECD contribution to the China Development Forum20-21 March 2011, Beijing
March 2011© Centaur
www.oecd.org/china


