THE AUSTRALIAN NATIONAL UNIVERSITY WORKING PAPERS IN ECONOMICS AND ECONOMETRICS China’s Real Exchange Rate Jane Golley and Rod Tyers College of Business and Economics Australian National University May 2007 Working Paper No. 479 ISBN: 086831 479 Key words: Chinese economy, real exchange rate, economic growth, productivity, demographic change JEL codes: C68, C53, E27, F21, F43, F47, J11, J13, J26, O11 * Funding for the research described in this paper is from Australian Research Council Discovery Grant No. DP0557889. Thanks are due to Bu Yongxiang, Huang Yiping and Chris Milner for useful discussions on the topic, to Christopher Kent and participants in an April 2007 Reserve Bank of Australia seminar for valuable comments, to Terrie Walmsley for technical assistance with the GTAP Database, Wang Xiaolu for help with China’s national accounts and to Iain Bain and Hsu Pingkun for research assistance.
Transcript
THE AUSTRALIAN NATI ONAL UNIVERSITY WORKING PAPERS IN ECONOMICS AND ECONOMETRICS
China’s Real Exchange Rate
Jane Golley and Rod Tyers
College of Business and Economics Australian National University
May 2007
Working Paper No. 479 ISBN: 086831 479
Key words: Chinese economy, real exchange rate, economic growth, productivity, demographic change
JEL codes:
C68, C53, E27, F21, F43, F47, J11, J13, J26, O11
* Funding for the research described in this paper is from Australian Research Council Discovery Grant No. DP0557889. Thanks are due to Bu Yongxiang, Huang Yiping and Chris Milner for useful discussions on the topic, to Christopher Kent and participants in an April 2007 Reserve Bank of Australia seminar for valuable comments, to Terrie Walmsley for technical assistance with the GTAP Database, Wang Xiaolu for help with China’s national accounts and to Iain Bain and Hsu Pingkun for research assistance.
China’s Real Exchange Rate Abstract International pressure to revalue China’s currency stems in part from the expectation that rapid economic growth should be associated with a real exchange rate appreciation. This hinges on the Balassa-Samuelson hypothesis under which economic growth, stemming from improvements in traded sector productivity, causes non-traded prices to rise. More generally, real depreciations can stem from non-traded productivity improvements or, in association with failures of the law of one price for traded goods, labour supply growth and growth-related demand switches due to changes in the saving rate, trade distortions or investment risk premia. This chapter examines the sensitivity of China’s real exchange rate to these determinants. The results confirm that financial capital inflows are a dominant appreciating force in the short run, helping to explain why it is the surplus of Chinese domestic saving over its investment that has restrained the real exchange rate from appreciating during the past decade. In the long term, the appreciating effect of the inevitable fall in the saving rate is likely to be at least partially offset by the depreciating effects of skill acquisition and services productivity growth. Indeed, if future Chinese growth is propelled by these factors, a long term real depreciating trend could be in store. Introduction
While the People’s Bank of China (PBC) has long been committed to maintaining a stable
nominal exchange rate, there is increasing pressure for the Chinese authorities to allow the
currency to float more freely. Flexibility upward is seen as necessary in part to restrict China’s
large and growing current account surplus and the corresponding deficits in trading partners,
particularly in United States (Bernanke 2006). More generally, exchange rate flexibility is
considered to be a crucial part of China’s ongoing development process (Lardy, 2006; Prasad et
al. 2005; Goldstein, 2004). It has been argued that the appreciation of the RMB since 2005 is just
the beginning of a necessary upward trend, given the belief that the currency is currently
undervalued, by margins ranging from ‘small’ to as high as 50% (Frankel, 2004; Wang, 2004;
Goldstein, 2004; Coudert and Couharde, 2005).1 Superficially at least, notwithstanding the effect
of capital controls in restricting private financial outflows, the rapid rise of the PBC’s foreign
1 Tyers et al. (2007) suggest undervaluation was more substantial in the 1996-2002 period than in 2004 since financial inflows appear to have been over-sterilised by reserve accumulation in that period.
2
reserves since the early 1990s is taken as evidence of “monetary mercantilism”.2 Yet it is far
from certain that the only way the RMB can go is up.
Expectations that China’s underlying real exchange rate will appreciate in the future are
commonly based on the Balassa (1964) – Samuelson (1964) hypothesis, which implies a positive
relationship between economic growth and the real exchange rate, driven by productivity catch-
up in developing countries’ tradable sectors that is accompanied by rising prices in their non-
traded sectors. Yet the simple Balassa-Samuelson characterisation of the growth process is
inaccurate on many fronts, not least of which is its omission of productivity gains in the non-
tradable sector that tend to be depreciating.3 Moreover, the law of one price is commonly not
found to apply to tradable goods, under which circumstance there are numerous other drivers of
China’s economic growth that affect the real exchange rate (Tyers et al. 2006). These include
labour force expansion, skill acquisition, changes in saving rates and trade and financial reforms.
The net effect of China’s comparatively rapid economic growth on its real exchange rate
therefore depends on the sources of that growth and the consequent pattern of endowment
changes and sectoral distributions of productivity growth and tradability.
This chapter explores the interactions between sources of growth and the real exchange
rate. The next section considers the Balassa- Samuelson hypothesis in the context of recent and
future sources of Chinese economic growth, offering a variety of reasons why China’s behaviour
need not be consistent with the hypothesis. This is followed by a discussion of China’s
macroeconomic policy regime and its on-going reforms to the financial sector, both of which
have profound implications for the trend of its real exchange rate. The issues arising in these
sections are then assessed using a simulation model of the global economy in which a full
demographic sub-model is incorporated. The inclusion of demography captures the impending
2 See Aizenman and Lee (2006). According to the IMF’s International Financial Statistics, China’s foreign reserve accumulation has absorbed about a tenth of its GDP each year since 2004 with the total stock of reserves amounting to an extraordinary 41 per cent of GDP by the end of 2006. 3 Miyajima (2005) notes the prominence of services productivity in the growth experience of many OECD countries.
3
decline in China’s overall labour force and the rise in its skill intensity. Baseline and comparator
simulations are constructed to examine the sensitivity of real exchange rate paths to changes in
the labour supply (achieved via changes to fertility policy that encourage larger families),
alternative labour productivity and skill upgrading scenarios, declining savings rates and financial
sector reform. Policy implications are presented in the concluding section.
Balassa-Samuelson: Theory and Reality
If the nominal exchange rate, E, is defined as the number of units of foreign exchange obtained
for a unit of the domestic currency, the real exchange rate, , can be defined correspondingly as
the rate of exchange between the home product bundle and corresponding bundles produced
abroad. It follows that the bilateral real exchange rate for a focus (home) country with foreign
trading partner i can be approximated as the common currency ratio of the GDP prices (deflators)
of the two countries,
Re
( ),Y N TP p p and ( ), /Y N Ti i iP p p Ei , where Tp and Np are indices over all the
focus country’s non-traded and traded goods and services, respectively.4
(1) ( )
( )( )( )
, ,
, / ,
Y N T Y N TRi iY N T Y N T
i i i i i i i
P p p P p pe E
P p p E P p p= =
This is the fundamental relationship between the real and nominal exchange rates. Consider the
case in which prices at home and abroad are measured in a common currency, the share of non-
traded products in GDP, θ, is the same at home and abroad, prices are appropriately aggregated
using a Cobb-Douglas index and the law of one price applies to all traded goods. The latter
implies that trade is costless and undistorted, so that Tip pT= . Under these conditions the real
exchange rate becomes:
4 Here we imagine that, rather than the continuum of tradability that is actually observed across goods and services, traded and non-traded goods are starkly separated as T, N.
4
(2) ( ) ( )( ) ( )
1
1
N T N
R NN Tii i
p p pepp p
θ θ θ
θ θ
−
−
⎛ ⎞= = ⎜ ⎟
⎝ ⎠.
From this the key role of non-traded goods prices is clear. When prices are measured in a
common currency, or relative to a common numeraire, it is the ratio of the home and foreign non-
traded goods prices that matters in determining the real exchange rate.
Consider a Ricardian exchange in which output per worker is TA ab= , NA ac= ,
Ti iA ab= and N
i iA ac= . Here a is common to both sectors and regions, b is a component of
productivity that is biased toward the traded sector and c is a component biased toward the non-
traded sector. The parameters b and c are different between countries. The relationship between
the wage rate and product prices are then:
(3) T T ii T
i
W WP P TA A= = = , so that
T
Ti i
W AW A
= ,
and
(4) ,N N iiN
i
WWP P NA A= = , in the traded and non-traded sectors respectively.
We then have that
(5) //
N T N
N T Ni ii i i
P A A b cb cP A A
= = and Ri
i i
b ceb c
θ⎛ ⎞
= ⎜ ⎟⎝ ⎠
.
By the Balassa-Samuelson hypothesis, if the focus country has higher tradable productivity
growth, , and assuming that ib b> ic c= , its real exchange rate must be appreciating. The
hypothesis then implies that, if developing countries are poorer because their tradable labour
productivity is lower, then comparatively rapid growth should cause real appreciations.
The key assumptions of the hypothesis are suspect, however.
5
Tradable productivity gap: During some periods and in some developing countries, productivity
growth has been observed to be higher in the non-tradable sector,5 leading to and tending to
depreciate the real exchange rate. Modern transport, financial, health and education services
offer considerable potential for productivity catch-up. Whatever the relative performance of
China’s services sector in the past, recent evidence suggests very substantial potential for catch-
up and accelerated productivity growth in the future (see Ma, 2006).
ic c>
The law of one price for tradable goods: Failures of the law of one price have been observed for
tradable goods in specific instances6, and more generally, these are evidenced by pervasive intra-
industry trade between countries. Goods and services are not homogeneous across countries but
are differentiated at minimum by country of origin.7 Supply and/or demand side factors that raise
the volume of tradable production move the home country down the global demand curves for its
product varieties, reducing its supply prices and resulting in both deterioration in the terms of
trade and a depreciation of its real exchange rate. Factor endowment growth and changes in
policy that lead to substitution in demand for home products both depreciate real exchange rates
and the magnitudes of their effects depend crucially on the degree of substitutability between the
differentiated products.
Labour arbitrage: In most developing countries the marginal product of industrial labour exceeds
that of rural labour due to the more rapid accumulation of industrial capital. There is, therefore, a
Harris-Todaro gulf between the wages in the expanding and contracting sectors. If labour
mobility between the rural and industrial sectors is inferior to that between the rural and service
sectors (particularly the construction sector), then industrial productivity growth does not
necessarily drive up service wages or service costs.8
5 For example, the cold war infrastructure investments in Korea and Taiwan reduced service costs at early stages in their periods of rapid expansion. 6 See, for example, Bergin et al. (2006), Crucini et al. (2005) and Drine and Rault (2005). 7 This is a standard assumption in the most widely used numerical models of open economies and global trade. See, for example, Dixon et al. (1982), McKibbin and Sachs (1991), Hertel (1997) and Dixon and Rimmer (2002). 8 Evidence for this is offered by Chang and Tyers (2003).
6
Closed capital account: The assumption that the real exchange rate depends only on interactions
among countries associated with trade in merchandise is clearly violated in many of today’s
developing countries, and particularly in China. Its violation, in concert with failures of the law
of one price for traded goods, means that any influx of payments (in the form of an FDI or
portfolio capital flow) raises aggregate demand. Since traded goods are supplied more elastically
via imports than are non-traded goods, which depend on home resources, such an influx must
raise relative non-traded prices and therefore appreciate the real exchange rate. Conversely,
effluxes will cause depreciation.
Not surprisingly then, empirical evidence in support of the Balassa-Samuelson hypothesis
is mixed. Choudhri and Khan (2004), for example, find favourable evidence using a small
sample of developing countries that does not include Mainland China, Taiwan or Hong Kong.
Bergin et al. (2006) find a positive association between price levels and real per capita income
that is only strong in large samples of countries. Miyajima (2005) uses a sample of 15 OECD
countries between 1970 and 2000 to establish that the hypothesis does not always hold during
growth surges, which on numerous occasions were led by productivity growth in non-traded
sectors. The East Asian evidence since 1980 also appears mixed. Figure 1 plots bilateral real
exchange rates against the US for Mainland China and some of its neighbours, demonstrating that
there is no clear pattern.
To examine the productivity gap component of the hypothesis for China we estimate
simple Solow residuals for the economy as a whole and for three sectors: “Food”, “Industry” and
“Services”, adjusting the officially published urban employment data for underestimation as
discussed in Cai and Wang (2006).9 The average annual changes in the Solow residuals for each
sector are given in Table 1. These show strong productivity performance by the Chinese
economy since the mid-1980s, with a slowdown in the 1998-2001 period associated with the 9 The “Food” sector is defined as Primary Industry plus Food Processing, “Industry” as Secondary Industry minus Construction and Food Processing, while “Services” as Tertiary Industry plus Construction. See Tyers et al. (2006) for further details.
7
Asian financial crisis. Consistent with the analysis of Lu (2006) and Fogel (2006), productivity
growth appears to have been strongest in the industrial sector and weakest in the service sector.10
Yet, particularly in recent years, the differences are not large. This has limited the extent of
service price inflation, which, while evident in Figure 2 since 1995, is not overwhelming.
Taking a different approach, Rodrik (2006) measures the productivity associated with
China’s exports and shows it to be significantly higher than what would normally be expected for
a country at China’s income level. He also shows that this has been an important determinant of
China’s growth during the period 1992 to 2003. Relevant to the discussion here, he asks whether
the Chinese economy will run out of steam once the convergence in export productivity nears
completion, or whether it will be able to “discover” new products on world markets and enable
export-led growth to continue. While such speculation suggests future real appreciations based
on productivity growth in the tradable sector, considerable future growth could stem from
productivity catch-up in the service sector, a depreciating force. The fact that recent productivity
growth in manufacturing has been associated with FDI and that service FDI has only recently
begun to grow, suggests that services productivity will be a major contributor in the future.
Clearly, the sectoral distribution of productivity gains is critical in determining the real exchange
rate.
In turn, productivity differences across sectors will be affected by levels of education and
training. Fogel (2006) predicts that investment in human capital has the potential to serve as
China’s key engine of economic growth for the next two decades, a point which is well
recognised by China’s leaders (as emphasised in the 11th Five-Year Plan). He qualifies the 10 Moreover, it must be borne in mind that services output volumes and prices are more poorly measured than those in merchandise sectors in all countries. These comparative measures therefore carry large error margins. Lu (2006) estimates labour productivity in China’s manufacturing and service sectors between 1978 and 2004. He describes the evolution of China’s manufacturing labour productivity after 1978 as a two-stage process: during the first stage (1978-1990) it was only 1.9% per year, compared with a per capita GDP growth rate of 7.5%; while during the second stage (1991-2004) it increased dramatically, averaging 13.1%, significantly higher than the official per capita GDP growth rate of 8.2%. Labour productivity in the service sector averaged 4.3% per year over the entire period. Fogel (2006) disaggregates per capita income growth between 1978 and 2002 and shows that 69 per cent of growth was due to increases in labour productivity, which grew most rapidly in industry (6.2 per cent per annum), nearly as high in agriculture (5.7 per cent) and lowest, but still substantial, in services (4.5 per cent).
8
impact of enhancing the quality of labour through education on the growth rate of per capita
income and shows that increasing secondary and tertiary enrolment ratios has a sizeable impact
on the growth of labour productivity and the per capita GDP growth rate.11 To the extent that
services are skill-intensive (as they are according to past data), this will boost performance in the
service sector, again tending to depreciate China’s real exchange rate.
Allowing for failures of the law of one price for tradable goods, there are numerous other
forces tending to depreciate the real exchange rate in the long term. During the past two decades
one such force has been China’s “demographic dividend”, stemming from the high proportion of
working aged people in the total population. This, according to Cai and Wang (2005), accounted
for about one-quarter of per capita GDP growth between 1980 and 2003.12 It has played a critical
role in keeping wages and hence the real exchange rate low, thereby enabling the rapid expansion
of labour-intensive manufactured exports. In the future, however, the aging of the population and
the consequent decline in the labour supply will have the opposite effect, placing upward pressure
on real wages and the real exchange rate.13 Alternative population policies, such as the relaxation
of the One Child Policy, clearly stand to impact on economic growth via the labour supply, and
therefore on the real exchange rate as well.
The Balassa-Samuelson assumption that productivity gains translate into higher wages
(equations 3-5) is underpinned by the assumption of full employment and labour market
arbitrage. While Miyajima finds that this assumption is satisfied for his OECD sample, it is far
from clear that it has also held for China. Cai and Wang (2006) show that, during the period
1995−2002, average annual manufacturing wage growth was 11.6 per cent in China, below their
estimate of productivity growth (12.2 percent), a point that is also supported by Fan (2006). And 11 For example, he calculates that if the tertiary enrolment ratio rose from 6 to 25 in the next twenty years (putting China where the Western European nations were in 1980), the growth rate of labour productivity would rise by 4.4 per cent between 2000 and 2020, and that this would account for over 60 per cent of the per capita GDP growth target set in 2002. With the tertiary ratio increasing from 12.5 per cent to 19 per cent between 2000 and 2004, if anything his estimates may be too conservative. 12 See Bloom and Williamson (1998) for a generic discussion of the demographic dividend in developing countries. 13 Golley and Tyers (2006) confirm this, finding that the non-working aged dependency ratio could rise to 43 per cent.
9
if, as noted above, rural labour is more mobile into some services than into manufacturing, the
wage cost effect on services might have been yet smaller. Thus, labour mobility into the non-
rural sectors may have offset the appreciating forces in recent decades.
Yet there is evidence that this is about to change. The emergence of a shortage of rural
migrant workers in the last few years signals a transition to a more limited labour surplus (Cai
and Wang, 2006).14 In combination with the demographic transition towards a declining
proportion of the population in working-age, it is likely that wage growth will keep pace with
productivity growth in the future. Moreover, ongoing WTO commitments may deliver further
productivity gains in traded sectors, especially in agriculture, as domestic markets are
increasingly expected to compete internationally or perish. If these trade-related productivity
gains dominate China’s pattern of growth then, in combination with tightening labour markets,
Balassa-Samuelson appreciations could start to materialise.
The Nominal Exchange Rate Regime and Capital Controls
The exchange rate reforms launched by the Chinese authorities in July 2005 were intended to at
least demonstrate a departure from the de facto fixed US$ peg, nominally allowing the currency
to fluctuate by up to 0.3 per cent per day. However, these reforms have had a limited impact so
far, yielding a cumulative bilateral appreciation of about six per cent by May 2007. The
smallness of this appreciation is due to the flatness of the path of the underlying bilateral real
exchange rate (Figure 1). As the previous section showed, this flatness could have many
explanations. High levels of inward FDI and strong industrial productivity growth are both
appreciating forces, while potentially offsetting forces include the “demographic dividend” and
the associated elasticity of labour supply, trade reform, skill acquisition and services productivity
14 They note that by 2003, there was a shortage of migrant workers in the Pearl River Delta region, a phenomenon that has since spread to the Yangtze River Delta region and even to some central provinces, such as Jiangxi, Anhui and Henan, which are usually the source of migrants, not the destination.
10
growth. Notwithstanding China’s high rate of inward FDI, the past decade has seen net outflows
on its combined financial and capital accounts (hereafter referred to simply as “the capital
account”) and associated current account surpluses. These net outflows represent an excess of
domestic saving over investment.
To see this, note that the equality of net flows on the capital account to the investment-
saving gap follows from the standard aggregate expenditure and disposal identities.15 Defining
net inflows as positive, the result can be written as:
(6) , NF DKA S R I S= −∆ = −
where I is investment, SNF (net foreign saving) is net private inflow on the financial account and
R∆ is the annual addition to official foreign reserves. In the presence of capital controls SNF is
roughly equal to inward FDI. Both sides of the equation are negative in the case of China,
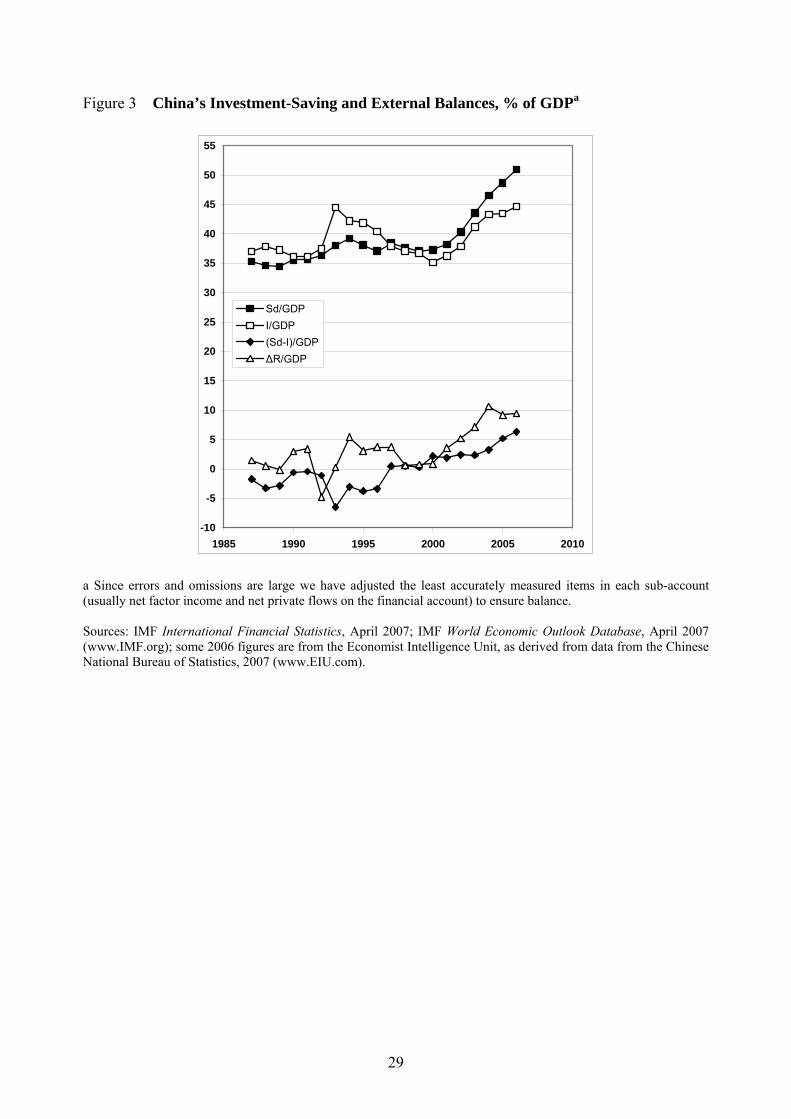
indicating net outflows. As shown in Figure 3 these net outflows have expanded since the mid
1990s, particularly since 2004. Extraordinarily, even though investment accounts for 45 per cent
of China’s GDP, more than half of its GDP is saved.
It would therefore appear that a key to the puzzle as to why China’s real exchange rate has
not appreciated in the Balassa-Samuelson manner is its very high total saving rate. Some external
commentators bemoan the dearth of consumption and advocate its stimulus (Bernanke, 2006).
Expressing a widely held view outside China Lardy (2006, p. 85) argues that: ‘As the world’s
second largest surplus country, China must allow its currency to appreciate against the dollar and
it must take steps to allow a transition to a growth path driven more by domestic consumption
than by further increases in its external surplus’. Since the gross outflows on its capital account
take the form of reserve accumulation, China, in combination with other Asian economies that
are also raising reserves, has been accused of “monetary mercantilism” (Aizenman and Lee
15 The right hand side of this identity stems from the combination of aggregate expenditure on GDP, Y = C + I + G + X + M, the fact that GNP is YN = Y + N, where N is net factor income from abroad, the GNP disposal identity, YN = C + T + S, and the balance of payments BoP = 0 = KA + CA, where the current account is CA = X – M + N.
11
2006). It is implied that reserve accumulation is chosen freely in order to keep the real exchange
rate low. That this is unfair criticism is evident from the identities. By definition, from (6) we
have D NFR S I S∆ = − + . This indicates that, so long as total domestic saving exceeds investment
and capital controls prevent the matching of inward FDI by private outflows, ∆R must be
positive. The monetary mercantilist critique of the rate of reserve accumulation would therefore
be better directed at the high saving rate and the capital controls.
Prasad et al. (2005) posit that, with persistent external political pressure for real exchange
rate appreciation, it would be better to let this happen by allowing the nominal exchange rate to
appreciate rather than through domestic inflation, and they describe in detail how greater
exchange rate flexibility would pave the way for capital account liberalisation. This raises two
issues. First, are there non-mercantilist reasons why China has resisted the pressure to make the
RMB significantly more flexible even while its financial sector is being reformed, and second,
what would be the effects of the reforms (combined with the removal of capital controls) on the
real exchange rate and the RMB?
Consider whether it is reasonable to expect increased exchange rate flexibility prior to the
uptake of the reforms essential to financial and capital account liberalisation. The reason the
PBC sterilises US$ inflows net of import costs is because, short of these reforms, there is no
private market on which those large volumes of US$ can be exchanged for RMB. Hitherto,
China’s banking system has lacked derivative markets for currency and debt instruments to do the
necessary hedging and it is not sufficiently distant from decades of soft budget constraints
associated with the channelling of government subsidies to state owned enterprises through
accumulated debt. This has necessitated the placing of the PBC’s US$ receipts abroad. And, to
avoid excess liquidity, these placements have been sterilised. As shown in Figure 4, however,
holdings of domestic credit have been insufficient to sterilise this flow on the asset side of the
balance sheet, so “sterilisation bonds” have been issued on the debit side. Just as the reserves
12
have come to dominate the asset side of the balance sheet, sterilisation bonds have assumed
significance on the debit side. In effect, the PBC has acted as a conduit for domestic savers who
might otherwise acquire foreign assets but are restricted from doing so by capital controls. The
current pressure from abroad to revalue therefore places the PBC in a difficult position. Since the
PBC’s assets are primarily in US$ and its liabilities in RMB, too prompt an appreciation of the
RMB would result in substantial losses that would need to be covered in RMB from the
government budget. This suggests that a larger role for the nominal exchange rate must await the
fruits of ongoing financial reforms and capital market deepening.16
Second, when capital controls are eventually relaxed and the RMB becomes fully
convertible, it is not guaranteed that an appreciation will result. While the majority of recent
scholarly research finds the RMB to be undervalued, a number of studies do not.17 Prasad et al.
(2005) point to the potential for depreciation following the gradual liberalisation of the capital
account, which could lead to net outflows as domestic investors seek to diversify their portfolios.
Moreover, there is already substantial evidence of informal private outflows from China (Prasad
and Wei, 2005), which would be expected to expand if legalised, placing further downward
pressure on the real exchange rate.18 In addition, the recent surge in speculative inflows in
anticipation of appreciation is likely to be temporary and could easily be reversed.19
The eventual establishment of a complete and stable private market for the RMB will
have two effects. First, a more flexible exchange rate will allow the PBC to follow the practice of
16 In the meantime, the approach being taken by the Chinese government to the control “external imbalances” focuses on the rate of economic expansion. Growth is constrained by control over land releases and liquidity, the latter through limits on based money growth, aided by sterilisation bonds as Figure 4 indicates. Other policies serving this purpose include reductions in export facilitation (in the rate of reimbursement of some export taxes) and, at least in prospect, the reduction of import tariffs on some luxury products. Financial reforms are proceeding quickly, however, so that some increased exchange rate flexibility is being offered by the PBC, as suggested by the extension of the daily RMB US$ rate fluctuation bounds from 0.3% to 0.5% as of late May. 17 See Frankel (2004), who finds that the RMB was undervalued by 36% in 2000, Goldstein (2004), who claim it was undervalued by 15-30% in 2004 and Coudert and Couharde (2005), who find the undervaluation to be larger. See Dunaway and Li (2005) for a survey, including one that finds overvaluation (Wang, 2004, 2005). Tyers et al. (2007) use a structural model to find evidence of undervaluation in the mid to late 1990s but offer no clear finding for 2004. 18 Further evidence of large sums of capital flight out of China is offered by Sicular (1998) and Gunter (2004). 19 According to Fan (2006), speculative inflows were as high as USD 105 billion in 2004. See also Prasad and Wei (2005).
13
central banks abroad and focus on the control of inflation. This means that the forces underlying
real exchange rate dynamics will also determine the path of the nominal exchange rate. Second,
the accumulation of official foreign reserves can abate, to be replaced by private outflows. Yet,
at least in the short run, whether this will cause an appreciation (nominal or real) depends on
whether the PBC’s reserves are the equivalent of the private sector’s desired foreign holdings. If
the net effect of the capital controls (with reserve accumulation replacing private outflows) is to
have restricted the scale of the China’s collective foreign holdings then, depending on the PBC’s
response, liberalisation will raise outflows and, at least temporarily, depreciate the real exchange
rate. If, on the other hand, the reserves are larger than the foreign holdings that would otherwise
be chosen by the private market, then liberalisation would result in net inflows and a real
appreciation.20
A further determinant of the direction of any change in external flows is perceived risk.
The two key determinants of investment are the anticipated rate of return on installed capital, net
of depreciation, on which the investment volume depends positively, and the real cost of funds
(the real borrowing rate), on which it depends negatively. Although these might be expected to
converge on common values in a steady state, this is rare in practice. In developing countries,
there are interest premia that drive both above the corresponding levels in the industrialised
world. Indicative of this premium for the case of China is the spread between its domestic bond
yields and those of US Treasury bonds, which has held at about 40 per cent during the last
decade. These “interest premia” have two components: a risk-free component, due in China’s
case to the financial market segmentation that will be relaxed with liberalisation, and a risk
premium that compensates investors for exchange rate risk, information asymmetries, and
perceived risks of expropriation. Changes in the stability of the Chinese economy or of its
20 In separate work by the authors the foreign asset share of China’s collective portfolio is estimated to be lower than average for countries of its size and development level, its substantial reserves notwithstanding. This suggests the former outcome is the more likely.
14
politics will greatly influence this risk component, casting further uncertainty over the short run
path of financial flows.21
Modelling the Determinants of China’s Real Exchange Rate
Here we examine quantitatively the relationship between shocks associated with China’s
economic growth and its real exchange rate. To do this effectively a numerical model is required
that is global in scope and that incorporates the generalisations of the Balassa-Samuelson
assumptions discussed above. Recall that these included a means to allow productivity growth in
non-tradable as well as tradable sectors, departures from the law of one price for tradable goods, a
more sophisticated representation of the labour market and an open capital account. With these
generalisations, almost all shocks to the economy have implications for the real exchange rate.
We use a model that offers these generalisations. Adapted from Tyers and Shi (2007a, b),
it is a multi-region, multi-product dynamic simulation model of the world economy.22 In the
version used, the world is subdivided into the 14 regions indicated in Table 4. Industries are
aggregated into three sectors: food (including processed foods), industry (mining and
manufacturing) and services (including construction), the latter being little traded by comparison
with the other two. Failures of the law of one price are represented by product differentiation, so
that consumers substitute imperfectly between products from different regions. As in other
dynamic models of the global economy, the endogenous component of simulated economic
growth is physical capital accumulation. Technical change is introduced in the form of
exogenous productivity growth that is sector and factor specific, allowing the analysis of
productivity performance that differs between tradable and non-tradable sectors. Consistent with
the results indicated in Table 1, baseline productivity in the “food” sector is assumed to grow
21 Tyers and Golley (2006) use measures of China’s investment premium to explore the implications of financial reform. Their modelling approach underlies the results presented in the remainder of the paper. 22 The model has its origins in GTAP-Dynamic, the standard version of which is a derivative of its comparative static progenitor, GTAP (Hertel, 1997). Its dynamics are described by Ianchovichina and McDougall (2000).
15
more rapidly than that in the other sectors in China. This allows continued shedding of labour to
those sectors.23 In general, baseline productivity growth rates in services are modelled as lower
than in the tradable goods sectors in all regions.
All regional capital accounts are open and investors have adaptive expectations about real
regional net rates of return on installed capital. In each region the level of investment is
determined by a comparison of expected net rates of return on domestic installed capital with
borrowing rates yielded by a global trust, to which each region’s saving contributes, adjusted by
calibrated region-specific interest premia. Lagged adjustment processes ensure, however, that
financial capital is not fully mobile internationally in the short run but that the paths of domestic
and global interest rates become parallel, separated only by exogenous premia, in the long run. In
representing China, however, one caveat is that no explicit control is imposed on the outflow of
private financial capital. General financial reform is represented by a diminution of the interest
premium and this causes an unambiguous influx of financial capital to China.
To augment the model’s characterisation of changes in labour supply and quality it
encompasses both demographic and economic change. It tracks populations in four age groups,
two genders and two skill categories: a total of 16 population groups in each of the 14 regions.
The skill subdivision is between production labour (unskilled) and professional labour (skilled).24
Each age-gender-skill group is represented as a homogeneous sub-population with a group-
specific birth and death rate, labour force participation rate and rates of both immigration and
emigration. By thus capturing the effects of China’s low fertility, the model projects the reversal
of its labour supply trend, as indicated in Figure 5. The implication of this for the real exchange
rate is that a labour force that is growing faster than those of trading partner countries, other
23 Wang and Ding (2006) have recently estimated that there are 40 million surplus workers in China’s agricultural sector. While underemployment is not explicit in our model, the assumption of high labour productivity growth in agriculture implies that agriculture is capable of shedding labour more quickly than in other sectors. This essentially mimics the surplus labour problem, which is thereby accounted for implicitly. 24 The subdivision between production workers and professionals and paraprofessionals accords with the ILO’s occupation-based classification and is consistent with the labour division adopted in the GTAP Database. See Liu et al. (1998).
16
things equal, lowers costs and depreciates the real exchange rate. A relative decline in the labour
supply would be expected to have the reverse effect.
For the Balassa-Samuelson hypothesis, the key is the difference between the
performances of traded and non-traded sectors. To the extent that their labour intensities differ,
labour supply trends make a difference. As it turns out, however, trends in skill composition are
more important. These depend on the rate at which each region’s education and social
development institutions transform unskilled (production worker) families into skilled
(professional worker) families. Each year a particular proportion of the population in each
production worker age-gender group is transferred to professional status. The initial values of
these proportions depend on the regions’ levels of development, the associated capacities of their
education systems and the relative sizes of their production and professional labour forces. Initial
rates of transformation, based on changes during the decade prior to the base year, 1997, are
listed in Table 5. They change through time with real per capita income and the level of the
skilled wage premium. China’s skill share is projected to rise through time while that in North
America remains static. The contrast is due to North America’s higher initial skill share, its high
rate of unskilled immigration and its higher fertility rate.
The 16 age-gender-skill groups differ in their shares of regional disposable incomes,
consumption preferences, saving rates and labour supply behaviour. While the consumption-
savings choice differs for each group, it is dependent for all on group-specific real per capita
disposable income and the real lending rate. Governments are assumed to balance their budgets
while saving and borrowing are undertaken by the private sector. The baseline scenario is a
“business as usual” projection of the global economy through 2030. In part because of its
comparatively young population and hence its continuing rapid labour force growth, India attracts
substantial new investment and is projected to take over from China as the world’s most rapidly
expanding region. Comparatively rapid population growth detracts from India’s long term real
17
per capita income performance, however. By this criterion, China is the strongest performing
region through the three decades.
Growth Shocks and China’s Real Exchange Rate
Our focus is on shocks that enhance the rate of GDP growth, for which we draw on Tyers et al.
(2006). These include once and for all productivity increases, skill transformation rate increases,
birth rate increases, interest premium decreases, tariff decreases (increases in openness) and, less
certainly as to direction, average saving rate decreases. In each case we run a new simulation in
which the determinant in question is shocked once-and-for-all, as of 2005. We then extract the
elasticity of China’s real exchange rate to each shock, tracking the values through time to 2030.
We focus on the bilateral real exchange rate, measured as in equation (1), against the region
“North America”, since this best parallels China’s nominal exchange rate policy and the RMB
valuation debate.
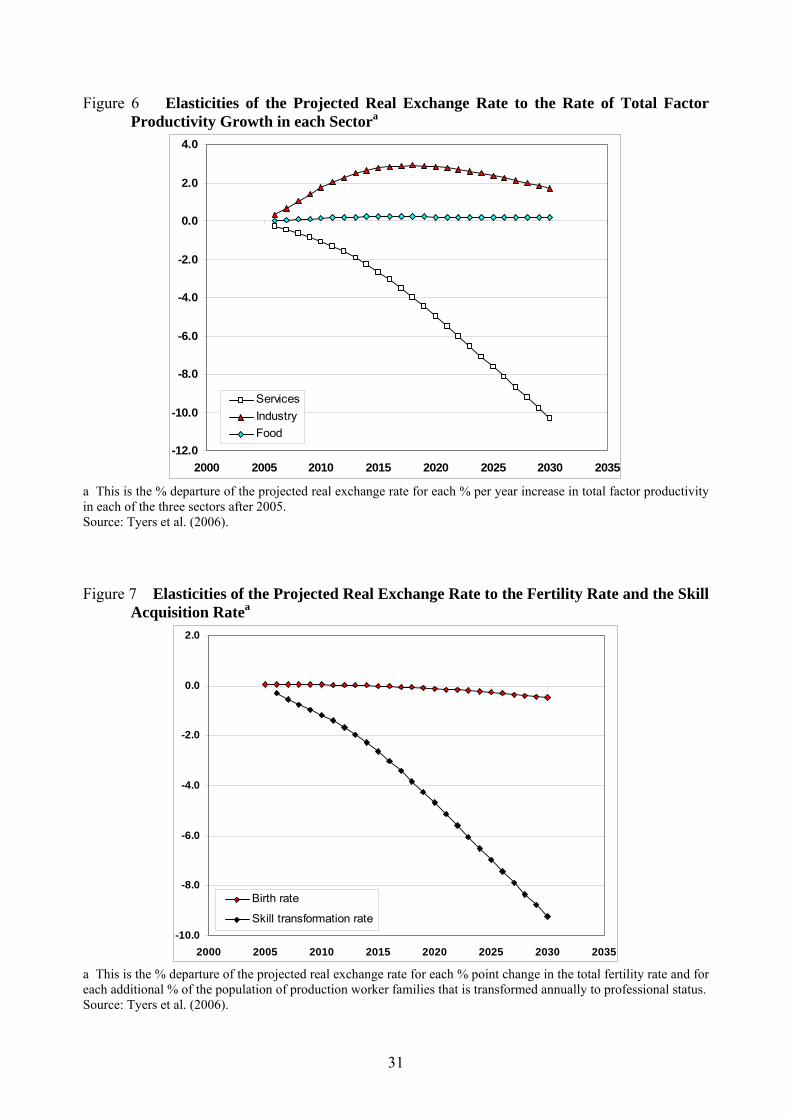
Productivity growth increase
We first shock total factor productivity separately in each sector. The elasticity is the per cent
departure of the projected real exchange rate or growth rate for each per cent per year increase in
total factor productivity. The overall rate of economic growth proves to be quite sensitive to such
productivity shocks since the larger these are for a particular region the larger is that region’s
marginal product of capital. The region therefore enjoys higher levels of investment and hence a
double boost to its growth rate. As indicated in Figure 6, productivity growth in both tradable
sectors yields real appreciations but “industry” is by far the greater contributor to China’s trade
and therefore the most significant for the real exchange rate. The appreciating effects of tradable
productivity increases are consistent with the Balassa-Samuelson hypothesis and are, as expected,
due to wage growth and relative service price inflation. They are bolstered in the short run by
18
increased investment and hence greater net inflows on the capital account. In the long run,
however, the enlargement of the capital stock reduces costs and hence offsets the real exchange
rate gains. Also, as expected from the dominance of non-traded sector prices in equation (2),
faster service productivity growth depreciates the real exchange rate, modestly in the early years
but to a dominant extent in the long run when it is reinforced by associated capital accumulation.
If productivity is boosted equiproportionally in all sectors, the net effect is a small real
appreciation in the short run and a substantial real depreciation in the long run. The Balassa-
Samuelson effect is dominant in the short run but is overwhelmed by services productivity in the
long run. The short run net appreciation is bolstered by the associated rise in capital returns and
hence the attraction of increased investment from abroad. Beyond a decade, as costs are reduced
by the across-the-board rise in productivity, combined with the associated capital expansion, the
elasticity turns negative and very quickly expands in that direction. The particular strength of
changes in service productivity is notable, suggesting that the forecasting of real exchange rates
depends importantly on this difficult-to-measure behaviour. Indeed, if our productivity estimates
in Table 1 are correct, recent differences between China’s productivity performance in the
tradable and service sectors are not large. This suggests that, if China’s future growth is driven
increasingly by services productivity improvements, its real exchange rate could continue on a
depreciating trend.
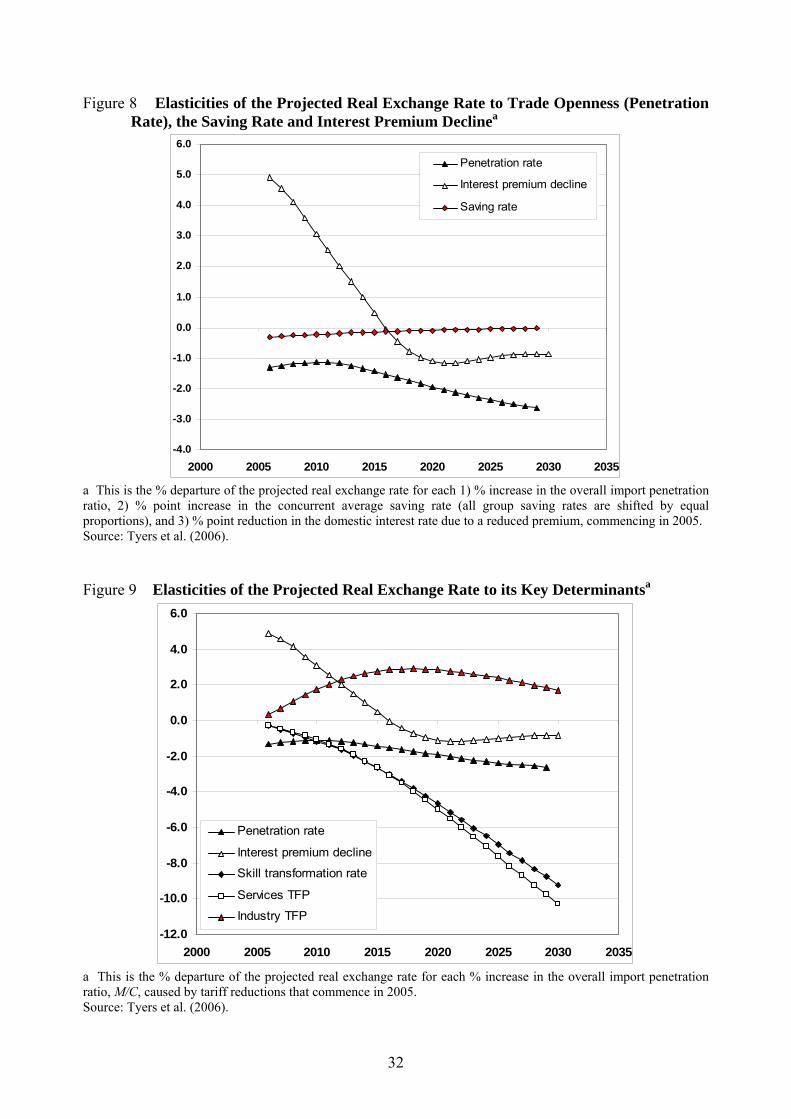
Skill acquisition rate increase
When the skill acquisition rate is increased in developing regions like China, where the unskilled
(or production) worker population is larger than its skilled (or professional) counterpart, the
proportional boost to skilled workers is larger than the proportional loss of unskilled workers.
The result is greater output and, other things equal, a real depreciation. This tendency is
enhanced, however, by the fact that the services sector is comparatively intensive in skill, so that
19
the shock causes a relatively large boost to service output and hence a relatively large fall in the
service price. The result is a strong responsiveness of GDP growth to skill acquisition and a
relatively large real depreciation. The elasticities in this case are per cent departures of the
growth rate and real exchange rate for each per cent of the population in production worker
families that is transformed each year. As Figure 7 shows, defined this way, skill transformation
places downward pressure on the real exchange rate of magnitude similar to total factor
productivity in services.
Birth rate increase
The birth rate affects the real exchange rate by raising the population (initially) and the labour
force (subsequently). The initial effect is to raise aggregate demand but not to contribute to
supply since income is redistributed to the non-saving and non-working young. Net inflows on
the capital account rise and the real exchange rate appreciates. In the long run, when the
increased birth rate yields a larger workforce, the supply effects predominate. Wage costs are
lower and the real exchange rate declines. It is somewhat surprising that the elasticity of the real
exchange rate to the birth rate, shown in Figure 7, is so small. The results suggest that China’s
birth rate, and hence its low fertility, will be only a modest contributor to the future of its real
exchange rate.
Interest premium decline
In the short run, the decline in China’s interest premium results in net capital inflows, which
raises investment and therefore increases aggregate demand and the real exchange rate. A
positive demand-driven effect is therefore expected in the first instance. In the long run,
however, when the effect of the investment on the capital stock is realised, the supply side
dominates. More abundant and hence cheaper capital reduces production costs, yielding a real
20
depreciation. As Shown in Figure 8, the elasticity to premium decline is large and positive in the
short run with the lag to the switch in sign at least 15 years. This simulation helps to explain the
lack of appreciation of the real exchange rate to date: because of the net capital outflows since
the mid-1990s, the effect has been to apply downward pressure on China’s real exchange rate.
While domestic savings continues to dominate investment, their substantial short-run
depreciating effect will continue to offset the short-run (Balassa-Samuelson) appreciating effect
of productivity changes shown in Figure 6.
Saving rate increase
Here, although saving by each age-gender-skill group is endogenous, we shift the underlying
curves to achieve a small, once and for all increment to the average saving rate. This switches
demand from consumption to financial capital. It therefore decreases the demand for home goods
along with the net inflows on the capital account, so that the real exchange rate depreciates.
Because financial capital is not perfectly mobile internationally in the short run, the increased
supply of domestic savings reduces the Chinese interest rate relative to the global one, and so it
raises investment, offsetting the tendency for increased net outflows to cause an initial real
depreciation. In the long run, however, the international mobility of financial capital restores
home capital market conditions and the net effect on the real exchange rate approaches
negligibility. The magnitude of the savings effect is small, as shown in Figure 8. This is
surprising given the large short run effect of reducing the interest premium. The reason is that the
decline in the interest premium substantially reduces the home interest rate, stimulating
investment without significant offset from changes in savings, and it permanently changes the
relative attractiveness of China as a location for investment. When only the saving rate is
changed, the short-run effect is also to reduce the home interest rate, but this induces additional
investment which offsets the effect of the savings change on capital account flows.
21
Trade liberalisation
Trade liberalisation switches demand away from home-produced goods and services toward
imported varieties. For a single region, the supply of goods and services from the much larger
foreign market is more elastic than that of home varieties, constrained as they are by local factor
supplies and technology. The effect of the demand switch, then, is to reduce the relative prices of
the home varieties and hence to depreciate the real exchange rate. The elasticity of openness is
constructed by dividing the per cent change in the real exchange rate by the percentage point
change in the overall import penetration ratio (the ratio of the value of imports to the total value
of domestic consumption). The shock on which it is based is a phased removal of all China’s
merchandise trade barriers over five years.25 The elasticity, also shown in Figure 8, has the
expected negative sign, and its magnitude grows through time. The latter decline occurs because
of the concentration of China’s merchandise protection in capital intensive industries. Although
the effects on GDP are positive, lower home product prices in these industries reduce average
home capital returns and hence reduce investment and capital growth, enlarging the negative
elasticity through time.
Conclusion
While the Balassa Samuelson hypothesis is borne out for China, in that productivity has
apparently grown faster in the tradable than in the non-tradable sectors and there has been relative
service price inflation, the effect of this on the real exchange rate has been counteracted by other
factors. Dominant among these must be the relative rise of China’s total saving rate and the
associated persistence of net outflows on its capital account. Other depreciating forces are likely
to have contributed, however. These include, in various magnitudes, the “demographic dividend”
25 The elasticity is insensitive to the scale of the liberalisation though not to the composition of China’s protection. For the levels of protection embodied in the database for 1997 see Dimaranan and McDougall (2002).
22
and the associated elasticity of labour supply, trade reform, skill acquisition and services
productivity growth. Much attention is paid in the literature, however, to China’s monetary
policy and, in particular, to the PBC’s accumulation of foreign exchange reserves. In our view
the PBC’s monetary stance – embodying as it does the objective of exchange rate stability – is
necessitated by financial immaturity. Yet, while ever China’s saving exceeds its investment, the
reserves and capital controls merely alter the public/private composition of external flows but
need not significantly affect their magnitudes. Indeed, it is possible that the future removal of
China’s capital controls could see accelerated outflows as Chinese institutions seek to enlarge
their private holdings of foreign assets. Depending on the PBC’s response, the short-run effect of
this could be further downward pressure on the real exchange rate.
To examine the effects of the full variety of growth-related shocks on the real exchange
rate in the future, we turned to a dynamic model of the global economy. A baseline “business as
usual” simulation is constructed to 2030, wherein China’s growth rate slows due to aging and
slower labour force growth. The principal determinants of China’s economic growth are then
shocked separately and their independent effects on the real exchange rate observed over time.
Sectoral total factor productivity is raised, the rate of skill acquisition by the workforce is
reforms further open the economy and the average saving rate is raised. In each case an elasticity
of the real exchange rate to the original shock is charted, as summarised in Figure 9.
The results suggest that, while population policy affects the real exchange rate in the
directions expected, demographic change is not a strong determinant, at least within the three
decades examined. In the short run, the key determinant is net financial capital influx, which
appreciates the real exchange rate, or efflux, which depreciates it. In the medium term, scope
does emerge for Balassa-Samuelson real appreciation, if services lag sufficiently behind
industrial productivity. In the long run, however, because services are skill-intensive on average,
23
their performance is bolstered by both productivity improvements and skill-acquisition and the
sensitivity of the real exchange rate to these effects is so large as to make them dominant. Since
Chinese productivity growth has been higher than that of its trading partners for more than a
decade, and considerable scope remains for productivity catch-up in services, these long run
forces might be expected to bear down on the real exchange rate in future. If, instead, service
sector productivity growth continues to be comparatively weak then real appreciations could also
occur. It is difficult to ignore the fact, however, that the majority of the growth-related shocks
examined, including overall (and particularly services) productivity growth, professional training
and further trade reform, all cause the real exchange rate to depreciate in the long run.
Fundamentally, whichever productivity pattern dominates, the future path of the real
exchange rate will depend most on the continuation of short run shocks to aggregate demand due
to net flows on the capital account and hence on the future path of China’s domestic saving
relative to its investment. It is difficult to imagine increases in its saving rate beyond those
already recorded. Eventually, it must fall. When it does net flows on the capital account are
likely to be reversed, resulting in an appreciating force. The long run outcome will then depend
on the battle between this force and the net depreciating effects of continued skill acquisition and
productivity growth.
24
References Aizenman, J. and J. Lee, 2006. ‘Financial versus monetary mercantilism: long run view of large
international reserves hoarding’, IMF Working Paper WP/06/280, Washington DC, December.
Balassa, B., 1964. ‘The purchasing power parity doctrine: a reappraisal’, Journal of Political Economy, 72(6): 584-596.
Bergin, P.R., R. Glick and A.M. Taylor, 2006. ‘Productivity, tradability and the long run price puzzle’, Journal of Monetary Economics, 53(8): 2041-2066, November.
Bergin, P.R., R. Glick and A.M. Taylor, 2006. ‘Productivity, tradability and the long run price puzzle’, Journal of Monetary Economics, 53(8): 2041-2066, November.
Bernanke, B. (2006), Speech to the Chinese Academy of Social Sciences, Beijing, Friday 15 December, www.federalreserve.gov/BoardDocs/Speeches/2006/20061215.
Bloom, D.E. and J.G. Williamson, 1998. ‘Demographic transitions and economic miracles in emerging Asia’, World Bank Economic Review 12(3): 419-455.
Cai Fang and D. Wang (2005) ‘Demographic transition: implications for growth’ in R. Garnaut and L. Song, eds, The China Boom and its Discontents, Asia-Pacific Press, Canberra.
_______ (2006), ‘Employment growth, labour scarcity and the nature of China’s trade expansion’, in Garnaut, Ross and Ligang Song (editors), The Turning Point in China’s Economic Development, Asia Pacific Press, Canberra.
Chang, J. and R. Tyers, 2003. ‘Trade reform, macroeconomic policy and sectoral labour movement in China’, Chapter 14 in Garnaut, R. and L. Song (eds.) China 2003: New Engine for Growth, Asia Pacific Press.
Choudhri, E.U. and M.S. Khan, 2004. ‘Real exchange rates in developing countries: are Balassa-Samuelson effects present?’ IMF Working Paper No WP/04/188, Washington DC, October.
Coudert, V. and C. Couharde, 2005. ‘Real equilibrium exchange rate in China”, Working Paper No. 2005-01, CEPII, Paris.
Crucini, M.J., C.I. Telmer and M. Zachariadis. 2005. ‘Understanding European real exchange rates’, American Economic Review, 95(3): 724-738.
Dimaranan, B.V. and R.A. McDougall, 2002. Global Trade, Assistance and Production: The GTAP 5 Data Base, Center for Global Trade Analysis, Purdue University, May.
Dixon P.B., B.R. Parmenter, J. Sutton and D.P. Vincent, 1982. ORANI, a Multi-Sectoral Model of the Australian Economy, Amsterdam: North Holland.
Dixon, P.B. and M.T. Rimmer, 2002. Dynamic General Equilibrium Modelling for Forecasting and Policy: A Practical Guide and Documentation of Monash, Amsterdam: North Holland.
Drine, I. and Rault, 2005. ‘Can the Balassa-Samuelson theory explain long run real exchange rate movements in OECD countries? Applied Financial Economics, 15(8): 519-530.
Dunaway, S. and X. Li, 2005. ‘Estimating China’s “equilibrium” real exchange rate’, IMF Policy Discussion Paper, 05/202, Washington DC.
Fan, Gang, 2006. ‘Global imbalance, China and the international currency system’, in Garnaut, Ross and Ligang Song (eds), The Turning Point in China’s Economic Development, Asia Pacific Press, Canberra.
Fogel, Robert, 2006. ‘Why is China likely to achieve its growth objectives?’ NBER Working Paper W12122.
Frankel, J., 2004. ‘On the Renminbi: the choice between adjustment under a fixed exchange rate and adjustment under a flexible rate’, NBER Working Paper 11274, Cambridge MA: The National Bureau of Economic Research.
25
Golley, J. and R. Tyers, 2006. ‘China’s Growth to 2030: Demographic Change and the Labour Supply Constraint’, in Garnaut, R. and L. Song (eds.), The Turning Point in China’s Economic Development, Asia-Pacific Press, September; version in Chinese forthcoming in Chinese Labor Economics.
Goldstein, Morris, 2004. ‘Adjusting China’s Foreign Exchange rate’, revised version of a paper delivered at the IMF’s seminar on China’s Foreign Exchange Rate System, Dalian, China 26-27 May, available at www.iie.com, accessed September 2006.
Gunter, Frank, 2004. ‘Capital Flight from China: 1984-2001’, China Economic Review, 15: 63-85.
Hertel, T.W. (ed.), 1997. Global Trade Analysis Using the GTAP Model, New York: Cambridge University Press, http://www.agecon.purdue.edu/gtap.
Ianchovichina, E. and R. McDougall, 2000. ‘Theoretical structure of Dynamic GTAP’, GTAP Technical Paper No.17, Purdue University, http://www.agecon.purdue.edu/gtap/GTAP-Dyn.
Lardy, N., 2006, ‘China’s interaction with the global economy’, in Garnaut, Ross and Ligang Song (eds.), The Turning Point in China’s Economic Development, Asia Pacific Press, Canberra.
Liu, J. N. Van Leeuwen, T.T. Vo, R. Tyers, and T.W. Hertel, 1998. ‘Disaggregating Labor Payments by Skill Level in GTAP’, Technical Paper No.11, Center for Global Trade Analysis, Department of Agricultural Economics, Purdue University, West Lafayette, September.
Lu Feng, 2006. ‘China’s productivity growth, an international comparison’, China Center for Economic Research Working Paper C200604, Peking University, Beijing, April (in Chinese).
Ma, Y., 2006. ‘A comparative study of the competitiveness of the domestic and foreign-invested service industries in China’, Centre for Public Policy Studies Working Paper No. 176, Lingnan University, Hong Kong, December; presented at the ACE International Conference, APEC Studies Centre, City University of Hong Kong, 18-20 December 2006.
McKibbin, W.J. and J. Sachs, 1991, Global Linkages: Macroeconomic Independence and Cooperation in the World Economy, Brooking Institution.
Miyajima, K., 2005. ‘Real exchange rates in growing economies: how strong is the role of the nontradables sector’, IMF Working Paper 05/233, Washington DC.
Prasad, E., T. Rumbaugh and Q. Wang, 2005. ‘Putting the cart before the horse: capital account liberalization and the exchange rate in China’, IMF Policy Discussion Paper 05/01, Washington DC.
Prasad, E. and S.J. Wei, 2005. ‘The Chinese approach to capital inflows: patterns and possible explanations’ IMF Working Paper WP/05/79, Washington DC, April.
Rodrik, Dani, 2006. ‘What’s so special about Chinese exports?’ NBER Working Paper No. 11947, January.
Samuelson, P., 1964. ‘Theoretical notes on trade problems’, Review of Economics and Statistics, 46(2):145-154.
Sicular, Terry, 1998. ‘Capital Flight and Foreign Investment: Two tales from China and Russia’, The World Economy 21(5):589-602.
Tyers, Y. Bu and I. Bain, 2007. ‘China’s equilibrium exchange rate: a counterfactual analysis’, Pacific Economic Review, forthcoming October.
_______ J. Golley, Y. Bu and I. Bain, 2006. ‘China’s economic growth and its real exchange rate’, Working Papers in Economics and Econometrics No. 476 Australian National University, November, presented at the All China Economics International Conference, City University of Hong Kong, 18-20 December.
______ and J. Golley, 2006. ‘China’s growth to 2030: the roles of demographic change and investment premia’, presented at the conference on WTO, China and the Asian Economies IV: Economic Integration and Development, University of International Business and Economics, Beijing, China, 24-25 June 2006; Working Papers in Economics and Econometrics No. 461, Australian National University, Canberra.
______ and Q. Shi (2007a), “Global demographic change, policy responses and their economic implications”; The World Economy 30(4), forthcoming, April.
______ and Q. Shi (2007b), “Global demographic change, labour force growth and economic performance”, Working Papers in Economics and Econometrics No. 462, Australian National University, Canberra; forthcoming in Ianchovichina, E., R. McDougall and T. Walmsley, Global Economic Analysis: Dynamic Modelling and Applications, Cambridge University Press.
Wang Jiangui and Ding Shouhai, 2006. ‘A re-estimation of China’s agricultural surplus labour – the demonstration and modification of three prevalent methods’, Frontiers of Economics in China, Vol. 1, No. 2: 171-181.
Wang, T., 2004. ‘Exchange rate dynamics’, in E. Prasad (ed.), China’s Growth and Integration into the World Economy: Prospects and Challenges, IMF Occasional Paper 232, Washington DC.
_______ 2005. ‘Sources of real exchange rate fluctuations in China’, Journal of Comparative Economics, 33(4): 753-771.
27
Figure 1 Asian Real Exchange Rates against the USa
0.0
0.2
0.4
0.6
0.8
1.0
1.2
1.4
1.6
1.8
2.0
1980 1985 1990 1995 2000 2005
KoreaJapanChinaTaiwan
0.0
0.2
0.4
0.6
0.8
1.0
1.2
1.4
1990 1995 2000 2005
KoreaChinaTaiwan
a. These are indices of nominal bilateral rates deflated according to / US
R Y Ye E P P= ⋅ , where E is the nominal exchange rate in US$ per unit of local currency, is the local GDP price and is the corresponding US GDP price.
YP USYP
Figure 2 Chinese Sectoral Price Indices, 1979-2005a
a These are sectoral price indices implied by data from the China Statistical Abstract (2006). “Primary industry” is mainly agriculture, “secondary industry” is primarily manufacturing and construction and “tertiary industry” is other services.
28
Figure 3 China’s Investment-Saving and External Balances, % of GDPa
-10
-5
0
5
10
15
20
25
30
35
40
45
50
55
1985 1990 1995 2000 2005 2010
Sd/GDPI/GDP(Sd-I)/GDP∆R/GDP
a Since errors and omissions are large we have adjusted the least accurately measured items in each sub-account (usually net factor income and net private flows on the financial account) to ensure balance. Sources: IMF International Financial Statistics, April 2007; IMF World Economic Outlook Database, April 2007 (www.IMF.org); some 2006 figures are from the Economist Intelligence Unit, as derived from data from the Chinese National Bureau of Statistics, 2007 (www.EIU.com).
29
Figure 4 The Balance Sheet of the Peoples Bank of China, ca 2006
Assets Liabilities Domestic credit, DC Central bank claims on depository and other financial corporations and on the central government 20 % GDP
The monetary base, MB Currency and bank reserves 37 % GDP
Sterilisation bonds, SB Debt to the Chinese public 14 % GDP
Official foreign reserves, R 41 % GDP
Other liabilities, OL Includes government ownership 10 % GDP
Source: People's Bank of China, Balance Sheet of Monetary Authority, http://www.pbc.gov.cn/diaochatongji/tongjishuju/index2.asp?year=2006.
Figure 5 China’s Projected Population and Labour Forcea
0
1
2
3
4
5
6
7
8
9
10
1995 2000 2005 2010 2015 2020 2025 2030 2035
China population
China labour force
a These are cumulative % departures from the base year 1997, drawn from the baseline simulation in which China’s fertility is projected to decline from 1.9 to 1.5.
30
Figure 6 Elasticities of the Projected Real Exchange Rate to the Rate of Total Factor Productivity Growth in each Sectora
-12.0
-10.0
-8.0
-6.0
-4.0
-2.0
0.0
2.0
4.0
2000 2005 2010 2015 2020 2025 2030 2035
ServicesIndustryFood
a This is the % departure of the projected real exchange rate for each % per year increase in total factor productivity in each of the three sectors after 2005. Source: Tyers et al. (2006). Figure 7 Elasticities of the Projected Real Exchange Rate to the Fertility Rate and the Skill
Acquisition Ratea
-10.0
-8.0
-6.0
-4.0
-2.0
0.0
2.0
2000 2005 2010 2015 2020 2025 2030 2035
Birth rate
Skill transformation rate
a This is the % departure of the projected real exchange rate for each % point change in the total fertility rate and for each additional % of the population of production worker families that is transformed annually to professional status. Source: Tyers et al. (2006).
31
Figure 8 Elasticities of the Projected Real Exchange Rate to Trade Openness (Penetration Rate), the Saving Rate and Interest Premium Declinea
-4.0
-3.0
-2.0
-1.0
0.0
1.0
2.0
3.0
4.0
5.0
6.0
2000 2005 2010 2015 2020 2025 2030 2035
Penetration rate
Interest premium decline
Saving rate
a This is the % departure of the projected real exchange rate for each 1) % increase in the overall import penetration ratio, 2) % point increase in the concurrent average saving rate (all group saving rates are shifted by equal proportions), and 3) % point reduction in the domestic interest rate due to a reduced premium, commencing in 2005. Source: Tyers et al. (2006). Figure 9 Elasticities of the Projected Real Exchange Rate to its Key Determinantsa
-12.0
-10.0
-8.0
-6.0
-4.0
-2.0
0.0
2.0
4.0
6.0
2000 2005 2010 2015 2020 2025 2030 2035
Penetration rate
Interest premium decline
Skill transformation rate
Services TFP
Industry TFP
a This is the % departure of the projected real exchange rate for each % increase in the overall import penetration ratio, M/C, caused by tariff reductions that commence in 2005. Source: Tyers et al. (2006).
32
Table 1 Estimated Chinese Total Factor Productivity Growth by Sector
% per year Whole economy Food Industry Services1986-1989 3.5 1.4 3.8 3.81990-1994 5.0 1.6 7.7 2.31995-1997 5.7 5.5 3.7 3.21998-2001 4.1 -0.2 8.9 -0.52002-2005 6.0 5.4 6.3 4.6
Source: Tyers et al. (2006) Table 2 Regional Composition in the Global model
Region Composition of aggregatesAustraliaNorth America Canada, Mexico, United StatesWestern Europe European Union, including Switzerland and Scandinavia but excluding
the Czech Republic, Hungary and PolandCentral Europe andthe former SovietUnion
Central Europe includes the Czech Republic, Hungary and Poland
JapanChina Includes Hong Kong and TaiwanIndonesiaOther East Asia Republic of Korea, Malaysia, the Philippines, Singapore, Thailand and
VietnamIndiaOther South Asia Bangladesh, Bhutan, Maldives, Nepal, Pakistan and Sri LankaSouth America Argentina, Bolivia, Brazil, Chile, Colombia, Ecuador, Peru, Venezuela,
UruguayMiddle East and NthAfrica
Includes Morocco through the Islamic Republic of Iran
Sub-Saharan Africa The rest of AfricaRest of World Includes the rest of Central America, the rest of Indochina, the small
Island states of the Pacific, Atlantic and Indian Oceans and theMediterranean Sea, Myanmar and Mongolia, New Zealand and theformer Yugoslavia
Source: The GTAP Global Database , Version 5.
33
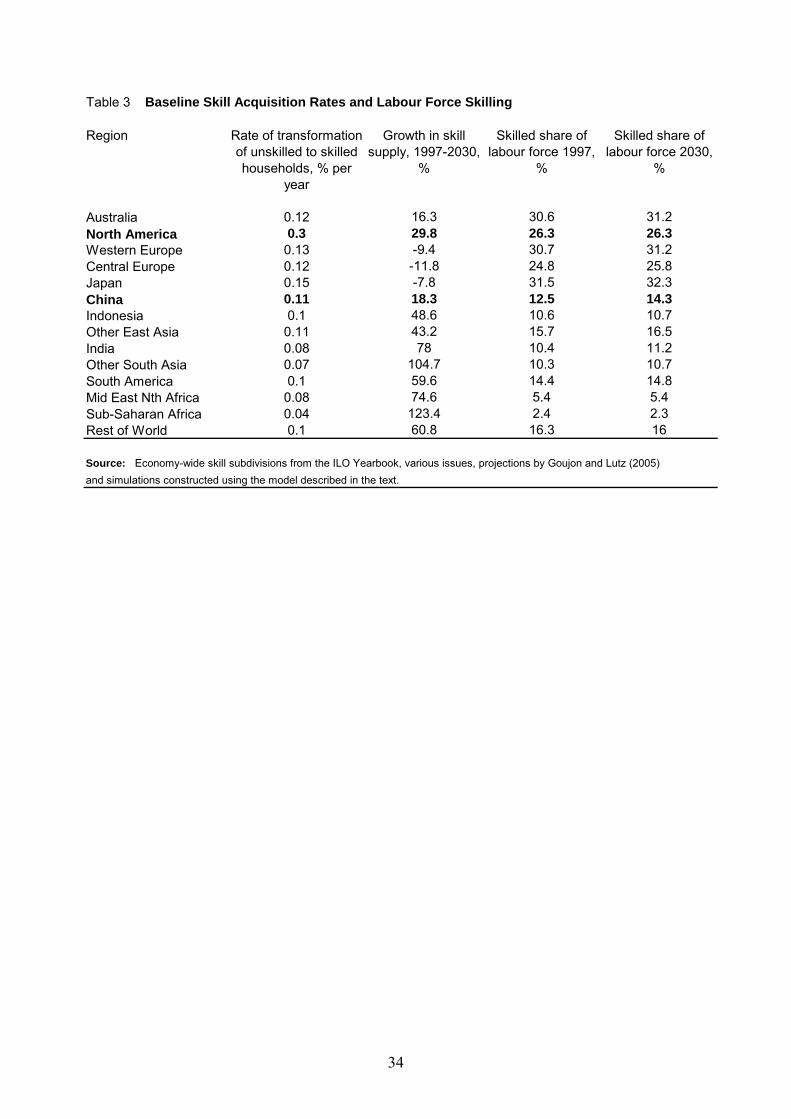
Table 3 Baseline Skill Acquisition Rates and Labour Force Skilling
Region Rate of transformation of unskilled to skilled households, % per
year
Growth in skill supply, 1997-2030,
%
Skilled share of labour force 1997,
%
Skilled share of labour force 2030,
%
Australia 0.12 16.3 30.6 31.2North America 0.3 29.8 26.3 26.3Western Europe 0.13 -9.4 30.7 31.2Central Europe 0.12 -11.8 24.8 25.8Japan 0.15 -7.8 31.5 32.3China 0.11 18.3 12.5 14.3Indonesia 0.1 48.6 10.6 10.7Other East Asia 0.11 43.2 15.7 16.5India 0.08 78 10.4 11.2Other South Asia 0.07 104.7 10.3 10.7South America 0.1 59.6 14.4 14.8Mid East Nth Africa 0.08 74.6 5.4 5.4Sub-Saharan Africa 0.04 123.4 2.4 2.3Rest of World 0.1 60.8 16.3 16
Source: Economy-wide skill subdivisions from the ILO Yearbook, various issues, projections by Goujon and Lutz (2005)and simulations constructed using the model described in the text.