Chlorpyrifos in Surface Waters of Central Valley, California: Statistical Analysis of Environmental Monitoring Data Dan Wang, Xin Deng, Nan Singhasemanon, Kean S. Goh California Department of Pesticide Regulation SETAC 2016
Transcript
Chlorpyrifos in Surface Waters of Central Valley, California: Statistical Analysis of
Environmental Monitoring Data
Dan Wang, Xin Deng, Nan Singhasemanon, Kean S. Goh California Department of Pesticide Regulation
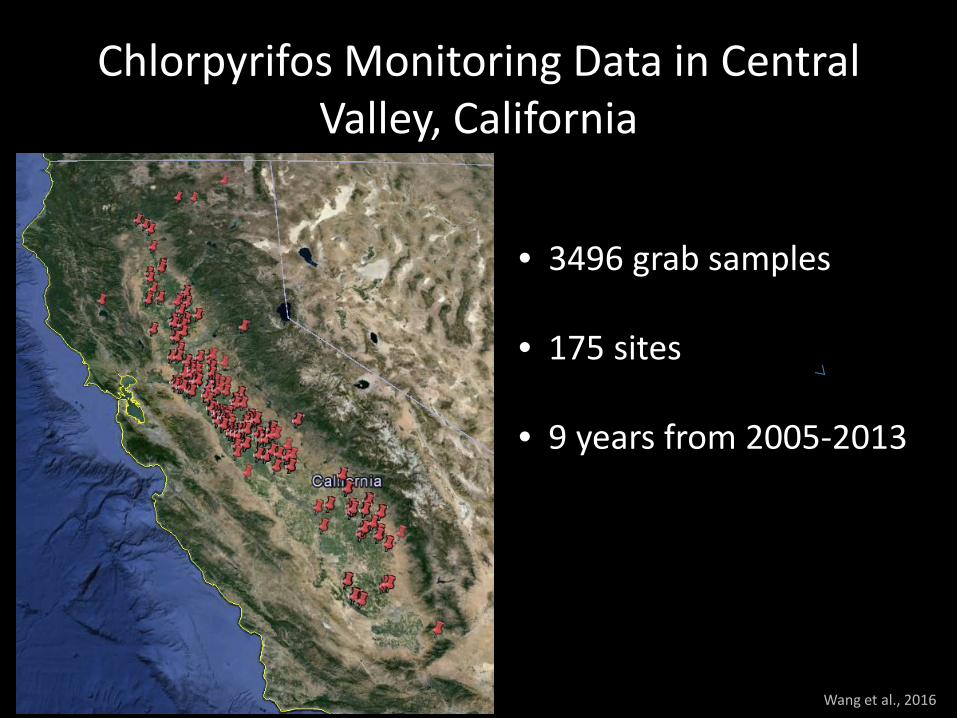
Chlorpyrifos Monitoring Data in Central Valley, California
Wang et al., 2016
• 3496 grab samples • 175 sites • 9 years from 2005-2013
Challenges in Interpreting Monitoring Data
Maas-Hebner et al., 2015; Wang et al., 2016
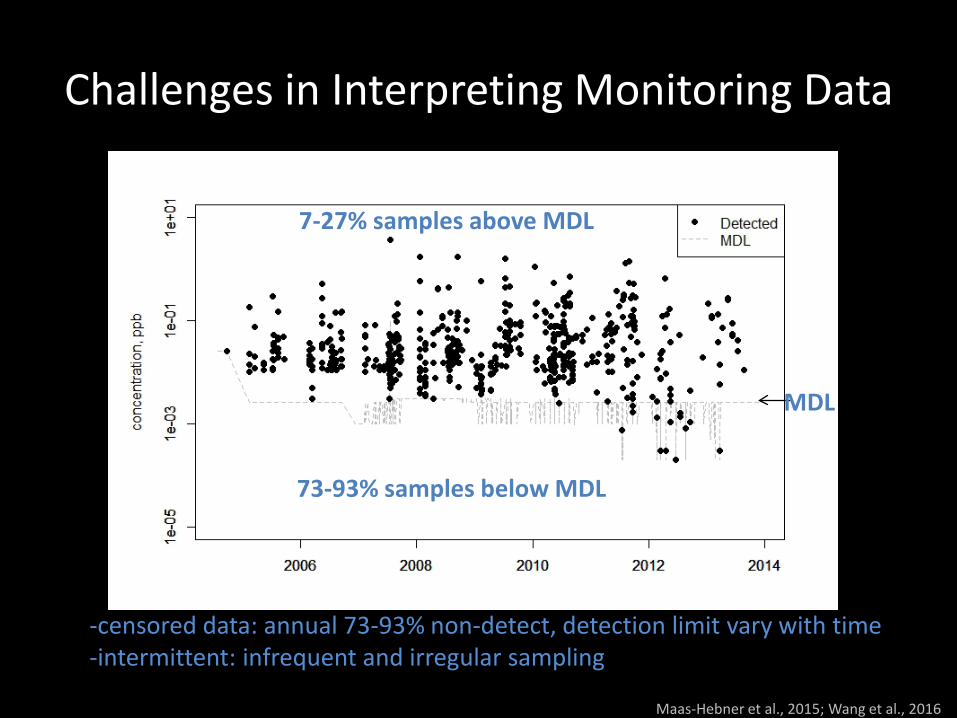
-censored data: annual 73-93% non-detect, detection limit vary with time -intermittent: infrequent and irregular sampling
MDL
7-27% samples above MDL
73-93% samples below MDL
Conventional: Exceedance Frequency
• Toxicity thresholds vs. MDL
Wang et al., 2016
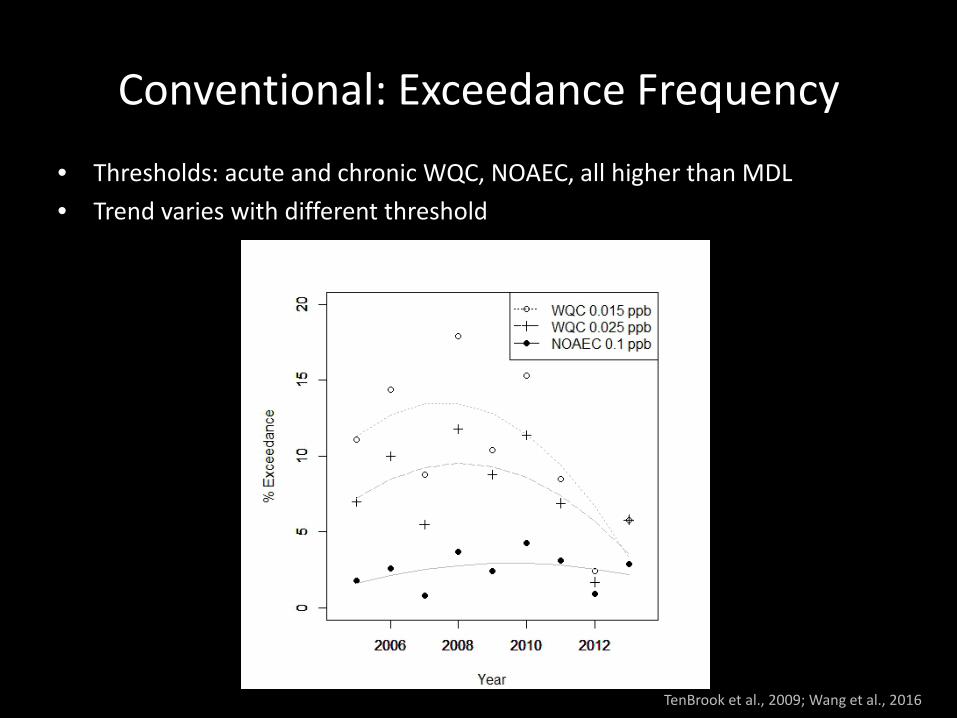
Conventional: Exceedance Frequency
• Thresholds: acute and chronic WQC, NOAEC, all higher than MDL • Trend varies with different threshold
TenBrook et al., 2009; Wang et al., 2016
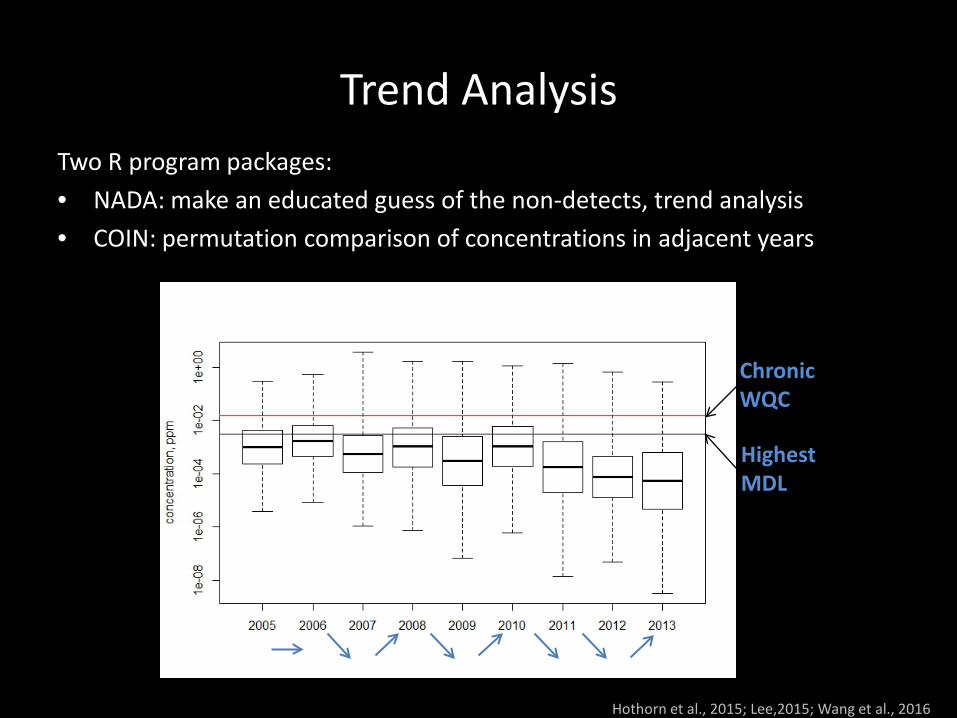
Trend Analysis Two R program packages: • NADA: make an educated guess of the non-detects, trend analysis • COIN: permutation comparison of concentrations in adjacent years
Hothorn et al., 2015; Lee,2015; Wang et al., 2016
Highest MDL
Chronic WQC
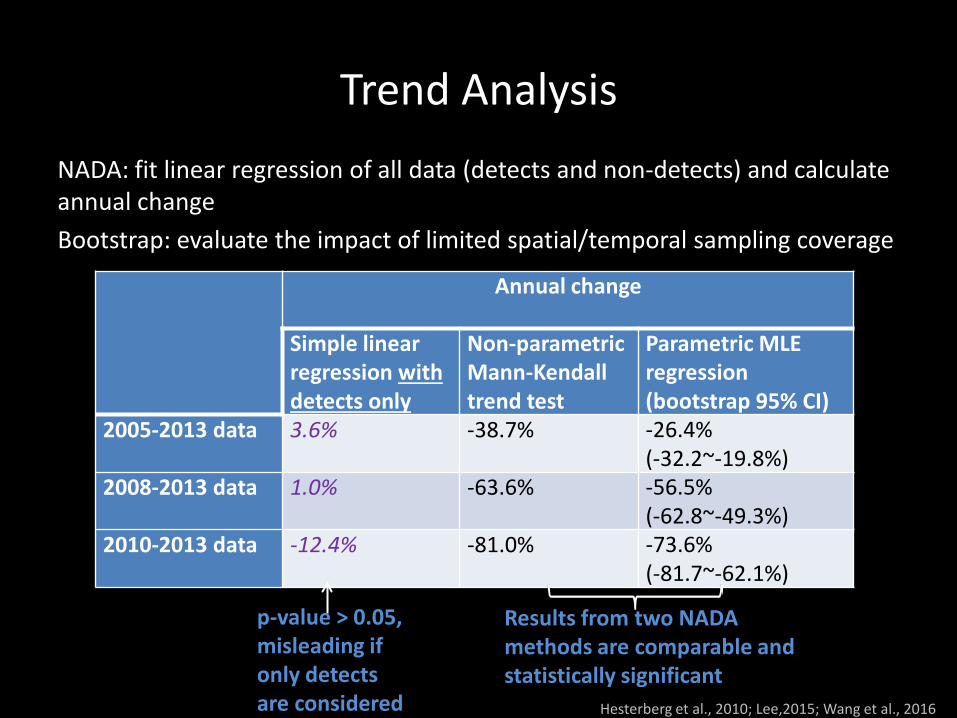
Trend Analysis NADA: fit linear regression of all data (detects and non-detects) and calculate annual change Bootstrap: evaluate the impact of limited spatial/temporal sampling coverage
Hesterberg et al., 2010; Lee,2015; Wang et al., 2016
Annual change Simple linear regression with detects only
Non-parametric Mann-Kendall trend test
Parametric MLE regression
(bootstrap 95% CI) 2005-2013 data 3.6% -38.7% -26.4%
(-32.2~-19.8%) 2008-2013 data 1.0% -63.6% -56.5%
(-62.8~-49.3%) 2010-2013 data -12.4% -81.0% -73.6%
(-81.7~-62.1%)
p-value > 0.05, misleading if only detects are considered
Results from two NADA methods are comparable and statistically significant
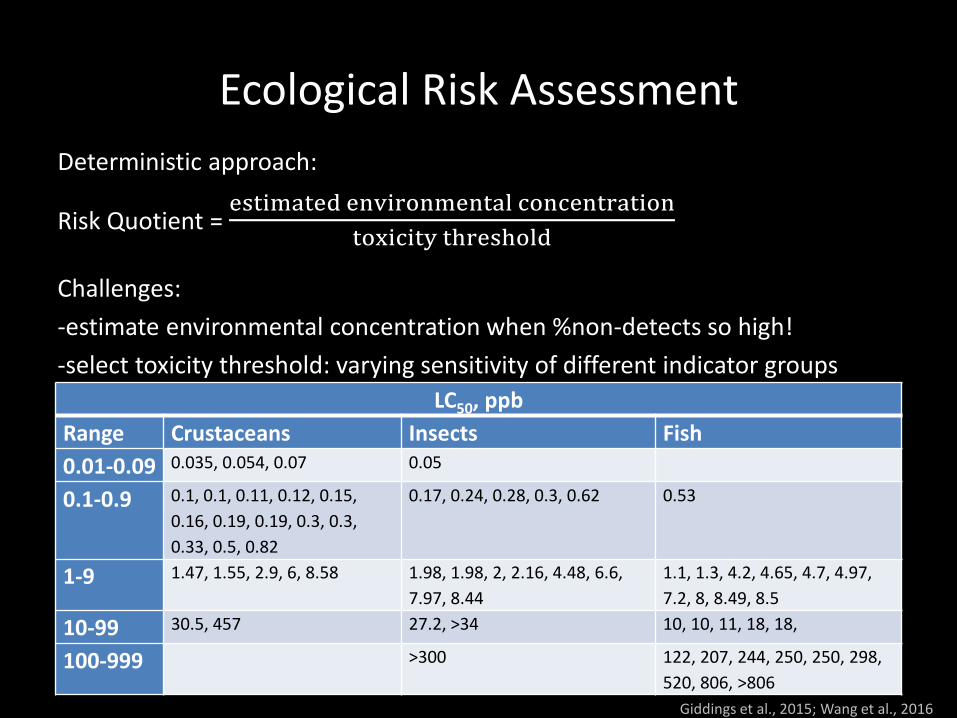
Challenges: -estimate environmental concentration when %non-detects so high! -select toxicity threshold: varying sensitivity of different indicator groups
Giddings et al., 2015; Wang et al., 2016
LC50, ppb Range Crustaceans Insects Fish 0.01-0.09 0.035, 0.054, 0.07 0.05
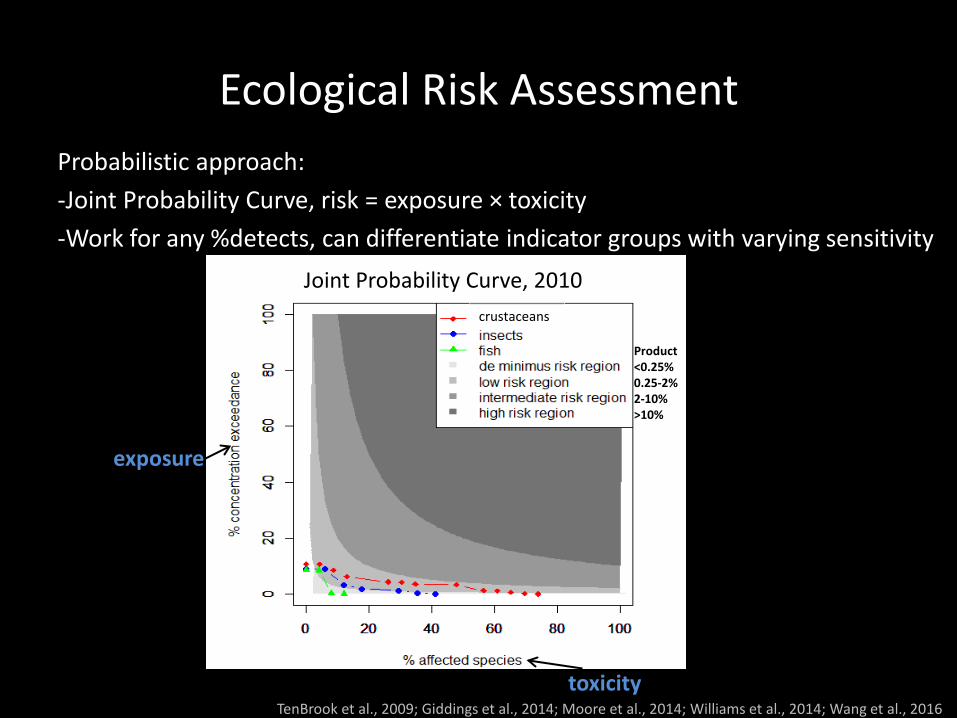
Ecological Risk Assessment Probabilistic approach: -Joint Probability Curve, risk = exposure × toxicity -Work for any %detects, can differentiate indicator groups with varying sensitivity
TenBrook et al., 2009; Giddings et al., 2014; Moore et al., 2014; Williams et al., 2014; Wang et al., 2016
Joint Probability Curve, 2010
exposure
toxicity
Product <0.25% 0.25-2% 2-10% >10%
crustaceans
References Giddings, J. M., W. M. Williams, K. R. Solomon, and J. P. Giesy (2014), Risks to Aquatic Organisms from Use of Chlorpyrifos in the United States, in Ecological Risk Assessment for Chlorpyrifos in Terrestrial and Aquatic Systems in the United States, edited, pp. 119-162, Springer.
Hesterberg, T., D. S. Moore, S. Monaghan, A. Clipson, R. Epstein, B. A. Craig, and M. G.P. (2010), Bootstrap Methods and Permutation Tests, in Introduction to the Practice of Statistics, edited by D. S. Moore, G. P. McCabe and B. A. Craig, W.H. Freeman, New York.
Hothorn, T., K. Hornik, M. A. van de Wiel, and A. Zeileis (2015), COIN: Conditional Inference Procedures in a Permutation Test Framework (R package).
Lee, L. (2015), NADA: Nondetects And Data Anlaysis for environmental data (R package), edited.
Maas-Hebner, K. G., M. J. Harte, N. Molina, R. M. Hughes, C. Schreck, and J. A. Yeakley (2015), Combining and aggregating environmental data for status and trend assessments: challenges and approaches, Environ Monit Assess, 187(5), 1-16.
Moore, D. R., R. S. Teed, C. D. Greer, K. R. Solomon, and J. P. Giesy (2014), Refined avian risk assessment for chlorpyrifos in the United States, in Ecological Risk Assessment for Chlorpyrifos in Terrestrial and Aquatic Systems in the United States, edited, pp. 163-217, Springer.
TenBrook, P. L., A. J. Palumbo, and R. S. Tjeerdema (2009), Methodology for Derivation of Pesticide Water Quality Criteria for the Protection of Aquatic Life. Phase II: Methodology Development and Derivation of Chlorpyrifos Criteria. Chapter 2: Evaluation and Selection of Methods. Report Prepared for the Central Valley Regional Water Quality Control Board.
Williams, W. M., J. M. Giddings, J. Purdy, K. R. Solomon, and J. P. Giesy (2014), Exposures of aquatic organisms to the organophosphorus insecticide, chlorpyrifos resulting from use in the United States, in Ecological Risk Assessment for Chlorpyrifos in Terrestrial and Aquatic Systems in the United States, edited, pp. 77-117, Springer.
Wang, D., N. Singhasemanon, and K. S. Goh (2016), A statistical assessment of pesticide pollution in surface waters using environmental monitoring data: Chlorpyrifos in Central Valley, California, Science of The Total Environment, 571, 332-341.
Thank you!
Dan Wang, Ph.D. Email: [email protected] Phone: 916-324-4201 Xin Deng, Ph.D. Email: [email protected] Phone: 916-445-2506 Department of Pesticide Regulation California Environmental Protection Agency