Chromatographic and Electromigrative Determination of Sulfur-Oxygen Anions in Gold Thiosulfate Leach Solutions by John William O'Reilly A thesis submitted in fulfilment of the requirements for the degree of Doctor of Philosophy UNIVERSITY oFTA .SMANIA August 2003
Transcript
Chromatographic and Electromigrative
Determination of Sulfur-Oxygen Anions
in Gold Thiosulfate Leach Solutions
by
John William O'Reilly
A thesis submitted in fulfilment of the requirements for
the degree of
Doctor of Philosophy
UNIVERSITY oFTA.SMANIA
August 2003
DECLARATION
To the best of my knowledge, this thesis contains no copy or paraphrase
of material previously published or written by another person, except
where due reference is made in the text of the thesis.
I
John William O'Reilly
August 2003
This thesis may be available for loan and limited copying in accordance
with the Copyright Act 1968
I
John William O'Reilly
August 2003
11
ACKNOWLEGEMENTS
I would like to express my gratitude and thanks to the following people:
My supervisor Professor Paul Haddad and co-supervisor Dr. Greg Dicinoski for their expert help, support and advice during the course of this project.
Dr. Matthew Shaw for assisting with some of the IC experiments that required two people, lots of helpful discussions and time spent proof-reading manuscripts.
Andrew Grosse, for helping maintain the library of references for this project, and many useful and interesting discussions (not just the ones about the project either!).
To all the other numerous past and present members of the Separation Science Group/ACROSS for their help and friendship over the course of my PhD., · including Emily Hilder, Michael Breadmore, Kai Ling Ng, John Madden, Cameron Johns, Joe Hutchinson, Helmy Cook, Philip Zakaria, Amanda Glover, Mirek Macka, Kathalijne Oudhoff, Sun Baoguo, Yan Zhu, Shusheng Zhang, Wenchu Yang, Narumol Vachirapatama, Ana Brandao and Fang Wang.
The staff and students of the School of Chemistry for providing such a friendly workplace.
Professor Y asuyuki Miura for generously providing the trithionate and pentathionate standards.
The Australian Research Council, Dionex Corporation, Newcrest Mining Ltd. for financial support and Osleach Pty. Ltd. for providing the gold ore samples.
The members of the Derwent Valley Concert Band, for being such a great bunch of people.
All my friends, well, simply, for their friendship!
My family, particularly my parents Chris and Jackie, sister Kate, soon to be brother-in-law Andrew, and my in-laws Kath and David for your love and support.
Last, but certainly not least, to my wife, Karen, for your love, support and for accepting without complaint all the sacrifices and drawbacks that come with having a postgrad for a husband.
111
DEDICATION
I would like to dedicate this thesis to the memory of my late grandmother,
Isobel Amelia O'Reilly
to whom seeing the completion of this work would have meant so much.
IV
2-PrOH
Ac
ACN
BGE
Bis-tris
BTC
CE
CHES
CTA
DEtA
DETA
DTNP
DVB
EDA
EDTA
EtOH
FIA
FTTR
GC
HAH
HDB
HEMA
HMB
HPLC
HPMC
LIST OF ABBREVIATIONS
2-Propanol
Acetate
Acetonitrile
Background electrolyte
2,2-bis(hydroxymethyl)-2,2' ,2' '-nitrotriethanol
Benzenetricarboxy late
Capillary electrophoresis
2-(N-cyclohexylamino )ethanesulfonic acid
Cetyltrimethylammonium
Diethanolamino
Diethy lenetriamine
2-2 '-dithiobis( 5-nitropyridine)
Divinylbenzene
Ethy lenediamine
Ethy lenediaminetetraaceitc acid
Ethanol
Flow injection analysis
Fourier transform infra-red
Gas chromatography
Hydroxy lamine hydrochloride
Hexadiinethrinebromide
H ydroxyethy 1 methacrylate
Hexamethonium bromide
High performance liquid chromatography
H ydroxypropy lmethylcellulose
v
IC
ICP-MS
IIR
ITP
MBB
:MDEA
MeOH
mm
n-BuOH
NS
NTS
ODS
PAR
PCR
PMA
PrOH
RSD
TBA
THAM
THF
TPA
TrEA
Tris
TTA
LIST OF ABBREVIATIONS (CONTINUED)
Ion chromatography
Inductively coupled plasma-Mass spectrometry
Ion-interaction reagent
Isotachophoresis
Monobromobimane
methyl-diethanolamine
Methanol
Minutes
N-butanol
Not specified
N aphthalenetrisulfonate
Octadecylsilica
4-(2-pyridylazo )resorcinol monosodium salt hydrate
Post column reaction
Pyromellitic acid
Propanol
Relative standard deviation
Tetrabutylammonium
Tris(hydroxymethyl)aminomethane
Tetrahydrofuran
Tetrapropylammonium
Triethanolamine
Tris(hydroxymethyl)aminomethane
Tetradecyltrimethylammonium
VI
LIST OF PUBLICATIONS
Type of Publication Number Reference
Papers in refereed journals 4 1-4
Posters at international meetings 2 5-6
1. O'Reilly J. W., Dicinoski G. W., Shaw M. J., Haddad P.R. "Chromatographic and
electrophoretic separation of inorganic sulfur and sulfur-oxygen species", Anal. Chim.
Acta 2001 (432) 165-192
(Chapter 1)
2. O'Reilly J. W., Shaw M. J., Dicinoski G.W., Grosse A. C., Miura Y., Haddad P. R.,
"Separation of polythionates and the gold thiosulfate complex in gold thiosulfate leach
solutions by ion-interaction chromatography", Analyst 2002 (127) 906-911
(Chapter 4)
3. O'Reilly J. W., "Application of ion-chromatography to gold thiosulfate leach
solutions", Aust. J. Chem. 2002 (55) 546
(Chapter 4)
4. O'Reilly, J. W., Dicinoski, G. W., Miura, Y., Haddad, P.R., "Separation of thiosulfate,
polythionates and the gold thiosulfate complex in gold thiosulfate leach solutions by
capillary electrophoresis", Electrophoresis, accepted for publication (2003).
(Chapter 5)
5. O'Reilly J. W., Dicinoski G. W., Shaw M. J., Haddad P.R., "Determination of gold
thiosulfate and polythionates by ion-chromatography", International Ion
Chromatography Symposium llCS'01, Chicago, USA, 9-12 September 2001.
6. O'Reilly J. W., Shaw M. J., Dicinoski G.W., Miura Y., Haddad P. R., "Determination of
gold thiosulfate and polythionates in gold thiosulfate leach solutions by ion-interaction
chromatography'', INTERACT 2002, University of Technology, Sydney, Australia, 21-
25 July 2002.
vu
ABSTRACT
This work presents a series of investigations into the use of chromatographic and
electromigrative techniques for the analysis of gold thiosulfate leach solutions.
The focus of the project was determination of the gold thiosulfate complex
(Au(S203)23-), thiosulfate (S2ol-) , the polythionates (Sxoi-, x = 3 to 5) and
sulfate (Sol-) in these liquors.
The fundamental behaviour of the gold thiosulfate complex was studied in an ion
interaction chromatographic system. Partial dissociation or decomposition of the
gold complex occurred on-column in standards, although this was minimised
through adding thiosulfate to the eluent. Addition of the matrix ions, thiosulfate,
trithionate, tetrathionate or the leach matrix to gold thiosulfate samples further
complicated the chromatography, with the gold peak area dependent on the
concentrations of these species in solution. Broadening of the gold peak occurred
in solutions containing high concentrations of thiosulfate or the leach matrix that
was in part attributed to a self-elution effect. Other mechanisms were also thought
to affect the chromatography, such as the type of stationary phase. These
problems prevented the successful determination of gold thiosulfate in the leach
matrix.
Ion-interaction chromatography was successfully applied to the determination of
trithionate, tetrathionate, and pentathionate in undiluted leach liquors. A total
analysis time of 18 min was required for the developed method using a Dionex
NS 1-5 µ column with guard and an eluent comprising an acetonitrile step gradient
at injection from 15% to 28% vlv, 3 mM tetrabutylammonium hydroxide and
2.5 mM sodium carbonate. Detection limits for polythionates using a 10 µL
Vlll
injection volume ranged between 5-23 µM for conductivity and 4-68 µM for UV
detection based on a signal to noise ratio of 2.
The electromigrative methods, capillary electrophoresis, isotachophoresis and
mixed mode isotachophoresis/capillary electrophoresis were also investigated for
their applicability to the determination of sulfur-oxygen species in thiosulfate
leach liquors. Using capillary electrophoresis a method was developed that
allowed the separation of thiosulfate, polythionates and the gold thiosulfate
complex. The method separated the five species in under 3 min with a total
analysis time of 8 min, using an electrolyte containing 25 mM bis-tris adjusted to
pH 6.0 with sulfuric acid and an applied voltage of-30 kV. Quantification of the
gold thiosulfate complex was not possible by this technique due to inconsistent
peak areas and peak splitting effects induced by the presence of other sulfur
oxygen species in the sample. Detection limits of the method ranged between 0.5-
2 µM. The teclmique was applied successfully to a thiosulfate leach liquor diluted
1:100.
Using isotachophoresis, simultaneous determination of thiosulfate and sulfate, in
less than 30 minutes, was possible for a synthetic thiosulfate leach liquor
requiring a dilution factor of only 2:5. Detection limits of the developed method
were 1.3 mM for sulfate and 2.1 mM for thiosulfate. The method also showed
promise for the simultaneous determination of thiosulfate, sulfate, trithionate and
tetrathionate in these leach solutions. The concept of single capillary
isotachophoresis/capillary electrophoresis for these sulfur ions was also
demonstrated, however problems with reproducible quantitation prevented· the
development of a working method.
lX
TABLE OF CONTENTS
Declaration
Acknowledgments
Dedication
List of Abbreviations
List of Publications
Abstract
Table of Contents
Chapter 1
Literature Review
1.1 INTRODUCTION
1.2 Cy ANIDE EXTRACTION
1.3 PROBLEMS WITH CYANIDE-BASED GOLD LEACHING
1.3 .1 Refractory Ores
1:3.2 The Toxicity of Cyanide
1.4 THE SEARCH FOR ALTERNATIVES
1.5 THIOSULFATE LEACHING
1.5 .1 Introduction
1.5.2 The Thiosulfate Leach Reaction
1.5.3 Problems Hindering Commercial Development of the Process
1.5.4 Species Present in a Typical Leach
1.6 THE ANALYTICAL CHEMISTRY OF THE SULFUR AND SULFUR-OXYGEN SPECIES
1.6.1 Introduction
1.6.2 Chemistry of Sulfur Species Influencing their Analysis
1.6.3 Ion-Chromatographic Determination of Sulfur Species
1.6.3.1 Introduction
1.6.3.2 Early (Classical) Ion-Exchange Methods
1.6.3.3 Modem Ion-Chromatography
1.6.3.4 Resolution and Selectivity by Anion-Exchange and Ion-Interaction Chromatography
1.6.3.5 Sulfur Ion Detection in Ion-Chromatography
1.6.3.6 Pre-Chromatographic Derivatization and Preconcentration
ii
iii
lV
v
vii
Vlll
x
1
2
3
3
4
6
6
6
8
9
10
13
13
15
21
21
25
27
37
42
46
x
1.6.4 Determination of Sulfur Species using Capillary Electrophoresis 49
1.6.4.1 Introduction 49
1.6.4.2 Separation and Selectivity for Sulfur Anions by Capillary Electrophoresis 52
1.6.4.3 Sample Preparation, Preconcentration and Injection 57
1.6.4.4 Detection of Sulfur Anions
1.6.5 Determination of Sulfur Species by Isotachophoresis
1.6.5.1 Introduction
1.6.5.2 Separation of Sulfur Species by Isotachophoresis
mM tetrabutylammonium hydroxide (TBAOH) and 0.5 mM Na2C03).
Trithionate was stable in this eluent at pH 8, whilst the tetra and pentathionate
concentrations decreased significantly within a few hours due to decomposition,
with the decomposition rate increasing with pH. Despite these observations, the
possible decomposition or change in speciation over the course of a
chromatographic or electrophoretic run has not yet been investigated.
The preceding paragraphs highlight the problems inherent in storing solutions
containing sulfur species prior to analysis. There appears to be no guaranteed
method of ensuring that the initial sulfur speciation of a sample will be preserved
on storage. The use of stabilisers reduces the reaction of individual sulfur species
in solution, although the stabilisers themselves can perturb the concentrations of
other ions. Results in the literature suggest that there is no substitute for
immediate analysis of samples containing mixtures of sulfur species.
1.6.3 Ion-Chromatographic Determination of Su/fur Species
1.6.3.1 Introduction [113, 114)
IC, is a physico-chemical separation technique that utilises differences in the
distribution of ionic solutes between a mobile and stationary phase. Using the
modem version of the technique, a sample mixture of ionic solutes is injected into
a liquid flow stream known as the eluent which is then passed through a
"column", usually a metal or plastic cylinder packed with uniform, small-diameter
(e.g. 5 µm) particles. The cylinder itself is usually between 5-30 cm long with an
internal diameter of between 2-9 mm., and the particles are held stationary inside
21
Chapter 1 Literature Review
by means of porous frits at both ends. A high pressure pump is required to drive
the solution through the column, and a flow through detector is placed at the far
side to detect the components as they elute from the column. A typical
configuration for an ion-chromatograph is shown in Fig. 1.1.
The mechanism of separation is dependent on the branch of IC used. In ion-
exchange chromatography, the column packing is a resin, which can be inorganic
or a polymeric organic material that contains fixed charged groups on its surface.
Where the fixed charge is positive, the resin is said to be an anion-exchanger, for
fixed negative charges it is said to be a cation-exchanger. Associated with the
fixed charge are counter-ions of opposite charge to render the resin neutral. The
process of ion-exchange will be illustrated by considering an anion-exchange
resin. Consider a resin in water with fixed positive charge (R+) and counter ion
(K). If another counter ion (A) comes in contact with the resin an equilibrium is
established as shown in Eqn 1.16.
(1.16)
This process is stoichiometric and can be generalised to ions with charge > 1. The
equilibrium constant for the process is known as the selectivity coefficient which
can be expressed as shown in Eqn 1.1 7:
(1.17)
where x and y denote the charge on A and E, the parentheses indicate the activity
Eluent Reservoir
Pump Injector Column Detector
Fig. 1.1 Essential features of an ion-chromatographic system.
Data Acquisition
22
Chapter 1 Literature Review
of each species and R and M refer to the resin and mobile phases respectively. In
anion-exchange chromatography, separation between two anions A- and ff occurs
via the use of the eluent, which consists of an ionic solution with anion (K). The
separation of the two solute ions occurs as a result of the different selectivity co
efficients that exist between the eluent anion and each sample anion. The
mechanism for cation-exchange materials is analogous.
Another branch of IC is ion-interaction chromatography, for which the
mechanism is more complex. The instrumentation is identical, but a reverse-phase
HPLC column is used and the eluent contains what is known as an "ion
interaction" or "ion-pair" reagent, which in the case of anion analysis is usually a
strong base cation such as a tetraalkylammonium ion. Three models have been
proposed for the mechanism of separation in ion-interaction chromatography, but
only the "ion-interaction" model, that considered to best represent the observed
experimental data, will be discussed here.
According to this model (represented in Fig 1.2), the hydrophobic ion-interaction
reagent absorbs onto the stationary phase surface in a dynamic equilibrium with
the eluent, in tum inducing formation of an electrical double-layer. In the case of
anion analysis, an evenly spaced positively charged primary layer at the stationary
phase surface is the result, followed by a second, diffuse layer of counter-ions.
Analyte ions (anions will be considered here), can compete with sites in the
negatively charged secondary layer, and once inside electrostatic attraction and
also possibly solvophobic (reverse phase chromatography) effects will usually
result in it moving into the primary layer. This disrupts the electroneutrality of
23
Chapter 1 Literature Review
(a}
~ Bulk Eluent
1-~--~~~ f!e!!~
(b}
~
Fig. 1.2 Illustration of the ion-interaction mechanism. (a) Equilibrium of ioninteraction reagent onto stationary phase (b) Retention mechanism of a solute anion. Extracted from [ 113].
24
Chapter] Literature Review
the layer, and therefore another ion-interaction cation is drawn into the primary
layer, meaning that the retention process involves a pair of ions. Separation
occurs as a result of competition between the different analyte anions and the
counter-ion of the ion-interaction reagent (the eluent anion in this system) for sites
in the double layer.
IC methods have become very popular for the determination of many sulfur
amons. In the literature up to 1988 sulfate was the second most frequently
analysed amon by such methods, surpassed only by chloride. Sulfite and
thiosulfate were the ninth and tenth most frequently analysed anions respectively
and sulfide was in the top 20 [113]. Documentation of every paper and
application note on the deterniination of sulfur species such as sulfate and sulfite
is not feasible due to the large number of references involved. The reader is
therefore directed to books on IC [113] and the catalogues and information sheets
produced by column manufacturers, for example [115], to obtain more detailed
information on the separation of common ions such as sulfate. In this review the
primary focus will be on separations involving multiple sulfur and sulfur-oxygen
species.
1.6.3.2 Early (C/assicalj Jon-Exchange Methods
Prior to the development of the instrumentation discussed in the previous section,
IC was performed using larger resin particles packed in vertical glass columns.
The eluent moved through the column under the force of gravity and left the
column through a stopcock that was used to regulate the flow rate. The eluate was
collected in a series of containers, which were analysed using wet chemical or
25
Chapter 1 Literature Review
other techniques. The first reported separation methods for sulfur-oxygen ions
used such methodology.
Iguchi [116] separated dithionate and the polythionates (trithionate, tetrathionate,
pentathionate) on Dowex 1-X2 anion-exchange resin using progressively higher
hydrochloric acid concentrations (between 1 and 9 M). In a separate study [117]
sulfate, sulfite, thiosulfate and sulfide were separated on Mitsubishi Kasei Diaion
SA 100, a strongly basic quaternary ammonium polymer resin. Three ammonium
nitrate eluents, a 0.1 M solution of 30:70 acetone-water adjusted to pH 9 with
ammonia, an aqueous 0.1 M solution and an aqueous 1 M solution were required
to complete the separation. Pollard et al. [118] attempted to separate sulfite,
thiosulfate, trithionate, tetrathionate, pentathionate and hexathionate using De
Acidite FF resin cross-linked with 2% divinylbenzene (DVB). Sulfite and
thiosulfate . were eluted using 2 M potassium hydrogenphthalate, although a
complete separation was not achieved. The polythionates were separated using
3 to 9 M hydrochloric acid. Schmidt and Sand [119] also separated the same
mixture using sodium chloride in conjunction with hydrochloric acid eluents,
however hexathionate could not be separated due to on-column decomposition.
Thiosulfate has been used as an eluent in classical ion-exchange chromatography
to separate ~etal ions by utilising the formation of metal-thiosulfate complexes.
One of the earliest papers by Vasil'ev et al. [120] reported the separation of
copper(II)/zinc(II) and copper(II)/cadmium(II) binary mixtures on Wofatit P resin
in the sodium form. In later papers [121,122] the retention of several metal ions
on Amberlite IR-120 cation-exchange resin in the sodium form was studied.
26
Chapter 1 Literature Review
Majumdar and Mitra [122] absorbed metal ions onto the head of the column and
then eluted these by stepwise increments of sodium thiosulfate concentration
ranging from 0.02 M to 0.5 M. Metal ions that formed significant anionic
complexes with· thiosulfate were eluted much earlier than other metal ions.
Eusebius et al. [123] performed a similar but more detailed study using Dowex
50W-X8 cation-exchange resin in the H+ form. Distribution coefficients of the
metals in alkaline sodium thiosulfate solutions were determined over the
concentration range 0.02 to 0.28 M. The same group had earlier examined the use
of s_odium thiosulfate eluents on Dowex 1-X8 anion exchange resin in the chloride
form [124]. Those metal ions that showed significant formation of anionic
complexes with thiosulfate, such as lead(II), copper(II) and silver(!) were eluted
later than the remainder. The authors. noted precipitation of copper(II), lead(II)
and silver(!) sulfide in mixtures of these metals containing relatively low levels of
thiosulfate.
The above procedures for the separation of metallo-thiosulfate complexes were
only able to seP_arate at best five complexes in any one analysis [122]. The ability
of more modem instrumental chromatographic techniques and stationary phases
to separate metallo-thiosulfate complexes is unknown since there are no published
papers on the subject to date.
1.6.3.3 Modem Ion-Chromatography
Modem anion-exchange and ion-interaction chromatographic methods have been
the most extensively applied separation techniques for the determination of sulfur
anions, with selection of the particular technique being dependent on the nature of
27
;:: 00 .~ N ;:.. ~
Q::;
~ i: ~ ~ Table 1.1 Anion-exchange chromatographic methods for the determination of sulfur species. ·-~
Species Detected Sample Sample Preparation Column Eluent Detection Detection
Ref. Limit
s2-. so/-. so/- Standards D1onex HPIC-AS4 and 14.7 mM ethylenediamine, 10 mM Suppressed Low ppb (sub [125] AG4guard NaH2803, 1 mM Na2C03. conductivity and µM)
amperometry
s 2·, so32·• so/· Kraft process Dilution, filtration through a Waters IC Pak A 5.0 mM H3P04 (pH 6.5 with l10H) Non-suppressed [106] (Green ) liquors M1llex filter, addition of conductivity
antioxidants ascorbic acid and glycerol.
s 2-. sol·. s20/" Hot spring water Degassed water and CQ32· to Dionex HPIC-AS4A 5mM Na2C03 PCR, UV (330 1.8-3.5 µM [96] stabilise s 2· and formaldehyde with AG4A guard nm) to stabilise sol- • filtration and dilution.
s 2-, S032-. S2032· Human serum Various pretreatments to Macherey-Nagel 3:13 ACN:CH3COOH (pH 3) Fluorescence 20-40 nM [126] reduce matnx followed by Nucleosil 5N(CH3)2 with containing 25 mM NaCIQ4 derivatisatfon with MBB. For Nucleosil 100-5 C1e serum samples sot and s 2- guard analysis separate to S20/°.
s 2·• S032-. S2032· Molten caustic Degassed water for s 2· and Dionex HPIC-AS3 50-200 mM KN03, 5-10 mM NaOH. Sampled DC [127] desulfunsed coal polysulfide standards. Flow rate gradient. polarography process solutions
s 2-, S032-, S20/" Hot spring water Degassed water and C032- in Tosoh TSKgel IC- 15:85 ACN:H20 containing 6.0 mM PCR, indirect 2.8-48 µg/l [98] standards to stabilise s 2· and anion-PW Na2C03. UV (350nm) (29-600 nM) S2032-. formaldehyde to stabilise S032· •• d1lullon .
....... s 2·, S032-. S2032- Bacterial sulfur Filtration, stabilisation of sot Alltech Durasep A-2 5:95 MeOH:H20 containing 2.9 mM [102] lo.. Pulsed 0.02-0.3 mg/L
~ degradation with formaldehyde, standards Na2C03, 2.6 mM NaHC03, 1.3 mM amperometry (not specified §< solutions degassed. p-cyanophenol (different for S032") 6 concentrations of components used (0.2-9.4 µM)
for analysis of samples)
s 2-, sot. s2ot Waste water TSK gel IC-anion-PW 0.1 M NaH2P04-H3P04 (pH 2.30) Amperometry [128]
s 2-, sol, s2ot semi-lean MDEA Filtration and dilution Dionex AG9-SC and 1.8 mM Na2COa, 1.7 mM NaHCOa Suppressed [129] used for gas AS9-SC in series Conductivity treatment
so/-. so/-. s20/- Standards Glass column packed 25:30:45 Acetone:EtOH:H20 PCR, UV (335 -0.05-0.1 mM [131] with Bio-Rad Bio-Rex 5 containing 0.1 M NaB02 and 0.1 M nm) resin. Guard used. NaNOa (pH 8.0). To elute so/· and
S20/- 0.1 M NaB02, 0.2 M NaNOa in H2o was used (pH 9.0).
sot. so/-. s2ot Standards Dionex HPIC-AS5 and 2.8 mM NaHCOa, 2.2 mM Na2COa, Suppressed Low ppb (sub [125] AG4 guard 100 mg/L p-cyanophenol conductiv.ity µM)
so/-. sol. s2032- Standards Dionex AS-4A and 0.75 mM NaHC03, 2 mM Na2C03 Suppressed 15-75 µg/L (132] AG4A guard conductivity (0.16-0.94
µM)
so/-. so/-, s2ot Standards Stabilisation of so/- using Vydac 302 or 300 IC 1-3 mM phthalic acid (pH 5-6 with Indirect UV (290 10-250 µM [94] formaldehyde. NaOH) nm) or refractive
index
SO/", so/-, S20t Na2S203 Unknown 1-5mM glutamic acid (pH 9-11) or Non-suppressed 0.01-1 mg/L [133] 5.6 mM Na2C03 and 4 mM NaOH. conductivity (0.1-9 µM)
sot. so/-, s2ot Bacterial sulfur Filtration, stabilisation of SO/- Vydac 302IC4.5 3 mM phthalate (pH 4.0) Non-suppressed 0.6-3 mg/L [102] degradation with formaldehyde, standards conductivity (6.2-27 µM)
c5 sot. so/-. s2ot Refinery Wescan 269001 anion 5 mM phthalate (pH 3.8) Non-suppressed (135] accumulated conductivity water
~ 0 'll ("f") ;;'. 'll
Q::; 'll lo.
-2! ~ .~ Table 1.1 (Cont.) ~
Species Detected Sample ~ample Preparation Column Eluent Detection Detection
Ref. Limit
so/-, sol-. s2ot Simulated Filtration and dilution D1onex AG17 and 1 to 40 mM KOH gradient Suppressed [136] industrial waste AS17 in series conductivity water
sot. sot. s2ot Kraft black liquor Dionex AS11 40:60 MeOH:H20 with a 30 to 60 Suppressed [137] mM NaOH gradient conductivity
so/·. sol-. s20/- Kraft process Dilution with degassed water, DionexAS-3 3.0 mM NaHC03, 2.4 mM Na2C03 Suppressed [138] (black) liquors filtration, stabilisation of so/- conductivity and
with formaldehyde. amperometry
s2ot. so/-, sol Kraft process Dilution, stabilisation of SO/- OmniPax-100 with 1.3 mM Na2C03, 6 mM NaOH, 1.58 Suppressed [104,1 liquors in standards by isopropanol. guard mM p-cyanophenol conductivity 39]
(a) s 2· Kraft liquors (a) Metal ion removing Dionex (a) HPIC-AS2, (a) 0.25 mM Na2C03, 5 mM NaOH, (a) UV (215 nm) [140,1
(b) sol-. sol-. precolumn. (b) - AS3, AS4A or ASS with 1.5 mM ethylenediamine or pulsed 41] AG4 guard (b) HPIC- amperometry
S2032" AS-5 and HPIC-AG4 (b) 1 mM Na2C03, 5 mM NaOH, 0.8
guard mM p-cyanophenol. (b) Suppressed conductivity
sol·1sol· 1co- Coal plant Dilution Glass column packed Phosphate gradient with (A) H20 PCR, UV(335 -0.05-0.1 mM [131] elute), S203 -. s 2· process samples with VYDAC SAX and (B) 1 mM Na2HP04 nm)
resin. Guard used.
s 2·, sot. sol-. Oil-shale retort Stabilisation of sol- with Bio-Rad Bio-Gel TSK 12:88 ACN:1.2 mM potassium Non-suppressed [101] S20t by-product and formaldehyde, degassing and IC-anion-PW resin gluconate, 1.3 mM sodium borate, conductivity,
other waste dilution. based ion exchanger 40 mM boric acid, 54.2 mM direct (254 nm), ....... waters with TSK hydrophilic glycerol, 0.02 mM EDTA (pH 7.2-7.6 or indirect UV lo.
~ guard with HNOJ or KOH) (265 nm) and/or t} amperometry
CS s 2·. so/-. sol. Sediment Centrifugation and filtration Waters IC-Pak A with 0.5:2:12:85.5 glycerol:n- UV (227 nm), -1-200 µg/L [107] S20t samples spiked guard butanol:ACN:Borate-gluconate conductivity (for (10.4 nM-2.5
with sulfide buffer (pH 8.5) containing 0.05 mM SO/) µM) EDTA and L-ascorbic acid
;;: ....... <ll M ·;;: <ll
i::::: ~ ;:: ...... ~ <ll
Table 1.1 (Cont.) ...... >:i
Species Detected Sample Sample Preparation Column Eluent Detection Detection
Ref. Limit
s 2-. sot, sol. Standards Dionex 'fast-run' Gradient elution using various Amperometric (142] S2032- column. mixtures of NaHCOJ, Na2C03 and
Na OH
s 2-. sot, sol. Kraft process Dilution Dionex Anion 3.0 mM NaHCOJ, 2.4 mM N~C03 Suppressed (143-S20t (black) liquors Separator conductivity and 146]
amperometry
s 2-. sol-. so/-. Standards Dionex AS 12A with Step gradient from 60 mM to 100 ICP-MS 35-270 µg/L [147] S2ol- AG12Aguard mM NaOH (1.1-2.5 µM)
sot. s 2-. sol-. Standards Oka-1 resin packed 5 mM Na2C03 Suppressed 0.01-0.05 (148] S2ol- column conductivity and mg/L (not
PCR indirect specified for visible (522 nm) SO/) (0.32-
0.62 µM)
s 2- (indirectly), Tannery Storage in NaOH (pH13), D1onex AG4A-SC and 2.4 mM Na2CO:v'2.2 mM NaHC03 Suppressed 0.75-1.1 µM (149] sol-. sol. s2ol- Wastewater dilution and filtration. Portion of AS4A-SC in series conductivity
sample treated with NH:v'H202 solution and analysed separately for totals as sol. Sulfide standards as per [98].
sot. s 2-. s2ot. Blast furnace slag S/ reacted to form s 2- and Unknown anion- Two eluents (a) 0.5 M NaNOJ Controlled (150] ....., s/- (as s 2- and leach solution S20t with sol- on-column. exchange resin followed by (b)100 mg/L So/· potential ... S20t) coulometic -::! §- s 2-, sot. sot. Polysulfide Cyanolysis of polysulfide to s 2- TSKgel IC-Anion-PW 0.5:3:12:84.5 glycerin:n- Suppressed 4.9-68 µM (151]
CS S20t, S/- (as s 2- solutions and SCN-. Butanol:ACN:1.3 mM potassium conductivity, UV and SCN-) gluconate, 1.3 mM boric acid, 1.3 (220 nm)
mM sodium tetraborate (pH 8.5).
~ N .2 rt) ;>. ~
Q:;
~ ;:s .... l:: ~
Table 1.1 (Cont.) .;:: ~
Species Detected Sample Sample Preparation Column Eluent Detection Detection
Ref. Limit
so/-, s2ot. s4oa2" rDNA protein Filtration Hamilton PRP-X100 10:90 ACN:H20 with NaCI04 UV (214 nm) [152] process solutions PS-DVB (10 µm gradient. ACN was not added if
30-50 µg/l particles) with Waters sot not determined. C18 Guard-PAK guard (0.22-0.27
µM)
so/·, S20/·, S40a2· rDNA protein Filtration Alltech Universal Anion 10-150mM NaCI04 gradient UV (214 nm) [152] process solutions (10 µm particles) with
Waters C18 Guard-PAK guard
So/·, S20/", S20a2· Hot spring water Dionex HPIC-AG4A 0.2 mM phthalate eluent (pH 5.7) Suppressed 1.8-15 µM [153] conductivity
so/-. S20/·, S20a2· Standards Hamilton PRPx100 PS- 0.5 mM 2,5-dihydroxy 1,4- Indirect UV (335 < 1 mg/l (<6 [154] DVB with guard benzenedisulfornc acid nm) µM)
sol, S20/", total Hydrothermal S20/°: 1 ml 1 M ZnCl2, amber 2 x Dionex AG4A NaHCO:JNa2C03 eluents Suppressed 0.1-0.5 µM [156] S,oe2· x :<: 4 as SCN- waters bottle. guard columns in Conductivity and S20/".
S,Oe 2·: As above + 1 ml 1 M series.
NaOH 1 ml 1 M KCN. Dionex AS4A (SO/ only)
(a) S20/", total . Standards (a) Filtration, addition of cation- Dionex l-20 anion (a) 3.0mM Na2C03, O. 75mM p- Suppressed (a) 4.14-5.33 [57] S40/ ,SsOe2°, SeOs2° exchange resin, phosphate separator (a) 95 mm cyanophenol (pH 11.8) conductivity µM ..... as SCN-. buffer (pH 7.4) added, (b) 75 mm
~ (b) so/-. so/·
cyanolysis. (b) 0.75 mM N~C03, 0.75 mM p- (b) 4.58-5.44 .... cyanophenol (pH 11.4) µM §- (b) Addition of formaldehyde cs. and cation-exchange resin.
;;:: rri .~ rri ;>. 'l.)
~ ~ ,§
.~ Table 1.1 (Cont.) ....:i
Species Detected Sample Sample Preparation Column Eluent Detection Detection
Ref. Limit
(a) S20/", S30l, Carbonate Separon (a) HEMA (a) 25 mM NaCI04 and 5 mM (a) UV (205 nm) (a) 0.6-3.3 [157,1 S40a2°, SsOs2° leaching solutions 1 OOO epoxidized phosphate buffer (pH 6.0)
(b) Indirect UV mg/L (2.7-17 58](a)
(b) sol. s2ot copolymer modified µM) only with DEtA (b) 0.05 mM Sulfosalicylic acid (pH (254 nm)
6.0 with NaOH) (b) 8-40 mg/L (b) H300 DEAE in (83-357 µM) glass column
S40a2-. S3oa2-. Sediment slurnes Centrifugation and filtration Sykam LCA A08 10:20:70 MeOH:H20:ACN UV (216 nm) 0.03-2 µM [159] S20/- and enrichment polymer coated silica containing 200 mM NaCl
mesh Darco Red label (adjusted to pH 10), (8) 50:50 mM) activated carbon THF:(A)
S20l°, S30a2°, Mining Extraction with CHCb followed Dupont Permaphase Step gradient from 20 µM to 1.2 mM PCR, -0.3 mg/L [161,1 S40l, Ssoa2- wastewater and by analysis of diluted H20 AAX sodium citrate in H20 fluorescence (1.2-2.7 µM) 62]
bonded silica Sil 60-D Na2HPOJ0.1 M KH2POJ0.1 % (wlv) 10-CN CTABr
SO{/SO/", S20/· Standards Dionex MPIC-NS1 15:85 ACN-2 mM TBAOH/0.88 mM Suppressed (132] Na2C03 conductivity
SQ32·• S2ol·. S/" Petroleum Derivatisation using DTNP Alltech Absorbosphere 50 mM Na00CCH:J7.5 mM UV (320 nm) -0.1 µM (Sx [165, 166] (x = 2 to 4) production effluent HS C1e with Applied TBAHS04 (pH 3.5 with HCI) -ACN species not
Biosystems Spheri-5 gradient system quantified) RP-18 guard 5µm particle size
s 2·• so/·. s2ot. Commercial Degassed water used Hamilton PRP-1 5 µm 15:85 vlv ACN-H20 containing 1 mM UV (215 nm) 0.01-0.02 wt% [167,168] st sodium sulfide particles or Polymer Na2C03 and 2 mM TBAOH (pH -11) (2-5 µM)
Labs. PLPR-S, 8 µm particles
s2·• s2ot. s4ot Gold cyanide leach Dionex MPIC-NS1 23:2:75 vlv ACN:0.1 M TBAOH in 2- UV (240nm) (169]
solutions PrOH/MeOH:H20 containing 0.46mM Na2C03'0.56 mM NaHC03
SOJSO/°, S20a2° Manganese leach Stabilisation of so/· with Dionex MPIC-NG1 20 wt% ACN-1 mM Na2C03 and 2 Suppressed [97] solutions formaldehyde, dilution. mMTBAOH conductivity
so/·. s2ot. Gold extract Dilution Dionex MPIC-NG1 and 10:90 ACN-H20 containing 2.0 mM Suppressed 0.01-0.04 [112,170] S20a2° solutions NS1 TBAOH and 2.0 mM Na2C03 conductivity mg/L (89 nM-
(a) SO/, S2oa2·. Hot spring water Dilution Tokyo Kasei, (a) 10:90 or (b) 20:80 vlv ACN-H20 Suppressed 0.03-0.29 [172] S20s2°, SaOe2° Kaseisorb LC ODS containing 0.2 mM phthalate and 7 conductivity mg/L (1.4-9.3
(b) SO/" /S20/°, super mM TPAOH (pH 5.0 with µM)
S2oa2·. SaOl, CH3COOH)
S40a2°, SsOa2°, s6oa2·
SOJS2oa2·, S20a2·, Gold extract Dilution Dionex MPIC-NG1 and 26:74 ACN-H20 containing 3.0 mM Suppressed 0.04-0.3 mg/L [112,170) SaOa2°, S40l, solutions NS1 TBAOH and 2.0 mM Na2C03 conductivity (0.25-1.3 µM) SsOa2°
s2oa2·, s2oa2-. Standards Dionex MPIC-NG1 and 20:80 ACN-2 mM TBAOH and 1 mM Suppressed [125] S40a2· NS1 Na2COa conductivity
S20/°, SaOa2°, Standards Chrompack cyano- 55:45 MeOH-H20 containing 0.1 M UV (215 nm) 1.8-34 µM [164] S40s2", SsOa2° bonded silica Sil 60-D Na2HPOJ0.1 M KH2POJ0.1 % (wlv)
10-CN CTABr
S20/°, SaOa2°, Standards Dionex MPIC-NS1 4:27:69 MeOH-ACN-H20 containing UV (254 nm) [174) S40a2", Ss0a2°, 1 mM Na2C0a and 2 mM TBAOH SaOa2·
....... S20/°, SaOl°, Hot spring waters A Shinwa Ultoron VX 20:80 v/v ACN-H20 containing 6 mM UV (230 nm) 10-30 nM (not [175)
~ S40l, SsOa2°, ODS TPAOH, (pH 5.0 with CH3COOH) specified for
§- Saoa2· SaOa2°)
6 S2oa2·. SaOl, Dithionite or Derivatisat1on of dithionite to Polymer labs. PRLP-S 25:75 v/v ACN-H20 containing 1 mM UV (215nm) [168, S4oa2·. SsOl, Rongalite Rongallte 8 µm particles with Na2COa and 2mM TBAH2P04 (pH 176,177] Sa0a2· (HOCH2S02") Knauer PRP-100 guard 7.7)
standards
~ \0 Ill ('f)
;;'. Ill
Q:;:
~ ::$ -i:: ~ Table 1.2 (Cont.) ·-~
Species Detected Sample Sample Preparation Column Eluent Detection Detection
Ref. Limit
S20a2", S30t, Hot spring water Refrigeration of standards. Tosoh TSK gel ODS- 20:80 ACN-H20 3mM TPAOH and 6 PCRwith 0.001-4.3 µM [178) S40a2·, Ss0a2·, C03
2· to stabilise thiosulfate Ts5µm mM CH3COOH (pH 5.0) indirect UV at SeOa2° standard. 350nm
S30a2°, S40t, Sea water Pre-concentration, chloride Hamilton PRP-1 (10 25:75 ACN:H20 containing 10 mM UV (205 nm) -0.3-1 nM [179] SsOs2° minimisation µm) with Brownlee Waters low-UV PIC-A/1 mM
PRP-1 guard cartridge Na2C03'1 mM NaHC03'30 mM NaCl/3 mM NaCI04.
s3oa2·. s4ot. Crater lake water Removal of Cl", So/·, S2oa2· Showa Denko IC 1-613 3.3:96.7 THF-H20 containing 1 mM Non-suppressed [61, 180] Ssoa2· polystyrene gel Phthalic acid 0.5 mM TBAOH (pH conductivity
3.5)
s,ot, (x = 4 to Crater lake water Addition of HAH, or exclusion Spherisorb S30D2S ACN-H20 containing 0.1 M KH2P04 UV (220 nm) 0.7-52 µM [61,180,181] 10) of 02 [61]. Refrigeration [181]. ODS 3 µm + various concentrations of TBAOH (quantitation
to pH 3.5 with HJP04. limits, no value for
s.ot. x> 6)
s,ot (x = 4 to 18) Thiobacil/us Centrifugation Octadecylsilane (C18) 30:70 vlv ACN-H20 with linear UV (215 nm) [182] ferrooxidans Brand not specified gradient of Na2C03 (2 mM) and cultures TBAH2P04 (1 mM) to zero
s,ot (x=5 to 11) Reaction Mixture Dionex MPIC-NS1 40:60 ACN-H20 containing 1 mM UV (254 nm) [174] Na2C03 and 2 mM TBAOH
....... S,Oa2· (x = 5 to at Synthetic Keystone Scientific 50:50 24 mM TBAH2P04 (pH 3.6-I.. UV (254 nm) [183]
Ill least 32), S0 polythionate Partisil 5 µm ODS-3 4.0)-ACN. ACN gradients also used. -§< solutions reverse-phase
Cl s,ot (x = 9 to 22) Thiobacil/us Centrifugation Octadecylsilane (C18) 40:60 v/v ACN-H20 with linear UV (215 nm) [182] ferrooxidans Brand not specified gradient of Na2C03 and TBAH2P04 cultures (initially both 2 mM) to zero
Chapter 1 Literature Review
the analytes. For example, polythionate separations are easier to achieve using
ion-interaction methods since retention on anion-exchange resins can be
extremely high as the value of x in Sxoi- increases. Tables 1.1 and 1.2 list the
anion-exchange and ion-interaction methods currently available for sulfur species
analysis, with the separated analytes being listed in order of their elution. Some
methods have additionally separated other anions, for example chloride, however
only the relevant sulfur anions have been listed. Co-elution of analytes has been
indicated by a '/' between the two relevant ions, whilst similar methods have been
grouped together as one entry in the table. The information shown for a particular
entry in the table refers to the first reference listed.
1.6.3.4 Resolution and Selectivity by Anion-Exchange and /on-Interaction
Chromatography
The separation selectivity of sulfur species in both anion-exchange and 1on
interaction chromatography generally results in the following elution order:
(1.18)
The metallo-thiosulfates and polysulfides (S/) are not included m this list
because the retention behaviour of these species has not been sufficiently
characterised. The separation of polysulfides has been examined in a variety of
papers [150,165,167], but with only limited success as will be discussed later, but
they have been shown to be eluted after thiosulfate. No methods for the
separation of the metallo-thiosulfates were identified, possibly due to there
previously being no requirement to quantify these ions. Elemental sulfur, being
both neutral and insoluble in water, has also been omitted from consideration
since it is not amenable to determination by IC. However, Kupchella [183] has
37
Chapter I Literature Review
noted that elemental sulfur could be eluted using ion-interaction chromatography
in the presence of long chain length polythionates. This was explained in terms of
micelle formation of the polythionates which enabled solubilisation of elemental
sulfur.
Some variations to the selectivity order given in 1.18 have been reported. A
Sykam LCA A08 polymer-coated silica-based anion-exchange column used with
an eluent of 10:20:80 MeOH-H20~ACN containing 200 mM sodium chloride was
able to separate thiosulfate, trithionate and tetrathionate in the reverse order to that
given in Eqn. 1.18 [159]. The selectivity of this column was the same in a purely
aqueous eluent containing 100 or 50 mM sodium chloride, however the use of a
5:60:35 MeOH:H20:ACN with 200 mM eluent gave an elution order of
trithionate, thiosulfate and tetrathionate. Thiosulfate has been eluted prior to
sulfite and sulfate using a mid-run column-switching technique, with thiosulfate
passing through the guard column only before reaching the detector [104,139].
Story [131] and Ono [150] have both been able to alter the selectivity of sulfide,
with the former study achieving elution of sulfide after thiosulfate, and the latter
the elution of sulfide after sulfite, but no explanation was provided as to the
reason for the change in selectivity. Story did note that on the VYDAC-SAX
column, when used in the phosphate form, sulfite and sulfate were unretained. It
has also been i;eported, again with no explanation, that sulfate can be eluted prior
to sulfide using a carbonate eluent and an Oka-1 resin [148].
The difference in retention behaviour between the earliest (sulfide) and the latest
(higher polythionates) eluted species is extremely large and has prevented any
38
Chapter I Literature Review
separation of all sulfur species in one run. However, it is improbable that any
sample would contain all the sulfur anions considered in this review because such
a mixture would be unstable due to reactions between the various species [58].
Retention behaviour is the result of a number factors, particularly the charge on
the analyte anion. This can be illustrated by the retention behaviour of sulfide,
which in an alkaline eluent exists predominantly in the form HS- (pKaz=13.9
[184]) and in acidic eluents as non-ionic H2S (pKa1 = 7.02 [184]). It therefore has
a lower retention than the other more highly charged sulfur species. Sulfite exists
as HS03- (pKaz = 7.18 [184]) in acidic eluent, which will reduce retention of this
species, again on the basis of charge. Specific information on the separation
mechanisms for the remaining sulfur ions is limited, although it is possible that
hydrophobic interactions could form a significant role for the polythionates as the
value of x in Sxoi- increases. A general discussion of factors that determine ion
exchange selectivity can be found elsewhere [113].
Separations of sulfur anions generally fall into one of two main categories - those
containing some or all of the less strongly retained species (sulfide, sulfite, sulfate
and thiosulfate) and those of thiosulfate and the polythionates. Dithionate
separations usually include sulfate and/or thiosulfate and occasionally
polythionates as additional analytes. Different chromatographic techniques are
preferred for the separation of each of the two main groups. While sulfide,
thiosulfate, sulfate and sulfite have been determined by both anion-exchange and
ion-interaction chromatography, they are most commonly chromatographed using
the former technique. The generally stronger retention observed with anion
exchange resins is more suited to the separation of these comparatively weakly
39
Chapter I Literature Review
retained ions. On the other hand, ion-interaction techniques have found more
:frequent application to the separation of the polythionates due to the generally
weaker analyte-stationary phase interactions possible with this separation method
when compared with anion-exchange resins. There does not appear to be any
literature reference to the use of IC for the separation of higher polythionates
(Sxoi-, x >6), other than by ion-interaction techniques.
There are many methods in Tables 1.1 and 1.2 used to separate three of four ions
from sulfide, sulfite, sulfate and thiosulfate, but only a few determine all four
simultaneously [101,107,142,143,147,148,l51]. Even fewer of these actually
provide a chromatogram to allow assessment of the resolution between the various
peak pairs. In some cases multiple detectors [143,148,151] were used in order to
enable detection of all four species. Divjak and Goessler [147] were able to
separate these four sulfur anions in ~ 17 .5 min on a Dionex AS 12A column with
AG12A guard using a sodium hydroxide step gradient. The success of the
separation was dependent on the use of the element-specific MS detector since
chloride was co-eluted with sulfide, which would cause problems if a universal
detection method, such as conductivity, was used.
An alternative technique for sulfite, sulfate and thiosulfate sulfide (and
thiocyanate) determination was recently described by Jekakumar et al. [149],
using a Dionex AS4A-SC column with carbonate/bicarbonate eluent and
suppressed conductivity. In this method sulfide was determined indirectly by
injecting two aliquots of each sample, one of which had been treated with an
ammoniacal peroxide solution to convert all the sulfur species present to sulfate.
40
Chapter I Literature Review
From the untreated solution the equivalent sulfate concentration of all the sulfur
anions under direct investigation was calculated and compared with the treated
solution to determine the sulfide by difference. However, this method is only
applicable in the absence of further sulfur compounds.
Separation of thiosulfate and the lower polythionates (x = 3 to 6) has been
achieved by a number of authors, as is apparent in Table 1.2. Those using UV_
detection clearly demonstrate the relatively poor detection limits attainable for
trithionate by this methodology. Kupchella [183] obtained good resolution of the
polythionates S50l to S320l- in 46 min on a Keystone scientific Partisil- 5 µm
ODS-3 column with a gradient between (A) a solution of 24 mM TBAH2P04 (pH
4) and (B) ACN. This represents the most comprehensive polythionate separation
reported to date.
The determination of polysulfides by IC has been problematic
[127,150,151,165,167] with accurate results and adequate separation being
difficult to obtain. Uddin et al. [127] concluded that with the~ anion-exchange
method polysulfides broke down to sulfide and elemental sul:fur on the column.
Other anion-exchange methods have involved derivatisation of the polysulfides,
either prior to the separation using cyanolysis to form thiocyanate and sulfide
[151] or during the separation using sulfitolysis to form thiosulfate and sulfide
[150]. Ion-interaction HPLC techniques have been the most successful for direct
separation of polysulfides [167] from other sulfur anions, but even here only a
single peak for the unresolved polysulfides was observed. The inability of such
methods to separate individual polysulfides is caused by the rapid equilibria
41
Chapter 1 Literature Review
existing between the different members of the series. Witter et al. [165] has
provided the best separation of polysulfide species and in this study derivatisation
of thiosulfate and sulfite was achieved with 2,2' -dithiobis( 5-nitropyridine)
(DTNP). In the subsequent chromatographic separation, peaks were observed in
the chromatogram that were attributable to derivatives of a 90% S4 2
- sample
known to be contaminated with other polysulfides.
Reports on the separation of sulfur species with non-commercial columns are few.
Chapman and Beard [160], used a column packed with activated carbon to
separate thiosulfate and the polythionates. Baseline resolution was not achieved
between the thiosulfate-trithionate and tetrathionate-pentathionate peak pairs. No
subsequent papers have appeared using this technique, a possible reason given by
Story [131] being that it is difficult to prepare reproducible columns. Vlacil and
epoxidised copolymers with diethanolamino groups and used the resin to resolve
thiosulfate and polythionates (x = 3 to 5). The separations obtained in both papers
can be bettered on commercial resin materials, as can be seen in Tables 1.1 and
1.2.
1.6.3.5 Su/fur Jon Detection in Jon-Chromatography
A broad range of detection techniques has been used in conjunction with the IC
methods, with by far the most popular being UV spectrophotometry and
conductivity. Most of the sulfur species covered in this review have at least some
absorbance in the UV region 200-254 nm, with the main exceptions being sulfate
and dithionate [113,185]. Trithionate absorbs relatively weakly compared with
the other polythionates [186] and as a result detection limits for this ion using UV
42
Chapter 1 Literature Revzew
detection are relatively high, as noted by a number of workers [159,160,164,175].
Indirect UV detection has been used as an alternative for separations of non-UV
absorbing analyte anions, such as sulfate [94,130,154,157].
Conductivity detection in both the suppressed and non-suppressed forms has also
found wide application (see Tables 1 and 2). This technique is more universal
than direct UV detection and while this means that it can detect all ionic sulfur
species, it will also detect any interfering ions in the sample matrix. Sulfide
cannot be determined sensitively and reliably in suppressed systems since the
suppressor converts this ion to the non-conductive species H2S [102,113,187].
Of the electrochemical detection techniques other than conductivity, the most
frequently reported have been DC and pulsed amperometry for detection of
sulfide, sulfite and/or thiosulfate [102,125,128,140,142]. The electro-inactive
sulfate ion has also been determined by indirect amperometry in a suppressed IC
system ·[142], where the detection electrode was used to measure the change in
eluent pH that occurred with the elution of strong acid anions in suppressed IC
[113]. In some papers [102,125] a dual detection system was used incorporating
amperometry and conductivity in order to improve the detection limits of ions
such as sulfide and thiosulfate. Amperometry has the problem of electrode
poisoning, as noticed in the detection of sulfide by Poulson and Borg [101] using
DC amperometry with a silver electrode. These authors postulated that organic
materials in the samples fouled the detection electrode. A gradual increase in the
signal for sulfide from a clean silver electrode over the first few injections prior to
attaining consistent results has also been reported [102]. This effect has been
attributed to the formation of a layer of silver sulfide on the electrode, enhancing
43
Chapter 1 Literature Review
the electrode reaction. The layer also enhanced the detection of other sulfur
species, notably thiosulfate and sulfite.
Literature also exists for techniques involving polarographic detection. Sulfide,
sulfite and thiosulfate have been detected using sampled DC polarography [127]
and a method has been developed for thiosulfate and the polythionates (x = 3 to 6)
[163] where fractions of the column effluent were collected and analysed
polarographically. The chromatographic method was unable to separate tri- and
tetrathionates, and the concentrations of these could only be determined through
calculation after the polarographic experiments were completed. No detection
limits were specified in either case.
Inductively coupled plasma-mass spectrometry (ICP-MS) has recently been
demonstrated as a further detection method for sulfur species [147]. A suppressed
IC method developed using this detector has been applied to the separation of
sulfide, sulfite, sulfate, and thiosulfate using a NaOH eluent, with detection of
these ions being effected as 32S160+ m/z = 48. This particular species was chosen
due to high background at the two main sulfur isotope m/z ratios of 32 and 34.
Carbonate eluents could not be used since carbon suppressed the ICP-MS signal
for 32S160+ and chemical suppression of the eluent was also required to remove
sodium ions which would otheiwise salt out and block the detector interface.
Separation of matrix ions from the sulfur species of interest is usually not
required, but high concentrations of ions such as chloride that are co-eluted with
sulfide under the chromatographic conditions used will suppress the signal
obtained for sulfide. Detection limits were between 35-270 µg/L (1.1-2.5 µM)
44
Chapter I Literature Review
which, although being low, are still about an order of magnitude higher than for
some suppressed conductivity, UV and post-column reaction (PCR) methods.
However, an advantage oflCP-MS is its selectivity for sulfur species.
Wolkoff and Larose [161,162] employed a PCR system whereby the
polythionates (x = 3 to 6) were reacted with hydroxide to form thiosulfate and
sulfite. These products were oxidised with cerium(IV) to produce cerium(III)
through the following reactions:
SzO~- +8Ce4+ +5H20~2so~- +8Ce3+ +lOH+
SO~- +2Ce4+ +H20~SO~- +2H+ +2Ce3+
(1.19)
(1.20)
The cerium(III) generated in this way was then detected usmg fluorimetry.
Problems with the technique were that the reactions respond to any oxidisable
material in the sample, leading to possible interferences, and there was no
response to · sulfate. The procedure outlined in this paper has become somewhat
outdated, in that similar or improved detection limits have been reported for
methods utilising suppressed conductivity detection [112,172]. A new method
using the technique has recently appeared for sulfite and thiosulfate [188] and
demonstrates sub-µM detection limits. Story [131] developed a method that
utilised bromine to convert sulfide, sulfite, thiosulfate and the polythionates (x = 3
to 6) to sulfate. The reaction for thiosulfate is:
(1.21)
The resultant sulfate was detected as Fe(S04t by UV spectroscopy at 335 nm
after the introduction of iron(III). This is the most universal PCR system that has
45
Chapter 1 Literature Review
been developed for sulfur species and has detection limits in the range 20-100
µM, showing that it is less sensitive than many of the other detection methods
available.
PCR detection systems that determine a small number of sulfur anions also exist.
Sulfide, thiosulfate and the polythionates (SxO/-, 3 ~ x ~ 6) have all been
determined through their ability to catalyse the reaction of iodine with azide
(1.22)
This PCR was followed by indirect detection of the excess iodine as tri-iodide at
350 nm [98,178]. An alternative method has used a similar approach for sulfide,
sulfite and thiosulfate, except in this case the catalysed reaction was the
degradation of potassium bromate in hydrochloric acid, with detection at 522 nm
[148]. Other methods [96,98] have used the following iodometric reactions as the
basis for a PCR system to detect sulfide, sulfite and thiosulfate
2820~- +12 ~840~- +21-
s~- + 12 ~s0 + 21-
so~- + 12 + H2o~so~- + 2r + 2H+
(1.23)
(1.24)
(1.25)
The iodine was stabilised in solution as the tri-iodide ion and detection was
achieved by measuring the reduction in the absorbance of tri-iodide. All of the
above techniques provide very low (sub µM) detection limits, particularly those
involving catalysis.
1.6.3.6 Pre-Chromatographic Derivatization and Preconcentration
Pre-analysis derivatization of sulfur anions has been used to obtain low detection
limits and to prevent degradation of these ions prior to analysis. The compound
46
Chapter I Literature Review
(a)
0 2N () 5-S ~ ) N02
(b)
Fig. 1.3 Chemical structures of (a) monobromobimane (b) DTNP.
47
Chapter 1 Literature Review
2-2'-dithiobis(5-nitropyridine) (DTNP), illustrated in Fig. l.3(a), is a typical
derivatisation reagent which has been used for the determination of thiosulfate and
sulfite [165,166], after conversion, via a displacement reaction, to disulfide
derivatives. A by-product of the reaction is 2-mercapto-5-nitropyridine. The
reagent also reacts with polysulfide species but quantitative detection was not
possible because of a lack of standards for identification of individual
polysulfides. Detection limits in the mid-nM range were attained in conjunction
with preconcentration of the derivatives on Sep-Pak C18 cartridges. The
derivatives were found to be stable on the cartridges for two weeks if kept
refrigerated at <5°C. The technique has been applied to seawater [166] and
effluent from petroleum production [165]. One problem with the method was that
derivatisation was found to perturb sulfur speciation [165], since results by this
method were on average 33% higher than those observed for the same samples
using differential pulse polarography.
A second derivatization reagent, monobromobimane (MBB, shown in Fig. l .3(b ))
has been applied to sample matrices such as human serum [126] for the
determination of sulfide, sulfite and thiosulfate, through their conversion to
fluorescent derivatives formed by displacement of bromide in the molecule by the
sulfur containing ion. These derivatives have also been separated using reverse
phase HPLC [189-192]. No substantial comparative studies have been conducted
with this reagent so possible perturbation effects on the equilibrium speciation of
sulfur caused by pre-treatment are unknown. The bimane derivatives formed
from seawater samples were found to be stable for several months if kept frozen at
48
Chapter 1 Literature Review
-20°C [190]. Detection limits in the mid-nM range were achieved with this
system.
Preconcentration of the polythionates (x = 3 to 5) on a Waters IC-PAK anion
exchange pre-column followed by separation by ion-interaction chromatography
on a Hamilton reversed phase column was reported by Weir et al. [179]. Using
this technique extremely low detection limits for these ions of between ,...,Q.3-1 nM
were attainable (0.08 -0.2 µg/L). One problem with the preconcentration method
was that under the conditions required for elution from the pre-column and
separation, thiosulfate was eluted with the solvent front and therefore could not be
determined accurately.
1.6.4 Determination of Su/fur Species using Capillary
Electrophoresis
1.6.4.1 Introduction [193, 194]
CE is an electromigrative separation technique in which the separation mechanism
is effected by the differing rates of migration (electrophoretic mobilities) of the
analyte ions in an electric field. In this technique separations are carried out in a
nanow bore capillary (I.D. typically 20-100 µm O.D. 375 µm) usually made of
fused-silica coated with polyimide, the latter used to overcome the fragile nature
of the silica. A CE instrument configuration is shown Fig. 1.4. The capillary is
filled with, and each end immersed in, an ionic-solution at the desired pH known
as the "background electrolyte (BGE)". An electrode from a high-voltage power
supply is also placed in each of the electrolyte reservoirs. Samples are injected
into the capillary by replacing the inlet electrolyte reservoir for' a time with the
49
Chapter 1 Literature Review
Capillary
Inlet Buffer/ Sample Injection
High Voltage Supply
Data Collection
Outlet Buffer
Fig. 1.4 Diagram of a typical capillary-electrophoretic system. Adapted from [194].
50
Chapter 1 Literature Revzew
sample solution. Injection is usually facilitated by the use of hydrodynamic (a
difference in height between the inlet and outlet of the capillary), pressure driven,
or electrokinetic (applied voltage) means. After this process is completed, the inlet
BGE is returned and separation is effected by applying a high voltage across the
capillary, typically up to ±30 kV. This limits the size of the capillary that can be
used since otherwise the heating, known as Joule heating, generated by the flow of
a current in a conducting medium, would not be adequately dissipated and the
liquid would boil. On application of the voltage the ions then separate according
to differences in their electrophoretic mobilities. Near the outlet of the capillary,
detection is effected, most commonly through the use of UV spectrophotometry.
Which ions migrate towards the detector in a CE analysis depends on the polarity
of the applied voltage, the effective mobility of the ions under investigation, and
also the strength of the electro-osmotic flow (EOF). EOF is a phenomenon caused
by the negative charge of ionised silanol groups on the wall of the fused-silica
capillary, which results in the formation of an electrical double layer. That closest
to the stationary silanol groups is essentially immobile (Stem Layer), however the
adjacent, more diffuse zone (Outer Helmholtz Plane), is not. Under an electric
field the cations in this second zone migrate towards the cathode, along with their
waters of hydration. The hydrogen-bonding properties of water cause this effect to
continue on to the bulk solution in the capillary, with the result that the entire
electrolyte solution being drawn towards the cathode. As a result the observed
mobility of an ion in a CE system is the vector sum of the electrophoretic mobility
of the ion, and the EOF that exists in the capillary. EOF is dependent on a number
of factors, notably pH, and can also be influenced or reversed by the use of
various modifiers in capillary pre-flushing solutions and/or the electrolyte.
51
Chapter 1 Literature Review
The advantages of CE over IC are that it gives faster, more efficient separations,
while the disadvantages are that the technique is not as robust, reproducible and
generally shows higher limits of detection.
1.6.4.2 Separation and Selectivity for Su/fur Anions by Capillary
Electrophoresis
CE is a less developed technique in comparison to IC for the analysis of inorganic
ions [195] but there have been many separations reported that include one or two
sulfur anions [196]. These will not be covered here, as further information can be
obtained in the review by Kaniansky et al. [196]. Table 1.3 outlines the
separation of sulfur species that have been performed using CE. Some of the
methods shown have also included the separation of other anions but only the
relevant sulfur anions have been listed. As with the chromatography tables, co
elution of analytes has been indicated by a '/' between the two relevant ions and
similar methods have been grouped together as one entry. The information shown
for a particular entry again refers to the first reference listed. Analytes are listed
in migration order.
Most research into the separation of sulfur anions by CE has focused on sulfide,
thiosulfate, sulfite and sulfate, with separation generally being achieved with co
electro-osmotic flow (EOF) through. the addition of an EOF modifier to the
background electrolyte (BGE). In this separation mode the migration order is
generally:
(1.26)
Separations of other sulfur anions are too few in number to warrant inclusion of
their migration order in the above series, although the two papers that have
52
~ M <ll V)
·;;: <ll
i::t:;
~ :::! ..... !:: -~ Table 1.3 Capillary electrophoretic methods for the determination of sulfur species. ~
Species Detected Sample Sample Preparation Electrolyte composition (pH, voltage applied) Detection Detection Ref.
Limits
s2ot. s 2-, sot Standards 0.1 M Tris/HCI buffer (pH 8.75, -7 kV) UV (200 nm) (197]
s2ot. s 2-, sot Photographic waste Dilution. On-capillary 20 mM tris-HCI (pH 8.5, -30 kV) Direct UV (214 nm) of 0.5-2 µM [198] solutions reaction with '2 to form r. iodide formed from
S03 2- standards in 02 derivatisation. free water, s 2- standards by [98].
(a) s2ot. sot. s 2- Stainless steel corrosion (a) used for high er (a) 25 mM NaCl, 4 mM Waters OFM Anion-BT in Direct UV (214 nm) [199)
s20/-. s 2-, so/-solutions samples, (b) used for OH form (-20 kV)
(b) high so/- samples. (b) 1.5 mM Na2S04, 2 mM OFM Anion BT in OH form (pH 10.5, -20 kV)
s20/-. sol-. so/- Standards Formaldehyde to 5 mM Na2Cr04, 20 µM CTABr (pH 10, -20 kV) Indirect and direct UV 0.17-0.50 [99] stabilise so/-. and (214, 254 nm) mg/L (1.5-6.2 degassed water to stabilise s 2- standards
µM)
s2032-, sol. so/- Standards, studying 5% PrOH added as 9.5 mM K2Cr201, 1 mM DETA, 5 % v/v PrOH (pH Indirect UV (254 nm) 3-7 µM [103] oxidation of sol stabiliser for sot. 10.3, -25 kV).
s2ot. sot, s2·1sot Standards On-line dialysis 6 mM Na2Cr04, 32 µM CTABr, 3 mM H3B03 Indirect UV (372 nm) [200) adjusted to (pH 8.0, -25 kV)
s2ot, s 2-, sol. sot Kraft black liquor Dilution with degassed 32:68 ACN:5 mM chromate, O.OQ1 % HDB wlv (pH Indirect UV (185 nm) 0.5-1 mg/L (5- [62] water 10.8, -30 kV) 31 µM)
s2ot. sol. s 2-. sot Kraft process liquors Dilution 5 mM Na2Cr04, 3.45 µM H2S04, 0.5 mM Waters Direct and indirect UV (201] NICE-Pak OFM Anion-BT (-20 kV) (185, 214 or 254 nm)
-., s20/-, sot. s 2-, so/· Kraft process liquors On-line dilution 3.5 mM K2Cr04, 30 µM CTABr (pH 11, -25 kV) Indirect UV (372 nm) [202] i...
~ s20/-, sol. s 2-, so32· Filtration., formaldehyde !} Open-pit mining lake 50 mM CHES, 35 mM LiOH, 0.03% Tnton X-100, Conductivity 8-50 µg/L (83 (99)
,:::: water to stabilise sol-. and pre injection rinse of 1 mM CTABr (-25 kV) nM-1.6 µM) Cj degassed water to
stabilise s 2· standards
s20/-. sol-. s 2·, so/· Kraft process liquors Dilution 5 mM Na2Cr04, 0.5 mM Waters Nice-Pak OFM Indirect and direct UV (203] Anion-BT (pH 10.6, -20 kV) (214, 254 nm)
;;:: ..q-~ 1£) ·-;::.. ~
c:i:: ~ i! ~ -~ TABLE 1.3 (Cont.) >--1
Species Detected Sample Sample Preparation Electrolyte composition (pH, voltage applied) Detection Detection Ref. Limits
s2ot. sot. s 2-, so/· Kraft process liquors Dilution and helium 2.25 mM PMA, 6.5 mM NaOH, 0.75 mM PDA (350/50 nm) -1 mg/L (9-31 [204] degassing. hexamethonium hydroxide, 1.6 mM TrEA (pH µM)
11.2, -18 kV)
s2ot. so/·, s 2·, sot Kraft process liquors Dilution with NaOH (pH 20:80 ACN:5 mM Na2Cr04, 0.001 % w/v HDB (pH Direct and indirect UV [205,206] 11) and degassing 11.0, -15 kV). (185, 214, 254 nm)
s2ol·. so/·. s 2·• so32· Standards, beverages 6 mM K2Cr04, 3 mM boric acid, 23 µM of CTABr Indirect UV (372 nm) [207] and vinegar (pH 8. 75, -25 kV)
S20a2·, S2032·, so/· Standards 2.5 mM PMA, 6.5 mM NaOH , 0. 75 mM Indirect UV (250 nm) [208] hexamethonium hydroxide, 1.6 mM TrEA (pH 7.7, -30 kV)
s2ot. so/·, s2ol", s40{ Standards 3 mM NTS, 2 mM DETA, 100 mM H3B03, 5 mM Indirect UV (284 nm) -BO µg/L for [209] Na2B401 (pH 8, -30 kV) so/· co.8
µM)
s2ol·. so/·. s4oa2· Natural clayey water 10 mM TRIS, 1.5 mM PMA, 0.5 mM DETA (pH 8, Indirect UV (214 nm) 3-20 µM [64] (injected separately) ' s 2· -20 kV)
s2ot. so/·, so/·, s4oa2· Photographic waste Dilution 5 mM H2Cr04, 1 mM hexamethonium hydroxide Indirect UV (254 nm) 0.8-8.4 µM [210] solutions (pH 8.0 with TrEA, -30kV) (Not specified
for S40/")
s20/·, so/·. s3ot. sol·. Standards for salt purity 2 mM sulfosalicylic acid-0.5 Waters OFM-OH (pH Indirect UV (214 nm) 1.5-10 µM [211] s40/·, s 2· and solutions studying 7.0 with bis-tris, -25 kV)
reaction of sol· with S40a2·.
....... S20/·, S40{, SsOa2°, Th1osulfate electrolytic Dilution 5 mM KH2P04, 5 mM (NH4)2S04 (pH 5.0, -30 kV) Direct UV (214 nm) 0.8-8.4 µM [210] i.. SaOa2° oxidation solutions ~ §- S2ol·. S40a2°, SsOa2". Photographic waste Dilution 5 mM TBAAc, 5 mM (NH4)2S04 (pH 5.0, -30 kV) Direct UV (214 nm) 0.8-8.4 µM [210]
C5 Sa0a2· solutions
Chapter 1 Literature Review
considered polythionates [210,211] suggest that these ions migrate in order of
increasing sulfur number with trithionate slower than sulfate. Deviations from the
order given above have been reported with the most notable being sulfide
migrating more slowly than sulfite [199] and sulfide migrating between
thiosulfate and sulfate [62]. In· the former case the change in selectivity was
achieved through . . mcreasmg the EOF modifier (OFM anion-BT
(hexamethonium)) in the BGE from 2 mM to 4 mM. The change was attributed to
a relatively strong reduction in sulfide mobility caused by the hydrophobicity of
the ion and the formation of ion-pairs between sulfide and the EOF modifier.
These ion-pairs could be formed with free modifier ions and/or micelles that form
at this concentration. The faster migration of sulfide over sulfate was achieved by
adding acetonitrile to the electrolyte [62]. This addition reduced the mobility of
all the anions investigated, but the rate of decrease with increasing percentage of
acetonitrile (ACN) was higher for sulfate than sulfide, resulting in a change in
separation selectivity when the electrolyte contained ;;::25% v/v ACN. These
changes were attributed to solvation effects and to a lesser extent also to changes
in the pH of the BGE caused by addition of the organic solvent.
The work in the literature to date demonstrates two advantages of CE over IC,
these being shorter analysis times and greater separation efficiency [195]. This is
highlighted by the research of Volgger et al. [62] who reported separations of
thiosulfate, sulfate, sulfide, sulfite and other ions in less than 1 min in Kraft
pulping liquors.
55
Chapter I Literature Review
Separations including dithionate [208,209], trithionate [211] and/or tetrathionate
[64,209-211] have been reported. In one case [64] tetrathionate had to be injected
separately since precipitation occurred on mixing with the other three sulfur
anions being examined (thiosulfate, sulfate and sulfide), probably through the
sulfidolysis reaction (1.15). There are only two publications on the detennination
of thiosulfate and multiple polythionate ions [210,211]. The first examined
thiosulfate and polythionates (x = 4_ to 6) in photographic waste solutions, using
direct UV detection. The BGE in this case consisted of 5 mM
tetrabutylammonium (TBA) acetate and 5 mM ammonium sulfate at pH 5.
Migration occurred in order of increasing sulfur number. In developing the
separation method, it was found that the EOF modifier,
tetradecyltrimethylammonium hydroxide (TTAOH), caused peak broadening of
the polythionates, while a second modifier, hexamethonium hydroxide caused a
broad hexathionate peak, both presumably due to ion-pair formation. As a result,
the two BGEs developed in this work contained either no EOF modifier or a
modifier of relatively low hydrophobicity (TBAOH), which was used to increase
resolution between thiosulfate and bromide. Separation in both cases was
counter-BOP, which had no significant effect on the separation since the EOF
mobility was very low at the pH used. The second paper [211] employed indirect
UV detection at 214 nm with an electrolyte containing 2 mM sulfosalicylic acid
and 0.5 mM Waters OFM-OH EOF modifier, adjusted to pH 7.00 with bis-tris,
and was able to separate sulfide, sulfite, sulfate, thiosulfate, trithionate and
tetrathionate (and peroxodisulfate, S20s2} It is the most comprehensive method
for sul:fur anions to date and the only one to have considered the trithionate ion by
56
Chapter 1 Literature Review
CB. There are no CB separations in the literature to date which include, the higher
polythionates (x >6), the polysulfides or the metallo-thiosulfates.
1. 6.4.3 Sample Preparation, Preconcentration and Injection
Kuban and Karlberg [200,202,207] have developed coupled flow injection
analysis FIA-CB systems designed to reduce or remove the need for off-line
sample pre-treatment and to enable automated analysis. These FIA-CB systems
have been used to dilute Kraft process liquor samples on-line prior to the CB
separation of thiosulfate, sulfate, sul:fide and sulfite [202] and also for on-line
dialysis [200] and gas diffusion [207] pre-treatment methods. A range of anions
were examined including sulfate, sulfide, thiosulfate and sulfite. Dialysis
transport efficiencies were found to be quite low for the sulfur anions, ranging
from between 7-10%, which reduced the analytical sensitivity for these ions. The
gas dialysis process was only suitable for sulfide and sulfite since thiosulfate
decomposed to give sulfur dioxide (which interfered in the quantification of
sulfite) and elemental sulfur (which fouled the gas/liquid separation membrane).
Electrokinetic injection has been used to enhance the analytical sensitivity for
thiosulfate, sulfate, sulfite sulfide and thiocyanate [99]. This process reduced
detection limits for these ions to sub-µM levels, representing at least a twenty-fold
improvement over standard hydrodynamic injection, giving some of the lowest
detection limits observed in sulfur speciation studies by CB. The major problem
with this approach (which occurs with any electrokinetic injection method) was a
strong dependence of peak areas on sample composition, especially for highly
conductive samples which gave low enrichment factors. External calibration
curves were also non-linear as a result of this conductivity dependence, so
57
Chapter 1 Literature Review
standard addition methods were suggested as an alternative method for
quantifying analytes. However, care needed to be taken to ensure the standard
addition did not significantly affect the conductivity of the sample. For further
information on the advantages and disadvantages of electrokinetic injection
readers are referred to a recent review by Krivacsy et al. [212]. Other reports
have utilised electrokinetic injection for the determination of sulfur species
[197,200,202,207] although no mention was made of detection limits, linearity or
the dependence of sample conductivity on the amount of sample injected.
1. 6.4.4 Detection of Su/fur Anions
Indirect UV detection is the most commonly used technique in CE for the
detection of sulfur species, as is the case for most inorganic anions [196], although
direct and mixed indirect/direct detection have also been used. The primary
reason for the popularity of indirect UV detection is that many inorganic anions,
such as sulfate, show little direct UV absorbance. Tue most common indirect
detection ''probe" (i.e. the UV-absorbing co-anion used to visualise analyte
anions) employed in sulfur speciation studies has been chromate (see Table 1.3).
Indirect detection can be problematic if some of the analytes absorb at the
detection wavelength, leading either to reduced detection sensitivity or even
complete failure to detect some analytes, as was observed by Padarauskas et al.
for penta- and hexathionate at 254 nm using chromate or Tiron as the probe [210].
CB with conductivity detection was recently used for the determination of
thiosulfate, sulfate, sulfide and sulfite [99], although detection limits when
hydrodynamic injection was used were generally higher than for UV detection
techniques.
58
Chapter 1 Literature Review
Recently, a novel in-capillary derivatisation method was reported for the
determination of thiosulfate, sulfide and sulfite [198]. In this technique a plug of
an iodine solution was injected at the detection end of the capillary immediately
prior to the start of the analysis. On application of the separation voltage the
analyte ions migrated towards the anode, while the non-ionic iodine solution
migrated towards the cathode with the EOF. During the analysis the iodine zone
passed through each of the analyte zones, reacting to form iodide as one of the
products. The generated iodide was then detected by direct UV at 214 nm. The
main advantages of the method were that it improved the separation efficiency
and shortened the analysis time. The authors also note that such an approach could
be used for the simultaneous separation of UV and non-UV absorbing anions in a
single run with direct UV detection.
One of the main disadvantages of CE for inorganic ions are the limited number of
detection methods available, and relatively poor detection limits in comparison
with IC [195]. CE with UV detection for sulfur speciation is no exception, with
minimum detection limits achieved being approximately 1-10 µM for most ions.
Only the use of electrokinetic injection as a preconcentration tool has enabled
lower detection limits of sulfur ions by CE [99]. IC methods that attain
significantly lower detection limits are available and these can also be used for a
wider variety of sulfur anions than CE, as indicated in Tables 1.1 and 1.2.
1.6.5 Determination of Su/fur Species by /sotachophoresis
1.6.5.1 Introduction [213,214]
Like CE, capillary isotachophoresis (ITP), is an electromigrative technique, and
therefore also uses the differing electrophoretic mobilities of ions as a means of
59
Chapter 1 Literature Review
their separation. ITP is actually an older technique for the determination of ionic
species than CE. The apparatus required is similar to CE (a standard CE
instrument can be used), however there are a large number of differences between
the two methods. Unlike CE, the use of much wider capillaries is possible, as is
the use of segmented capillaries with different internal diameters. The wider bore
capillaries also make possible the use of chromatographic-type injection valves.
The electrolyte system used is discontinuous, with the buffer used initially to fill
the capillary or "leading electrolyte" different to that used after injection, known
as the "terminating electrolyte". In the case of anion separations, the leading
electrolyte contains an anion of mobility higher than those of the analytes of
interest in the sample, while the terminating electrolyte contains an anion of lower
mobility than those in the sample. Unlike CE universal detectors such as
conductivity are more commonly used than UV.
Separation of ions in isotachophoresis is based on the "regulating function" first
described by Kohlrausch, which bears his name. The value of the function is
independent of time and at a given point in the migration path is dependent only
on what ions are present in the capillary prior to the application of the electric
current. For strong, monovalent electrolytes, and assumptions of negligible
diffusion and constant ionic mobilities, once a current is applied the function can,
for any given point in the capillary, be expressed as shown in Eqn 1.27.
(1.27)
This function holds for a any given point m the capillary, wh,ere c, and
c~ represent the concentration of component i at a given moment in time, and prior
60
Chapter I Literature Revzew
(a)
L ...... .! i ;! T, I .... ···· ...... .. .
•• ···~daptatlon to ./ / leadlng :" (b)
I .. electrolyte I A A B
L L A B c T1 To B c c
I I
Fig. 1.5 Illustration of an isotachophoretic separation of anions A B C with leading anion L and terminating anion T, and the conditions that uL>uA>us>nc>uT. (a) Initial state in the capillary after sample injection. (b) Situation at some time (t1) after application of driving current. The sample zone has changed to adapt to the leading electrolyte, however the ions present have not completely separated, with mixed zones still present. ( c) Complete separation of the three species is achieved at some time (t2>t1). Adapted from [213].
61
Chapter 1 Literature Review
to the application of an electric current respectively, and Ui is the electrophoretic
mobility of component i. Whilst in general the system is more complex than this,
the basic principles are the same.
Descriptively, once a current is applied across the capillary, the ions in the sample
start to separate into individual zones in order of decreasing electrophoretic
mobility. This is illustrated for an anionic system in Fig. 1.5 with anions A-, ff,
and C- leading ion L- and terminating ion T, with the property that
uL>uA>ua>Uc>UT. After some time, this process will be complete and there
will be three zones with sharp boundaries between the leading and terminating
electrolytes, as shown in Fig. l.5(c). The cations of the system move in the
opposite direction. Under constant current conditions (note the difference between
this and CE where a constant voltage is usually applied), these bands continue to
migrate through the capillary with a constant velocity, hence the name
"isotachophoresis". In addition, the zone length of each sample component is
proportional to its concentration in solution. This contrasts greatly with
chromatographic and CE methods where each analyte appears as a peak, and it is
the area or height of this peak which provides the quantitative data. In
isotachophoresis, EOF is usually considered an undesirable phenomenon, and is
suppressed, for example, through additives to the leading electrolyte.
1. 6. 5. 2 Separation of Su/fur Species by /sotachophoresis
ITP does not enjoy the same popularity as IC and CE, with its use as a distinct
analytical technique receding [215], although it currently has a niche as a pre
treatment or pre-concentration tool for other methods [216]. This is reflected in
the lower number of references for the determination of sulfur-oxygen species by
62
Chapter 1 Literature Review
this method. Sulfite, sulfate and thiosulfate have been determined in sodium
sulfide solutions by ITP [105], using a leading electrolyte of 1:1 water-acetone
containing 5 mM hydrochloric acid and 10 mM L-histidine, whilst the terminating
electrolyte was 10 mM sodium acetate. Oxidation of sulfide and sulfite in the
standards was prevented by using degassed solutions containing 5% glycerine. A
further method using 1: 1 water-acetone containing 10 mM sodium hydroxide and
0.1% Triton X-100 as the leading electrolyte and 0.01 hexanoic acid as the
terminating electrolyte was shown to be suitable for the simultaneous
determination of dithionate, tetrathionate and sulfate in addition to other sulfur
oxygen species not considered in this review (peroxodisulfate, s2og2-, and
disulfate, S20l) [217]. This method was used in a study of the decomposition of
S20s2-.
Lucansky et al. [218] developed isotachophoretic methodology for the
determination of a variety of compounds, including thiosulfate, sulfate and sulfite,
m reaction solutions from the preparation of N-morpholino-2-
benzothiazolesulphenamide. A variety of leading and terminating electrolyte
systems was examined, with the optimal system containing calcium as an additive
to separate the chloride and thiosulfate zones. A method also exists for the
determination ofthiosulfate, sulfate and sulfite in sulfite pulping liquors [219].
ITP has also been used to study oxidation of reduced sulfur compounds by
Thiobacillus ferrooxidans bacteria [220]. Two methods were required to
determine sulfate (first method), thiosulfate and tetrathionate (second method).
Both methods used a leading electrolyte containing ~-alanine/hydrochloride with
63
Chapter 1 Literature Review
calcium chloride as an additive. The terminating electrolytes were citric acid for
the analysis of sulfate and capronic acid for the analysis of thiosulfate. When
using the thiosulfate method some unidentified ions were also detected and it was
suspected that these were other polythionates present in the sample matrix.
Detection limits of 4 and 7 µM were attainable for sulfate and thiosulfate,
respectively.
1.6.6 Other Separation Techniques
Various other separation techniques have been used for sulfur speciation, although
with the possible exception of ITP, to a much lesser extent than those already
discussed. These are discussed briefly below.
1.6.6.1 Planar Chromatographic Techniques
Early research involved the use of paper chromatography and paper ionophoresis
to separate sulfur species, particularly the polythionates. These methods have not
received significant attention for some years. For further information the reader
should consult reviews by Blasius et al. [65], Roy and Trudinger [91] or Szekeres
[58]. Interestingly, there is one report which describes the use of paper and thin
layer chromatography (TLC) [221] to study the gold thiosulfate complex,
although the techniques were not used to quantify this ion.
1.6.6.2 Ion-Exclusion Chromatography
Separations using ion-exclusion chromatography (IEC) are few and are mostly
concerned with the determination of a single analyte ion, usually sulfite [222-224]
or sulfide [225], which are ideally suited to this technique. IEC methods for
sulfite have been most commonly applied to foodstuffs and beverages, although
the separation of sulfite, sulfide and thiosulfate (in that order) on a mixed
64
Chapter 1 Literature Review
cation/anion exchange resin (Dionex CG5 and CS5 columns in series) using an
ion-exclusion eluent [226] has been reported. An iodometric PCR detection
method, similar to that already discussed in Section 1.6.3.5, was used [96].
[CH3(CH2h)4NHS04 Waters sulfate in water-methanol mixture)
88
Chapter 2 General Experimental
by dissolving a portion of the salt in a minimal amount of water, filtering the
solution (0.45 µm, Gelman Scientific, Lane Cove, NSW, Australia, and then re
precipitating the salt through the addition of ethanol.
All polythionates used were dried at room temperature (if required) and thereafter
stored below -5°C.
2. 1.3 Sodium Gold Thiosulfate Dihydrate
Some of the work described in Chapter 3, which was conducted prior to the
acquisition of a commercial standard, used sodium gold thiosulfate prepared in
house. Three methods were attempted [3-5], for the synthesis of this compound,
with the tetrachloroauric acid precursor also being prepared according to literature
methods [6]. Out of these techniques the best purity obtained was through
methodology based on that of Tavernier and de Meyer [4] from which a crop of
crystals was obtained and analysed to be ~89% pure based on gold content by
ICP-OES. The main impurity was determined to be sodium thiosulfate. The
compound was stored below 4°C.
2.1.4 Gold Ore Samples
The sulfidic (approximate gold concentration of 50 ppm) and oxide (approximate
gold concentration of 220 ppm) ore/concentrates used in this project were
supplied by Osleach Pty. Ltd. (Currumbin, Qld., Australia).
89
Chapter 2 General Experimental
2.2 Procedures
2.2.1 General Eluent, Electrolyte and Standard Preparation
Procedures
All sample solutions, eluents and electrolytes were prepared in water purified
using a Millipore Milli-Q (Bedford, MA, USA) purification system. All IC eluents
and bulk electrolyte solutions for the CB replenishment system were filtered
through a nylon 0.45 µm filter (Alltech Associates Pty. Ltd., Baulkham Hills,
NSW, Australia), prior to use. All other CB electrolytes were filtered through a
0.45 µm syringe filter (Gelman Scientific, Lane Cove, NSW, Australia).
2.2.2 Leaching Experiments
Leaching of gold bearing ores was conducted in a 1000 mL, 3-neck, flat-bottomed
flask. A sample (100 g) of the ore under investigation was slurried in water and
added to the flask, followed by 6.24 g of copper sulfate and 69 mL of
concentrated aqueous ammonia. The solution was made to a volume of -4 70 mL
with distilled water, heated to 50±3°C and mechanically agitated with an overhead
stirrer at -140 rev/min (for test of IC method) or -120 rev/min (for test of CB
method). The stirring arm used was glass with Teflon paddles. A condenser was
fitted to the flask to minimise evaporation. When the solution reached the
required leach temperature, 37.05 g of ammonium thiosulfate was added with the
aid of distilled water to give a final volume of 500 mL. The time at which the
thiosulfate was added to the leach was denoted zero time.
For sampling, the condenser was removed and approximately 6 mL (IC method)
or 3 mL (CE method) samples were removed from the leach solution with stirring
90
Chapter 2 General Experimental
still in progress. The solid present in the sample was removed by filtration
through a 0.45 µm nylon syringe filter, and the samples analysed immediately.
2.2.3 Calculations
For IC, retention data are often reported as the retention factor (k'), which for a
solute is defined as,
(2.1)
where tR is the retention time of the solute, and to is the time taken for an
unretained solute to pass through the same system to the detector.
For CB, the effective mobility (µeff) for a given solute was calculated according to
Eqn 2.2,
(2.2)
where LT is the length of the capillary in metres, Lo the length the capillary to the
detector in metres, V is the applied voltage in volts, and tM is the migration time
of the solute in seconds.
91
Chapter 2 General Experimental
2.3 References
[1] H. Stamm, M. Goehring, U. Feldmann, Z. Anorg. Alig. Chem. 250 (1942)
226.
[2] M. Goehring, Feldmann, U., Z. Anorg. Chem. 257 (1948) 223.
[3] H. Brown, J. Am. Chem. Soc. 49 (1927) 958.
[4] B. H. Tavernier, A. J. de Meyer, Method for the Preparation of Thiogold
(I) Compounds, British Patent No. 1132474, Gevaert-Agfa, 1968.
[5] P. Fagan, Personal Communication, 2000.
[6] W. Hiller, C. E. Zybill, In Synthetic Methods of Organometallic and
Inorganic Chemistry; W. A. Hernnan (Ed.), Georg Thieme Verlag, New
York, 1999; Vol. 5, p. 60.
92
Chapter 3
I
Fundamental Behaviour of the Gold Thiosulfate Complex
in an Ion-Chromatographic System
3.1 Introduction
Knowledge of the concentration of gold in solution during and after a leach is of
critical importance in the assessment and monitoring of any hydrometallurgical
process for extraction of this metal. As noted in Chapter 1, for a significant
portion of the literature on the thiosulfate process the only leach parameter
determined was the gold concentration in solution or percentage gold extracted.
The techniques used for this determination, namely, AAS, ICP-OES and fire
assay, do not allow identification of the gold species present in solution, nor the
concentrations of the other critical species in the leach, such as thiosulfate, the
polythionates and sulfate. The effectivei:iess of chromatographic methods to
quantify the gold present in these solutions has not previously been examined.
As also noted in the literature review, the predominant if not only, gold species in
the leach solutions is thought to be the bis-thiosulfate complex (Au(S20 3) 23} The
lack of previous information on the behaviour of this ion in chromatographic
systems and the above-mentioned importance of gold monitoring to the leach
process made a fundamental chromatographic study of this species an important
part of the project. Ion-interaction chromatography was chosen as the focus for
this work because of its previous use for the determination of gold and other metal·
cyanide species in gold cyanide leach solutions [1-4]. Additionally, the technique
is the method of choice for determination of the polythionate ions, which as
Chapter3 Fundamental Behaviour of the Gold Thiosulfate Complex in IC
previously noted will also require quantification in leach liquors. The use of the
same technique for the gold complex was therefore desirable as it provides the
most likely means of allowing simultaneous analysis. The choice of the main
column (Dionex NSl) and eluent system (acetonitrile-water/tetrabuytlammonium
hydroxide (TBAOH)/Na2C03) was also made on the basis that this system has
been used widely for the determination of polythionate ions.
This chapter outlines the results of this fundamental study into the
chromatographic behaviour of the gold thiosulfate complex.
3.2 Experimental
3.2. 1 Chromatographic Instrumentation
The ion-chromatograph used in this investigation was a Dionex DX-500
(Sunnyvale, CA, USA) system consisting of a GP50 gradient pump, AS50
autosampler with thermal compartment, CD20 conductivity detector, AD20 ultra
violet/visible (UVNIS) absorbance detector and/or a Waters (Milford, MA, USA)
486 UV detector, the latter connected to the data system via a Dionex UI20
universal interface. A pump flow rate of 1.0 mL/min, column oven temperature of
35°C and a 100 µL injection loop were used unless otherwise specified. For UV
detection a wavelength of 215 nm was used, whilst conductivity detection was
performed with suppression provided by a Dionex ASRS-Ultra operated in the
chemical suppression mode. The regenerant (usually 5 mM sulfuric acid) was
delivered by a Waters 510 high performance liquid chromatography (HPLC)
pump at a flow rate of 4.0 mL/min, again unless otherwise specified. All
chromatographic data were collected using Dionex PeakNet software version 5.1.
94
Chapter3 Fundamental Behaviour of the Gold Thiosulfate Complex m IC
For the anion-exchange work (Section 3.3.1.1), a Dionex EG40 eluent generator
module with a potassium hydroxide EluGen cartridge was fitted to the instrument
to generate the hydroxide based eluents required.
For photodiode array (PDA) detection of the gold thiosulfate complex (Section
3.3.1.1), a Waters Alliance 2690 HPLC instrument was used, fitted with a Waters
996 PDA detector. The chromatograms obtained were scanned between 200-600
nm at 1.2 nm intervals, with the data collected using Waters Millennium software
(version 3.05.01).
The research using a matrix elimination pre-column was facilitated by the use of
two Valeo Chemlnert 6-port, 2-position switching valves with electronic actuators
(V alco Instrument Co. Inc., Houston, TX, USA). Programming actuation of each
valve from the PeakNet software was achieved with two relay switches on either
the CD20 or GP50 instrument modules. The configuration of the valves was based
on a system previously described by Haddad and Rochester [5], with the main
modification to include the autosampler, which removed the need for the sample
to pass through the chromatographic pump. The modified system is illustrated
graphically in Fig. 3.1, and the program required to execute the matrix-elimination
procedure is shown in Table 3.1.
3.2.2 Columns and E/uents
Several different columns were used through the course of this investigation. The
majority of the experiments were carried out on a Dionex NGl ( 4 x 50 mm) and
95
Chapter3
Injection Loop
To Waste
FromAS50 Autosampler
Injection Valve
Fundamental Behaviour of the Gold Thiosulfate Complex zn JC
Analytical Column
Valeo Valve2
Valeo Valve 1
Fig. 3.1 Diagram showing switching valve configuration and associated tubing, for the matrix-removal pre-column procedure. All valves shown in position "A".
96
~ ~ a ~ ~ ;:s
-~ ~ :si t3 ~
'5 ~ !.. ;:s
-~ Table 3.1 Switching valve program for matnx-elimination column procedure. Eluent A= eluent for matrix elimination, c::i ~ Eluent B = eluent for backflush and analysis.
Fig. 3.2 (a) (i) Injection of gold thiosulfate solution conta1mng 0.914 mM (180 mg/L) Au(I), prepared from - 89% pure sodium gold thiosulfate dihydrate prepared in house. Conditions: (I), with suppressed conductivity detection, and 25 µL injection volume. (ii) Results of column fraction analysis of this injection for gold at 242.8 nm by GF-AAS (b), Gold solution prepared from the same standard containing 0.094 mM (18.5 mg/L) Au(I). Conditions: 2 x Dionex AG 16 guard columns, with hydroxide eluent program as described in Section 3.2.2, suppressed conductivity detection (external water mode) with current of 300 mA, regenerant flow rate of - 2 mL/min, provided by headpressure and a 10 µL injection volume.
101
Chapter3 Fundamental Behavzour of the Gold Thiosulfate Complex in IC
the gold peak, as is also evident from Fig. 3.2 (a). Note that the impure gold
standard used for this preliminary work would have cqntained a small amount of
thiosulfate impurity. However, as will be described later in the chapter this
affected the gold peak area, but not the observed shape of the chromatogram.
Quantification was not possible since recoveries were extremely high, for reasons
that could not be determined. With the location of the main gold peak verified its
spectrum was obtained between 200 and 600 nm to determine the optimum
wavelength of detection, with the result given in Fig. 3.3. No spectrum for the
complex could be found in the literature. Whilst detection of the complex seems
more sensitive at wavelengths around 200 ·nm, 215 nm continued to be used as a
compromise between maximising the sensitivity of the gold thiosulfate
chromophore and minimising the background noise of the eluent.
The appearance of the raised baseline suggested that there was some form of
partial dissociation or decomposition of the complex on the column. This
immediately raised questions about the cause(s) of this effect and its influence on
quantification of the gold complex by this technique. The detection limit and
linearity of the gold peak were therefore investigated to assess the effect on
quantification. The detection limit of the gold thiosulfate complex appeared not to
be a function of the detection sensitivity. Instead, a critical concentration of the
co:rµplex had to be injected before a portion would traverse the entire column in its
original form and this determined the lowest detectable concentration. This effect
is demonstrated in Fig. 3.4, showing an overlay of a series of progressively
102
Chapter 3
0.2
0.18
0 .16
0.14
5' !$. 0.12 CD g 0.1 tU .c 0 0.08 Cl)
.c <( 0.06
0.04
0.02
200 250 300
Fundamental Behaviour of the Gold Thiosulfate Complex in IC
Fig. 3.3 UV~visible spectra of the gold thiosulfate complex (blue line) obtained from an injection of a 0.196 mM (38.6 mg/L) solution (as gold), with a spectra of the raised baseline region (red line) and after the gold peak (green line) shown for comparison. Inset shows chromatogram (215 nm) indicating where the spectra were extracted. Conditions (I), no eluent suppression was used.
103
Chapter3 Fundamental Behaviour of the Gold Thiosulfate C.Omplex in JC
1.5 6.7
1.4
1.2 I 1.1 -tn
:i 0.9 ->. 5.4 -·:; 0.8 ~ u :i 0.6
"tJ c: 0 0.5 0
0.3
0.2
o.o 4.0 6.0 8.0 10.0 12.0 14.0 16.0 18.0
Retention Time (mins)
Fig. 3.4 Conductivity chromatograms from injection of a series of gold thiosulfate solutions prepared from ~89% pure sodium gold thiosulfate dihydrate, containing the indicated concentrations of gold (mg/L ). Conditions: (I). UV results at 215 nm were similar.
104
Chapter3 Fundamental Behaviour of the Gold Thiosulfate Complex in JC
increasing concentration gold standards. The length of the raised baseline
increased with increasing gold concentration, until finally enough was injected for
the gold peak retention time to be reached. The injection of gold thiosulfate at
concentrations between 0.046 and 0.228 mM (9 and 45 mg/L) as Au(I) showed
non-linear behaviour, with a quadratic curve more accurately describing the shape
of the graph.
3.3. 1.2 Addition of Thiosu/fate to the Eluent
The first hypothesis proposed to explain the cause of the thiosulfate peak and
raised baseline was dissociation of the gold thiosulfate complex in solution and
during the transition of the complex through the column, for example:
(3.1)
The raised baseline started immediately after the elution of the thiosulfate peak,
suggesting that thiosulfate contributed to this effect, which was consistent with
this hypothesis. If this was the cause, the rate at which this occurred must be
relatively slow compared to the speed of separation, as fast kinetics would result
in a single peak representing the average form of the associated and dissociated
complexes. Also, the addition of a small amount of thiosulfate to the eluent should
hinder dissociation and therefore prevent the formation of the raised baseline. A
similar approach has been successfully employed for copper(!) cyanide
complexes, in which cyanide was added to the eluent to reduce dissociation and
improve the peak shape [2,4].
Accordingly, the behaviour of the gold complex was examined in a series of
eluents of the same composition, apart from changes in the thiosulfate
105
Chapter 3 Fundamental Behaviour of the Gold Thiosulfate Complex in IC
concentration present. An overlay of the resultant chromatograms is provided in
Fig. 3.5, demonstrating that the addition reduced but did not completely resolve
the raised baseline problem. It should be noted that the presence of thiosulfate in
the eluent increased the baseline noise for both conductivity and UV detection, as
the species cannot be suppressed in this system and absorbs at the wavelength
used for UV detection. The detection limit experiment previously shown in
Fig. 3.4 was repeated, but in this instance the eluent contained 40 µM thiosulfate,
and ,showed similar behaviour to that observed without the thiosulfate addition.
However, it was not possible to determine whether the free thiosulfate peak
observed previously in gold thiosulfate samples had disappeared. The addition of
thiosulfate to the eluent caused a system peak at the retention time of thiosulfate
that prevented such an assessment.
It was also apparent that adding thiosulfate to the eluent markedly increased the
gold thiosulfate peak area, induced linear gold calibration curves (Fig. 3.6(a)) and
improved the peak area reproducibility (Fig. 3.6(b)). Fig. 3.6(a) also demonstrates
that there appeared to be an optimum concentration of thiosulfate with the
addition of 100 µM giving slightly lower peak areas at higher gold concentrations
than the 40 µM eluent. From Fig. 3.6(b) it is clear that even the presence of only
10 µM thiosulfate in the eluent significantly improved the %RSD values for the
gold peak area.
Finally, linearity was tested over a greater range corresponding to an Au(I)
concentration of0.0508-0.508 mM (10 to 100 mg/L) using IC conditions (ill).
106
Chapter 3
1.0
0.8
Ui 0.6 ::i. -~ > 0.4
~ :I
"C c: 0 0.2 0
0.0 2.0 4.0
Fundamental Behaviour of the Gold Thiosulfate Complex in IC
-OµM
- 10µM
- 40µM
- 100µM
6.0 8.0 10.0 12.0 14.0 16.0 18.0 20.0
Retention Time (mins)
Fig. 3.5 Effect of the eluent thiosulfate concentration on the raised baseline from injections of matrix free gold thiosulfate solutions containing 0.139 mM (27.4 mg/L) Au(I). Conditions: (I), except for thiosulfate content of eluent.
Fundamental Behaviour of the Gold Jhiosuljate Complex in IC
-OµM
- 10µM (a)
- 40µM
- 100µM
10.0
15.0
15.0 20.0 25.0 30.0 35.0
Gold concentration (mg/L)
(b)
mo ao •o ~o
Gold concentration (mg/L)
40.0
40.0
45.0
0 µM
10 µM
40 µM
100 µM
45.0
50.0
50.0
Fig. 3.6 Effect of adding thiosulfate to the eluent on (a) linearity and (b) peak area %RSD values for matrix free standards of gold thiosulfate. Conditions: (I), except for thiosulfate concentration of eluent.
108
Chapter3 Fundamental Behaviour of the Gold Thiosulfate Complex in JC
Linear calibration was observed (R2 >0.9995) for both conductivity and UV
detection over this range.
Investigations into the use of thiosulfate-containing eluents suggested that whilst
complex dissociation may be significant on the column and be reduced by the
addition of thiosulfate to the eluent, this was not the only mechanism at work, as
shown by the continued observation of a raised baseline. Further investigation was
therefore warranted.
3.3.1.3 Use of a Silica C18 Column
Another hypothesis considered was that the stationary phase, in this instance the
polymer based backbone of the Dionex NS-1 column, may have catalysed the
decomposition of the gold complex in some manner. To investigate this it was
decided to try a Waters NovaPak C18 column and a 25% vlv acetonitrile-water
mixture containing 5mM Waters low-UV PIC-A (TBAHS04), as eluent. This
method has previously been used for determination of the gold cyanide complex
(Au(CN)2") in cyanide leach solutions [8]. TBAOH/Na2C03 based eluents,
described in the preceding sections, were not used in this study because of the
instability of silica-based columns in alkaline solutions. Results for this column,
obtained without thiosulfate in the eluent, are illustrated in Fig. 3.7. Retention was
lower in this system, however the same problems were evident. In contrast to the
polymer column, the raised baseline continued past the gold peak. Trithionate and
tetrathionate could not be responsible for forming this raised zone, since
trithionate was eluted between thiosulfate and the gold complex, whilst
tetrathionate co-eluted with the gold. Sulfate and sulfite should show lower
retention than thiosulfate, whilst the formation of higher polythionates was
109
Chapter3 Fundamental Behaviour of the Gold Thiosulfate Complex in JC
Fig. 3.7 Effect of using a silica based C18 column and corresponding eluent, on the chromatography of the gold thiosulfate complex, shown here for a solution containing 0.707 mM (139.3 mg/L) gold, prepared from ~89% pure sodium gold thiosulfate dihydrate. Conditions: Waters NovaPak C18 column with corresponding guard inserted in a Waters Guard-PAK module, eluent consisting of 25% v/v acetonitrile containing 5 mM Waters low-UV PIC-A reagent (5 mM TBAHS04), 25 µL injection volume and UV detection at 215 nm.
110
Chapter3 Fundamental Behaviour of the Gold Thiosulfate Complex in IC
unlikely. One hypothesis that may explain the result was that the raised baseline
following the main gold peak was caused by the gold monothiosulfate complex,
although spectroscopic studies were not conducted to determine where the gold
was eluted. Also, the lack of information on this species in the literature, other
than that it exists [9], makes it difficult to assess whether the complex would be
formed or would survive long enough, to be observed in the chromatogram.
Using the same eluent on the Dionex NS-1 column produced similar results to
those observed with the TBAOH/Na2C03 eluent.
3.3.1.4 The Possibility of Gold Precipitation on the Column
The above investigation provided no satisfactory explanation of why the raised
baseline continued to be present even after the addition of thiosulfate to the eluent.
Another possible mechanism would be that a portion of the gold actually
precipitated on-column and the residual raised baseline was due to the soluble
component of the complex remaining after this had occurred.
To test this hypothesis, an old guard column that had been used extensively in the
work for this chapter was digested in acid and the resulting solution analysed by
AAS. The results were negative, but this in itself did not eliminate the theory from
further consideration since it was possible that the gold was remobilised by other
solutions, such as thiosulfate leachates, which had passed through the column.
During experiments examining the gold content of column fractions by flame
AAS, the primary results of which will be discussed in greater detail later in the
thesis, evidence of on-column gold precipitation was observed. In column
111
Chapter3 Fundamental Behaviour of the Gold Thiosulfate Complex in IC
fractions resulting from the injection of a synthetic leach sample containing, 0.5
M (N&)2S20 3, 2 M NH3, 0.05 M CuS04 and 0.508 mM (100 mg/L Au(I)) added
as the thiosulfate complex, the gold recovery was 235% (IC conditions (III) were
used in this study). Because of the inaccuracies inherent in the analytical method
used, recoveries of between 110-120% were routinely observed for injections of
gold standards. Even taking this into consideration the observed recovery value
was nearly twice that of any other sample investigated. An examination of the
column history indicated that prior to this sa,rnple, a large number of injections of
gold thiosulfate standards containing either no or only low concentrations of other
matrix ions had occurred. Further leach solution injections made two days later
gave gold recoveries much closer (118-126%) to those obtained for the gold
standard alone (111-120%). The only difference in this second set of injections
was that a much lower mass of gold in standards containing no or low
concentrations of matrix ions had passed through the IC system prior to the leach
sample. These results therefore supported the theory that there was a significant
amount of gold already on the column in the first experiment and this had been
mobilised by the injection of a leach solution.
3.3.1.5 Effect of /on-Interaction Eluent Acetonitri/e Purity on Gold
Thiosulfate Chromatography
During one experiment, the brand of acetonitrile used was changed from BDH
Chemicals HighPerSolv far UV-grade, purity 99.9% (Product No. 15251) to APS
change was also found to have a major impact on the chromatography, with
retention time of the gold thiosulfate complex decreasing and the raised baseline
between the thiosulfate and gold thiosulfate increasing. Switching back to the
112
Chapter 3 Fundamental Behaviour of the Gold Thiosulfate Complex in JC
BDH acetonitrile resolved the problem, indicating that some interaction between
the gold and an impurity in the APS acetonitrile had occurred. However, the
identity of this compound was not established. Nitriles, such as malononitrile,
have been investigated as alternative lixiviants for gold [10] so it should not be
surprising that impurities in acetonitrile could form an alternative complex with
the gold present.
3.3.1.6 Conclusions from the Investigation of Gold Thiosu/fate Solutions
Not Containing Matrix Ions.
The analysis of gold thiosulfate solutions in the absence of other matrix ions
showed the· presence of a raised baseline of unknown composition, although
thiosulfate was suspected to be one of the components. This behaviour was at
least in part attributable to dissociation of the gold thiosulfate complex on column,
and could be minimised by the use of thiosulfate in the eluent. However, this
addition did not completely remove the raised baseline. This led to the
consideration that some of the gold precipitated on the column, a hypothesis that
was supported by the observation that injection of a synthetic thiosulfate leach
solution after a large number of gold thiosulfate standards gave over a 200% gold
recovery in column fraction analysis by AAS. The use of a silica based C 18
column did not offer any improvement over the polymer material used for the
majority of this work.
Regardless of the mechanism(s) at work, when thiosulfate was present in the
eluent the processes involved were quite reproducible and the detection of the
gold thiosulfate complex gave linear calibrations at least between 0.0508-0.508
mM (10 and 100 mg/L) Au(I). The final point to note was the importance of using
113
Chapter3 Fundamental Behaviour of the Gold Thiosulfate Complex m JC
high grade acetonitrile, since impurities can affect the chromatographic behaviour
of the gold.
3.3.2 Behaviour of the Gold Thiosulfate Complex in the Presence of
Additional Sample Thiosulfate
The next step in this study was to examine the effect of matrix ions on the
behaviour of gold thiosulfate, in particular those ions that are expected to be
present in the leach solutions at appreciable concentrations. Firstly, the effect of
thiosulfate, which has already been shown to influence the gold complex when
added to the eluent, was examined in detail.
3.3.2.1 Preliminary Experiments
Preliminary studies of thiosulfate matrices indicated a significant variation in the
observed gold peak area with the concentration of thiosulfate in the sample. This
was examined systematically by injecting a series of gold thiosulfate standards, all
containing the same amount of gold, but differing amounts of thiosulfate. The
results for thiosulfate concentrations between 0-5 mM in an eluent not containing
thiosulfate are detailed in Fig. 3.8 (a). The addition of small amounts of
thiosulfate to the sample seemed to exert a similar effect to adding it to the eluent,
in that the gold peak area increased concomitantly with thiosulfate concentration
in the sample, although a plateau was reached at ~0.5 mM. Note the anomalous
result observed for the sample containing 0.1 mM thiosulfate, which was
significantly outside the trend observed for the remainder. The injections of this
sample followed the injection of a gold check standard containing no matrix ions.
This result suggested that a matrix memory effect occurred. Further evidence for
114
Chapter3 Fundamental Behaviour of the Gold Thiosulfate Complex in JC
3.4
'\. (a)
~ 3.2 'I"" -l'CI f <( 3.0
~ l'CI 0.01• QI
D. 2.8 QI -J! 0.005
::::s 0.001
.2 2.6 J: t-"C 0 2.4
C> 0
2.2 o.o 0.5 1.0 1.5 2.0 2.5 3.0 3.5 4.0 4.5 5.0
Added Sample Thiosulfate Concentration (mM)
4.5
(b) 4.0
co Q :!:: 3.5 l'CI QI ~ 3.0
~
:g 2.5 D.
-! 2.0 ~ ::::s .2 1.5 J: t- 1.0 "C 0 C> 0.5
0.0 0 10 20 30 40 50 60 70 80 90 100
Added Sample Thiosulfate Concentration (mM)
Fig. 3.8 Effect of sample thiosulfate concentration on the gold thiosulfate peak area for a 0.101 mM (19.9mg/L) Au(I) solution, (a) between 0-5 mM in an eluent containing no thiosulfate (using (I)) and (b) between 0-100 mM using conditions (II).
115
Chapter3 Fundamental Behaviour of the Gold Thiosulfate Complex in IC
this was that replicate injections of standards containing no or very low levels
Fig. 3.10 Effect of injecting the same number of moles of gold thiosulfate ( 5.1 x10⁻⁸ moles), using the specified injection volumes, in standards also containing 0.1 M thiosulfate, on the gold thiosulfate peak shape. Conditions: (I).
119
Chapter 3 Fundamental Behaviour of the Gold Thiosu/fate Complex in IC
between the two chromatograms is that the results in Fig. 3.10 were obtained
without the presence of 40 µM thiosulfate in the eluent, and the gold
concentration was approximately five times higher than that in Fig. 3.9. This
result suggested that the concentration ratio between thiosulfate and gold
thiosulfate was important in determining the extent of the broadening effect.
The above results supported the existence of a self-elution effect similar to that
described previously by Novic et al. [11], for an anion-exchange system
employing a sulfate eluent, and samples of nitrate and nitrite containing sulfate as
a matrix ion. As the sulfate concentration in the sample was increased, the nitrate
and nitrite peaks were observed to broaden towards lower retention times, but the
end of the peak did not move. This was attributed to a "sample-induced micro
gradient" in which the higher concentration of the eluting ion in the sample plug
caused a lower retention factor for analyte ions contained in that plug, with the
effect decreasing from the front to the rear of the sample band, resulting in the
observed peak shape.
The results illustrated in Fig. 3 .10 were somewhat similar to those described in the
above-mentioned work, except the situation here was more complicated. The
separation system involved ion-interaction not ion-exchange, the primary matrix
ion was different to that contained in the eluent, and the charge on the analyte (-3)
was larger in magnitude than that of the eluent (approximately -2).
To understand how the self-elution hypothesis may apply to these samples,
consider a sample plug of gold thiosulfate in a matrix consisting of a high
120
Chapter 3 Fundamental Behaviour of the Gold Thiosulfate Complex in JC
concentration of thiosulfate. Immediately after injection onto the column and
before any dispersion of the bands has occurred the band will appear as shown in
Fig. 3.ll(a). As the plug begins to move down the column the thiosulfate band
will start to separate from the gold and a small portion of the gold thiosulfate will
be free of the sample plug (b).As the bands continue to move through the column,
self-elution from the matrix makes it progressively more difficult for further gold
to "escape" the sample band, resulting in broadening of this part of the peak ( c ),
which ceases once the thiosulfate band has completely separated from the gold
( d). The end of the peak will always be in the same place according to this
mechanism, unless the ionic strength of the matrix is so high that even gold at the
end of the band is not immediately free from the sample plug. In addition if
position ( d) is not reached by the end of the column, some of the sample will be
eluted with the matrix ion, as was observed in Fig. 3.10, in the case of the 100 and
200 µL injections. This hypothesis is simplistic with regard to the final shape of
the eluted band since the peak shapes observed here are different to those shown
in the earlier work by Novic et al. [ll] However, as noted before the
chromatographic system used here was more complicated.
3.3.2.3 Addition of Gold Thiosulfate to the Eluent
As a further assessment of this possible self-elution effect, and also in an attempt
to improve the stability of the gold complex on-column, the effect of adding a
small amount of the gold thiosulfate complex to the eluent was investigated. IC
conditions (II), except with approximately -0.01 mM Au(I) added as the
thiosulfate complex ( -2 mg/L Au(I)), were used in this work. There was a
substantial increase in peak area corresponding to a gold standard injected in a
1 mM thiosulfate matrix. However, in a sample containing the same gold
121
Chapter 3 Fundamental Behaviour of the Gold Thiosulfate Complex in IC
(a) (b) /Matrix
(c) (d)
Fig. 3.11 Representation of sample-induced micro-elution hypothesis (a) initial state after sample injection (b) the gold thiosulfate contained at the end of the sample band "escapes" the sample plug, (c) self-elution effects caused by the sample thiosulfate matrix significantly slows the rate at which the remaining gold thiosulfate leaves the sample plug region resulting in significant peak distortion (d) gold thiosulfate is completely separated from the sample plug. The plots show how the gold thiosulfate band would appear in the chromatogram at that point (ignoring signal from the matrix).
122
Chapter 3 Fundamental Behaviour of the Gold Thiosulfate Complex in JC
concentration but 0.1 M thiosulfate, the gold thiosulfate equilibrium in the column
was significantly disturbed. A major dip in the baseline (of magnitude~ 10 µSin
the conductivity trace) was observed from the end of the thiosulfate peak until the
retention time of the gold thiosulfate complex, where a small peak was observed
followed by the recovered baseline. The apparent stripping of the gold thiosulfate
complex from the column by the high thiosulfate Jilatrix was consistent with the
sample-induced micro-gradient effect. This was because the gold on the column
passed by the thiosulfate plug during its passage through the column would
experience the same degree of self-elution as the frontmost portion of gold in the
original sample plug.
3.3.2.4 Effect of Adding TBA OH to the Sample
Interesting results were obtained when the eluent ion-pair reagent, TBAOH, was
added to the sample at a level equal to that contained in the eluent. Samples
containing high thiosulfate showed a partial recovery of the gold thiosulfate peak,
as illustrated in Fig. 3.12. Samples containing 0.1 M thiosulfate and 3 mM
TBAOH produced a peak area for 0.102 mM (~20 mg/L) Au(I) standards which
was 85-90% of that for similar standards containing 1 mM thiosulfate. Adding
excess TBAOH produced peak area recoveries that were inconsistent between the
conductivity and UV detectors (displayed in Fig. 3.13 (a)), the cause of which was
unknown. Overall, the results suggested little further improvement in recovery
compared to addition of stoichiometric amounts of TBAOH, even for a sample
containing the gold thiosulfate complex, 0.1 M thiosulfate and 50 mM TBAOH
(over 16 times the level contained in the eluent). The addition of TBA OH to
samples containing a low thiosulfate concentration did not significantly influence
the gold thiosulfate peak area.
123
Chapter 3
12.0
10.0
8.0
u; :i.
;6.0 ·:;: ;I g 4.0 "O c: 0 0 2.0
0.0 2.0
Fundamental Behaviour of the Gold Thiosulfate Complex in JC
- 100mMSOl·
4.0 6.0 8.0 10.0 12.0 14.0 16.0 18.0 20.0
Retention Time (mins)
Fig. 3.12 Influence of sample matrix on the gold thiosulfate peak shape. Solutions all contain 0.101 mM (20 mg/L) gold. The peak "recovery" effect of adding TBAOH to the sample can be clearly observed in the presence of a high thiosulfate matrix. Conditions: (II).
124
Chapter 3 Fundamental Behaviour of the Gold Thiosulfate Complex in JC
Fig. 3.13 (a) Gold thiosulfate peak area recovery as a function of sample TBAOH concentration, for solutions containing gold at a concentration of 0.103 mM (20.2 mg/L ). Recovery based on that obtained for a solution containing 1 mM thiosulfate matrix with no TBAOH present. (b) Effect of sample thiosulfate concentration on the gold thiosulfate peak area for solutions containing 0.102 mM (20. 0 mg/L) gold and 5 mM TBAOH. Conditions for both (a) and (b): (II).
125
Chapter] Fundamental Behaviour of the Gold Thiosulfate Complex m JC
The behaviour of the gold complex in the presence of sample TBAOH was
considered to be a possible means by which the gold thiosulfate chromatography
could be stabilised, even if the recovery of the complex through the column was
not 100%. Unfortunately a further experiment showed that even with TBA OH
present in the sample, the gold thiosulfate peak area decreased with increasing
thiosulfate concentration as demonstrated in Fig. 3.13(b ), thus preventing the use
of this approach.
Despite the above-mentioned problems, the effect of adding the TBAOH to the
eluent did provide a further insight into the chromatography of the gold complex
in the presence of a high concentration of thiosulfate. The results indicated that
the problem with the gold peak was, at least in part, caused by some kind of
equilibrium disturbance that occurred with the injection of high-ionic strength
samples in the absence ofTBAOH.
The reason for the continued loss of some gold peak area even in the presence of
TBAOH is unknown, but may in some way still relate to the mechanism
hypothesised in the preceding section.
3.3.2.5 Pre-Column Matrix Elimination
Another approach investigated to overcome the problems induced by the
thiosulfate matrix utilised methodology similar to that of Haddad and
Rochester [5]. This method was an on-line technique utilising a pre-column to
remove matrix components and concentrate the gold cyanide complex from
cyanide leach liquor waste streams. The main difference was that instead of
preconcentration, the aim of the present study was to use the technique to remove
126
Chapter3 Fundamental Behaviour of the Gold Thzosulfate Complex zn IC
the thiosulfate matrix from the sample, ideally leaving only the gold complex
absorbed on the pre-column. The adapted instrumental configuration is described
in the experimental section of this chapter. To maximise the difference in
retention between thiosulfate and gold thiosulfate, the acetonitrile concentration of
the eluent was reduced during the loading step. Preliminary work with a Dionex
NGl column used in the direct injection mode indicated that for an eluent
containing 17.5% acetonitrile, 3 mM TBAOH, 2 mM sodium carbonate and 40
µM sodium thiosulfate, a broad gold peak, was eluted at ~20 min, whilst
thiosulfate was eluted at ~1.5 min. Unfortunately, experiments in the same
configuration using samples containing 0.1 M thiosulfate gave lower peak areas
for the gold.
It was of interest to determine if the backflush mode discussed by Haddad and
Rochester [5] would recover this gold. For this investigation, a second NGl
column was used as the "analytical" column, to minimise the separation time. A
peak for a 0.102 mM (20 mg/L) gold solution was observed in both 1 mM and
0.1 M thiosulfate samples, but in the latter matrix the peak was broad and
misshapen, as illustrated in Fig. 3.14(a), (ii). The results are still an improvement
over the direct mode, since in this configuration for a sample containing 0.1 M
thiosulfate and 0.102 mM (20 mg/L) gold, only the raised baseline was visible.
The poor peak shape in the high thiosulfate matrix was also consistent with the
previously stated sample-induced micro-gradient hypothesis, since such an effect
would have broadened the gold peak on the pre-column during the loading step,
producing results similar to those observed in Fig. 3.14(a) (ii). In the back-flush
step the gold that had moved the greatest extent through the pre-column because
127
Chapter 3
70
0.0
4.5
4.4
co 4.3 0 --;; 4.2
e <t 4.1 ~
m 4.0 0..
~3.9 > :g 3.8 :::J
't1 c 3.7 0 () 3.6
Fundamental Behaviour of the Gold Thiosuljate Complex in IC
1 mM thlosulfate 100 mM thiosulfate 100 mM sulfate + 100 mM iodide+ 1 1mM thiosulfate 1mM thiosulfate mM thiosulfate
Sample Matrix
Fig. 3.14 (a) Results of study into the use of a matrix elimination pre-column procedure (i) Water Blank (ii) 0.101 mM (19.9 mg/L) Au(I) (as thiosulfate) in matrix of 0.1 M thiosulfate (iii) 0.101 mM Au(I) (as thiosulfate) in matrix of 1 mM thiosulfate and 3mM TBAOH (iv) O.lOlmM Au(D in matrix of 0.1 M thiosulfate and 3 mM TBAOH. (b) Effect of sample matrix on resulting gold thiosulfate peak when using a matrix elimination pre-column system, with all samples containing 3 mM TBAOH. Instrumental set-up and program for both (a) and (b) given in experimental section. Matrix elimination step eluent: 17.5% v/v acetonitrile containing 3 mM TBAOH 2 mM Na2C03, backflush and analytical eluent: 28% v/v acetonitrile containing 3 mM TBAOH 2 mM Na2C03.
128
Chapter3 Fundamental Behaviour of the Gold Thzosulfate Complex m IC
of the matrix, although in contact with the stronger analytical eluent first, would
still take significantly longer to reach the detector than the portion of the gold
absorbed at the head of the column.
The addition of TBAOH to the sample solved this problem, with gold thiosulfate
peak area recoveries of between 90-95%, compared to that of a similar sample
containing only 1 mM thiosulfate injected in the same system (Fig. 3.14 (a), (iii)
and (iv)). The higher recovery may indicate an improvement over the direct
injection technique or could also relate to the much shorter column used, which
would minimise the effects of any other possible sources of loss of gold in the
system.
As a further test, the effect of the matrix ions sulfate, thiosulfate and iodide were
compared in this system with TBAOH added to the sample. The eluting strength
of these ions is sulfate < thiosulfate < iodide. If the self-elution effect was the
cause of the remaining loss in gold thiosulfate peak area, then samples prepared in
these matrices should show increasing reduction in the gold peak area with
increasing eluting strength of the matrix ion. This was not observed, with iodide
showing greater recoveries than thiosulfate, (Fig. 3.14(b)). This result suggested
that the remaining loss in gold peak area was not through a self-elution effect,
although the high irreproducibility of the data presented a problem for drawing
any firm conclusions from these experiments.
3.3.2.6 Investigation of a Zirconia-Based Column
To further assess the role (if any) of the stationary phase substrate on the
chromatography of the gold thiosulfate complex, an investigation was conducted
129
Chapter3 Fundamental Behaviour of the Gold Thwsulfate Complex zn IC
using a zirconia-based column. The advantage of this column over the silica-based
material discussed in Section 3.3.1.3 was that the column is stable over a wider
pH range, enabling the use of an eluent system similar to that possible on
polymer-based columns.
The column used was a ZirChrom Diamond bond C1s with 3 µm particle and
300A pore size. Initial testing indicated that to attain significant retention a lower
acetonitrile concentration (15% versus 28% vlv) in the eluent was required. The
results obtained on this column contrasted markedly with the polymer column,
with no significant raised baseline observed by conductivity, and a much reduced
raised baseline observed on the UV detector. However, the peak for the gold
thiosulfate complex was tailed and/or split, even though thiosulfate was added to
the eluent. This behaviour is demonstrated in Fig. 3.15 (a) and (b).Peak area was
still influenced by. the thiosulfate concentration of the sample, although this effect
was not as strong as on the polymer column. For example, a peak was observed
for gold in a 0.102 mM (20 mg/L) Au(I) (as thiosulfate) standard containing
0.2 M thiosulfate (Fig. 3.15(b)(iii)), even without TBAOH in the sample. The
addition ofTBAOH to the sample was actually detrimental to the chromatography
of the gold, resulting in smaller peak areas in samples containing high levels of
thiosulfate. The retention time of the gold complex also decreased with increasing
thiosulfate, although the peak shape of the gold actually improved in a high
thiosulfate matrix. The baseline on this column was also more sensitive to high
thiosulfate matrices, as is evident from the baseline drift after the thiosulfate peak
in Fig. 3.15(b).
130
Chapter 3 Fundamental Behaviour of the Gold 'I'hiosulfate Complex in IC
20.0 Second peak in tail -U) :i. I ;: 16.0 -·:;; .. g 12.0 'tJ c 0 (.) 8.0 (ii)
4.0
(i) 0.0
0.0 2.0 4.0 6.0 8.0 10.0 12.0 14.0 16.0 18.0 20.0
Retention Time (mins)
Fig. 3.15 Results from investigations on a Zirchrom Diamond.Bond C 18 zirconia based column (a) (i) Water Blank (ii) 0.102 mM (20.0 mg/L) Au(I) as thiosulfate complex in lmM thiosulfate matrix (b) (i) 0.1 M thiosulfate blank (ii) 0.102 mM Au(I) as thiosulfate complex in 0.1 M thiosulfate (iii) 0.102 mM Au(I) as thiosulfate complex in 0.2 M thiosulfate (iv) 0.509 mM (100.3 mg/L) Au(I) as thiosulfate complex in 0.1 M thiosulfate. Eluent: 15 % v/v acetonitrile containing 3 mM TBAOH 2 mM NaC03 40 µM Na2S203.
131
Chapter3 Fundamental Behaviour of the Gold Thiosulfate Complex zn JC
The detection limit for the gold thiosulfate complex in a 0.1 M thiosulfate matrix
was 4 µM (0.7 mg/L Au) by conductivity using this method based on a signal
three times the baseline noise, significantly lower than was observed with the
polymer-column. fu the same matrix, calibration plots between 0.0508 and
0.508 mM (10 and 100 mg/L) Au(I) were linear (R2> 0.998) for both conductivity
and UV detection systems.
Because of the tailed peak shapes and peak splitting effects, this column was not
considered further. The markedly different chromatographic behaviour of the gold
complex on this column would indicate that the stationary phase does have some
role in the separation.
3.3.2. 7 Experiments to Determine the Fate of the Gold in High Thiosu/fate
Matrices
Efforts were made to determine spectroscopically the fate of the gold in samples
containing high levels of thiosulfate. The observed change in the area of the gold
peak implied that one or more of the following had occurred in the presence of the
high thiosulfate matrix:
(a) Precipitation of gold in the sample due to the high thiosulfate matrix prior to
chromatographic analysis. This was considered unlikely since there was no
visible solid observed in samples and there is no information in the literature
indicating limited solubility of the gold in a thiosulfate matrix.
(b) Gold was eluted earlier in the chromatogram than the main gold peak due to a
self-elution or other effect. Significant evidence has already been presented to
132
Chapter 3 Fundamental Behaviour of the Gold Thiosulfate Complex in IC
suggest that this may be a significant factor in the chromatography of gold
thiosulfate.
(c) Some of the gold was eluted later than the gold peak due to formation of more
highly retained complexes. For example it may be possible that Au(S203)35-
was formed in the high thiosulfate matrix.
( d) Gold was precipitated on the column.
( e) The elution behaviour of the gold was the same as in the absence of matrix
ions, but the detected form has changed. This theory seems unlikely since the
retention time of the gold peak remains unchanged, and the loss in peak area
in the presence of high levels of thiosulfate was similar for both the
conductivity and UV traces, suggesting that the detected species was the same
in both situations.
To test theory (a), solutions containing 0.203 rnM (40.1 mg/L) of the.gold
complex were analysed by flame AAS in a matrix of 1 mM thiosulfate and 0.5 M
thiosulfate. The results indicated no significant difference in absorptivities,
although dilution (1 :5) of the 0.5 M thiosulfate solution was required since the
high ionic strength of the matrix caused some suppression of the gold signal. The
results suggested that pre-chromatographic precipitation was not a source for loss
of the gold.
To investigate mechanisms (b)-(e), column fractions collected from injections of
various gold thiosulfate solutions, using IC conditions (II), were analysed by GF
AAS. As noted earlier in this chapter, there were significant difficulties in
obtaining quantitative results by this technique. A range of conditions were used
133
Chapter3 Fundamental Behaviour of the Gold Thzosulfate Complex in IC
for the GF-AAS determination, mainly to overcome problems caused by the high
acetonitrile content of the column eluate which often resulted in a portion of the
sample "creeping" up the sides and out of the top of the furnace. It proved
necessary to dilute the solutions containing 28% acetonitrile with water (1 :2), to
reliably prevent this effect. Whilst linear calibration curves were attained for both
gold chloride AAS standards and for gold thiosulfate standards prepared in the
eluent matrix, quantitation of the collected fractions was not possible since all
experiments produced extremely high recoveries. To ensure this effect was not
related to the presence of gold on the column that was remobilised in later
injections, fractions from the first injection of the gold complex on a new column
were analysed, but again high recoveries were obtained. Similar results were
observed on the same column after 22 injections of a ~0.102 mM (~20 mg/L)
Au(I) solution in 0.1 M thiosulfate and 3 mM TBAOH. As a result, all these
investigations were inconclusive.
In view of the inconsistencies observed using GP-AAS, flame methodology was
also examined. Recoveries determined using this technique were also high, with
injections of a 0.508 mM (100 mg/L) gold standard in the absence of any matrix
ions (using IC method (III)) producing gold recoveries typically between 110-
120%. However, this error was considered to be within the accuracy limitations of
the experimental methodology. Injections of a 0.508 mM gold standard in a 0.5 M
thiosulfate matrix (no TBAOH added) showed the presence of some gold in the
fraction eluted immediately before that containing the main gold peak
(Fig.3.16(a)), which was not observed for a 0.508 mM gold standard without the
matrix ion (Fig. 3.16(b)). It should be noted that this behaviour was also evident in
134
Chapter 3
60.0
50.0
fi>40.0 ::L -~30.0 > ;:; u .ij 20.0 c 0 0 10.0
0.0
-10.0
50.0
40.0
U> 30.0 ::L -
0.0
..:, ... 0
N
UJ +:i c e Lt.. -c Cl> ;; e C>
2.0 4.0
Fundamental Behaviour of the Gold Thiosuljate Complex in IC
Fig. 3.16 Influence of matrix thiosulfate on the gold distribution in corresponding separations, determined by flame AAS. Samples: (a) 0.508 mM Au(I) (as thiosulfate complex) with 0.5 M thiosulfate present (b). 0.508 mM (100 mg/L) Au(I) (as thiosulfate complex) with no matrix. For each Fig. (i) is the chromatogram resulting from injection of the relevant sample and (ii) is the gold concentration found in each fraction collected. Conditions: (III).
135
Chapter3 Fundamental Behaviour of the Gold Thiosu/fate Complex in JC
the corresponding chromatograms, with broadening of the gold peak in samples
containing high levels of thiosulfate. These observations were consistent with the
3.3.3 Chromatography of the Gold Thiosulfate Complex in the
Presence of Matrix Ions other than Thiosulfate
3.3.3.1 Ammonia
The concentration of ammonia in thiosulfate leach solutions is often very high and
extremes between 0.1-6 M have been reported [12]. In the absence of additional
thiosulfate it was also hypothesised that the gold thiosulfate complex could
convert to the gold ammine (Au(NH3)2 l species. As a result, the effect of a 1 M
ammonia matrix on the chromatography of the gold thiosulfate complex was
investigated. There was no significant change in the chromatographic behaviour
from a similar standard containing no ammonia. This result provided further
evidence that the degree of formation of the gold ammine complex is insignificant
under gold thiosulfate leach conditions.
3.3.3.2 Polythionates
The only polythionates that are likely to be in the leach at an appreciable
concentration are trithionate and tetrathionate. The presence of these ions in the
sample matrix had a detrimental effect on the chromatography of the gold, as
evidenced by Fig. 3.17(a), (ii) and (iii). In this system the separation selectivity
had been adjusted so that the gold peak was eluted later than tri-, tetra- and
pentathionate. Flame AAS investigations on standards containing 0.508 mM (100
mg/L) gold and 2 mM of either trithionate or tetrathionate (using IC system (III))
showed a lower gold recovery in the case of trithionate (~ 100% compared with
136
Chapter 3 Fundamental Behaviour of the Gold Thiosuljate Complex in IC
0.30 Au(S20 3)23-
(a) '
A N I \ ...
0.25 0 .., en
5 0.20 <( -Cl)
g 0.15 ftS .a .... 0 .! 0.10 <(
0.05
0.00
0.0 2.0 4.0 6.0 8.0 10.0 12.0 14.0 16.0
Retention Time (mins)
120
(b) 100
(iii)
(ii' 80 :i. -.a-·:; 60
.... ..:, (ii) c ... e 0 ... u.. en .... c
+: () :J "D c 40 0 0
.! "D
20 l! C>
(i) 0
0.0 2.0 4.0 6.0 8.0 10.0 12.0 14.0
Retention Time (mins)
Fig. 3.17 Influence of polythionates on the behaviour of the gold thiosulfate peak. (a) (i) 0.203 mM (40 mg/L) Au(I) (as thiosulfate complex) (ii) 0.203 mM Au(I) (as thiosulfate complex) + 2 mM S30i- (iii) 0.203 mM Au(I) (as thiosulfate complex)+ 2 mM S40l-. Conditions: Dionex NGl+NSl-5µ in series 30% v/v acetonitrile 3 mM TBAOH 0.5 mMNa2C03 40 µMNa2S203, UV detection at 215 nm. Conditions chosen so that the gold eluted after the polythionate ions. S20{ (b) Chromatogram identities the same as (a) except this time with 0.506 mM (99.7 mg/L) Au(I) in each sample. Conditions: (111).
137
Chapter3 Fundamental Behaviour of the Gold Thiosulfate Complex in IC
110-120% for standards in the absence of matrix ions), whilst the recovery was
unchanged in the tetrathionate solution. However, there was significant
broadening of the gold peak, in the tetrathionate matrix (Fig. 3. l 7(b) (iii)). The
specific cause of the results is unknown, although it may relate to the equilibrium
between thiosulfate and the polythionates shown in Eqn. 1.14 (Section 1.6.2), or
alternatively to the sample-induced micro-gradient effect discussed earlier. The
latter theory is possible since it would be expected that much lower concentrations
of these ions would be required than thiosulfate for self-elution to ~ccur, because
of their higher ion-exchange affinities. As noted in Chapter 1, polythionates
present a problem for gold thiosulfate leaching because of their ability to elute
gold from ion-exchange recovery systems [13,14].
These results all demonstrated that major impediments existed in the
determination of the gold. For example, even if a successful matrix elimination
system as discussed in Section 3.3.2.5, was developed to remove thiosulfate from
the sample, removal of polythionates (especially tetrathionate) from the system
would be difficult due to the similarities of their ion-exchange affinities to that of
the gold complex.
3.4 Conclusions
This study on the ion-chromatographic behaviour of the gold thiosulfate complex,
primarily using the Dionex NS 1 stationary phase dynamically coated with
TBAOH as ion-interaction reagent, has revealed many problems that hinder the
determination of this species. In solutions containing no matrix ions, a raised
baseline was observed which was partially attributed to on-column dissociation of
the complex. This effect could be minimised (but not eliminated) by adding a
138
Chapter] Fundamental Behaviour of the Gold Thiosulfate Complex in JC
small amount of thiosulfate to the eluent. Other mechanisms that could explain
this behaviour were not elucidated, but some investigations suggested that on
column precipitation of a portion of the gold occurred during the separation. The
purity of the acetonitrile used for the chromatographic analysis was also
significant
Addition of other matrix ions, such as thiosulfate or polythionates, introduced
further problems in the chromatographic determination of the gold complex. The
area of the gold peak was highly dependent on the thiosulfate concentration in the
sample and memory effects were significant. For samples containing low-levels of
thiosulfate, peak area reproducibility and dependence on thiosulfate concentration
could be minimised by the addition ofthiosulfate to the eluent. This approach was
not successful for samples containing high concentrations of thiosulfate, for which
the gold peak area was reduced, and a peak broadening effect was often observed.
The results suggested that these problems were at least in part due to a sample
induced micro-gradient effect, for which further evidence was observed in
experiments using a matrix-elimination pre-column with back-flush procedure.
Spectroscopic studies were also consistent with a self-elution effect.
Adding TBAOH to the sample at a concentration equal to that of the eluent was
found to improve significantly the recovery of the gold thiosulfate peak for
samples containing high concentrations of thiosulfate. The result indicated that at
least a significant portion of the problems observed in the high thiosulfate matrix
were caused by disturbances to the equilibrium on the column in the region of the
sample plug.
139
Chapter3 Fundamental Behavzour of the Gold Thiosulfate Complex zn JC
The self-elution effects might not be the only mechanism at work since the
chromatographic behaviour of the gold complex was somewhat different on a
zirconia-based stationary phase. With this stationary phase, no peak broadening
effects were observed and the addition of TBAOH to the sample was detrimental
to the chromatography in the presence of a high thiosulfate matrix.
The negligible change in behaviour of the gold complex in the presence or
absence of a high ammonia matrix adds further weight to other experimental data
in the literature [12] that the gold ammine complex, Au(NH3) 2 +, will not be a
significant species in leach solutions, at least at room temperature.
The results outlined in this chapter demonstrate the complexity of applying IC to
the quantification of the gold thiosulfate complex. Chapter 4 will continue this
investigation, optimising the separation of the gold complex and the polythionates
and observing the behaviour of the gold complex in the presence of synthetic
leach matrices.
3.5 References
[l] D. F. Hilton, P.R. Haddad,.!. Chromatogr. 361 (1986) 141.
Fig. 4.1 Effect of (a) acetonitrile and (b) carbonate concentrations in the eluent on retention and separation of polythionates and the gold thiosulfate complex. Eluent compositions: (a) 3mM TBAOH, 2.2mM sodium carbonate, acetonitrile step gradient at 2.5 mins from 15% vlv to the indicated final composition, (b) 3mM TBAOH, acetonitrile step gradient at 2.5 mins from 15% vlv to 30% vlv. For remaining conditions, see Sections 3.2.1 and 4.2.1.
146
Chapter4 Separation of Polythionates and the Gold Thiosulfate Complex by !IC
gradient from 15% to 28% v/v, with 3 mM TBAOH and 2.5 mM sodium
carbonate maintained in the eluent at all times. After 14 min, the acetonitrile
concentration was reduced to 15% and held for a period of 4 min, yielding a total
analysis time of 18 minutes, including the time required to re-equilibrate the
column with the initial conditions. The separation attained using this eluent is
illustrated in Fig. 4.2 as recorded by both the conductivity and UV detectors.
These conditions were chosen so that the gold thiosulfate eluted between tetra
and pentathionate, since the gold thiosulfate peak became extremely tailed with
increasing residence time on the column.
4.3.2 Analysis of Synthetic Leach Solutions
A wide range of thiosulfate leach conditions have been reported in the
literature [11], varying between the extremes of 0.1-2 M for thiosulfate, 0.1-6 M
for ammonia and 0.001-0.1 M for copper. Based on a recent review [11] and our
own experience it was concluded that approximately 70% of leaching regimes use
~ 0.5 M thiosulfate, ~ 2 M ammonia and~ 50 mM copper. In order to ensure the
chromatographic method was able to separate species present under realistic leach
conditions a synthetic leach solution containing the above concentrations of these
species was used. While it is unlikely that these extreme conditions would be
used widely in any real leach solution, they provide a very challenging matrix in
which to evaluate the method.
4.3.2.1 Gold Thiosu/fate Complex Behaviour in the Leach Matrix
From the results discussed in Chapter 3, it was anticipated that the determination
of the gold thiosulfate complex would prove difficult. To investigate the effect of
such samples, injections of two 0.508 mM (100 mg/L) gold(!) solutions (present
147
Chapter4 Separation of Polythionates and the Gold Thiosulfate Complex by JJC
Fig. 4.2 (a) Conductivity and (b) UV chromatograms of optimised separation for the polythionates and gold thiosulfate. Optimum eluent composition, acetonitrile step gradient at 0.0 min from 15% vlv to 28% vlv, 3 mM TBAOH, 2.5 mM sodium carbonate. Sample composition, (0.18 mM (20 mg/L) thiosulfate, 0.21 mM (40 mg/L) trithionate, 0.094 mM (21 mg/L) tetrathionate, 0.10 mM (20 mg/L) gold (as thiosulfate complex), 0.082 mM (21 mg/L) pentathionate.
148
> f'"\,a _ _,,,
q r.~: t~ '°"" =_..&
~') ~.:r: I= l~
0
r:: ..--(i'J 0: LIJ ~ """"' &! :J
Chapter 4 Separation of Polythionates and the Gold Thiosulfate Complex by JJC
as the thiosulfate complex) were made in the optimised system, one containing
and the other free of the leach matrix. The results of the study are shown in
Fig. 4.3, with Fig. 4.3(a) detailing chromatograms resulting from 100 µL
injections of the (A) leach containing and (B) leach free solutions. Fig 4.3(b)
shows another injection of the leach containing sample, except using only a 10 µL
injection volume. Note, that for this work (and all other separations discussed in
this section), 40 µM thiosulfate was added to the optimised eluent, since earlier
work (refer to Chapter 3, Sections 3.3.1.2 and 3.3.2.1) indicated that such an
addition assisted in stabilisation of the gold thiosulfate complex. As was
previously observed, this caused an increase in baseline noise for both detectors,
but did not significantly affect the separation between the gold thiosulfate
complex and the polythionates.
Fig 4.3(a) highlights that the gold thiosulfate peak is greatly reduced in leach
liquors compared with standards. Results using both the NSl (lOµm) and NSl-5µ
columns employing eluents similar to the optimised system described in the
previous section (containing no acetonitrile step gradient, and using different
carbonate concentrations), showed that adding TBAOH to such samples did not
seem to offer the same gold peak recovery properties observed for solutions
containing only high thiosulfate (refer to Chapter 3, Section 3.3.2.4).
As a first step in establishing the fate of the gold, the possibility of gold
precipitation in the leach solutions prior to chromatographic analysis was
considered. A comparison of flame AAS absorbance values obtained for
0.204 mM (40.1 mg/L) of gold(D in the leach matrix described earlier (also
149
Chapter4 Separation of Polythionates and the Gold Thiosulfate Complex by IIC
Fig. 4.3 (a) Overlay of UV chromatograms for (A) an artificial leach solution containing 0.5 M ammonium thiosulfate, 2 M ammonia, 0.05 M copper sulfate and 0.508 mM (100 mg/L) gold (as thiosulfate complex) and (B), a 0.508 mM (100 mg/L) gold standard (as thiosulfate complex), using the optimised separation conditions. Injection volume 100 µL. (b) UV chromatogram of the artificial leach solution under the same conditions except using a 10 µL injection volume. The conductivity chromatograms were similar.
150
Chapter4 Sepurution of Polythionutes und the Gold Thwsulfate Complex by IJC
containing 3 mM TBAOH from a stock solution that had been adjusted to pH 7
with phosphoric acid) diluted 1 :5, was approximately 95% the value obtained in a
similarly prepared solution containing only 1 mM thiosulfate (plus the same TBA+
matrix). The difference is thought to be attributable to signal suppression caused
by the high ionic strength matrix. In contrast, analysis of the leach containing
sample at the same time by IC, using a 30% vlv acetonitrile 3mM TBAOH,
0.5 mM Na2C03 40 µM Na2S20 3 eluent (chosen so that the gold was eluted after
pentathionate), resulted in no observable gold peak. These results indicated that
most, if not all, the gold chromatography problems occur during the
chromatographic process.
To determine the fate of the gold on-column, column fractions were collected
during the IC analysis of samples containing 0.508 mM (100 mg/L) gold(I) (as the
thiosulfate complex) with and without the presence of the leach matrix, using the
optimised separation conditions. For each analysis four fractions were collected,
corresponding to the 0-4, 4-8, 8-12 and 12-16 min intervals, where t = 0 was the
injection time, with the gold concentration determined by AAS. The results of
this study are provided in Table 4.1, which shows the average concentration of
gold in each fraction and the total average gold recovery for each injection.
Theoretically, all the gold should be contained in the 8-12 min :fraction (see
Fig. 4.3(a)) with a concentration of 12.7 µM (2.5 mg/L Au). Average total gold
recovery was high for both the standard (115%) and leach (122%) solutions. As
noted for similar studies discussed in Chapter 3 (Section 3.3.2.7), these recoveries
are probably within the uncertainty of the experiment. For the leach sample, it
appears that the gold was spread across the first three :fractions collected,
151
Chapter4 Separation of Polytlzionates and the Gold Thiosulfate Complex by !IC
Table 4.1 Average gold concentrations observed in IC column fractions, and total gold recovery for 100 µL injections of 0.508 mM (100 mg/L) gold thiosulfate standard and artificial leach solutions containing 0.508 mM gold as thiosulfate, measured by AAS [n =number ofreplicates].
[Au] (µM) Ayerage total
Sample 0-4 4-8 8-12 12-16
gold recovery
min min min min (%)
0.508 mM gold standard (as thiosulfate 0.2 0.2 14.1 0.3 115 complex) [n = 2]
Artificial leach spiked with 0.508 mM gold (as 2.9 5.23 7.06 0.2 122
thiosulfate complex) [n = 3]
152
Chapter4 Separation of Polythionates and the Gold Thiosulfate Complex by IIC
consistent with the self-elution effect discussed previously. These results
demonstrated that gold thiosulfate cannot be determined in the leach solutions by
this method and the species was therefore not considered further. As a result,
thiosulfate was not added to the eluent in the remainder of the work discussed in
this chapter.
4.3.2.2 Po/ythionate Chromatography in the Leach Matrix
The only difficulty that the leach matrix provided for the polythionate
determination is the unknown shoulder peak on the front of the tetrathionate peak
(Fig. 4.3(b )). To determine whether this peak was caused by an anionic copper
species, such as Cu(S203)23- or Cu(S20 3)35
-, the elution of copper in the system
was also examined. A post column reaction system using PAR, followed by
visible detection at 510 nm, was used to monitor copper elution in further
injections of the artificial leach solution. The results are shown in Fig. 4.4. The
retention of copper varied according to the injection volume, with different results
being obtained for injections of 10 and 100 µL. In both cases there was a
significant peak in the reg;ion of the void volume, presumably corresponding to
cationic complexes of copper, such as the tetra-ammine copper(II) complex,
Cu(NH3)/+. However, there was also a diffuse peak observed for the 10 µL
injection (Fig. 4(a)) between 3.4-5.0 min, and a small peak at 3.3 min, followed
by a large poorly shaped peak between 4.0-5.8 min for the 100 µL injection
(Fig. 4.4(b )). These may correspond to the copper thiosulfate species mentioned
earlier. Recoveries were not quantitative, since after many injections of leach
solutions, flushing the column with 0.5 M ammonia produced a major response
from the PCR system, which took some hours to dissipate. For both injection
volumes no copper was observed in the region of the shoulder peak and this
153
Chapter4 Separation of Polythionates and the Gold Thiosulfate Complex by !JC
Fig. 4.4 (a) Chromatogram obtained at 510 nm for the artificial leach solution (0.5 M ammonium thiosulfate, 2 M ammonia 0.05 M copper sulfate, 0.508 mM (100 mg/L) gold(I) (as thiosulfate) using the optimised separation conditions, with PAR as post-column reagent. (b) Identical chromatogram of the same solution using a 100 µL injection volume. (c) UV chromatogram of the same leach solution for comparison (10 µL injection volume).
154
Chapter4 Separation of Polythionates and the Gold Thiosulfate Complex by !IC
remains unidentified. Another possibility that was not investigated is that the
shoulder actually corresponds to further tetrathionate, generated on-column
through reaction of copper(II) and thiosulfate prior to their resolution.
4.3.3 Linearity and Detection Limits
The detection limits for the polythionates usmg the optimised method were
determined using a 10 µL injection volume, with the limit taken as the
concentration of analyte registering a peak two times the peak to peak baseline
noise. Linearity was tested from the detection limit to 10.4 mM (2000 mg/L) for
trithionate, 8.92 mM (2000 mg/L) for tetrathionate and 9.75 mM (2500 mg/L) for
pentathionate. Least squares lines of best fit for the data yielded R2 values of
>0.999, for both conductivity and UV detection. Closer investigation of the
calibration plots indicated that the data points deviated significantly from the line
for the low concentration polythionate solutions. It was therefore more accurate
in most cases to define two lines of best fit, one for low and another for high
concentrations. Detection limit and linearity data (without the presence of
thiosulfate in the eluent) are summarised in Table 4.2. Before the linearity and
detection data were determined, it was deemed necessary to ensure that the
polythionates did not interact with one another on the column, which would have
affected quantification. This was investigated by preparing a solution containing
1.06 mM (203 mg/L) trithionate, 0.896 mM (201 mg/L) tetrathionate and
1.16 mM (298 mg/L) pentathionate and comparing the peak area obtained against
standards of the same concentration injected individually. No significant
differences were observed, thus it was concluded that there was no significant
interaction between these ions.
155
Chapter4 Separation of Polythionates and the Gold Thiosulfate Complex by !IC
Table 4.2 Polythionate detection limit and linear range data for the optimised method by both conductivity and UV detection.
Detection Limit, µM (mg/L) Linear range, mM (R2 values) Analyte
Fig. 4.5 UV chromatograms from gold thiosulfate leach solutions of (a) an oxide and (b) a sulfide ore concentrate, obtained from samples extracted 5 h after leaching was commenced. For leach conditions refer to Chapter 2 Section 2.2.2. Optimised analytical conditions used. The concentrations of polythionates in the oxide ore were 3.5 mM (792 mg/L) for tetrathionate and 0.074 mM (19 mg/L) pentathionate with the trithionate concentration above the tested linear range. The corresponding values for the sulfide ore were 8.9 mM (1716 mg/L) trithionate, 3.7 mM (822 mg/L) tetrathionate and 0.043 mM (11 mg/L) pentathionate.
159
Chapter4 Separation of Polythionates and the Gold Thiosulfate Complex by //C
10.0
9.0
8.0
-7.0 :ii: E -6.0 c 0 = 5.0 l! c4.o Cl.I u 6 3.0 0
2.0
1.0
o.o 0 50 100 150 200 250 300
Leaching Time (mins)
Fig. 4.6 Plot of polythionate concentrations as a function of leach time, taken from the results of a thiosulfate leach of a sulfidic gold ore concentrate. Analytical and leach methodology as per Fig. 4.5.
160
Chapter4 Separation of Polythionates and the Gold Thiosulfate Complex by IIC
In contrast to the other polythionates, the trithionate concentration increased
throughout the monitored period, initially lower than tetrathionate, increasing to
twice the concentration of this ion by the end of the five hours. This was most
likely generated through tetrathionate decomposition (Eqns. 1.7.-1.9,
Section 1.5.3). The build-up in concentration of this species over the entire
leaching period probably related to the comparative stability of trithionate in
alkaline solutions.
4.4 Conclusions
A method for the successful determination of polythionates in complex leach
liquors with good sensitivity and selectivity has been developed. While the
method also demonstrated the first reported chromatographic separation of gold
thiosulfate in standard solutions, the results for leach solutions were disappointing
and a self-elution effect prohibited successful analysis by this technique.
161
Chapter 4 Separation of Polythio11ates and the Gold Thiosulfate Complex by IIC
4.5 References
[1] H. F. Zou, Z. J. Jia, Y. K. Zhang, P. C. Lu, Anal. Chim. Acta 284 (1993) 59.
[2] R. Y. Wan in Proceedings of World Gold '97 Conference, Singapore, lst-
3rd September 1997, Australasian Institute of Mining and Metallurgy,
Carlton, Vic., p. 159.
[3] C. A. Fleming, J. McMullen, K. G. Thomas, J. A. Wells, to be published
by the SME, 2002.
[ 4] E. Molleman, D. Dreisinger, Hydrometallurgy 66 (2002) 1.
[5] M. J. Shaw, S. J. Hill, P. Jones, Anal. Chim Acta 401 (1999) 65.
[6] A. B. Roy, P.A. Trudinger, The Biochemistry of Inorganic Compounds of
Su/fur, Cambridge University Press, Cambridge, 1970.
[7] T. Koh, Anal. Sci. 6 (1990) 3.
[8] E. Rolia, C. L. Chakrabarti, Environ. Sci. Technol. 16 (1982) 852.
[9] Y. Miura, A. Kawaoi, J. Chromatogr. A 884 (2000) 81.
[10] P. R. Haddad, P. E. Jackson, Jon Chromatography: Principles and
Applications, Elsevier, Amsterdam, 1990.
[11] M. G. Aylmore, D. M. Muir, Miner. Eng. 14 (2001) 135.
162
Chapter 5
Separation of Thiosulf ate, Polythionates and the Gold
Thiosulfate Complex in Gold Thiosulfate Leach Solutions
by Capillary Electrophoresis
5.1 Introduction
Th~ preceding investigations into the ion-interaction chromatography of the gold
thiosulfate complex demonstrated many problems, which prevented its
determination by this technique in leach solutions. Two factors that were
hypothesised to cause, or at least contribute to this were a self-elution effect and
decomposition induced by the stationary phase packing of the column. Both relate
to the chromatographic methodology itself, and therefore a significant
improvement in gold peak stability should be observed if the separation could be
facilitated by means other than through interaction with a surface; that is, not
requiring a stationary phase. CE is such a technique (described in Section 1.6.4.1 ),
since open tubular capillaries are used, and the mode of separation is completely
different to IC. The negative charges on the only surface present in the capillary,
that of the fused silica wall, should actually repel the gold complex. CE may also
offer some other advantages over the IC method demonstrated in Chapter 4,
particularly in terms of the much faster and efficient separations achievable,
which would be advantageous in a process-monitoring situation.
Chapter5 Separation ofThiosulfate, Polythionates and the Gold Thiosulfate Complex by CE
This chapter therefore describes investigations into the capability of this technique
in the separation and determination of thiosulfate, polythionates and the gold
thiosulfate complex in simple mixtures and gold thiosulfate leach solutions.
5.2 Experimental
5.2. 1 Instrumentation
All CE experiments were performed on an Agilent Technologies 3°CE
(Waldbronn, Germany), equipped with a photodiode array detector. Fused silica
capillaries (Polymicro Technologies, Phoenix, AZ, USA), of effective length
40 cm, total length 48.5 cm and a 75 µm internal diameter, were used throughout.
A..11 experiments were performed at a capillary oven temperature of 30°C with an
applied voltage of -30kV unless otherwise specified. Injection was made using a
pressure of 50 mbar applied for 3 s. Data were collected usmg Agilent
Technologies 3°CE ChemStation software.
For pH adjustments, an Activon (Thomleigh, NSW, Australia) Model 210 pH
meter was used.
5.2.2 Procedures
For pH adjustment (where necessary) sulfuric acid was used unless otherwise
specified. Sodium hydroxide solutions were prepared from a -50% w/w stock
solution.
At the beginning of each day the capillary was flushed with 1 M sodium
hydroxide for 15 min, water for 15 min and electrolyte for 10 min. Between each
164
Chapter5 Separation of Thiosulfate, Polythionates and the Gold Thiosulfate Complex by CE
run the capillary was flushed with 1 M sodium hydroxide for 1 min, and twice for
1 min with electrolyte (from separate vials).
Details of the methodology used to conduct the leaching experiment has already
been provided in Chapter 2, although note samples were diluted as well as filtered
prior to analysis.
5.3 Results and Discussion
5.3.1 Preliminary Investigations
As a starting point, the two methods outlined by Padarauskas et al. [ 1] for the
analysis of thiosulfate, tetrathionate, pentathionate and hexathionate were
examined for their capability to also simultaneously determine trithionate and the
gold thiosulfate complex. Neither method was suitable, with the first electrolyte
(5 mM potassium dihydrogen phosphate, 5 mM ammonium sulfate at pH ~5)
being unable to provide baseline resolution of gold thiosulfate from trithionate
peaks, whilst the second electrolyte (5 mM tetrabutylammonium acetate, 5 mM
ammonium sulfate pH 5.0) resulted in co-migration of trithionate and the gold
thiosulfate complex. Varying the oven temperature in the range 25-40°C and
increasing the TBA+ concentration in the electrolyte also gave unsatisfactory
separations.
Several restrictions had to be considered in selecting an alternate electrolyte
system. The electrolyte pH needed to be greater than 5 since thiosulfate is known
to be unstable at lower pH values [1,2], and the electrolyte should also be buffered
in order to minimise migration time irreproducibility [3]. Padarauskas [1] noted
165
Chapter5 Separation ofThiosulfate, Polythionates and the Gold Thiosulfate Complex by CE
problems with the use of tetradecyltrimethyl ammonium hydroxide as an electro
osmotic flow (EOF) modifier, causing broad, poorly shaped peaks for the
polythionates, while the use of 1,6-bis(trimethylammonium)hexane hydroxide,
was found to cause similar problems for hexathionate only. Although
hexathionate was not under consideration as an analyte in the present study, it was
decided to keep the electrolyte free of EOF modifier. This prevented the use of
alkaline electrolytes since this would result in high EOF values and unacceptably
long migration times. Other requirements were that the electrolyte did not absorb
significantly at the UV detection wavelength, and the mobility of the electrolyte
co-anion needed to be close to those of the analytes to prevent poor peak shapes.
Based on these criteria bis-tris sulfate (pKa of 6.46 [4]) at pH 6.0 was chosen as
the electrolyte.
5.3.2 Optimisation of Electrolyte Composition
Fig. 5.1 shows the effect of the concentration of bis-tris in the electrolyte on the
mobility of the analytes (relative to thiosulfate). With increasing electrolyte
concentration the relative mobilities of the polythionates increased marginally,
while that for the gold thiosulfate complex decreased substantially. The
behaviour of the gold complex can be attributed to ion-association with bis-tris
[5], due to the triple negative charge of the complex. An effect not apparent in
Fig. 5.1 is that the effective mobilities of all anions increased with increasing bis
tris concentration due to a reduction in the EOF as a result of increased ionic
strength of the electrolyte. The optimal electrolyte composition was 25 mM bis
tris adjusted to pH 6.0 with sulfuric acid and Fig. 5.2 shows the separation of the
analytes under these conditions, with detection at 195 run.
166
Chapter5 Separation ofThiosulfate, Polythionates and the Gold Thiosulfate Complex by CE
0.95 ID -~ ::s 0.90 en .2 .c - 0.85 0 -"Cl 'i' Cl)
~ 0.80 ~ rn Ill 0
E :c ... ::£ 0.75 0 c c .2 ~ ; ·-::i. -- 0.70 :c 0 E
x
Cl) 0.65 > ; u ~ 0.60 w 10 15 20 25 30 35 40 45 50
Electrolyte bis-tris concentration (mM)
Fig. 5.1 Mobilities of gold thiosulfate and the polythionates relative to thiosulfate, as a function of electrolyte bis-tris concentration. All electrolytes were adjusted to pH 6.0 with sulfuric acid. For other conditions see Section 5.2.
167
Chapter5 Separation ofThiosulfate, Polythionates and the Gold Thiosulfate Complex by CE
,;, N -..,
0 45
N Cl) -:I
40 <C
35
5' 30 <C .§. 25 Cl) (.) c CV 20 cl. .c ... 0 15 en .c < 10
co 0 cl. .., co
cl. Cl) cl. 0 .., .., co (/) 0 0
N .., (/) Cl)
5
0 1.4 1.5 1.6 1.7 1.8 1.9 2.0 2.1 2.2 2.3 2.4
Migration Time (mins)
Fig. 5.2 Separation of 0.1 mM thiosulfate and 0.08 mM each of trithionate, tetrathionate, pentathionate and the gold thiosulfate complex using the optimum electrolyte conditions. Electrolyte contained 25 mM bis-tris adjusted to pH 6.0 with H2S04, and a detection wavelength of 195 nm was used. For other conditions see Section 5.2.
168
Chapter5 Separation of Thiosulfate, Polythionates and the Gold Thiosulfate Complex by CE
During the preliminary experiments and optimisation it was found that the
hydroxide concentration of the flush solution markedly influenced the effective
mobilities of the analytes, with concentrations weaker than that specified in the
experimental section resulting in significantly longer migration times. This was
attributed to decreased EOF. Under the optimal conditions all the species of
interest could be separated in less than 3 min, with a total analysis time (including
capillary pre-flushing) of 8 min.
5.3.3 Behaviour of the Gold Thiosulfate Complex
As discussed in Chapters 3 and 4, the gold thiosulfate complex was found to be
indeterminable in leach matrices by IC, mainly through what was attributed to a
self-elution effect. One of the aims of this work was to investigate whether CE,
would permit simultaneous determination of this complex and the polythionates.
Unfortunately, the behaviour of the gold thiosulfate in the CE system was not
straightforward.
When standard solutions of the gold complex exceeding -0.05 mM (-10 mg/L
Au) were injected, a section of raised baseline immediately following the gold
thiosulfate peak was usually observed (Fig. 5.3(a)). In the presence of relatively
high concentrations of some sulfur-oxygen matrix ions, particularly thiosulfate,
peak splitting occurred until eventually three peaks could be discerned. Typical
shapes of the gold peak in the presence of 1 mM thiosulfate, trithionate and
tetrathionate and 5 mM thiosulfate are illustrated in Fig. 5.3(b) and (c)
respectively. Low concentrations of thiosulfate and/or polythionates in samples
did not affect the gold peak significantly, as evidenced by the electropherogram in
Fig. 5.2. PeaIC II exhibited an UV spectrum similar to that for the main gold
169
Chapter5
50
45
40
_35 :::> ~ 30 -8 25 c: CU
.Cl 20 .. 0 ! 15 <(
10
5 (a)
0 1.6
Separation ofThiosulfate, Polythionates and the Gold Thiosulfate Complex by CE
1.7
..; N -...
0 N
tn -::s <(
(b}
..; N -...
0 N en -::s
<(
Peak Ill
(c~ 1--Raised Baseline Region --1
1.8 1.9 2.0 2.1 2.2 2.3 2.4
Migration Time (mins} 2.5 2.6 2.7 2.8
Fig. 5.3 Effect of sample matrix on the peak shape for the gold thiosulfate complex. Electropherograms of 0.13 mM gold thiosulfate in the presence of (a) no other matrix ions, (b) 1 mM thiosulfate 1 mM trithionate and 1 mM tetrathionate (shifted forward 0.3 mins) and (c) 5 mM thiosulfate (shifted forward 0.6 mins). Separation conditions as per Fig. 5.2.
170
Chapter5 Separation ofThiosulfate, Polythionates and the Gold Thiosulfate Complex by CE
thiosulfate peak, while that of peak III was similar to those of thiosulfate and
tetrathionate, however positive identification was not possible. A related problem
was that the behaviour of the gold peak was related to the injection history of the
capillary, with peak area being increased after injection of high thiosulfate
matrices.
The appearance of multiple peaks could be due to an equilibrium between the
mono- (Au(S20 3n and bis- thiosulfate (Au(S203)z3-) complexes. It would be
expected that mobility of the mono-thiosulfate complex would be considerably
lower than that of the bis-complex. This equilibrium would also be sensitive to
thiosulfate, the presence of which in the system would result in the equilibrium
shifting to favour formation of the bis-complex. Whilst no thermodynamic data
for the gold mono-thiosulfate complex could be located, there are literature
references to the labile nature of the gold thiosulfate complex [6].
Due to the inconsistencies observed for peak area and shape of the gold
thiosulfate complex, particularly for samples containing high thiosulfate matrices,
it was not possible to quantify this species by CE under the conditions used in this
work.
5.3.4 Linearity and Detection Limits
The detection limits and linearity ranges for the optimised method are given in
Table 5.1. Linearity was tested from the detection limit to 8 mM for thiosulfate,
and to 2 mM for trithionate, tetrathionate and pentathionate. A detection limit for
the gold thiosulfate complex was also calculated. Because of the different UV
absorbance maxima of the analytes the results for thiosulfate, tetrathionate and
171
Chapter5 Separation ofThiosulfate, Polythionates and the Gold Thiosulfate Complex by GE
Table 5.1 Thiosulfate, gold thiosulfate and polythionate detection limit and linear range data using the optimised CE method with UV detection at the specified wavelengths.
Detection Analyte Wavelength
(nm)
Thiosulfate (S20/-) 214
Gold Thiosulfate (Au(S20 3h3-} 195
Trithionate (S3os2-) 195
T etrath ion ate ( S4 0 6 2-) 214
Pentathionate (S5os2-) 214
Detection Limit (µM)
(SIN= 3)
2
0.5
1
1
0.5
Linear Range (µM) (R2 value)
40-8000 (0.9989)
10-2000 (0.9998)
10-2000 (0.9998)
5-2000 (0.9998)
172
Chapter 5 Separation ofThiosulfate, Polythionates and the Gold Thiosulfate Complex by CE
pentathionate were determined at 214 run, while for trithionate and gold
thiosulfate 195 nm was used. The limits were determined as the concentration of
each species giving a signal to noise ratio of 3: 1. Thiosulfate was prepared as
separate standards because of the risk of interactions with the polythionates, as
shown previously in Eqns 1.7 to 1.9 (Section 1.5.3).
Reproducibility of the method was determined usmg a solution of 0.1 mM
thiosulfate and 0.08 mM each of trithionate, tetrathionate and pentathionate.
Migration time reproducibility was < 1 % RSD and reproducibilities of normalised
peak areas were< 3% RSD for all four ions based on 12 replicate injections.
5.3.5 Analysis of Leach Solutions
A wide range of leach conditions can be found in the literature, with a recent
review reporting extremes of0.1-2 M for thiosulfate, 0.1-6 M ammonia and 0.001
- 0.1 M copper(II) [7]. Based on this source and our own experience, we estimate
that 70% of reported leaching regimes use conditions containing ~ 0.5 M
thiosulfate, ~ 2 M ammonia and ~ 0.05 M copper(II). For the purposes of this
study a leaching regime consisting of 0.5 M (NI4)2S203, 2 M NH3 and 0.05 M
CuS04 was chosen to evaluate the developed CE method.
The copper in the leach solutions can exist in a variety of forms including amine
and thiosulfate complexes. The thiosulfate complexes most likely to occur are the
bis- (Cu(S20 3)z3) and tris- (Cu(S203)/") forms which could potentially migrate in
a similar region to the anions of interest. However, solutions containing 16 mM
thiosulfate and 1 mM copper(II) (dissolved as sulfate) showed no copper peak,
perhaps due to precipitation as an insoluble mono-thiosulfate cuprous complex or
173
Chapter 5 Separation ofThiosulfate, Polythionates and the Gold Thwsulfate Complex by CE
the formation of a positively charged complex with bis-tris. The presence of
ammonia in the leach solution could be further expected to reduce the amount of
negatively charged copper-thiosulfate complexes. For these reasons, no
interference effects from copper or its complexes were observed.
A well known problem with CE is its difficulty in handling samples of high ionic
strength [8]. In order to obtain acceptable peak profiles, samples should have an
ionic strength less than one third that of the electrolyte solution [9]. This
necessitated that the leach solution be diluted prior to analysis and for the leaching
regime chosen, a dilution factor of 1 in 100 was appropriate. This dilution step
resulted in higher effective detection limits for the sample and also increased the
sample handling time prior to analysis which provides a longer time during which
changes in the sample speciation could occur. It was therefore imperative that the
samples were analysed as soon as possible after sampling.
Fig. 5.4 shows the UV electropherogram obtained from the injection of a sample
obtained from a leach of a sulfidic gold ore concentrate. Fig. 5.5 shows the results
of monitoring the leach over a period of nearly 6.5 h. The concentrations were
evaluated against a three-point calibration curve for each of the analyte ions.
Pentathionate was present in high enough conc~ntrations to be observed initially
in the leach solution, but its concentration diminished over time to below the
effective quantitation limit of 0.5 mM. Overall, the trends apparent for all the
polythionates in Fig. 5.5 are consistent with those from the corresponding study in
Chapter 4 that used IC (Fig. 4.6).
174
Chapters Separation of Thiosulfate, Polythionates and the Gold Thiosulfate Complex by CE
70
60
50 -::> < E 4o -Cl) CJ c C'll 30 .c ... 0 II)
N .c 20 N IO < .., 0 0 ..,
N N "' IO
10 rn 0 • "'
0 1.2 1.4 1.6 1.8 2.0 2.2 2.4 2.6
Migration Time (mins)
Fig. 5.4 Electropherogram of a 1: 100 diluted thiosulfate leach solution of a sulfidic gold ore 1 h after leaching was commenced. Conditions as per Fig. 5.2.
175
Chapter5
14
12
_10 :E E -8 c 0
~ - 6 c G) u g 4 0
0
Separation ofThiosulfate, Polythionates and the Gold Thiosulfate Complex by CE
40 80 120 160 200 240 280 320 360 400
Leaching Time (mins}
Fig. 5.5 Plot of thiosulfate and polythionate concentrations as a function of time, taken from the thiosulfate leach of a sulfidic gold ore concentrate. Analytical methodology as per Fig. 5.2, except detection wavelength of 195 nm was used only for trithionate, with the remainder detected at 214 nm. For leach conditions refer to Chapter 2, Section 2.2.2.
176
Chapter5 Separation of Thiosu/fate, Polythionates and the Gold Thiosu/fate Complex by CE
5.4 Conclusions
The utility of CE for the rapid determination of thiosulfate and polythionates in
gold thiosulfate leach liquors has been demonstrated. While the first
electrophoretic separation of the gold thiosulfate complex has also been shown,
inconsistencies in the peak area and shape caused primarily through the presence
of significant quantities of sulfur-oxygen anions in the sample matrix, prevented
quantification of the gold complex.
5.5 References
[l] A. Padarauskas, V. Paliulionyte, R. Ragauskas, A. Dikcius, J.
Chromatogr. A 879 (2000) 235.
[2] A. B. Roy, P.A. Trudinger, The Biochemistry of Inorganic Compounds of
Sulfur, Cambridge University Press, Cambridge, 1970.
[3] M. Macka, P. Andersson, P.R. Haddad, Anal. Chem. 70 (1998) 743.
[4] J. A. Dean, Lange's Handbook of Chemistry; 14th Ed., McGraw-Hill Inc.,
New York, 1992.
[5] C. A. Lucy, J. Chromatogr. A 850 (1999) 319.
[6] A. C. Grosse, G. W. Dicinoski, M. J. Shaw, P.R. Haddad,
Hydrometallurgy, in press.
[7] M. G. Aylmore, D. M. Muir, Miner. Eng. 14 (2001) 135.
[8] R. P. Oda, J.P. Landers, in Handbook of Capillary Electrophoresis, 2nd
Edition, J. P. Landers (Ed.), CRC Press, Boca Raton, 1997, p. 1.
[9] W. Ding, M. J." Thornton, J. S. Fritz, Electrophoresis 19 (1998) 2133.
177
Chapter 6
Isotachophoretic and Mixed-Mode Electrophoretic
Separations of Su/fur-Oxygen Anions in Gold Thiosulfate
Leach Solutions
6.1 Introduction
Concern over the dilution factor required in order to facilitate analysis of the gold
thiosulfate leach solutions by CE prompted an investigation into the use of ITP,
and mixed-mode ITP/CE methodologies. One advantage of ITP over other
separation techniques such as IC and CE is its greater capability to handle high
ionic strength matrices, minimising the need for dilution and potentially making it
a favourable alternative for the analysis of the gold thiosulfate leach matrix. The
technique may also enable the simultaneous analysis of four key sulfur anions,
namely, thiosulfate, sulfate, trithionate and tetrathionate in leach solutions, which
has not been previously achieved.
Therefore, this chapter outlines a preliminary investigation into the utility of ITP
for the separation and analysis of sulfur anions in gold thiosulfate leach liquors.
The developed method is applied to the determination of thiosulfate and sulfate in
these solutions. Also examined is the use of a mixed-mode ITP/CE separation to
determine whether this approach has any advantages over the developed CE and
ITP methodology.
Chapter 6 Jsotachophoretic and Mixed-Mode Separations
6.2 Experimental
6.2. 1 Instrumentation
All capillary electrophoretic experiments were performed on an Agilent
Technologies 3°CE (Waldbronn, Germany), equipped with a photodiode array
(PDA) detector. Separations were conducted in coupled fused silica capillaries
(Polymicro Technologies, Phoenix, AZ, USA), consisting of a 20 cm 250 µm l.D.
segment joined to a 28.5 cm 75 µm l.D. segment by means of a Teflon sleeve
( ~ 1 cm). The effective length of the capillary was 40 cm with the detection
window in the 7 5 µm segment. All separations were performed at a capillary
oven temperature of 30°C using a variety of different driving currents, some
involving a simple step gradient. Injection was performed using a pressure of 50
mbar applied for 3 s. Data collection was performed using Agilent Technologies
3°CE ChemStation software, with a data acquisition rate of 10 Hz unless
otherwise specified.
The mixed-mode ITP/CE work was conducted on similar instrumentation with
similar conditions to the pure ITP method, except using only 75 µm l.D.
capillaries of 40 cm effective and 48.5 cm total length unless otherwise specified.
For pH adjustments, an Activon (Thomleigh, NSW, Australia) Model 210 pH
meter was used.
179
Chapter 6 lsotachophoretic and Mixed-Mode Separatzons
6.2.2 Procedures
The bis-tris buffer solutions were adjusted to the required pH using the acid of the
anion required for the electrolyte. Sodium hydroxide solutions were prepared
from a ~50% wlw stock solution.
Capillary flushing procedures were the same as described in Chapter 5. For
calibration purposes injections of each standard were made at least in duplicate.
To minimise carry-over problems the tenninating electrolyte solution was
replaced after each analysis, and the outside of the capillary inlet was cleaned by
cycling the instrument through 3 electrolyte vials containing milli-Q water
between each analysis.
The synthetic leach solution used to assess the utility of the technique for this
matrix was prepared in a beaker that was thereafter covered with a watchglass.
The solution was left at room temperature with slow mechanical stirring.
The, locations of the zone boundaries were determined from the derivative plot of
each phcrogram.
6.3 Results and Discussion
6.3.1 Preliminary Investigations and Development of the ITP System
Thiosulfate has the highest mobility of the ions under consideration in this work,
and is actually of higher mobility than most anions used commonly as the leading
ion in ITP systems. It is therefore difficult to find a suitable leading ion without
adding a modifier to the buffer to selectively reduce the effective mobility of
180
Chapter 6 Jsotachophoretic and Mixed-Mode Separations
thiosulfate. In the existing literature this has been achieved in one of two ways,
through the preparation of the leading electrolyte in a 1: 1 mixture of acetone and
water [l], or the addition of calcium(II) as an ion-association reagent [2,3]. Either
method enabled chloride to be used as the leading electrolyte anion. Because of
concern that components of the leach matrix may precipitate as a result of either
the high proportion of organic solvent in the former system or the possibility of
calcium sulfate precipitation in the latter, neither systems could be utilised in this
study. Earlier research undertaken in our laboratory using CE [ 4] have
determined that electrolytes containing bis-tris (pKa = 6.46 [5]) as a cationic
buffering reagent decreased the effective mobility of thiosulfate and the
polythionates relative to the monovalent ions bromide, iodide and nitrate,
presumably through an ionic-strength and/or an ion-association mechanism. It
was therefore expected that the use of a sufficient concentration of this ion in the
leading electrolyte could potentially provide the basis for an electrolyte system
where thiosulfate had an effective mobility lower than that of chloride. Initially, a
leading electrolyte containing 60 mM bis-tris was used, (adjusted to pH 6.4 with
hydrochloric acid), since this had previously been found to reduce the effective
mobility ofthiosulfate in a CE system to below that of bromide [4]. To suppress
the electro-osmotic flow (EOF) in the capillary, the EOF suppressant
hydroxypropylmethylcellulose (HPMC) was used at a concentration of 0.05% wlv
in combination with the comparatively high ionic-strength of the leading
electrolyte. The terminating electrolyte used was initially 10 mM sodium
formate. The initial current settings were -90 µA changing to -20 µA at 11 min.
The non-UV-absorbing analyte sulfate was identified by the presence of a low
absorbance band between two zones of UV-absorbing analytes. The remaining
181
Chapter 6 /sotac/wplzoretic and Mixed-Mode Separations
zone identifications were made via the use of the PDA spectra. Testing was
performed using a solution theoretically containing 50 mM thiosulfate, 20 mM
sulfate and 5 mM trithionate. The term "theoretically" is used since tetrathionate
is formed in the sample through mixing oftrithionate and thiosulfate.
Using the initial system, the sulfur anions were found to migrate in the order
thiosulfate < trithionate < sulfate < tetrathionate, but the boundary between
trithionate and sulfate was poorly defined due to incomplete zone separation.
There was also a poorly defined boundary between the zones for the chloride
leading electrolyte and thiosulfate. Further testing indicated that the presence of
significant chloride concentrations in the sample matrix influenced the zone
length of the thiosulfate band, which impeded quantification.
In order to solve these problems, a further ion-pair reagent, tetrabutylammonium
chloride (TBA +er), was also added to the leading electrolyte. The concentration
of TBA+ was found to influence the separation of trithionate and sulfate, actually
reversing the migration order of these species. A TBA+ concentration of 10 mM
added to the 60 mM bis-tris containing leading electrolyte, was found to give a
satisfactory separation of sulfate, trithionate and tetrathionate ions, but did not
however improve the definition of the chloride/thiosulfate boundary. A bis-tris
concentration of 120 mM (adjusted to pH 6.4 with hydrochloric acid, also
containing 10 mM TBA +er and 0.05% wlv HPMe) was observed to improve the
boundary between chloride and thiosulfate markedly, but also resulted in
incomplete separation of the sulfate and trithionate zones. Increasing the TBA+
concentration of the leading electrolyte to 20 mM rectified this problem with only
182
Chapter6 Jsotachophoretic and Mixed-Mode Separations
a slight decrease in the sharpness of the. chloride/thiosulfate boundary. Finally,
the hold up time was found to be more reproducible when a buffered terminating
electrolyte was used and for this reason a terminating electrolyte containing
20 mM bis-tris adjusted to pH 6.4 with formic acid was adopted. The optimised
ITP system employed was a leading electrolyte comprising120 mM bis-tris, 20
mM TBACl, 0.05% HPMC adjusted to pH 6.4 with hydrochloric acid, a
terminating electrolyte comprising 20 mM bis-tris, adjusted to pH 6.4 with formic
acid, and an operating current of -110 µA. All other conditions were as specified
in Section 6.2.1. With this electrolyte system, the analysis time including
capillary pre-flushing procedures was less than 30 min, which is unfortunately
significantly longer than the IC and CE methods described previously.
Due to time constraints it was not possible to thoroughly investigate the method
for its capability to simultaneously determine all four of the sulfur anions
discussed in the introduction to this chapter, namely, thiosulfate, sulfate,
trithionate and tetrathionate. As a result it was decided at this point to focus on the
determination of thiosulfate and sulfate, and leave the polythionates for future
work.
6.3.2 Linearity, Detection Limits and Reproducibility
Problems were encountered with the reproducibility of the injection volume and it
was therefore necessary to use an internal standard. Thiocyanate, used at a
concentration of 40 mM, was chosen for this role since it has an effective mobility
between trithionate and tetrathionate in this system. To confirm that there was no
interference between thiocyanate and either of the polythionates a solution
containing ~20 mM each of tri- and tetrathionate in addition to 40 mM
183
Chapter 6 Jsotachophoretic and Mixed-Mode Separations
thiocyanate was injected. There were no mixed zones evident between these
species in this solution and the boundaries were sharp. It was therefore concluded
that no interferences existed.
Detection limits for the method were 2.1 mM for thiosulfate and 1.3 mM for
sulfate, determined as three times the standard deviation observed for triplicate
injections of a standard mixture containing 4 mM thiosulfate, 1.4 mM sulfate and
the internal standard. Calibration linearity using normalised peak areas was
satisfactory in the range 4-200 mM for thiosulfate (R2 = 0.9999) and 1.4-68 mM
for sulfate (R2 = 0.9989). It should however be noted that the linear range for both
thiosulfate and sulfate was determined from a single set of mixed standards, in
which the highest concentration solutions contained >200 mM thiosulfate, which
could be expected to have affected the observed linear range for sulfate. Linearity
was poor when calculated from the absolute zone lengths, with the calibration
curves exhibiting behaviour that could not be explained by poor injection volume
reproducibility alone. This may relate to the sample ionic strength, and requires
further investigation.
Reproducibility of the method was tested using a solution containing 80 mM
thiosulfate, 27 .2 mM sulfate and 40 mM of thiocyanate and the reproducibility of
the normalised zone length was <3% RSD for both species, based on 6 injections.
6.3.3 Analysis of Synthetic Leach Solutions
For the pwposes of testing the methodology, a synthetic leachate using the same
concentrations of the starting reagents as with the IC and CE work, specifically,
0.5 M (N!Li)2S203, 2 M NH3 and 0.05 M CuS04 was chosen to test the developed
184
Chapter 6 /sotachophoretic and Mixed-Mode Separations
method. Dilution of this sample by a factor of at least 2:5 was required to ensure
the concentration of thiosulfate and sulfate were within the linear range. Fig. 6.1
demonstrates an example pherogram from the synthetic leach solution diluted 2:5,
obtained after the leach had been in progress for 7.25 hours. The implied.
concentrations of thiosulfate and sulfate in this sample are 0.415 M and 55 mM
respectively, calculated against 3 point calibration curves. Bands for trithionate
and tetrathionate in this sample are also visible, offering further evidence that the
technique will be useful for simultaneous determination of these anions in leach
solutions. The detection limits for these species are expected to be in the low
millimolar range, and may therefore not be sufficient for all leach processes and
conditions, an effect compounded by any dilution required. For example, small
scale resin-in-pulp leach investigations by Nicol and O'Malley [6] determined that
the polythionate concentrations generated in their leachate (20 mg/L or 0.1 mM
S30l-, 0.09 mM S40l) limited the achievable gold loading (~3g/L Au) onto the
commercial resin (Amberjet® 4200) used for gold recovery. This indicates a
situation where polythionate concentrations need to be monitored at the sub
millimolar level. This potential problem needs to be investigated in future work.
The cause of the tailing of the tetrathionate zone should also be investigated, in
case it indicates incomplete separation between tetrathionate and the terminating
electrolyte.
An investigation was performed into 1 :20 dilutions of the synthetic leach solution
in order to assess the method for much more dilute solutions. For such injections,
the results were complicated by the very short polythionate zones. These were
often not long enough for reliable quantification, with the start and end of the
185
Chapter6
3200
2800
2400
5 g 2000
~ :; 1600 -e 0 UI
~ 1200
800
400
.
0
19.8 .
19.9 ;i!O 20.1
/sotachophoretic and Mixed-Mode Separations
SzOl·
. 20.2 20.3 20.4
Migration Time (mins)
A u .:, o"' z rn ..
~
.:,
c:. 0 o .. rn"
L!!l...r .
20.5
ldAJdtl
Leach Solution
20.6 20.7 20
Fig. 6.1. Isotachopherogram of a 2:5 diluted synthetic leach solution sampled 7 .25 hours after commencement, with analysis occurring as soon as possible after sampling. Leading electrolyte was 120 mM bis-tris, 20 mM TBACl and 0.05% wlv HPMC adjusted to pH 6.4 with HCl, terminating electrolyte was 20 mM bis-tris, adjusted to pH 6.4 with HCOOH. Current was -110 µA and detection was effected at 214 run. Thiocyanate was added as an internal standard. For remaining conditions see Section 6.2. Note that the y-axis of the figure has no absolute meaning for the derivative plot.
186
Chapter 6 Isotachophoretic and Mixed-Mode Separations
band being too close together to allow resolution between the corresponding
derivative peaks. However, these bands were sometimes sizeable enough to
introduce an inaccuracy in the measurement of adjacent bands. This problem
could be solved for trithionate interference by using both the pherograms recorded
at 195 nm and 214 nm. To accurately determine the end of the sulfate band, the
195 nm wavelength was used since the disparity in absorbtivity between sulfate
and trithionate is much greater at this wavelength, giving a correspondingly
sharper and clearer derivative peak. For similar reasons, the start of the
thiocyanate band is calculated using the derivative of the 214 nm pherogram. This
approach was not as successful in overcoming the interference from the
tetrathionate and the best means of removing this problem was to increase the
dilution factor so that the tetrathionate was not detectable.
6.3.4 Investigation into the use of Mixed-Mode ITPICE Separations
Preliminary investigations into mixed-mode ITP/CE separations were also
performed, as it was hoped this would overcome the problems observed with the
conventional CE (ionic-strength intolerance) and ITP (analysis time) techniques.
Due to a lack of specialised instrumentation it was not possible to use coupled
capillary ITP/CE techniques such as those described previously [7,8]. Single
capillary ITP/CE [9] with a pressure-generated counterflow was also not
considered since it would be difficult to implement for a simultaneous
determination of all the sulfur-oxygen ions of interest in the leach. Instead, a
discontinuous buffer system in a single CE capillary was used, in which only the
macrocomponents are separated in the ITP mode (thiosulfate and depending on
the concentrations present sulfate and trithionate), with the remaining (lower
mobility) anions being separated via a CE mechanism. There does not appear to
187
Chapter 6 Jsotachophoretic and Mixed-Mode Separations
be any reference in the literature to the use of such a system, the closest being ITP
superimposed on CB, which has been used only as a means of improving
detection limits in simple matrices [I O].
Initial experiments were conducted using a standard 75 µm capillary with bis
tris/TBA + chloride-based leading and sodium perchlorate terminating electrolytes.
The aim was to determine thiosulfate, sulfate and trithionate via an ITP
mechanism with tetrathionate and possibly pentathionate quantified by CB.
Unfortunately, significant baseline problems were observed and it became
apparent that simultaneous determination of sulfate could not be achieved since
the zone length for this ion was too short. Therefore, the aim shifted to the
analysis of thiosulfate and the polythionates only, with thiosulfate separated in the
ITP mode, and the polythionates by CB. The optimised leading electrolyte from
the earlier ITP work was adopted, while a bis-tris sulfate terminating electrolyte
(pH adjusted to 6.0 or 6.4) was used.
Injection of a neat synthetic leach solution (0.5 M <N"H4)2S203, 2 M NH3, 0.05 M
CuS04) gave extremely poor results, however a I :5 diluted portion of this solution
produced a pherogram with a· clear zone for thiosulfate, followed by separate
trithionate and tetrathionate peaks, despite their poor shape. This separation is
illustrated in Fig. 6.2(a).
Improvements to the separation for the components migrating in the CB mode
were attained by spiking the sample with a low mobility anion such as acetate to
act as a transient terminating electrolyte. However this also caused a significant
188
Chapter 6 Jsotachophoretic and Mixed-Mode Separations
1000 .:. .. 0 .. (/)
900
800
700
s 1 600
GI u 500 c .:. .e .. 0
0 400 ..
Ill "' .Q
< 300
200
100
0 2.5 2.7 2.9 3.1 3.3 3.5 3.7 3.9
Migration Time (mins)
Fig 6.2 (a) 1:5 diluted leach solution initially containing 0.5 M (~)28203 , 2 M NH3 0.05 M CuS04 and 0.4 mM Na3Au(S20 3)2. (b) As for (a) except spiked with ---0.6M CH3COONa. Leading electrolyte 120 mM bis-tris 20 mM TBACl +0.05% wlv HPMC adjusted to pH 6.4 with HCl, terminating electrolyte 25 mM bis-tris + 0.05 wlv HPMC adjusted to pH 6.4 with H2S04. Driving current - 125 µA. For other conditions see Section 6.2. Unknown peak is suspected to be an EOF disturbance coming from the detection side of the capillary.
189
Chapter 6 /sotachophoretic and Mixed-Mode Separations
reduction in the observed peak areas, including those for the thiosulfate zone. The
difference in the separations is demonstrated in Fig. 6.2(b ). There were also
significant peak area reproducibility problems observed throughout this work,
particularly for solutions spiked with the transient terminating electrolyte.
Investigations employing a simpler matrix containing 0.3 M NaCl and
approximately 5 mM each of K1S306 and K2S406 were unable to isolate the cause
of this problem, although it is almost certainly related to the high ionic strength of
the matrices under investigation. It is likely that further dilution of the samples
and the use of lower transient terminating electrolyte concentrations is required.
As a result of these problems this work was not considered further.
6.4 Conclusions
The utility of isotachophoresis for the determination of thiosulfate and sulfate has
been demonstrated in a synthetic leach sample with minimal dilution. Further
optimisation of the methodology is required, in order to obtain lower detection
limits and allow application of the method to a wider variety of leach regimes.
The capabilities of the method for the simultaneous determination of tri- and
tetrathionate also need to be assessed. Ways of decreasing the analysis time and
improving the reproducibility of the method to remove the need for an internal
standard also require investigation.
The concept of single-capillary ITP/CE, without counter-flow, has also been
demonstrated for these leach samples. Further work is needed to establish the
upper tolerable limit of sample ionic strength (with and without spiking with a
transient terminating electroly1;e), and also means of improving the reproducibility
of the technique.
190
Chapter 6 Jsotachophoretic and Mixed-Mode Separations
6.5 References
[1] T. Yagi, K. Kojima, T. Haruki, J. Chromatogr. 292 (1984) 273.
[2] D. Lucansky, E. Komanova, J. Marak, A. Pukacova, J. Chromatogr. 390
(1987) 147.
[3] 0. Janiczek, M. Mandl,.P. Ceskova, J. Biotechnol. 61 (1998) 225.
[4] J. O'Reilly, unpublished results.
[5] J. A. Dean, Lange's Handbook of Chemistry; 14th edition., McGraw-Hill
Inc., New York, 1992.
[6] M. J. Nicol, G. O'Malley, JOM October 2002 44.
[7] D. Kaniansky, I. Zelensky, A. Hybenova, F. I. Onuska, Anal. Chem. 66
(1994) 4258.
[8] D. M. Osbourn, D. J. Weiss, C. E. Lunte, Electrophoresis 21(2000)2768.
[9] M. Mazereeuw, U. R. Tjaden, N. J. Reinhoud, J. Chromatogr. Sci. 33
(1995) 686.
[10] J. L. Beckers, Electrophoresis 21 (2000) 2788.
191
C:hapter 7
General Conclusions
The following conclusions can be drawn from this study into the chromatographic
and electromigrative determination of sulfur-oxygen anions in gold thiosulfate
leach solutions.
The chromatographic behaviour of the gold thiosulfate complex in ion-interaction
systems was problematic. Matrix-free solutions demonstrated partial dissociation
and/or decomposition of the gold complex on-column. This effect could be
minimised, but not completely solved, through the addition of thiosulfate to the
chromatographic eluent. There was evidence that some of the gold present in such
standards precipitated on-column, even in the presence of eluent thiosulfate,
although the mechanism or mechanisms involved have not been determined.
However, the decomposition of the gold in such standards was reproducible, such
that the generation of linear calibration curves for the gold was possible provided
that the eluent contained thiosulfate.
The matrix ions, thiosulfate, trithionate and/or tetrathionate in gold thiosulfate
samples had a detrimental effect on the chromatography of this complex. Samples
containing thiosulfate caused a memory effect in the chromatographic system,
with the thiosulfate content of the preceding sample influencing the gold peak
area of the next injection. Low concentrations of thiosulfate in the sample caused
increased but irreproducible gold thiosulfate peak areas. These difficulties again
could be minimised by the addition of thiosulfate to the eluent. In contrast, the
Chapter 7 General Conclusions
presence of high (> 10 mM) sample thiosulfate concentrations caused a sharp
decrease in the gold peak area. This matrix induced a broadening effect with the
retention factor of part, if not the entire quantity of the gold complex in the
injected sample reduced. The collected experimental data suggested that this was,
in part, attributable to a "sample-induced micro-gradient" self-elution effect.
Partial recovery of the peak, achieved through adding the eluent ion-interaction
reagent to the sample, indicated that the disturbance of the column equilibrium by
samples containing high matrix ion concentrations also played some role in the
poor chromatographic properties observed for the gold complex. Markedly
different results observed when using a polymer-based, compared to a zirconia
based, column for the separation suggested the stationary phase itself may also
contribute to these problems.
Low millimolar concentrations of trithionate and tetrathionate in the sample
resulted in splitting or broadening of the gold thiosulfate species in the
chromatogram. The cause of this has not been determined, but may rel.ate to
equilibria between thiosulfate and the polythionates, or could also be caused by
the micro-gradient self-elution effect mentioned earlier. In contrast, the addition
of 1 M ammonia to gold thiosulfate standards had no significant effect on its
chromatography, presenting further evidence that the gold diammine complex is
not formed significantly in gold leach solutions.
Separation of the polythionates and the gold thiosulfate complex can be
accomplished by the use of a system consisting of a Dionex NGl and NSl-5µ
column in series and an eluent containing 15% v/v acetonitrile, 3 mM TBAOH
193
Chapter 7 General Concluswns
and 2.5 mM sodium carbonate, with the acetonitrile concentration stepping to
28% vlv at injection. Varying the carbonate concentration of the eluent altered the
selectivity of the gold thiosulfate peak relative to the polythionates. However,
determination of gold thiosulfate in leach solutions was not possible by this
technique, which was attributed primarily to the self-elution effect described
previously for high thiosulfate containing solutions. The polythionates (Sxoi-, x =
3 to 5) can be determined using the optimised methodology in a leachate
containing 0.5 M (NJL)2S203, 2 M NH3 and 0.05 M CuS04, without dilution. The
chromatography of copper in this system was complicated, with results
demonstrating that some on-column precipitation occurred, whilst the fraction
remaining in solution appeared to be divided between labile complexes, presumed
to contain ammonia and/or thiosulfate as ligands that produced poorly shaped
chromatographic peaks.
Thiosulfate, the polythionates (Sxoi-, x = 3 to 5), and the gold thiosulfate
complex could be separated in standards by CE employing 75 µma fused-silica
capillary, a -30 kV applied voltage and an optimised electrolyte containing
25 mM bis-tris adjusted to pH 6.0 with H2S04. The presence of low millimolar
concentrations of thiosulfate and the polythionates in the sample was detrimental
to gold thiosulfate migration, with irreproducible peak areas and shape resulting,
along with peak splitting. This behaviour prevented determination of the gold in
leach solutions using this method. However, the CE procedure did provide a rapid
alternative methodology for the determination of thiosulfate and the polythionates
in leach solutions, although significant dilution of the sample was required prior
to injection.
194
Chapter 7 General Conclusions
ITP provided an alternative electromigrative technique for the determination of
thiosulfate and sulfate in gold thiosulfate leach solutions, with a significantly
lower dilution being required than for CE. Using a leading electrolyte of 120 mM
bis tris, 20 mM TBACl, 0.05% w/v HPMC, adjusted to pH 6.4 with hydrochloric
acid, and a terminating electrolyte of 20 rnM bis-tris, adjusted to pH 6.4 with
formic acid, determination of thiosulfate concentrations up to 0.2 M and sulfate
concentrations up to 68 mM was possible in synthetic leach solutions. Detection
limits were 2.1 mM for thiosulfate and 1.3 rnM for sulfate. To obtain acceptable
reproducibility an internal standard (thiocyanate) was required. The developed
method also indicated potential for the first simultaneous analysis of the four
important non-metal sulfur-oxygen anions in gold thiosulfate leach solutions,
namely, sulfate, thiosulfate, trithionate and tetrathionate. The concept of using a
singe-capillary mixed ITP/CE system without counterflow for the separation of
thiosulfate and the polythionates was demonstrated. Significant difficulties with
reproducibility must be overcome before this technique can be used for the
determination of anions in high ionic strength matrices, such as thiosulfate leach
solutions.
Finally, it should be noted that further work is required in the following areas:
The effect of dilution and any other sample pre-treatment methods on the
speciation of the leachate needs to be quantified accurately to establish formally if
these procedures introduce any significant inaccuracies into the collected data.
195
Chapter 7 General Conclusions
Problems preventing successful chromatographic and electrophoretic
determination of the gold thiosulfate are yet to be overcome. Future experiments
should focus on developing further understanding of the mechanisms affecting the
behaviour of this species. Such work may provide the way forward in developing
a technique that can simultaneously determine the gold complex and the other
sulfur-oxygen species important to the leach process. The speciation of the other
metals, for example copper and silver, that may be present in leach solutions also
requires investigation, although work conducted in the present study on the
behaviour of the copper complexes suggests that this will be an even more
challenging undertaking than the determination of the gold complex.
For the ion-interaction methodology developed for polythionate analysis, the
cause of the shoulder on the tetrathionate in leach samples needs to be determined.
Finding a means for decreasing the analysis time, without sacrificing the
capability to inject undiluted samples, or compromise the detection capabilities of
the method, would also be an advantage.
Further method development by CE should focus on shortening the total analysis
time and finding ways of reducing the pre-analysis dilution required for the leach
samples. The latter problem is however one of the limitations inherent in the use
of CE, although development of the single capillary ITP ICE system, demonstrated
conceptually in Chapter 6, may offer some advantages for leach samples. An
investigation relating to the determination of the gold thiosulfate complex by CE
would be to examine the effect of adding thiosulfate to the electrolyte, in a similar
fashion to the approach used in the ion-interaction work.
196
_r, I :
.. ,
,--" ,.
1. !·;·
' t
Chapter 7 General Conclusions
The utility of ITP for gold thiosulfate leach solutions warrants further
investigation. The developed method may allow simultaneous determination of
the key non-metal sulfur-oxygen species in leach solutions, with the additional
advantage that minimal dilution would be required prior to analysis. The use of
instrumentation specifically designed for ITP may also result in improvements to
the method outlined in Chapter 6, potentially removing the need for an internal
standard in the samples. Coupled capillary techniques, particularly ITP-CE,
should also be examined in detail for their applicability to leach matrices .


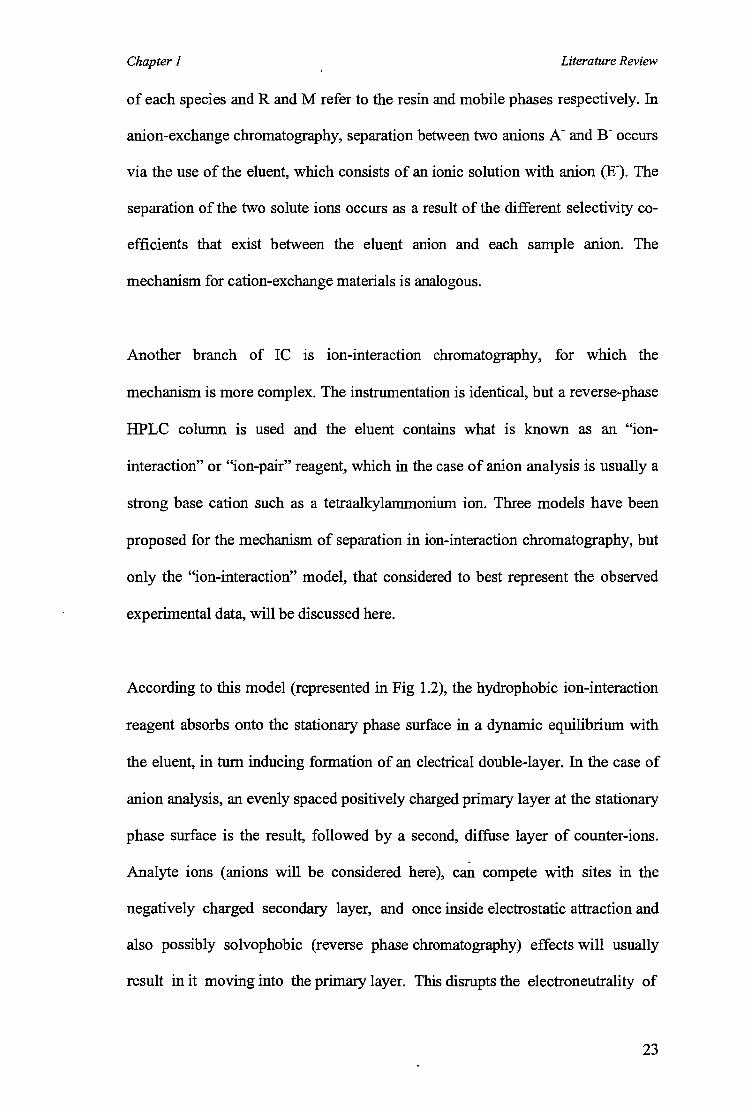


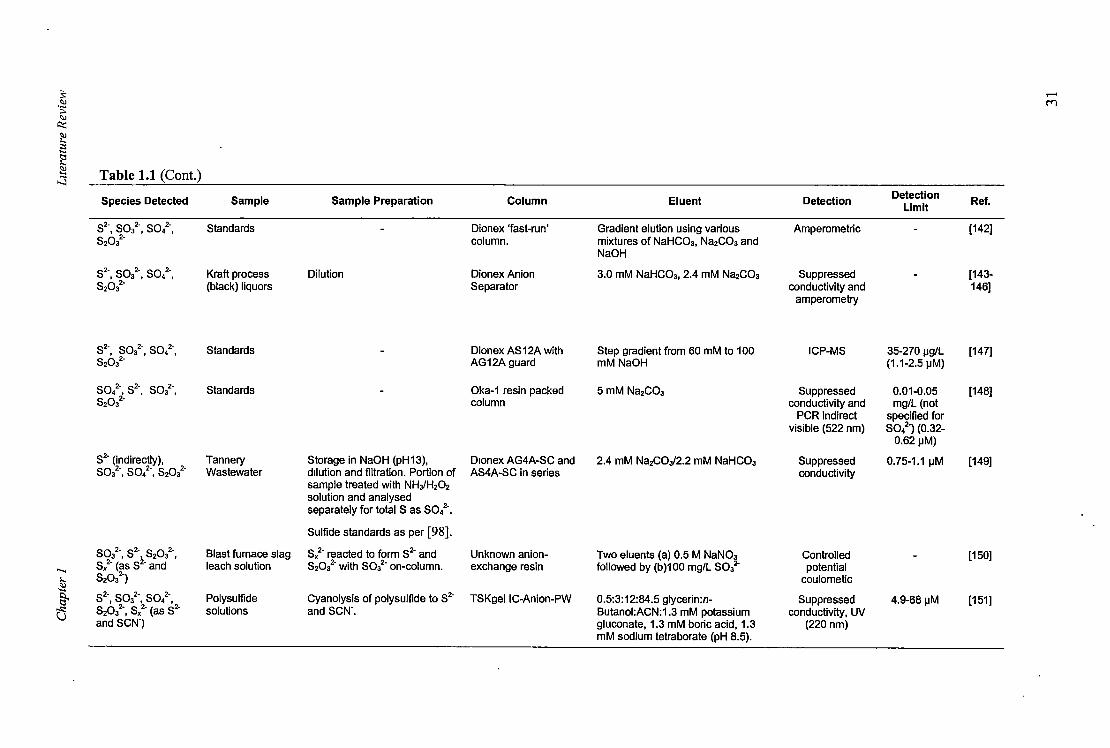

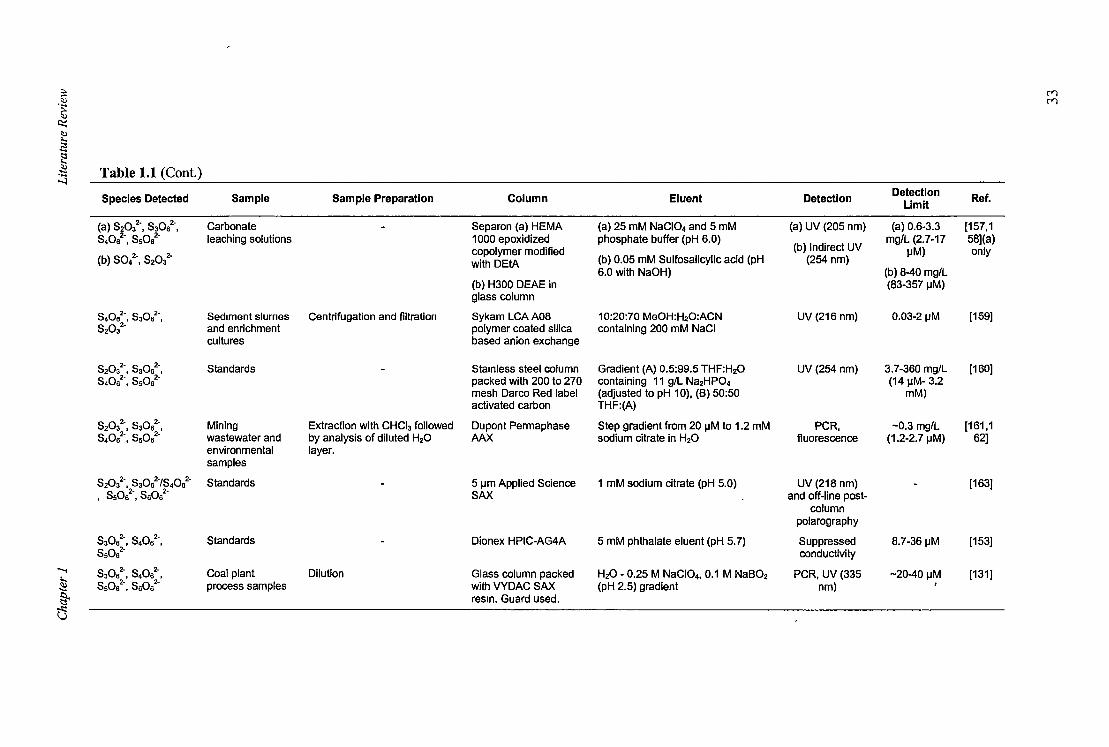


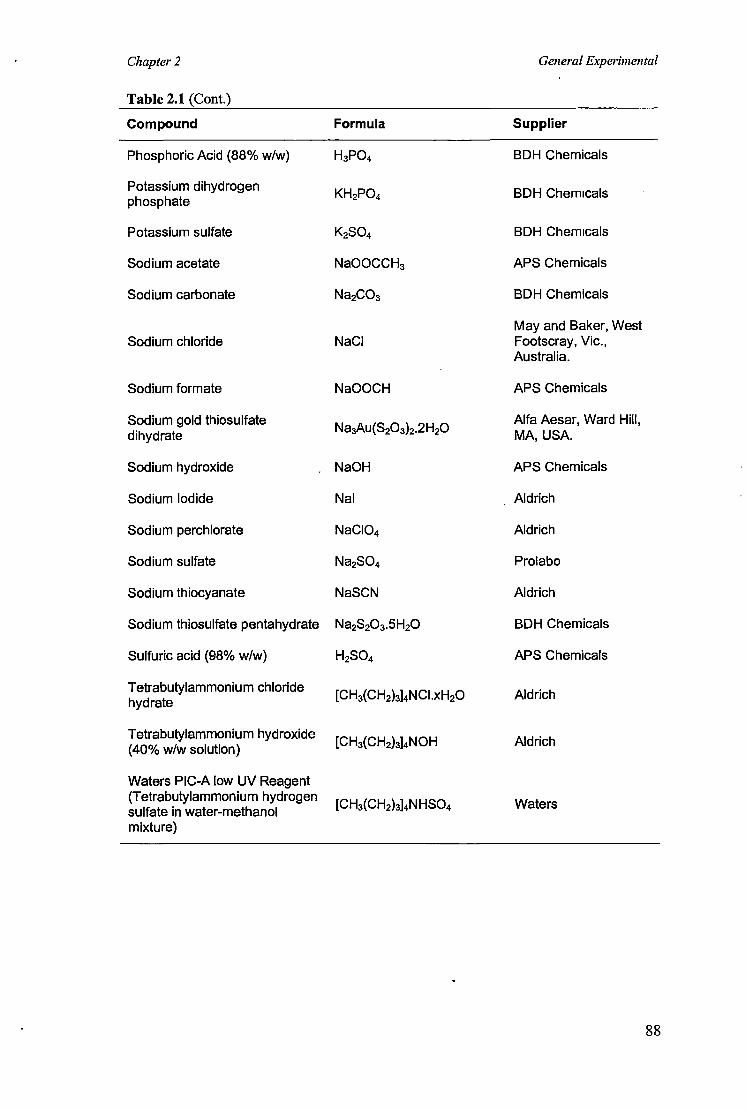


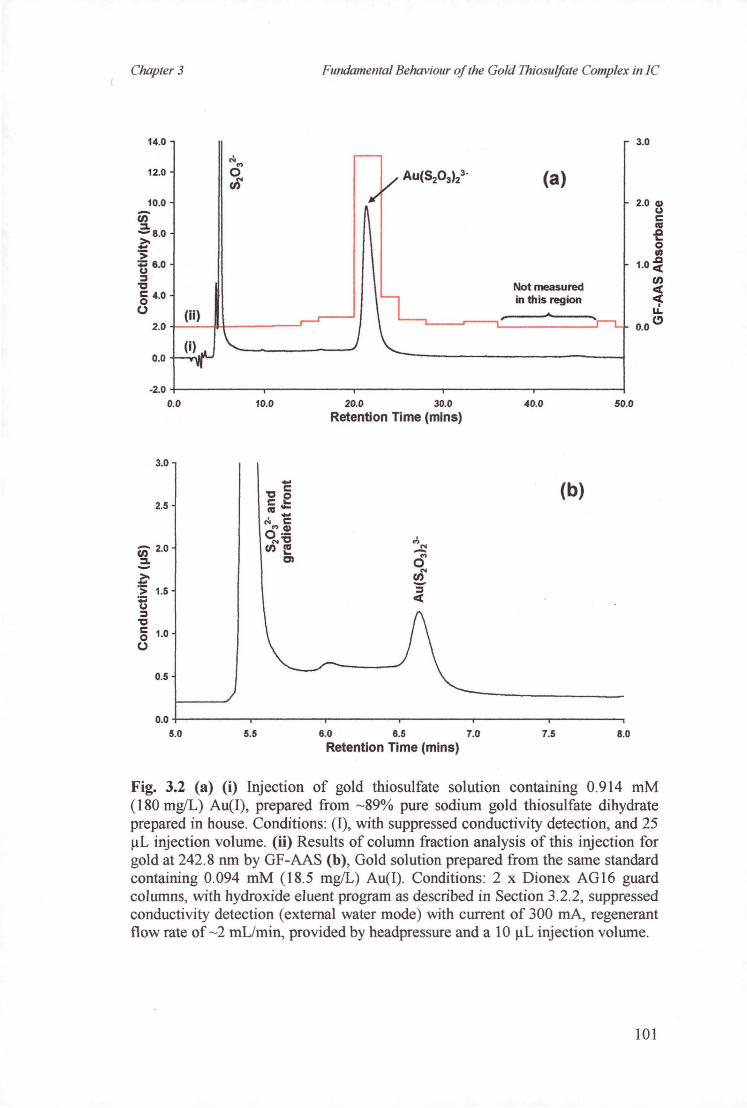


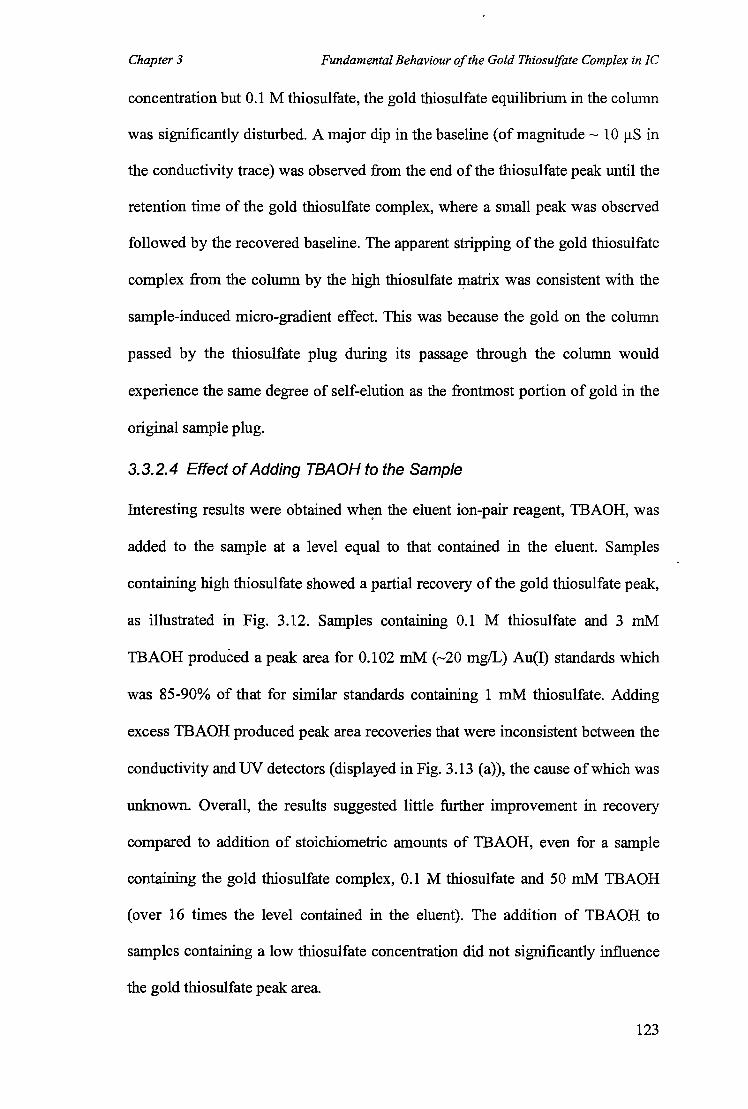

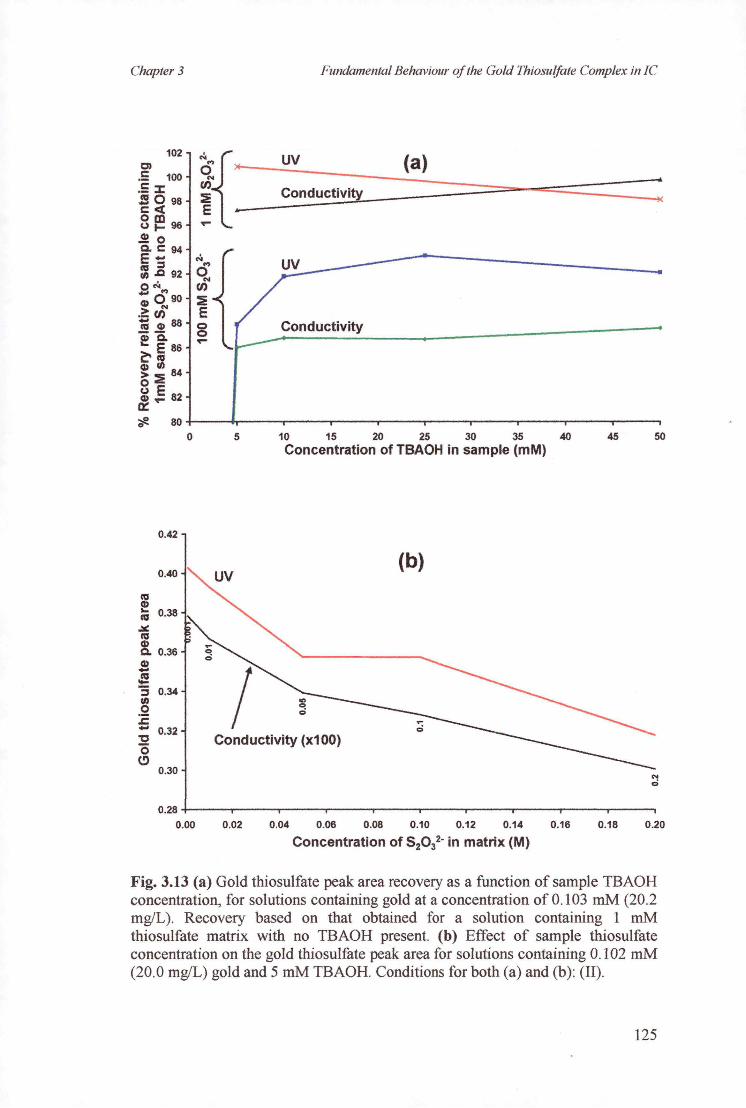


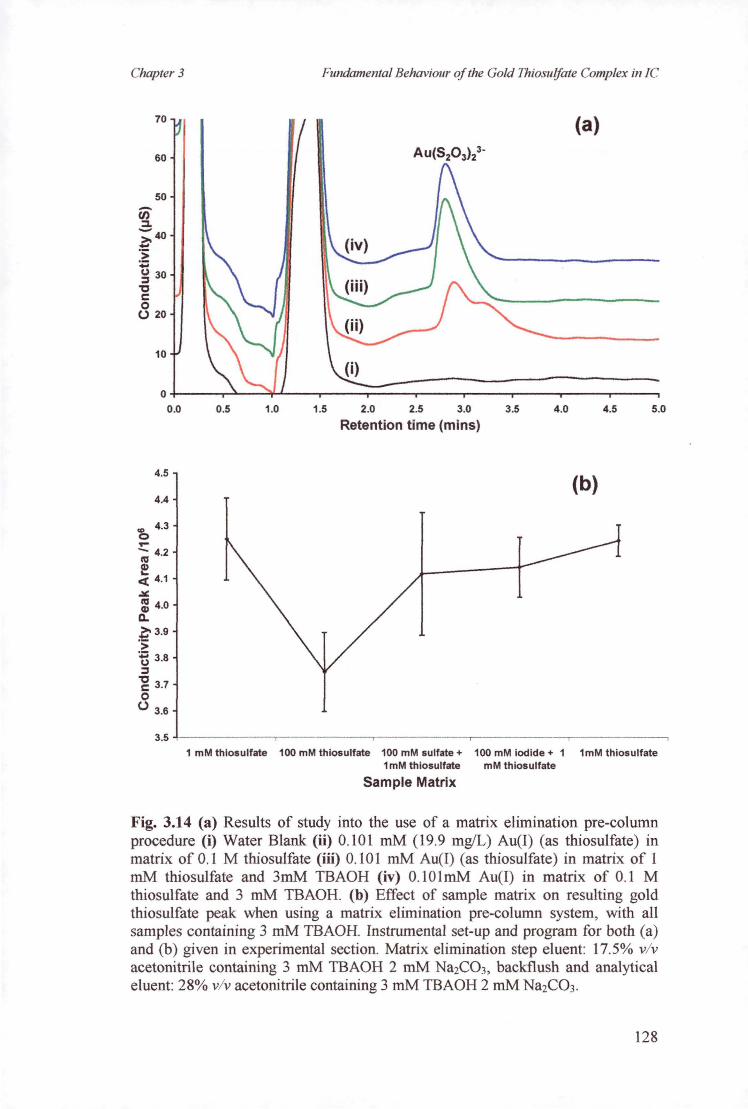


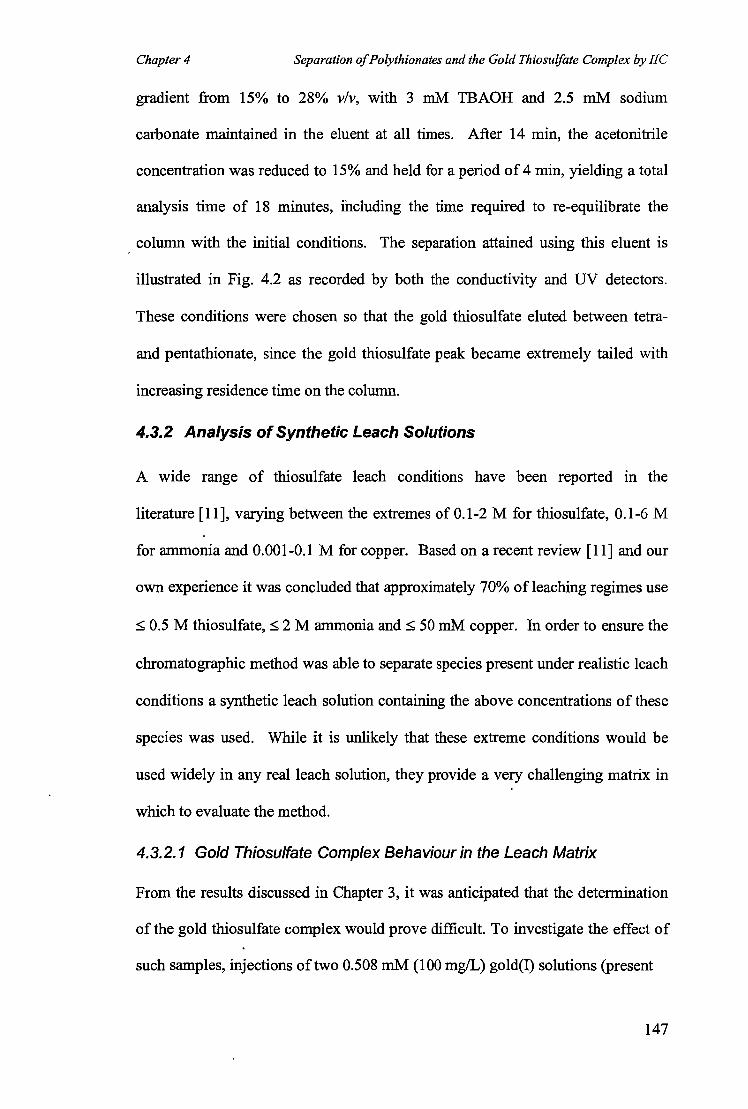


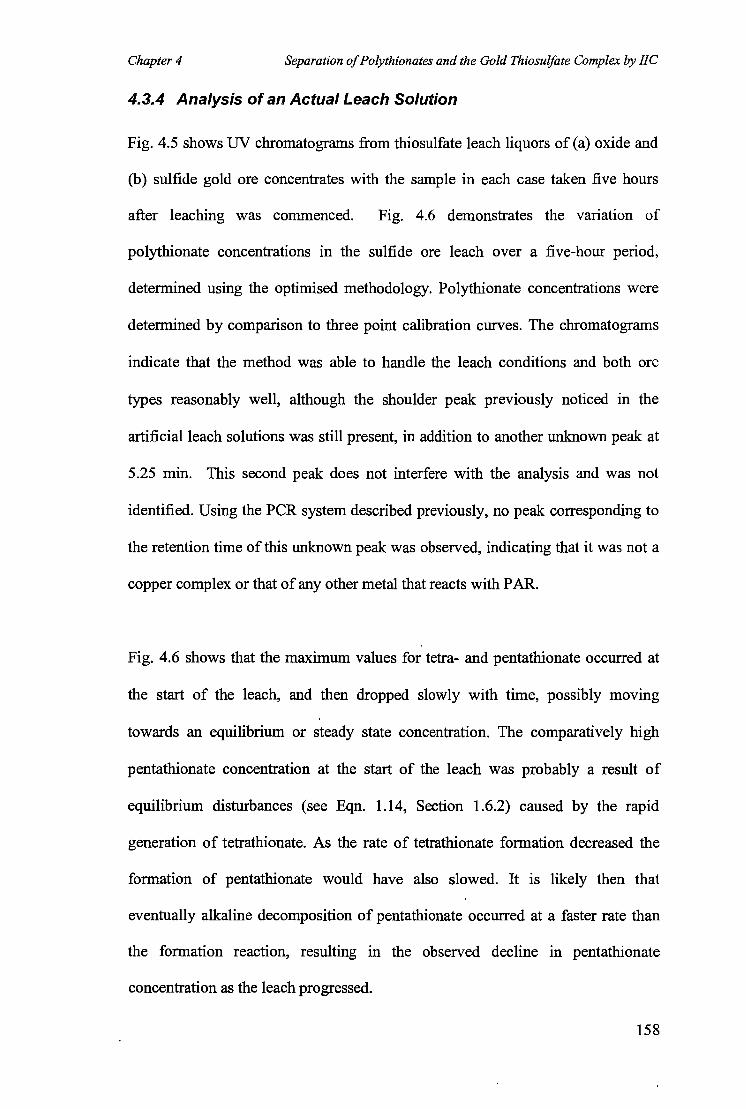


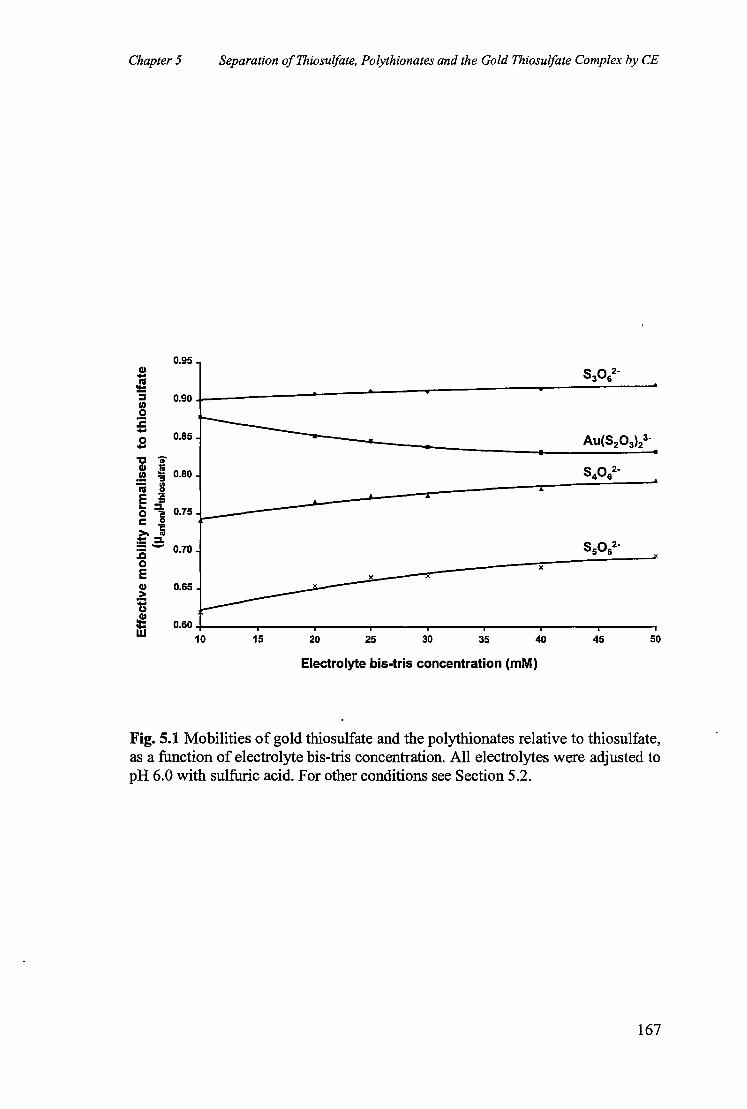
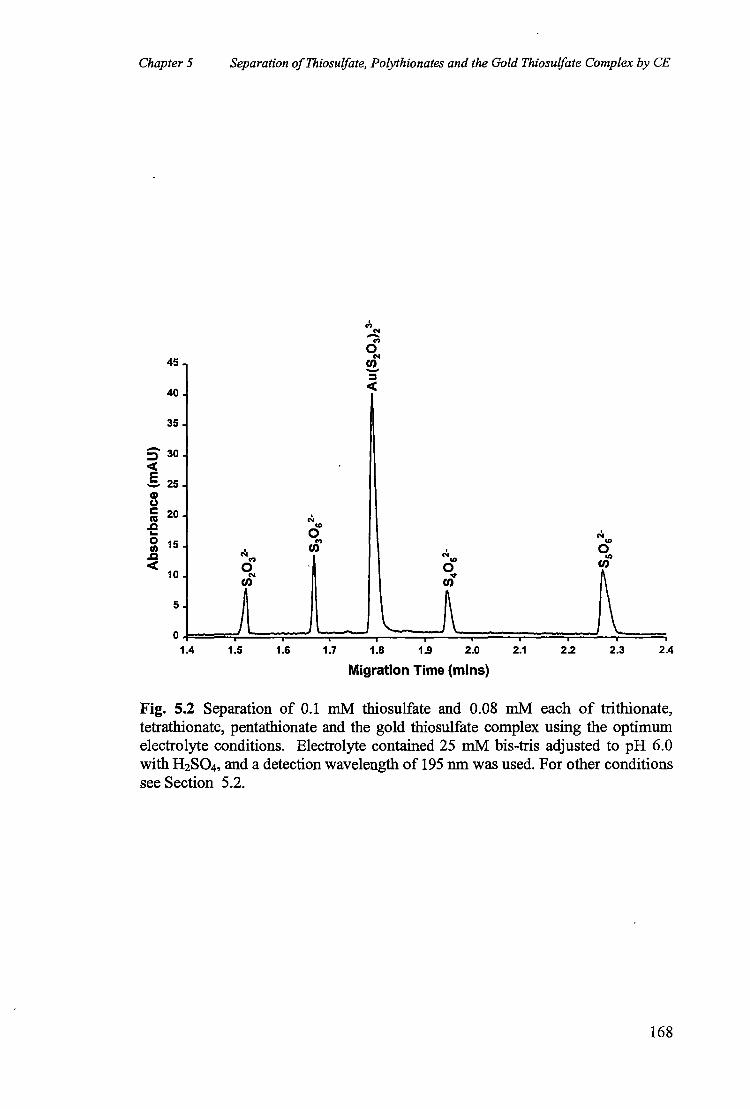


![Effect of the Nature and Relative Concentration of ... · Iodine titration was measured by sodium thiosulfate titration [23]. 2.6. Ion Chromatography The determination of soluble](https://static.documents.pub/doc/80x56/60866232489b38366b7b826b/effect-of-the-nature-and-relative-concentration-of-iodine-titration-was-measured.jpg)


![A new method of determining residual thiosulfate in ... · the silver sulfide as a measure of residual thiosulfate con centration in film [2, 3]. It has been found that chromatographic](https://static.documents.pub/doc/80x56/5e98b8b45ba8be39d83edcb3/a-new-method-of-determining-residual-thiosulfate-in-the-silver-sulfide-as-a.jpg)