63
July 2015 Caribbean Market Overview 2015 Q2
| Date post: | 18-Aug-2015 |
| Category: |
Business |
| Upload: | grenada101 |
| View: | 46 times |
| Download: | 2 times |
July 2015
Caribbean Market Overview
2015 Q2

Caribbean Market Overview – 2015 Q2
CIBC Macro Strategy – Capital Markets Trading July 2015
GENERAL LEGAL DISCLAIMER This communication has been prepared by CIBC FirstCaribbean International Bank (“FCIB”) and the Macro Strategy Desk within the Fixed Income, Currencies and Commodities Group at CIBC World Markets Inc. (“CIBC”) where indicated.
CIBC LEGAL DISCLAIMER CIBC is a wholly-owned subsidiary of Canadian Imperial Bank of Commerce and is a member of the Canadian Investor Protection Fund and the Investment Industry Regulatory Organization of Canada (“IIROC”).
This communication, including any attachment(s), is confidential and is provided for general informational purposes only to institutional and professional investors and does not constitute an offer or solicitation to buy or sell any specific investments discussed herein. The contents of this communication are based on macro and issuer-specific analysis, issuer news, market events and general institutional desk discussion. The information, opinions and statistical data contained herein has been obtained from sources (internal and/or external) that CIBC believes to be reliable (without having conducted any independent investigation). CIBC assumes no obligation to update any information, opinions, statistical data or forward-looking statements contained herein for any reason, including if CIBC subsequently learns that such information is inaccurate, incomplete or otherwise in error or to notify any person in respect of thereof. CIBC does not represent or warrant the completeness, accuracy or currency of this communication or any information, opinions and statistical data contained herein, including the future performance of any security, investment or strategy mentioned in this communication, nor is it intended to be a complete statement or summary of the securities, markets or developments discussed herein and the information contained herein should not be relied upon as such. Any opinions, recommendations, estimates and projections contained herein are subject to change without notice, and are provided by CIBC in good faith but with no legal responsibility or liability whatsoever. Past performance is not a guarantee of future results, and no representation or warranty, express or implied, is made regarding the future performance of any security or investment mentioned in this communication. The price of the securities and other investments mentioned in this communication and the income they produce may fluctuate and/or be adversely affected by exchange rates, and investors may realize losses on investments in such securities, including the loss of investment principal Any information provided herein is not intended to represent an adequate basis for investors to make an informed investment decision. CIBC and its respective affiliates disclaim any responsibility for any liability to you or any other person for any general, direct, indirect, incidental, special or consequential losses or damages (including, but not limited to, loss of profits or revenue or failure to realize expected profits or savings or the avoidance of any losses) arising out of or related to this communication or its use by the recipient.
The author(s) of this communication is not an “analyst”, nor is this communication a “research report” as such terms are defined by IIROC or The Financial Industry Regulatory Authority (FINRA). This communication is not the product of a “research department” of CIBC as such term is defined by FINRA or the UK Financial Services Authority Conduct of Business rules (the “UK Rules”). Nor should the communication be construed as containing any “research recommendations” or “investment research” as such terms are defined in the UK Rules. The author(s) of this communication is not a person or company with actual, implied or apparent authority to act on behalf of any issuer mentioned in the communication. The commentary and any attachments and opinions expressed herein are solely those of the individual author(s), except where the author expressly states them to be the opinions of CIBC. The author(s) may provide short-term trading views or ideas on issuers, securities, commodities, currencies or other financial instruments but investors should not expect continuing analysis, views or discussion relating to the securities, securities, commodities, currencies or other financial instruments discussed herein.
CIBC its affiliates may engage in trading strategies or hold positions in the issuers, securities, commodities, currencies or other financial instruments discussed in this communication and may abandon such trading strategies or unwind such positions at any time without notice.
This communication is intended for the specific recipient only. Any dissemination, re-distribution or other use of this message or the market commentary contained herein by any recipient is unauthorized. If you are not the intended recipient, please reply to this e-mail and delete this communication and any copies without forwarding them.
Distribution in Hong Kong: This communication has been approved and is issued in Hong Kong by Canadian Imperial Bank of Commerce, Hong Kong Branch, a registered institution under the Securities and Futures Ordinance (the “SFO”) to “professional investors” as defined in clauses (a) to (h) of the definition thereof set out in Schedule 1 of the SFO. Any recipient in Hong Kong who has any questions or requires further information on any matter arising from or relating to this communication should contact Canadian Imperial Bank of Commerce, Hong Kong Branch at Suite 3602, Cheung Kong Centre, 2 Queen’s Road Central, Hong Kong (telephone number: +852 2841 6111).
Distribution in Singapore: This communication is intended solely for distribution to accredited investors, expert investors and institutional investors (each, an “eligible recipients”). Eligible recipients should contact Canadian Imperial Bank of Commerce, Singapore Branch at 16 Collyer Quay #04-02 Singapore 049318 (telephone number +65 6535 2323) in respect of any matter arising from or in connection with this report.
Distribution in Japan: This communication is distributed in Japan by CIBC World Markets (Japan) Inc., a registered Type1 Financial Product Provider with the registration number Director General of Kanto Finance Bureau #218.
Distribution in Australia: Communications concerning derivatives and foreign exchange contracts are distributed in Australia to “professional investors” within the meaning of the Corporations Act 2001 by CIBC World Markets Inc. Communications concerning securities are distributed in Australia by CIBC Australia Ltd (License no. 240603; ACN 000 067 256) to wholesale clients only.
Distribution in the European Union: This communication has been authorised for distribution in the European Union by CIBC World Markets plc. This communication is directed only at (i) "investment professionals" as defined in Article 19 of the Financial Services and Markets Act 2000 (Financial Promotion) Order 2005; or (ii) high net worth bodies corporate, unincorporated associations and partnerships and trustees of high value trusts as described in Article 49. Any investment or investment activity to which this communication relates is only available to and will only be engaged in with such persons and persons who receive this communication who do not fall within (i) or (ii) above should not rely on or act upon this communication.
© CIBC World Markets Inc. All rights reserved. Unauthorized use, distribution, duplication or disclosure without the prior written permission of CIBC World Markets Inc. is prohibited and may result in prosecution.
Caribbean Market Overview – 2015 Q2
CIBC Macro Strategy – Capital Markets Trading July 2015
FCIB LEGAL DISCLAIMER Canadian Imperial Bank of Commerce has a controlling interest in FCIB.
This communication, including any attachment(s), is confidential and is provided for general informational purposes only to institutional and professional investors and does not constitute an offer or solicitation to buy or sell any specific investments discussed herein. The contents of this communication are based on macro and issuer-specific analysis, issuer news, market events and general institutional desk discussion. The information, opinions and statistical data contained herein has been obtained from sources (internal and/or external) that FCIB believes to be reliable (without having conducted any independent investigation). FCIB assumes no obligation to update any information, opinions, statistical data or forward-looking statements contained herein for any reason, including if FCIB subsequently learns that such information is inaccurate, incomplete or otherwise in error or to notify any person in respect of thereof. FCIB does not represent or warrant the completeness, accuracy or currency of this communication or any information, opinions and statistical data contained herein, including the future performance of any security, investment or strategy mentioned in this communication, nor is it intended to be a complete statement or summary of the securities, markets or developments discussed herein and the information contained herein should not be relied upon as such. Any opinions, recommendations, estimates and projections contained herein are subject to change without notice, and are provided by FCIB in good faith but with no legal responsibility or liability whatsoever. Past performance is not a guarantee of future results, and no representation or warranty, express or implied, is made regarding the future performance of any security or investment mentioned in this communication. The price of the securities and other investments mentioned in this communication and the income they produce may fluctuate and/or be adversely affected by exchange rates, and investors may realize losses on investments in such securities, including the loss of investment principal Any information provided herein is not intended to represent an adequate basis for investors to make an informed investment decision. CIBC and its respective affiliates disclaim any responsibility for any liability to you or any other person for any general, direct, indirect, incidental, special or consequential losses or damages (including, but not limited to, loss of profits or revenue or failure to realize expected profits or savings or the avoidance of any losses) arising out of or related to this communication or its use by the recipient.
Each author of this communication is not an “analyst”, nor is this communication a “research report” as such terms are defined by IIROC or The Financial Industry Regulatory Authority (FINRA). This communication is not the product of a “research department” of FCIB as such term is defined by FINRA or the UK Financial Services Authority Conduct of Business rules (the “UK Rules”). Nor should the communication be construed as containing any “research recommendations” or “investment research” as such terms are defined in the UK Rules. The author(s) of this communication is not a person or company with actual, implied or apparent authority to act on behalf of any issuer mentioned in the communication. The commentary and any attachments and opinions expressed herein are solely those of the individual author(s), except where the author expressly states them to be the opinions of FCIB. The author(s) may provide short-term trading views or ideas on issuers, securities, commodities, currencies or other financial instruments but investors should not expect continuing analysis, views or discussion relating to the securities, securities, commodities, currencies or other financial instruments discussed herein.
FCIB its affiliates may engage in trading strategies or hold positions in the issuers, securities, commodities, currencies or other financial instruments discussed in this communication and may abandon such trading strategies or unwind such positions at any time without notice.
This communication is intended for the specific recipient only. Any dissemination, re-distribution or other use of this message or the market commentary contained herein by any recipient is unauthorized. If you are not the intended recipient, please reply to this e-mail and delete this communication and any copies without forwarding them.

Caribbean Market Overview – 2015 Q2
CIBC Macro Strategy – Capital Markets Trading July 2015
Table of Contents
Caribbean Market Review ......................................................................................................... 2
Caribbean Economic Review .................................................................................................... 9
Anguilla .................................................................................................................................... 11
Antigua and Barbuda ............................................................................................................... 13
Aruba ....................................................................................................................................... 15
The Bahamas .......................................................................................................................... 17
Barbados ................................................................................................................................. 19
Belize ....................................................................................................................................... 21
Bermuda .................................................................................................................................. 23
Cayman Islands ....................................................................................................................... 26
Costa Rica ............................................................................................................................... 29
Curaçao ................................................................................................................................... 31
Dominica ................................................................................................................................. 33
Dominican Republic ................................................................................................................ 35
Grenada .................................................................................................................................. 38
Jamaica ................................................................................................................................... 40
St. Kitts and Nevis ................................................................................................................... 43
St. Lucia .................................................................................................................................. 45
Sint Maarten ............................................................................................................................ 47
St. Vincent and the Grenadines .............................................................................................. 49
Trinidad and Tobago ............................................................................................................... 51
Turks and Caicos .................................................................................................................... 54
About CIBC ............................................................................................................................. 56
About CIBC FirstCaribbean ..................................................................................................... 57
Notes ....................................................................................................................................... 58
Caribbean Market Overview – 2015 Q2 1
CIBC Macro Strategy – Capital Markets Trading July 2015
Caribbean Market Review

Caribbean Market Overview – 2015 Q2 2
CIBC Macro Strategy – Capital Markets Trading July 2015
Caribbean Market Review John H. Welch CIBC Macro Strategy
Summary Better economic performance and outlook for the Caribbean region has helped the performance of sovereign bonds with all credits tightening in Q2 2015. Significantly lower energy prices combined with continued US and UK recovery and better prospects for European growth have driven a strong recovery in tourism, with Bermuda the only laggard. The better performance is already showing up in a recovery in foreign exchange reserves. As we had thought, Caribbean bonds recovered strongly after the large sell-off of late 2014 and they continue to perform with the exception of Costa Rica. We remain constructive on Caribbean bonds. We see continued fiscal adjustment and the recent improvement should persist. Barbados is finally seeing strong recovery in tourism and showed significant improvement in its fiscal accounts. Nevertheless, Barbados is not yet out of the woods but is significantly closer than as recently as one year ago. The Bahamas continues to put in decent growth numbers but faces a challenge with the Chapter 11 bankruptcy of the Baha Mar resort project. Jamaica and the Dominican Republic continue to consolidate strong fiscal gains. We still like Barbados despite its difficulties, especially the Barbados ‘22s. The Barbadian government’s fiscal initiatives have led to strong buying and outperformance, even compared to the Dominican Republic. Jamaica continues to perform, keeping on track with its IMF program. Our positive expectations have proven correct but we do not see major obstacles to continued good performance despite the US Federal Reserve inching closer to tightening. Hence, we would recommend buying ARUBA 4 5/8 09/14/23s, BAHAMA 6.95 11/20/29s, BARBAD 7 08/04/22s, BERMUD 4.854 02/06/24s, CAYMAN 5.95 11/24/19, DOMREP 6.6 01/28/24, and JAMAN 7 5/8 10/17/25. Costa Rica’s fundamentals continue to deteriorate and we keep our sell recommendation on COSTAR.
• Barbados: On June 15, 2015, the government presented the 2015/16 budget, gave a progress report on the Fiscal Stabilization and Economic Revitalization programs, and sent the much-awaited budgetary proposal to parliament. Finance Minister Christopher Sinckler listed as achievements: 1) the rise of foreign exchange reserves at 16.1 weeks as of the end of March 2015 of imports of goods and services, up from 14.7 weeks at the end of 2014; 2) fiscal deficit down to 6.6% of GDP from 11.8% of GDP in March 2014; 3) established foundation for growth through key initiatives in the tourism, energy, agriculture, international business & financial services, telecommunications, and housing sectors; 4) BBD30 million in projected expenditure savings; and 5) BBD204.7 million in additional revenue measures. The proposed measures are expected to result in a fiscal deficit of 3.5% to 4% of GDP on an accrual basis. The budget proposal does not address a substantial and meaningful reduction in expenditures but focuses on revenue growth measures. The presentation did not go into detail about the expenditure targets coming from the proposed reforms for governance, and the merger of State Owned Enterprises (SOE). The finance minister underscored Barbados’ good record of repaying its debt and that they will continue to honour debt obligations. Moreover, he rejected the notion of debt restructuring, choosing to focus on accessing lower cost alternatives. Although this is certainly an improvement, we are disappointed that the budget proposal focuses mostly on the revenue side without mentioning a more substantial effort to reduce expenditures. Moreover, while there were a couple of measures aimed at reducing the cost of doing business such as cutting business license fees for some firms and subsidizing local milk production, our general thought is that not enough was done to facilitate additional economic growth. Still, Barbados bonds have performed well, with Barbados ‘21s tightening 120 bps since late April (Figure 3 below). Barbados ‘21s and ‘22s continue to outperform since our last publication. We continue to like holding Barbados bonds, especially the ‘22s.
• Bahamas: On July 2, 2015, S&P put Bahamas’s long-term BBB rating on negative watch due to the June 29, 2015 Chapter 11 bankruptcy filing of the Baha Mar resort development. They noted that it was unclear if, and when, the Baha Mar would reopen and sustain its more than 2000 employees. They give the odds at a 50/50 chance of a downgrade to BBB- in the next 90 days following their review this quarter. Although the delayed opening of Baha Mar will inhibit growth in the short term, economic recovery away from the project continues. The ongoing strong recovery in the USA bodes well for economic activity. Tourism has already picked up and should continue to grow although at a slower pace than with the resort in place. Moreover, the government has enjoyed a recovery in tax revenue while keeping growth in expenditure low. This was done through cutting expenditure on goods and services as well capital expenditure while containing transfer payment growth. These developments are welcome in our view and underlie the more bullish arguments we made in our report entitled “Bahamas:

Caribbean Market Overview – 2015 Q2 3
CIBC Macro Strategy – Capital Markets Trading July 2015
Worth Another Look” published on August 11, 2014. With the BAHAMA 5 3/4 01/16/24 trading at a 4.49% of yield compared to BBB- Brazil 4 7/8 02/04/25 trading at a yield of 4.53%, we think Bahamas will still perform even with a downgrade.
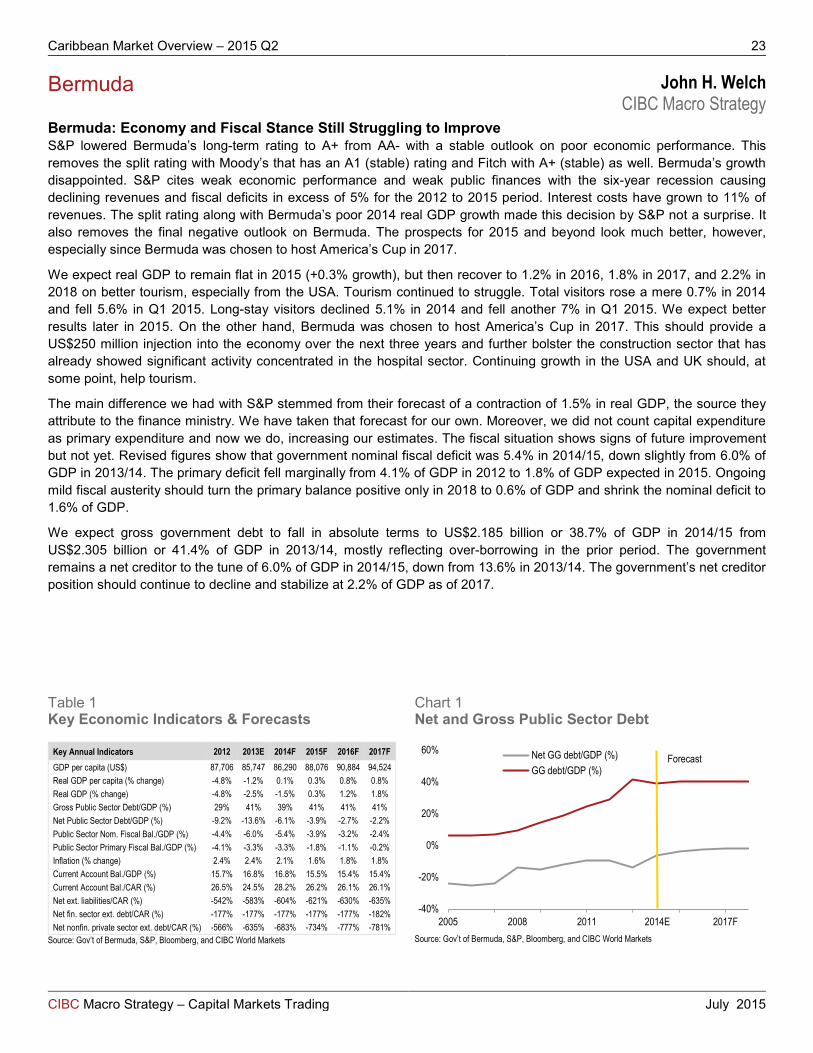
• Bermuda: S&P lowered Bermuda’s long-term rating to A+ from AA- with a stable outlook on poor economic performance. This removes the split rating with Moody’s that has an A1 (stable) rating and Fitch with A+ (stable) as well. Bermuda’s growth disappointed. S&P cites weak economic performance and weak public finances with the six-year recession causing declining revenues and fiscal deficits in excess of 5% for the 2012 to 2015 period. Interest costs have grown to 11% of revenues. The split rating along with Bermuda’s poor 2014 real GDP growth made this decision by S&P not a surprise. It also removes the final negative outlook on Bermuda. The prospects for 2015 and beyond look much better, however, especially since Bermuda was chosen to host America’s Cup in 2017. S&P included sinking fund payments and capital expenditure in primary spending. We now do the same, increasing our estimates of fiscal deficits. The fiscal situation shows signs of future improvement but not yet. Revised figures show that government nominal fiscal deficit was 5.4% in 2014/15, down slightly from 6.0% of GDP in 2013/14. The primary deficit fell marginally from 4.1% of GDP in 2012 to 1.8% of GDP expected in 2015. Ongoing mild fiscal austerity should turn the primary balance positive only in 2018 to 0.6% of GDP and shrink the nominal deficit to 1.6% of GDP. Bermuda still trades wide to similarly rated credits despite the downgrade, and because it cleared the air, we recommend BERMUD ‘20s and ‘24s which now trade historically cheap relative to other Caribbean credits.
• Costa Rica: Economic growth slowed in Q1 2015, expanding 2.68% y/y and down from the 3% posted in Q4 2014. The Costa Rican economy has steadily decelerated since the start of Q1 2014 when growth reached 4.0%. Looking at more recent indicators, economic prospects do not look encouraging. April economic activity growth came in at 1.3% y/y, down from 1.48% in March and the lowest since July 2010. Most industries have shown lower dynamics with manufacturing (down 3.3% in April), hit most by Intel’s manufacturing departure from the country. Costa Rican fiscal accounts continued to deteriorate as central government spending increased 4.5% y/y in May while revenues decreased 1.4%. With these numbers, the 2015 central government accumulated nominal deficit widened 0.4 p.p. to 2.3% of GDP, while the primary deficit increased by the same amount to 1.4% of GDP. Following the IMF’s article IV mission recommendations, the government announced a plan to convert the sales tax into a value-added tax (VAT) along with a reform to expand the VAT base to include services. Moreover, it proposed a bill that modifies the country’s income tax code. Nevertheless, the government now faces a significant roadblock as an opposition-led congress demands further expense cuts before approving such bills. In the most optimistic scenario, congress would discuss these measures in Q4 2015 and introduce them in early 2016. Having said that, the government is expected to face further financing challenges in 2016 and delay its plans towards fiscal sustainability. Hence, although the COSTAR curve has experienced a considerable steepening since our last report, we remain short this credit.
• Dominican Republic: Economic growth slowed slightly to 6.2% y/y in Q1 2015 from 6.6% in Q4 2014. As with the rest of the region, the decline in energy prices as well as the increase in tourism bode well for 2015 for both economic activity and fiscal results. We expect 5.5% growth in 2015 and 4.9% in 2016. President Danilo Medina (PLD Partido de la Liberación Dominicana) capitalized on his high approval ratings of above 80% to pass a constitution amendment to allow for re-election with not only the last minute approval of former-president Leonel Fernandez (PLD) but also the once opposition PRD (Partido Revolucionario Dominicano) party. Defections from the PRD and resentment of the move have strengthened the newly formed PRM (Partido Revolucionario Moderno) party under Luis Abinader. The most important news on the fiscal front was the buyback of PetroCaribe debt by the government. This caused government debt to fall almost 2% of GDP but the cash outlay expanded the government deficit as well by about 0.3% of GDP in Q1 2015 and has put off the expected improvement of the primary balance to a significant surplus. However, the overall fiscal situation was improved by the operation. Fiscal accounts should improve in 2015 with lower energy costs that should have important effects but that have still not shown up explicitly in the numbers. Arrears to the electricity sector reached DOP758 million that do not yet appear in the fiscal accounts. Subsidies allocated through the FETE (Fund for the Stabilization of Electricity Tariffs) that usually comprise of about 40% of the total subsidies signal a subsidy of a mere 1%. With no large improvement of the primary balance, there is speculation that the government is spending the money on
Caribbean Market Overview – 2015 Q2 4
CIBC Macro Strategy – Capital Markets Trading July 2015
investment. Still, we expect the primary balance to end 2015 at a now lower 0.1% of GDP surplus and a nominal deficit of 2.74%. Because the outlays from the PetroCaribe deal are one-off, we expect improvement in 2016 to a primary surplus of 1.1% of GDP and nominal deficit of 1.74%. Although we remain constructive on Dominican Republic bonds, they have become expensive relative to their peers. Still, we recommend holding the whole DOMREP curve, especially the DOMREP 6.6 01/28/24.
• Jamaica: On June 16, 2015, Jamaica passed its eighth review to again draw around US$39.3 million on its US$932 million IMF Extended Fund Facility (EFF). The Article IV report once again contained an adjustment to performance criteria for the primary surplus on lower-than-expected growth. The report is still quite strong. Real growth however is slowing. Preliminary estimates from the Planning Institute of Jamaica suggest that economic activity rebounded marginally by 0.3% in Q1 (calendar) 2015 after falling 0.3% y/y in Q4 2015. Real GDP grew 0.53% in 2014, this after peaking on a 4-quarter basis at 1.52 in Q2 2014 but fell to 0.17% in Q1 2015. Service sector output expanded 0.6% due to growth across all sectors except electricity and water supply (down 2.8%) and government services (down 0.2%). Specifically, real value-added in transport and storage and communication benefitted from higher cruise and stay-over tourist arrivals. Further, the Bank of Jamaica (BoJ) estimates that output in tourism increased between 3.5% and 4.5% during the first quarter of the year. Data from the Jamaica Tourist Board suggest that during the first four months of 2015, stay-over and cruise arrivals increased 4.9% and 11.2%. Stay-over arrivals from the USA, UK, and Latin America increased 9.1%, 9.1%, and 2.6%, but the number of passengers travelling from Canada and the Caribbean declined by 5.3% and 0.2%. All this is encouraging. We expect growth to end 2015 at 1.6%, a little lower than the IMF’s 1.9% forecast. The 2014 primary surplus came in JMD3.8 billion below target at JMD117.2 billion or 7.5% of GDP. This is a rounding error. The nominal deficit shrunk to 0.5% of GDP in 2014/15 better than the target of 0.7% and much better than 4.1% of 2012/13. The government continues to successfully implement tax reform and growth-enhancing reforms including a new Electricity Reform Bill submitted to parliament in January 2015. Moreover, we expect the government to follow the Dominican Republic and refinance its PetroCaribe debt at a discount, something that became clear in a recent nondeal roadshow by the government of Jamaica. Consequently, we remain long Jamaican bonds, especially the ‘25s.
Caribbean Market Overview – 2015 Q2 5
CIBC Macro Strategy – Capital Markets Trading July 2015
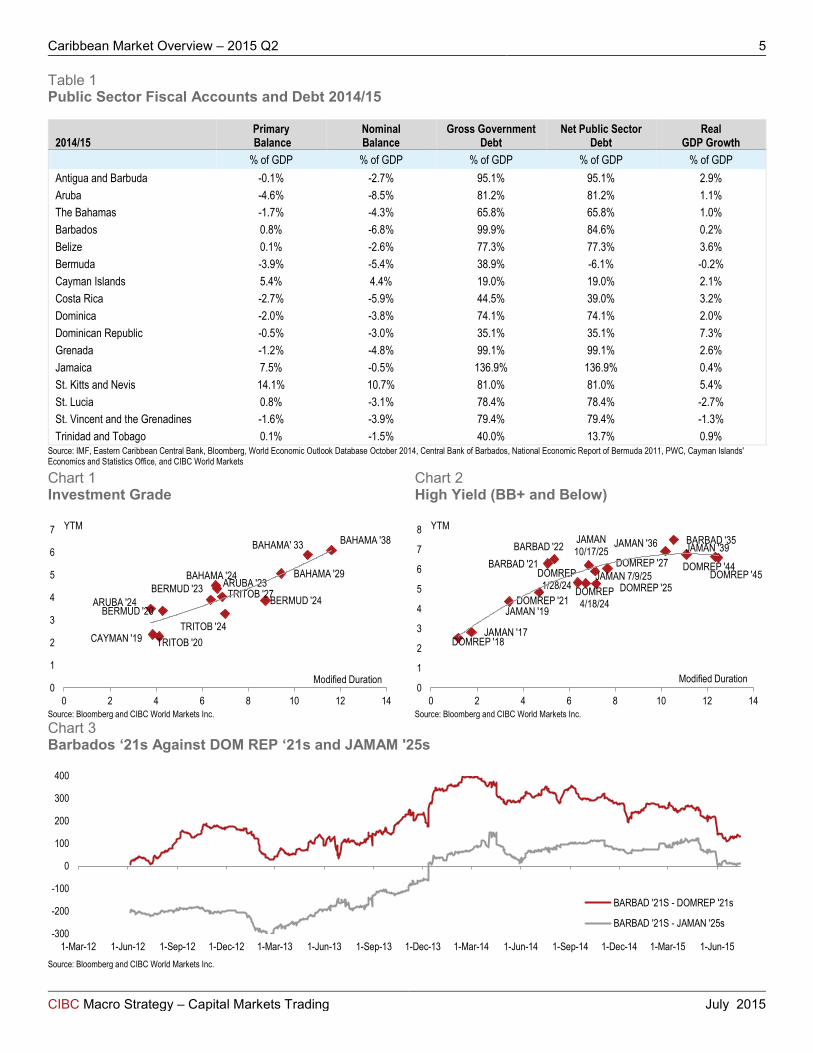
Table 1 Public Sector Fiscal Accounts and Debt 2014/15
2014/15 Primary Balance
Nominal Balance
Gross Government Debt
Net Public Sector Debt
Real GDP Growth
% of GDP % of GDP % of GDP % of GDP % of GDP Antigua and Barbuda -0.1% -2.7% 95.1% 95.1% 2.9% Aruba -4.6% -8.5% 81.2% 81.2% 1.1% The Bahamas -1.7% -4.3% 65.8% 65.8% 1.0% Barbados 0.8% -6.8% 99.9% 84.6% 0.2% Belize 0.1% -2.6% 77.3% 77.3% 3.6% Bermuda -3.9% -5.4% 38.9% -6.1% -0.2% Cayman Islands 5.4% 4.4% 19.0% 19.0% 2.1% Costa Rica -2.7% -5.9% 44.5% 39.0% 3.2% Dominica -2.0% -3.8% 74.1% 74.1% 2.0% Dominican Republic -0.5% -3.0% 35.1% 35.1% 7.3% Grenada -1.2% -4.8% 99.1% 99.1% 2.6% Jamaica 7.5% -0.5% 136.9% 136.9% 0.4% St. Kitts and Nevis 14.1% 10.7% 81.0% 81.0% 5.4% St. Lucia 0.8% -3.1% 78.4% 78.4% -2.7% St. Vincent and the Grenadines -1.6% -3.9% 79.4% 79.4% -1.3% Trinidad and Tobago 0.1% -1.5% 40.0% 13.7% 0.9%
Source: IMF, Eastern Caribbean Central Bank, Bloomberg, World Economic Outlook Database October 2014, Central Bank of Barbados, National Economic Report of Bermuda 2011, PWC, Cayman Islands' Economics and Statistics Office, and CIBC World Markets
Chart 1 Investment Grade
Chart 2 High Yield (BB+ and Below)
Source: Bloomberg and CIBC World Markets Inc. Source: Bloomberg and CIBC World Markets Inc. Chart 3 Barbados ‘21s Against DOM REP ‘21s and JAMAM '25s
Source: Bloomberg and CIBC World Markets Inc.
ARUBA '23 BAHAMA '29
BAHAMA '38
BAHAMA '24
BERMUD '20
BERMUD '23
CAYMAN '19 TRITOB '20
TRITOB '27
TRITOB '24
BAHAMA' 33
BERMUD '24 ARUBA '24
0
1
2
3
4
5
6
7
0 2 4 6 8 10 12 14
YTM
Modified Duration
BARBAD '21 BARBAD '22 BARBAD '35
DOMREP '18
DOMREP '21 DOMREP 4/18/24
DOMREP 1/28/24
DOMREP '27 DOMREP '44
JAMAN '17
JAMAN '19
JAMAN 7/9/25
JAMAN 10/17/25
JAMAN '36 JAMAN '39
DOMREP '45 DOMREP '25
0
1
2
3
4
5
6
7
8
0 2 4 6 8 10 12 14
YTM
Modified Duration
-300
-200
-100
0
100
200
300
400
1-Mar-12 1-Jun-12 1-Sep-12 1-Dec-12 1-Mar-13 1-Jun-13 1-Sep-13 1-Dec-13 1-Mar-14 1-Jun-14 1-Sep-14 1-Dec-14 1-Mar-15 1-Jun-15
BARBAD '21S - DOMREP '21s
BARBAD '21S - JAMAN '25s

Caribbean Market Overview – 2015 Q2 6
CIBC Macro Strategy – Capital Markets Trading July 2015
Chart 4 10Y Against Benchmark
Source: Bloomberg and CIBC World Markets Inc. 10Y bonds are: COSTAR 4 3/8 04/30/25 BARBAD 7 08/04/22 DOMREP 5 7/8 04/18/24 JAMAN 9 1/4 10/17/25 ARUBA 4 5/8 09/14/23 BAHAMA 5 3/4 01/16/24 BERMUD 4.854 02/06/24 TRITOB 4 3/8 01/16/24 Table 2 Ratings of Caribbean Sovereigns
2015 Ratings
Ratings Key
Investment Grade High Yield
S&P Moody’s S&P Moody’s S&P Moody’s Aruba BBB+ NA AAA Aaa BB+ Ba1 Antigua and Barbuda NA NA AA+ Aa1 BB Ba2 The Bahamas BBB *- Baa2 AA Aa2 BB- Ba3 Barbados B B3 AA- Aa3 B B2 Belize B- Caa2 A+ A1 B- B3 Bermuda A+ A1 A A2 CCC+ Caa1 Costa Rica BB Ba1 A- A3 CCC Caa2 Dominica NA NA BBB+ Baa1 CCC- Caa3 Dominican Republic BB- B1 BBB Baa2 CC Ca Grenada NA NA BBB- Baa3 C C Jamaica B Caa2 D St. Kitts and Nevis NA NA St. Lucia NA NA St. Vincent and the Grenadines NA B3 Trinidad and Tobago A Baa2
Source for Tables 2 & 3: Bloomberg and CIBC World Markets Inc.
0
1
2
3
4
5
6
7
Sep-14 Nov-14 Jan-15 Mar-15 May-15 Jul-15
bps COSTAR BARBAD DOMREP JAMANARUBA BAHAMA BERMUD TRITOB

Caribbean Market Overview – 2015 Q2 7
CIBC Macro Strategy – Capital Markets Trading July 2015
Table 3 Caribbean Bonds and Indicative Prices/Spreads (July 14, 2015)
Aruba Bond Price Yield Z-Spread S&P Moody’s Fitch ARUBA 6 1/2 11/14/19 111.62 3.57% 187.82 BBB+ NR BBB- ARUBA 4 5/8 09/14/23 101.50 4.40% 216.63 BBB+ NR BBB-
Bahamas Bond Price Yield Z-Spread S&P Moody’s Fitch BAHAMA 5 3/4 01/16/24 108.50 4.53% 219.52 BBB *- Baa2 NR BAHAMA 6.95 11/20/29 119.00 5.07% 236.41 BBB *- Baa2 NR BAHAMA 6 5/8 05/15/33 108.08 5.89% 312.93 BBB *- Baa2 NR BAHAMA 7 1/8 04/02/38 112.50 6.10% 321.45 BBB *- Baa2 NR
Barbados Bond Price Yield Z-Spread S&P Moody’s Fitch BARBAD 7 1/4 12/15/21 105.00 6.29% 412.93 B B3 NR BARBAD 7 08/04/22 102.75 6.51% 430.35 B B3 NR BARBAD 6 5/8 12/05/35 91.00 7.49% 466.90 B B3 NR
Bermuda Bond Price Yield Z-Spread S&P Moody’s Fitch BERMUD 5.603 07/20/20 110.10 3.39% 159.84 A+ A1 WD BERMUD 4.138 01/03/23 101.45 3.91% 169.51 A+ A1 WD BERMUD 4.854 02/06/24 105.53 4.08% 174.40 A+ A1 WD
Cayman Islands Bond Price Yield Z-Spread S&P Moody’s Fitch CAYMAN 5.95 11/24/19 114.75 2.36% 60.62 NR Aa3 NR
Costa Rica Bond Price Yield Z-Spread S&P Moody’s Fitch COSTAR 9.995 08/01/20 126.50 4.12% 231.07 BB Ba1 NR COSTAR 4 1/4 01/26/23 93.04 5.39% 312.32 BB Ba1 BB+ COSTAR 4 3/8 04/30/25 90.79 5.61% 313.01 BB Ba1 BB+ COSTAR 5 5/8 04/30/43 82.69 7.05% 424.09 BB Ba1 BB+ COSTAR 7 04/04/44 96.30 7.31% 448.18 BB Ba1 BB+ COSTAR 7.158 03/12/45 97.11 7.40% 457.35 BB Ba1 BB+
Dominican Republic Bond Price Yield Z-Spread S&P Moody’s Fitch DOMREP 7 1/2 05/06/21 113.25 4.85% 259.78 BB- B1 B+ DOMREP 5 7/8 04/18/24 103.98 5.30% 300.31 BB- B1 B+ DOMREP 6.6 01/28/24 108.58 5.33% 300.89 BB- B1 B+ DOMREP 5 1/2 01/27/25 101.75 5.26% 282.93 BB- B1 B+ DOMREP 8 5/8 04/20/27 121.50 6.04% 343.56 BB- B1 B+ DOMREP 7.45 04/30/44 110.50 6.63% 377.20 BB- B1 B+ DOMREP 6.85 01/27/45 103.50 6.58% 372.80 BB- B1 B+
Jamaica Bond Price Yield Z-Spread S&P Moody’s Fitch JAMAN 10 5/8 06/20/17 114.50 2.83% 185.48 B Caa2 B- JAMAN 8 06/24/19 113.00 4.37% 188.38 B Caa2 B- JAMAN 7 5/8 07/09/25 112.80 5.91% 346.13 B Caa2 B- JAMAN 9 1/4 10/17/25 122.77 6.21% 369.62 B Caa2 B- JAMAN 8 1/2 02/28/36 117.20 6.92% 413.15 B Caa2 B- JAMAN 8 03/15/39 114.75 6.74% 390.07 B Caa2 B-
Trinidad and Tobago Bond Price Yield Z-Spread S&P Moody’s Fitch TRITOB 9 3/4 07/01/20 134.88 2.27% 41.45 A Baa2 NR TRITOB 5 7/8 05/17/27 118.85 3.87% 124.39 A Baa2 NR TRITOB 4 3/8 01/16/24 108.00 3.29% 92.40 A Baa2 NR
Caribbean Market Overview – 2015 Q2 8
CIBC Macro Strategy – Capital Markets Trading July 2015
Caribbean Economic Review

Caribbean Market Overview – 2015 Q2 9
CIBC Macro Strategy – Capital Markets Trading July 2015
Caribbean Economic Review Shane Lowe CIBC FirstCaribbean International Bank
Overall economic performance remained mixed across the region. US and Canadian economic slowdowns, stubbornly high Caribbean unemployment, and ongoing fiscal consolidation slowed the economic recovery in the Caribbean over the first few months of 2015. Latest estimates suggest that having increased 2.2% y/y during Q4 2014, real US GDP contracted 0.2% during Q1 2015 as unusually bad weather and a stronger dollar took their toll on the economy. Annualised growth in personal consumption expenditures slowed to 2.1% from 4.4% one quarter earlier, while nonresidential fixed investment and exports of goods and services declined 2.0% and 5.9%. Meanwhile, the Canadian economy suffered a 0.6% decline in output during the same period as mining, quarrying, oil and gas, construction, wholesale trade, and manufacturing all registered lower output relative to the same period 12 months earlier. Nonetheless, during Q1 2015, the UK economy continued to expand, albeit at a slower pace than one quarter earlier.
The slowdown in North America limited the rate of growth in tourist arrivals during Q1 2015. Stay-over tourist arrivals grew at a decelerated pace in more than half of the markets covered, with declines registered in Antigua and Barbuda, Belize, Dominica, and St. Vincent and the Grenadines – all markets which experienced declines in the number of American visitors. Aruba continued to register strong arrivals growth, benefitting from its close proximity to the South American market, while Curaçao and Barbados have rebounded from modest performances in 2014 to register double-digit growth in 2015 year-to-date.
Fiscal restraint, additional taxation, and stubbornly high unemployment continue to restrict robust growth in domestic demand for goods and services. Despite higher public capital expenditure across most markets thus far in 2015, consumer demand remains weak as economic growth has been unable to sufficiently increase employment opportunities, and additional taxes have reduced disposable income. Further, while IMF or home-grown fiscal consolidation programs have limited increases in current expenditure, falling nontax revenues and grant receipts have perpetuated high fiscal deficits and still-rising debt burdens. Finally, construction performance remains mixed as slowing mortgage growth and weaker residential construction offset some of the positive effects of tourism-related construction and the government’s capital expenditure programs.
Weak domestic demand has limited growth in commercial bank lending and boosted excess liquidity. With the exception of Dominica, Grenada, Jamaica, St Vincent and the Grenadines, and Trinidad and Tobago, all markets have registered declines in total loans and advances year-to-date, and approximately half have grown at a slower rate than one year earlier. In fact, excluding stronger public sector loan growth, all markets in the Eastern Caribbean Currency Union (ECCU) would have registered negative or no growth over the period.
Chart 1 Trends in Regional1 Tourist Arrivals
Chart 2 Regional2 Loan Growth (y/y)
Source: Caribbean Tourism Organization, Eastern Caribbean Central Bank and CIBC FirstCaribbean Source: Regional authorities and CIBC FirstCaribbean
1 Caribbean region includes: Anguilla, Antigua and Barbuda, the Bahamas, Barbados, Belize, British Virgin Islands, Cayman Islands, Curaçao, Dominica, Grenada, Jamaica, St. Kitts and Nevis, St. Lucia, St. Maarten and St. Vincent and the Grenadines. 2 Caribbean region includes Anguilla, Antigua and Barbuda, the Bahamas, Barbados, Belize, Curaçao, Dominica, Grenada, Jamaica, St. Kitts and Nevis, St. Lucia, St. Maarten, St. Vincent and the Grenadines, and Trinidad and Tobago.
-1%
0%
1%
2%
3%
4%
5%
Dec-10 Jun-11 Dec-11 Jun-12 Dec-12 Jun-13 Dec-13 Jun-14 Dec-14
(mln) 12-mth moving average
Total Stay-Over Arrivals (R)Growth in Tourist Arrivals (L)
-8%-6%-4%-2%0%2%4%6%8%
10%
Dec-10 Jun-11 Dec-11 Jun-12 Dec-12 Jun-13 Dec-13 Jun-14 Dec-14
MortgagesCorporate LoansConsumer Loans

Caribbean Market Overview – 2015 Q2 10
CIBC Macro Strategy – Capital Markets Trading July 2015
Deposits continue to expand, forcing banks to hold more liquid assets, but recent central bank initiatives to reduce and remove the minimum interest rate payable on savings accounts in the ECCU and Barbados have reduced the cost of excess liquidity. Further, asset quality has started to improve and capital buffers remain adequate across most markets.
Global energy prices remained depressed during Q1 2015 and exchange rates stabilised, keeping average consumer prices low throughout the region and boosting external reserves. While rising food costs in Trinidad and Tobago pushed regional inflation from 1.7% during 2013 to 1.9% 12 months later, initial estimates for 2015 suggest that lower costs of fuel and transportation pushed consumer prices lower across most markets. Available data also suggest that higher tourist expenditure, recovering foreign direct investment, and weak domestic demand supported lower fuel imports, driving external reserves higher in 2015. Reserves in Barbados, Curacao, Jamaica, Sint Maarten, and Trinidad and Tobago have all improved y/y, while reserve buffers in the Bahamas have increased relative to December 2014.
The US economy has started to show signs of recovery after a dip in the first quarter, while the IMF expects average crude oil prices to remain below US$60 per barrel during 2015. These developments, including continued growth in the UK economy, should boost tourism-dependent economies’ prospects for the remainder of 2015. Growth in stay-over tourist arrivals should accelerate, particularly with increased airlift from North America and Europe, while average consumer prices are likely to remain stable over the near future, notwithstanding higher taxes in some markets. However, despite the gains made to-date, further fiscal consolidation is required in most markets, and this is likely to restrict growth in domestic demand in highly indebted economies, limiting loan growth and increasing excess liquidity. Further, while recent reductions in the minimum interest rate on savings accounts will likely ease the cost of rising deposit balances, lending rates in most markets should continue to decline as the banks compete for a smaller pool of eligible borrowers.
Chart 3 Regional3 Inflation and Intl Commodity Prices (end of period)
Source: Regional authorities, International Monetary Fund and CIBC FirstCaribbean * Average of U.K. Brent, Dubai and West Texas Intermediate + International Monetary Fund Food Index
3 Caribbean region includes Anguilla, Antigua and Barbuda, Barbados, Belize, Cayman Islands, Curaçao, Dominica, Grenada, Jamaica, St. Kitts and Nevis, St. Lucia, St. Maarten, St. Vincent and the Grenadines and Trinidad and Tobago.
-100%
-50%
0%
50%
0%
2%
4%
6%
May-11 Nov-11 May-12 Nov-12 May-13 Nov-13 May-14 Nov-14 May-15
Regional Inflation Rate (L)Growth in International Oil Prices* (R)Growth in International Food Prices+ (R)

Caribbean Market Overview – 2015 Q2 11
CIBC Macro Strategy – Capital Markets Trading July 2015
Anguilla Shane Lowe CIBC FirstCaribbean International Bank
Production, Prices and Employment The Eastern Caribbean Central Bank (ECCB) estimates that positive developments in construction, tourism, transport, storage and communication, and real estate, renting and business activities boosted economic activity by 1.9% during 2014, compared to just 0.4% one year earlier.
• A 2.7% increase in stay-over tourists propelled tourism value-added higher 3.5% during 2014 and contributed to a 1.8% rise in real estate, renting and business activities value-added. Since then, available data from the Caribbean Tourism Organisation (CTO) indicates that the number of stay-over visitors increased 4.3% during the first four months of 2015, as improved outturns from the USA (up 7.8%) and markets other than Canada and Europe (up 8.8%) eclipsed fewer tourists from Canada (down 6.4%) and Europe (down 14.0%).
• Notwithstanding reduced public construction activity, the completion of the Malliouhana Hotel and Spa and continuing construction on The Reef, Solaire Hotel and Villas project, Zemi Beach, and Manoah boutique resorts lifted total construction value-added 2.0% higher during 2014. The stronger tourism and construction activity pushed transport, storage and communications higher by 4.0%.
• However, high nonperforming loans and lower profitability reduced output in financial intermediation by 1.1% in 2014 relative to the 4.1% contraction one year earlier.
The ECCB estimates that increased economic activity and additional public hiring reduced the number of unemployed persons slightly in 2014 relative to one year earlier.
Consumer prices fell 0.6% during the 12 months ended March 2015 as prices for food and nonalcoholic beverages (down 0.4%), housing, utilities, gas and fuel (down 1.3%), and transportation (down 0.3%) all declined.
Developments in Financial Markets Bank liquidity continued to rise over the two-month period ending February 2015.
• Declines in both retail and corporate credit reduced total loans and advances by 2.2% over the first two months of 2015. Business, public sector, and personal loans declined 0.9%, 96.5%, and 2.0%.
• Total banking sector deposits advanced 2.4% between December 2014 and February 2015. Retail and corporate deposits increased 0.4% and 3.3%, eclipsing a 5.2% decline in nonresident balances.
Consequently, the loan-to-deposit ratio declined from 87.3% at the end of 2014 to 83.4% two months later.
Chart 1 Stay-Over Tourist Arrivals
Chart 2 Inflation (y/y; %)
Source: Caribbean Tourism Organization, Eastern Caribbean Central Bank and CIBC FirstCaribbean Source: Eastern Caribbean Central Bank and CIBC FirstCaribbean
50
55
60
65
70
75
$0
$1,000
$2,000
$3,000
$4,000
$5,000
$6,000
$7,000
Apr-11 Oct-11 Apr-12 Oct-12 Apr-13 Oct-13 Apr-14 Oct-14 Apr-15
(000's) (US$/person) Visitor Expenditure/person (L)Stay-Over Arrivals (R)
-5%
0%
5%
10%
15%
20%
25%
30%
35%
2010Q1 2011Q1 2012Q1 2013Q1 2014Q1 2015Q1
All ItemsFoodFuel and Light

Caribbean Market Overview – 2015 Q2 12
CIBC Macro Strategy – Capital Markets Trading July 2015
Government Debt During the first three months of 2015, persistent growth in revenues outpaced a modest increase in expenditure, pushing government fiscal surplus US$1.8 million (68.3%) higher to US$4.4 million relative to one year earlier.
• Broad-based improvements in tax revenue lifted current revenue US$2.0 million (10.7%) higher to US$20.3 million. Taxes on domestic goods and services increased US$1.5 million (23.1%), buoyed by a US$0.6 million improvement in accommodation taxes, while tax collections from income and profits, property, and international trade and transactions increased US$0.2 million, US$0.2 million, and US$0.1 million. Nontax revenues remained unchanged.
• Current expenditure increased modestly by US$0.2 million (1.4%) as the government spent more on personal emoluments, and goods and services (each up US$0.1 million), but maintained the same expenditure levels for interest payments, and transfers and subsidies as during the same period one year earlier. Having declined US$1.8 million (58.5%) during calendar year 2014, Capital expenditure and net lending fell a further US$0.1 million (30.4%).
Total public sector debt fell to US$82.2 million (approximately 26.8% of GDP) at the end of 2014, down from US$85.8 million (29.6% of GDP) one year earlier.
Outlook The ECCB projects that economic growth in the USA and UK, intensified marketing, and increased hotel and airline capacities should bolster tourism and construction activity during 2015. Further, developments in these sectors should positively affect the wholesale and retail trade, and real estate, renting and business activities sectors.
The central bank also expects the government to record another fiscal surplus as increased capital expenditures partially offset higher tax receipts and no change in current expenditure. Further, consumer prices are likely to decline in light of lower global energy prices.
Chart 3 Foreign Direct Investment
Chart 4 Growth in Key Balances
Source: Eastern Caribbean Central Bank and CIBC FirstCaribbean Source: Eastern Caribbean Central Bank and CIBC FirstCaribbean
$0
$20
$40
$60
$80
$100
$120
2008 2009 2010 2011 2012 2013 2014
(US$ mln) Equity Land Sales
Reinvested Earnings Other
-12%-10%-8%-6%-4%-2%0%2%4%6%
2009Q4 2010Q4 2011Q4 2012Q4 2013Q4 2014Q4
LoansDeposits

Caribbean Market Overview – 2015 Q2 13
CIBC Macro Strategy – Capital Markets Trading July 2015
Antigua and Barbuda Shane Lowe CIBC FirstCaribbean International Bank
Production, Prices and Employment Preliminary estimates from the ECCB show that real economic activity expanded 2.9% during 2014 relative to 1.8% in 2013.
• Tourism value-added improved 2.9% during 2014 as a 2.5% increase in stay-over tourist arrivals eclipsed a 1.5% reduction in cruise passenger arrivals. However, during the first five months of 2015, stay-over arrivals declined 4.2% as fewer tourists from the USA (down 3.7%), Canada (down 17.6%), and markets other than Europe (down 2.3%) more than offset a 0.1% increase in arrivals from Europe. On the other hand, cruise arrivals surged 18.6% during the first quarter of the year.
• Both private and public sector activity boosted construction and mining and quarrying output by 6.0% and 20.0% during 2014. Private activity benefitted from increased activity on tourism-related projects, while road and building construction initiatives drove the increase in public output.
• Tourism and construction activity drove wholesale and retail trade, transport, storage and communications, and real estate, renting and business activity higher by 8.0%, 2.9%, and 1.7%. Concurrently, a 21.2% fall in pension and gratuity payments contributed to 1.4% lower output in public administration, defence and social security.
Despite declines in the prices of fuel and light (down 6.8%) and housing and utilities (down 0.5%), higher prices for food (up 2.7%) and transportation and communication (up 1.5%) drove average consumer prices 1.4% higher between March 2014 and 2015.
Developments in Financial Markets Declining loans and rising deposits increased total banking system liquidity during the first two months of 2015.
• Weak corporate and retail lending pushed bank loans 1.5% lower between December 2014 and February 2015. Total retail loans declined 0.6%, while business and public sector balances fell 2.1% and 2.9%.
• Bank deposits advanced 2.3% over the first two months of 2015. Retail and corporate deposits increased 1.1% and 4.8%, while nonresident balances remained virtually unchanged.
The loan-to-deposit ratio fell from 73.3% at the end of December 2014 to 70.6% at the end of February 2015.
Chart 1 Stay-Over Tourist Arrivals
Chart 2 Inflation (y/y; %)
Source: Eastern Caribbean Central Bank and CIBC FirstCaribbean, Caribbean Tourism Organization Source: Eastern Caribbean Central Bank and CIBC FirstCaribbean
220
230
240
250
260
$500
$1,000
$1,500
$2,000
May-11 Nov-11 May-12 Nov-12 May-13 Nov-13 May-14 Nov-14 May-15
(000's) (US$/person) Visitor Expenditure/person (L)Stay-Over Arrivals (R)
-10%-5%0%5%10%15%20%25%30%35%40%
0%
2%
4%
6%
8%
10%
12%
2010Q1 2011Q1 2012Q1 2013Q1 2014Q1 2015Q1
All Items (L)Food (L)Fuel and Light (R)

Caribbean Market Overview – 2015 Q2 14
CIBC Macro Strategy – Capital Markets Trading July 2015
Government Debt Despite additional spending, the government’s fiscal position continues to improve. During the first three months of 2015, government fiscal surplus increased to US$10.5 million, up from US$1.4 million during the corresponding period one year earlier.
• A US$8.1 million (255.6%) surge in nontax revenue lifted current revenue 16.7% higher to US$70.4 million. Tax revenues also increased US$2.0 million (3.5%) as reduced receipts from taxes on income and profits (down US$0.4 million) and domestic goods and services (down US$0.8 million) only partially offset higher revenue from property taxes (up US$0.8 million) and taxes on international trade and transactions (up US$2.4 million).
• Total current expenditure increased US$1.9 million to US$58.5 million. Transfers and subsidies fell US$0.9 million (6.6%), but personal emoluments, goods and services, and interest payments increased US$0.1 million, US$0.4 million, and US$2.2 million. Capital expenditure fell US$0.7 million to US$1.6 million.
Total outstanding public sector debt increased 7.1% to US$1,223.5 million during 2014. Domestic obligations increased 15.1% to US$710.6 million, but external debt contracted 2.3% to US$512.9 million.
Outlook In 2015, the central bank expects that positive growth in Antigua and Barbuda’s major trading partners and additional airlift from the UK will boost prospects in tourism, while existing and upcoming public and private building projects should boost construction real value-added. The general uplift in economic activity should provide a fillip to growth in wholesale and retail trade, transport, storage and communications, and real estate, renting and business activity.
However, despite higher projected nontax and grant revenues and cuts to transfers and subsidies, the ECCB anticipates that government fiscal deficit is likely to rise due to higher debt service and increased spending on personal emoluments.
Chart 3 Foreign Direct Investment
Chart 4 Growth in Key Balances
Source: Eastern Caribbean Central Bank and CIBC FirstCaribbean Source: Eastern Caribbean Central Bank and CIBC FirstCaribbean
$0$20$40$60$80
$100$120$140$160$180
2008 2009 2010 2011 2012 2013 2014
(US$ mln) Equity Land Sales
Reinvested Earnings Other
-8%
-6%
-4%
-2%
0%
2%
4%
6%
8%
2009Q4 2010Q4 2011Q4 2012Q4 2013Q4 2014Q4
LoansDeposits
Caribbean Market Overview – 2015 Q2 15
CIBC Macro Strategy – Capital Markets Trading July 2015
Aruba Shane Lowe CIBC FirstCaribbean International Bank
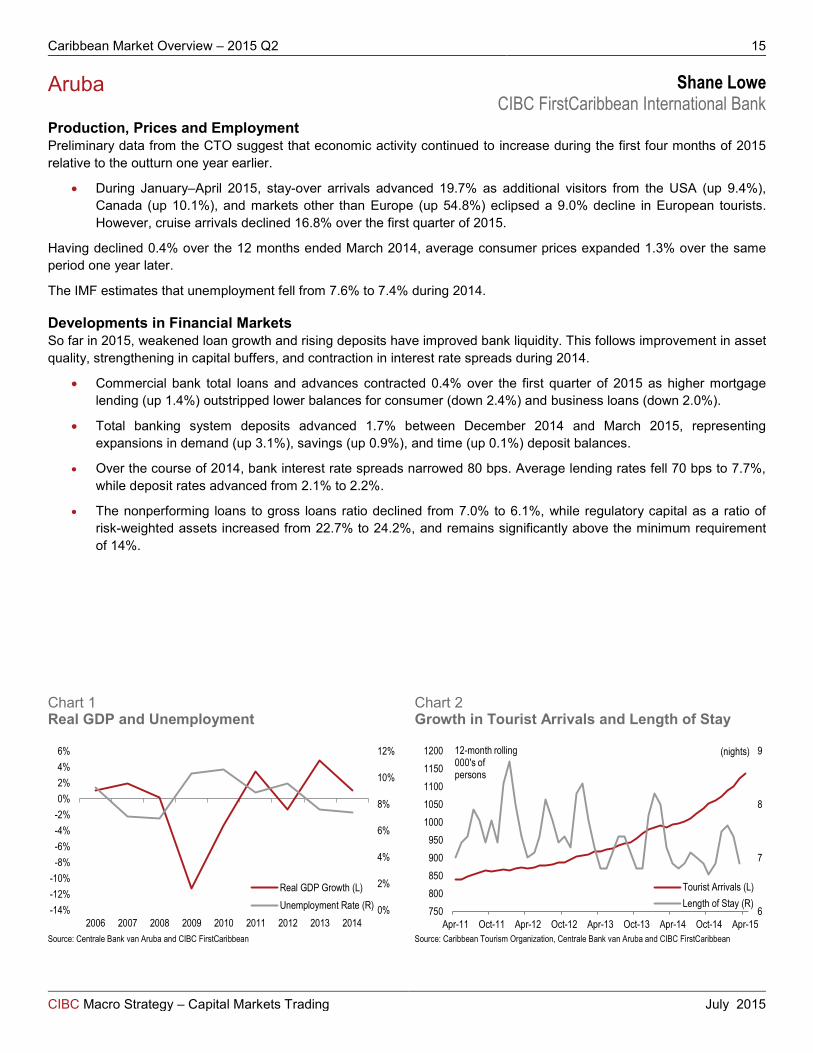
Production, Prices and Employment Preliminary data from the CTO suggest that economic activity continued to increase during the first four months of 2015 relative to the outturn one year earlier.
• During January–April 2015, stay-over arrivals advanced 19.7% as additional visitors from the USA (up 9.4%), Canada (up 10.1%), and markets other than Europe (up 54.8%) eclipsed a 9.0% decline in European tourists. However, cruise arrivals declined 16.8% over the first quarter of 2015.
Having declined 0.4% over the 12 months ended March 2014, average consumer prices expanded 1.3% over the same period one year later.
The IMF estimates that unemployment fell from 7.6% to 7.4% during 2014.
Developments in Financial Markets So far in 2015, weakened loan growth and rising deposits have improved bank liquidity. This follows improvement in asset quality, strengthening in capital buffers, and contraction in interest rate spreads during 2014.
• Commercial bank total loans and advances contracted 0.4% over the first quarter of 2015 as higher mortgage lending (up 1.4%) outstripped lower balances for consumer (down 2.4%) and business loans (down 2.0%).
• Total banking system deposits advanced 1.7% between December 2014 and March 2015, representing expansions in demand (up 3.1%), savings (up 0.9%), and time (up 0.1%) deposit balances.
• Over the course of 2014, bank interest rate spreads narrowed 80 bps. Average lending rates fell 70 bps to 7.7%, while deposit rates advanced from 2.1% to 2.2%.
• The nonperforming loans to gross loans ratio declined from 7.0% to 6.1%, while regulatory capital as a ratio of risk-weighted assets increased from 22.7% to 24.2%, and remains significantly above the minimum requirement of 14%.
Chart 1 Real GDP and Unemployment
Chart 2 Growth in Tourist Arrivals and Length of Stay
Source: Centrale Bank van Aruba and CIBC FirstCaribbean Source: Caribbean Tourism Organization, Centrale Bank van Aruba and CIBC FirstCaribbean
0%
2%
4%
6%
8%
10%
12%
-14%-12%-10%-8%-6%-4%-2%0%2%4%6%
2006 2007 2008 2009 2010 2011 2012 2013 2014
Real GDP Growth (L)Unemployment Rate (R) 6
7
8
9
750800850900950
10001050110011501200
Apr-11 Oct-11 Apr-12 Oct-12 Apr-13 Oct-13 Apr-14 Oct-14 Apr-15
(nights) 12-month rolling 000's of persons
Tourist Arrivals (L)Length of Stay (R)
Caribbean Market Overview – 2015 Q2 16
CIBC Macro Strategy – Capital Markets Trading July 2015
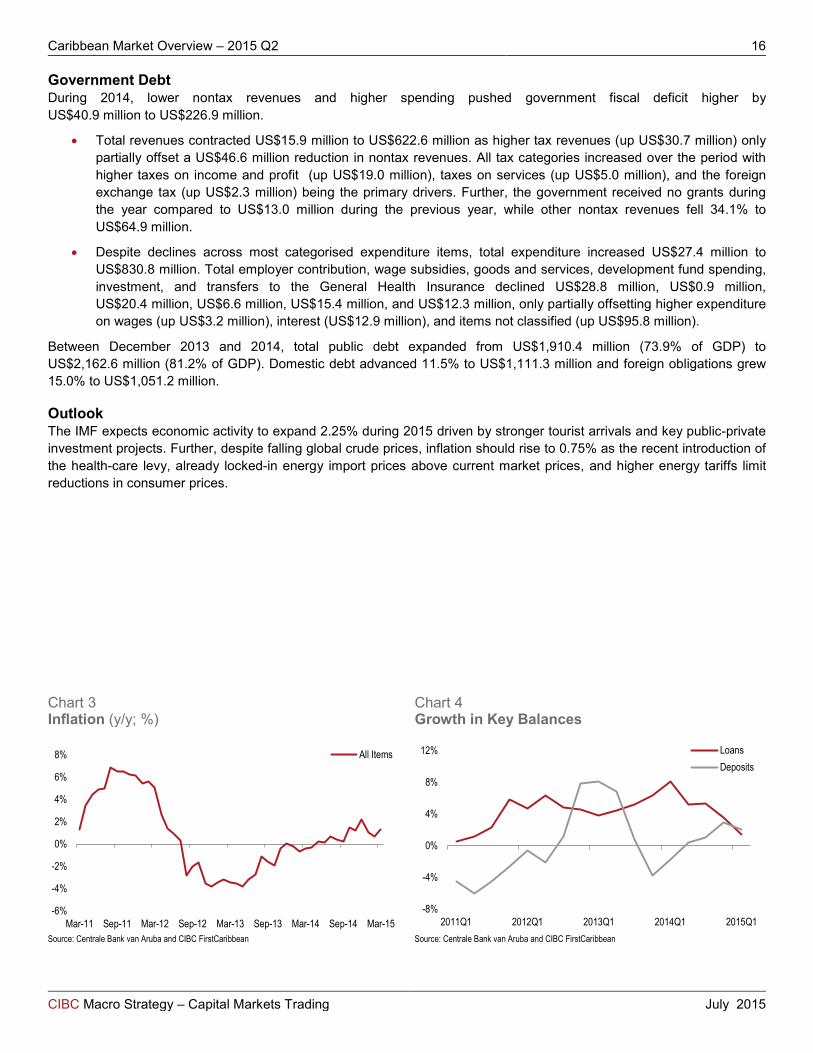
Government Debt During 2014, lower nontax revenues and higher spending pushed government fiscal deficit higher by US$40.9 million to US$226.9 million.
• Total revenues contracted US$15.9 million to US$622.6 million as higher tax revenues (up US$30.7 million) only partially offset a US$46.6 million reduction in nontax revenues. All tax categories increased over the period with higher taxes on income and profit (up US$19.0 million), taxes on services (up US$5.0 million), and the foreign exchange tax (up US$2.3 million) being the primary drivers. Further, the government received no grants during the year compared to US$13.0 million during the previous year, while other nontax revenues fell 34.1% to US$64.9 million.
• Despite declines across most categorised expenditure items, total expenditure increased US$27.4 million to US$830.8 million. Total employer contribution, wage subsidies, goods and services, development fund spending, investment, and transfers to the General Health Insurance declined US$28.8 million, US$0.9 million, US$20.4 million, US$6.6 million, US$15.4 million, and US$12.3 million, only partially offsetting higher expenditure on wages (up US$3.2 million), interest (US$12.9 million), and items not classified (up US$95.8 million).
Between December 2013 and 2014, total public debt expanded from US$1,910.4 million (73.9% of GDP) to US$2,162.6 million (81.2% of GDP). Domestic debt advanced 11.5% to US$1,111.3 million and foreign obligations grew 15.0% to US$1,051.2 million.
Outlook The IMF expects economic activity to expand 2.25% during 2015 driven by stronger tourist arrivals and key public-private investment projects. Further, despite falling global crude prices, inflation should rise to 0.75% as the recent introduction of the health-care levy, already locked-in energy import prices above current market prices, and higher energy tariffs limit reductions in consumer prices.
Chart 3 Inflation (y/y; %)
Chart 4 Growth in Key Balances
Source: Centrale Bank van Aruba and CIBC FirstCaribbean Source: Centrale Bank van Aruba and CIBC FirstCaribbean
-6%
-4%
-2%
0%
2%
4%
6%
8%
Mar-11 Sep-11 Mar-12 Sep-12 Mar-13 Sep-13 Mar-14 Sep-14 Mar-15
All Items
-8%
-4%
0%
4%
8%
12%
2011Q1 2012Q1 2013Q1 2014Q1 2015Q1
LoansDeposits

Caribbean Market Overview – 2015 Q2 17
CIBC Macro Strategy – Capital Markets Trading July 2015
The Bahamas Shane Lowe CIBC FirstCaribbean International Bank
Production, Prices and Employment Preliminary statistics from the Central Bank of the Bahamas suggest that economic activity continued to expand modestly during the first five months of 2015, after growing 1.0% during 2014.
• During January–March 2015, tourist arrivals by air grew 8.9% relative to growth of 0.2% one year earlier, while total hotel-room revenue expanded 5.0% during the first five months of the year, buoyed by a 6.6% rise in the average daily room rate to US$275.40 and a 5.8 p.p. increase in the average occupancy rate to 75.1%. However, total sea arrivals declined 1.2% during the first quarter as an increase in visitors to the Family Islands (up 3.3%) and Grand Bahama (up 48.7%) only partially mitigated the 12.7% reduction in sea arrivals to New Providence.
• Further, despite weak mortgage lending, foreign investment-led construction activity continues to drive increased construction real value-added.
Between April 2014 and 2015, average consumer prices increased 1.6% compared to a 1.1% increase over the corresponding period one year earlier as the effects of lower global crude oil prices partially offset those of the 7.5% VAT introduced on January 1, 2015.
Developments in Financial Markets During the first five months of 2015, bank excess liquidity remained elevated as rising deposits exacerbated weak domestic credit. However, consistently high private sector loan delinquency has started to edge downward.
• The banking system’s total domestic credit declined marginally by 0.4% between May 2014 and 2015 as a 23.0% contraction in foreign currency domestic credit eclipsed a marginal 1.6% rise in Bahamian dollar domestic credit. Despite a 1.2% increase in Bahamian dollar consumer credit, declines in local dollar mortgages (down 0.9%) and Bahamian dollar commercial and other loans (down 14.3%) reduced total private sector credit by 3.0%. Meanwhile, net credit to the central government increased 10.4%, but credit to the rest of the public sector fell 9.1% over the same period.
• Total resident deposits increased modestly by 0.1% during the 12 months ended May 2015 as a 23.1% surge in demand deposits offset declines in savings (down 1.7%), fixed (down 8.5%), and foreign currency (down 15.9%) deposits.
• During the first five months of 2015, commercial bank interest rate spreads widened 61 bps to 10.88%. The average lending rate increased from 11.55% to 12.29% and deposit rates rose 13 bps to 1.41%.
• Private sector nonperforming loans (NPLs) as a percentage of total loans fell from 16.1% at the end of 2014 to 15.8% by May 2015.
Chart 1 Growth in Tourist Arrivals
Chart 2 Inflation (y/y; %)
Source: Caribbean Tourism Organization and CIBC FirstCaribbean Source: Central Bank of the Bahamas and CIBC FirstCaribbean
1,250
1,300
1,350
1,400
1,450
Feb-12 Aug-12 Feb-13 Aug-13 Feb-14 Aug-14 Feb-15
12-month rolling 000's of persons
Tourist Arrivals
-1%
0%
1%
2%
3%
4%
5%
6%
7%
Apr-11 Oct-11 Apr-12 Oct-12 Apr-13 Oct-13 Apr-14 Oct-14 Apr-15
All ItemsFood
Caribbean Market Overview – 2015 Q2 18
CIBC Macro Strategy – Capital Markets Trading July 2015
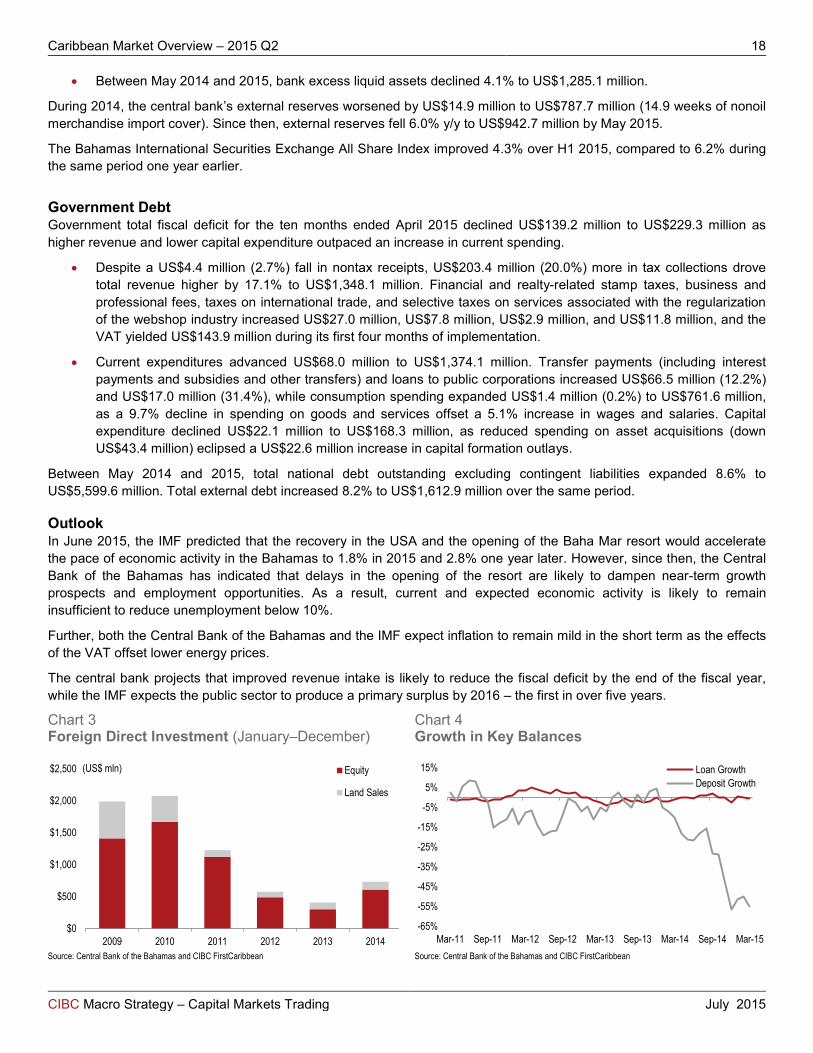
• Between May 2014 and 2015, bank excess liquid assets declined 4.1% to US$1,285.1 million.
During 2014, the central bank’s external reserves worsened by US$14.9 million to US$787.7 million (14.9 weeks of nonoil merchandise import cover). Since then, external reserves fell 6.0% y/y to US$942.7 million by May 2015.
The Bahamas International Securities Exchange All Share Index improved 4.3% over H1 2015, compared to 6.2% during the same period one year earlier.
Government Debt Government total fiscal deficit for the ten months ended April 2015 declined US$139.2 million to US$229.3 million as higher revenue and lower capital expenditure outpaced an increase in current spending.
• Despite a US$4.4 million (2.7%) fall in nontax receipts, US$203.4 million (20.0%) more in tax collections drove total revenue higher by 17.1% to US$1,348.1 million. Financial and realty-related stamp taxes, business and professional fees, taxes on international trade, and selective taxes on services associated with the regularization of the webshop industry increased US$27.0 million, US$7.8 million, US$2.9 million, and US$11.8 million, and the VAT yielded US$143.9 million during its first four months of implementation.
• Current expenditures advanced US$68.0 million to US$1,374.1 million. Transfer payments (including interest payments and subsidies and other transfers) and loans to public corporations increased US$66.5 million (12.2%) and US$17.0 million (31.4%), while consumption spending expanded US$1.4 million (0.2%) to US$761.6 million, as a 9.7% decline in spending on goods and services offset a 5.1% increase in wages and salaries. Capital expenditure declined US$22.1 million to US$168.3 million, as reduced spending on asset acquisitions (down US$43.4 million) eclipsed a US$22.6 million increase in capital formation outlays.
Between May 2014 and 2015, total national debt outstanding excluding contingent liabilities expanded 8.6% to US$5,599.6 million. Total external debt increased 8.2% to US$1,612.9 million over the same period.
Outlook In June 2015, the IMF predicted that the recovery in the USA and the opening of the Baha Mar resort would accelerate the pace of economic activity in the Bahamas to 1.8% in 2015 and 2.8% one year later. However, since then, the Central Bank of the Bahamas has indicated that delays in the opening of the resort are likely to dampen near-term growth prospects and employment opportunities. As a result, current and expected economic activity is likely to remain insufficient to reduce unemployment below 10%.
Further, both the Central Bank of the Bahamas and the IMF expect inflation to remain mild in the short term as the effects of the VAT offset lower energy prices.
The central bank projects that improved revenue intake is likely to reduce the fiscal deficit by the end of the fiscal year, while the IMF expects the public sector to produce a primary surplus by 2016 – the first in over five years.
Chart 3 Foreign Direct Investment (January–December)
Chart 4 Growth in Key Balances
Source: Central Bank of the Bahamas and CIBC FirstCaribbean Source: Central Bank of the Bahamas and CIBC FirstCaribbean
$0
$500
$1,000
$1,500
$2,000
$2,500
2009 2010 2011 2012 2013 2014
(US$ mln) Equity
Land Sales
-65%
-55%
-45%
-35%
-25%
-15%
-5%
5%
15%
Mar-11 Sep-11 Mar-12 Sep-12 Mar-13 Sep-13 Mar-14 Sep-14 Mar-15
Loan GrowthDeposit Growth

Caribbean Market Overview – 2015 Q2 19
CIBC Macro Strategy – Capital Markets Trading July 2015
Barbados Shane Lowe CIBC FirstCaribbean International Bank
Production, Prices and Employment Data from Barbados Tourism Marketing Inc. and the Central Bank of Barbados suggest that economic performance remained mixed during the first four months of 2015.
• Revised data from Barbados Tourism Marketing Inc. indicate that during Q1 2015, 171,471 stay-over tourists visited Barbados, 15.4% more than during the same period in 2014. Arrivals from the UK, USA, Canada, and Latin America and the Caribbean increased 12.9%, 27.7%, 28.4%, and 10.6%. However, 6.1% fewer cruise passengers visited during the period.
• Declines of 0.4% and 11.9% in the nominal values of imports of construction materials and imports of consumer goods suggest that construction activity and wholesale and retail trade remained weak during the January–April 2015 period relative to one year earlier. Further, zero sugar exports and a 9.2% decline in the value of other domestic goods exports point to declines in both sugar agriculture and manufacturing activity over the same period.
Between March 2014 and 2015, average consumer prices declined 0.8% compared to a 1.2% increase over the same period one year earlier. The prices of food (up 0.9%), and education, recreation and miscellaneous items (up 16.0%) both increased, but the cost of fuel and light, housing, and transportation declined 21.9%, 1.6%, and 5.0%.
During Q4 2014, the unemployment rate declined, falling from 13.0% during the latter quarter of 2013 to 11.5% one year later. Unemployment averaged 12.3% of the labour force in 2014 versus 11.6% during 2013.
Developments in Financial Markets The Central Bank of Barbados’ removal of the minimum interest rate on savings accounts in April 2015 has since lowered bank deposit rates and reduced the cost of rising excess liquidity.
• During the first four months of 2015, bank total loans and advances declined 0.3% relative to the end of 2014. Lower lending to businesses (down 0.1%) and the public sector (down 7.1%) pushed total business and government loans lower by 1.6%. Meanwhile, retail loans increased 0.4% as a 0.1% increase in mortgages supported a 0.7% rise in consumer loans.
• Despite lower nonresident deposit balances (down 1.7%), total deposits increased 2.9% due to a 0.2% increase in retail deposits and an 8.4% rise in corporate deposits.
Chart 1 Key Economic Indicators
Chart 2 Net Long-Term Private Capital Flows (January–March US$ mln)
Source: Central Bank of Barbados, Barbados Statistical Service, Caribbean Tourism Organization and CIBC FirstCaribbean
Source: Central Bank of Barbados and CIBC FirstCaribbean
-15%
-10%
-5%
0%
5%
10%
15%
20%
2010Q1 2011Q1 2012Q1 2013Q1 2014Q1 2015Q1
Real GDP GrowthTourist ArrivalsUnemployment Rate $0
$10
$20
$30
$40
$50
$60
$70
$80
2010Q1 2011Q1 2012Q1 2013Q1 2014Q1 2015Q1
Net Long-Term PrivateCapital Flows
Caribbean Market Overview – 2015 Q2 20
CIBC Macro Strategy – Capital Markets Trading July 2015
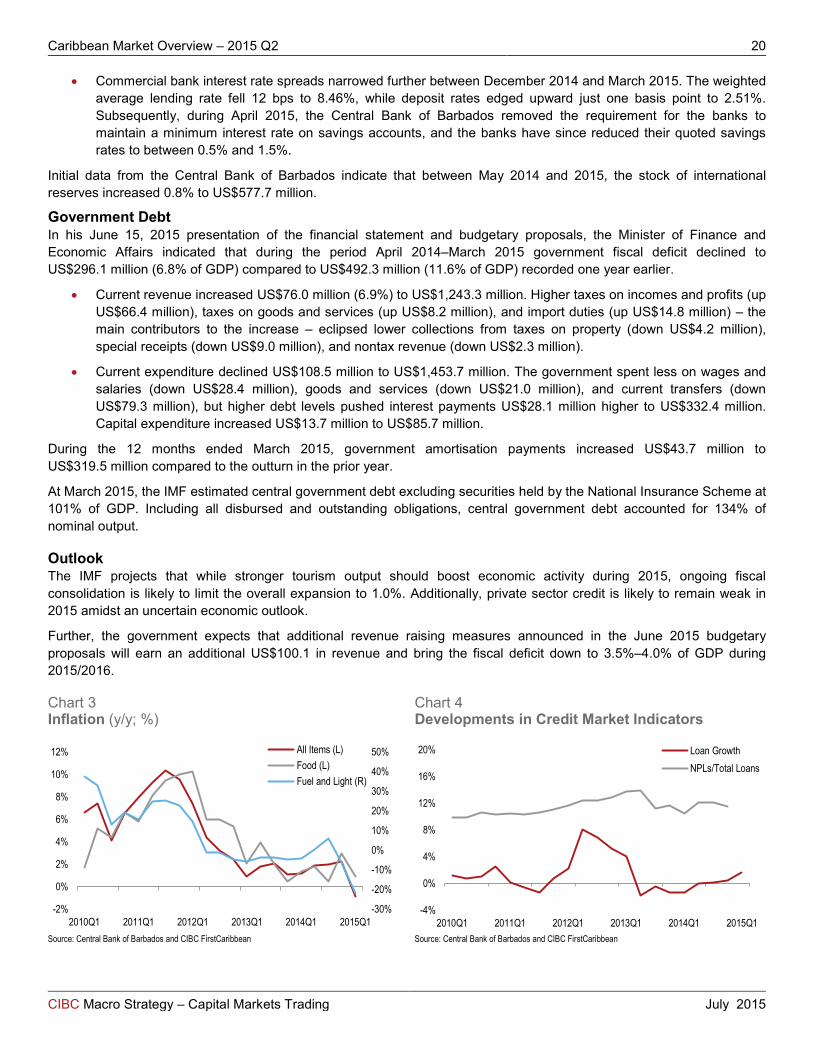
• Commercial bank interest rate spreads narrowed further between December 2014 and March 2015. The weighted average lending rate fell 12 bps to 8.46%, while deposit rates edged upward just one basis point to 2.51%. Subsequently, during April 2015, the Central Bank of Barbados removed the requirement for the banks to maintain a minimum interest rate on savings accounts, and the banks have since reduced their quoted savings rates to between 0.5% and 1.5%.
Initial data from the Central Bank of Barbados indicate that between May 2014 and 2015, the stock of international reserves increased 0.8% to US$577.7 million.
Government Debt In his June 15, 2015 presentation of the financial statement and budgetary proposals, the Minister of Finance and Economic Affairs indicated that during the period April 2014–March 2015 government fiscal deficit declined to US$296.1 million (6.8% of GDP) compared to US$492.3 million (11.6% of GDP) recorded one year earlier.
• Current revenue increased US$76.0 million (6.9%) to US$1,243.3 million. Higher taxes on incomes and profits (up US$66.4 million), taxes on goods and services (up US$8.2 million), and import duties (up US$14.8 million) – the main contributors to the increase – eclipsed lower collections from taxes on property (down US$4.2 million), special receipts (down US$9.0 million), and nontax revenue (down US$2.3 million).
• Current expenditure declined US$108.5 million to US$1,453.7 million. The government spent less on wages and salaries (down US$28.4 million), goods and services (down US$21.0 million), and current transfers (down US$79.3 million), but higher debt levels pushed interest payments US$28.1 million higher to US$332.4 million. Capital expenditure increased US$13.7 million to US$85.7 million.
During the 12 months ended March 2015, government amortisation payments increased US$43.7 million to US$319.5 million compared to the outturn in the prior year.
At March 2015, the IMF estimated central government debt excluding securities held by the National Insurance Scheme at 101% of GDP. Including all disbursed and outstanding obligations, central government debt accounted for 134% of nominal output.
Outlook The IMF projects that while stronger tourism output should boost economic activity during 2015, ongoing fiscal consolidation is likely to limit the overall expansion to 1.0%. Additionally, private sector credit is likely to remain weak in 2015 amidst an uncertain economic outlook.
Further, the government expects that additional revenue raising measures announced in the June 2015 budgetary proposals will earn an additional US$100.1 in revenue and bring the fiscal deficit down to 3.5%–4.0% of GDP during 2015/2016.
Chart 3 Inflation (y/y; %)
Chart 4 Developments in Credit Market Indicators
Source: Central Bank of Barbados and CIBC FirstCaribbean Source: Central Bank of Barbados and CIBC FirstCaribbean
-30%
-20%
-10%
0%
10%
20%
30%
40%
50%
-2%
0%
2%
4%
6%
8%
10%
12%
2010Q1 2011Q1 2012Q1 2013Q1 2014Q1 2015Q1
All Items (L)Food (L)Fuel and Light (R)
-4%
0%
4%
8%
12%
16%
20%
2010Q1 2011Q1 2012Q1 2013Q1 2014Q1 2015Q1
Loan GrowthNPLs/Total Loans

Caribbean Market Overview – 2015 Q2 21
CIBC Macro Strategy – Capital Markets Trading July 2015
Belize Shane Lowe CIBC FirstCaribbean International Bank
Production, Prices and Employment The Statistical Institute of Belize reports that during the first three months of 2015, overall economic activity expanded 7.0%, benefitting from positive developments in agriculture, manufacturing, and cruise tourism.
• Primary sector production advanced 18.7% as higher citrus (up 101.9%), banana (up more than 22%), and fishing (up 16.5%) production eclipsed a small 2.7% contraction in sugarcane deliveries. However, output in the secondary sector declined 0.1% as greater manufacturing output of orange concentrate (up over 100%) and sugar (up 7.7% due to improved weather, more efficient operations and a better sugarcane crop) only partially offset declines in electricity and water (down 26.7%) and construction (down 10.8%).
• Tertiary sector real economic value-added grew 4.7% over the first quarter of 2015 buoyed by 10.3% growth in wholesale and retail trade and 6.0% growth in hotels and restaurants. Further, preliminary data from the CTO suggest that while total stay-over arrivals declined 1.2% over the first four months of 2015, the number of cruise passengers advanced 4.9%. Stay-over arrivals from the USA and Canada fell 1.3% and 11.7%, eclipsing growth from Europe (up 1.7%) and other markets (up 4.9%).
Consumer prices fell 0.9% between May 2014 and 2015, compared to an increase of 1.7% one year earlier. The prices of food and nonalcoholic beverages, housing, water, fuel and power, and transportation declined 0.2%, 0.4%, and 7.4%.
Developments in Financial Markets During 2014, bank asset quality continued to improve and capital buffers remained healthy. However, since then, stalled loan growth and higher deposits have exacerbated bank excess liquidity and reduced lending and deposit interest rates.
• Total banking sector loans and advances declined marginally by 0.1% between December 2014 and April 2015 as higher lending to the corporate sector (up 0.6%) offset lower retail loans (down 2.5%).
• Over the first four months of 2015, higher balances of retail (up 2.2%), corporate (up 5.0%), and nonresident (up 7.2%) deposits pushed total deposits 3.8% higher.
• Further, commercial bank average interest rate spreads narrowed eight bps between December 2014 and April 2015, as the weighted-average lending and deposit rates fell 22 bps and 14 bps to 10.44% and 1.59%.
• The Central Bank of Belize reports that the nonperforming loans to total loans ratio fell from 8.8% at December 2013 to 7.0% 12 months later.
Chart 1 Key Economic Indicators
Chart 2 Inflation (y/y; %)
Source: Central Bank of Belize, Caribbean Tourism Organization and CIBC FirstCaribbean Source: Central Bank of Belize and CIBC FirstCaribbean
-2%
0%
2%
4%
6%
8%
10%
12%
14%
2010Q1 2011Q1 2012Q1 2013Q1 2014Q1 2015Q1
Real GDP Growth (L)Tourist Arrivals (R)
-1.5%-1.0%-0.5%0.0%0.5%1.0%1.5%2.0%2.5%3.0%
May-11 Nov-11 May-12 Nov-12 May-13 Nov-13 May-14 Nov-14 May-15
All Items
Caribbean Market Overview – 2015 Q2 22
CIBC Macro Strategy – Capital Markets Trading July 2015
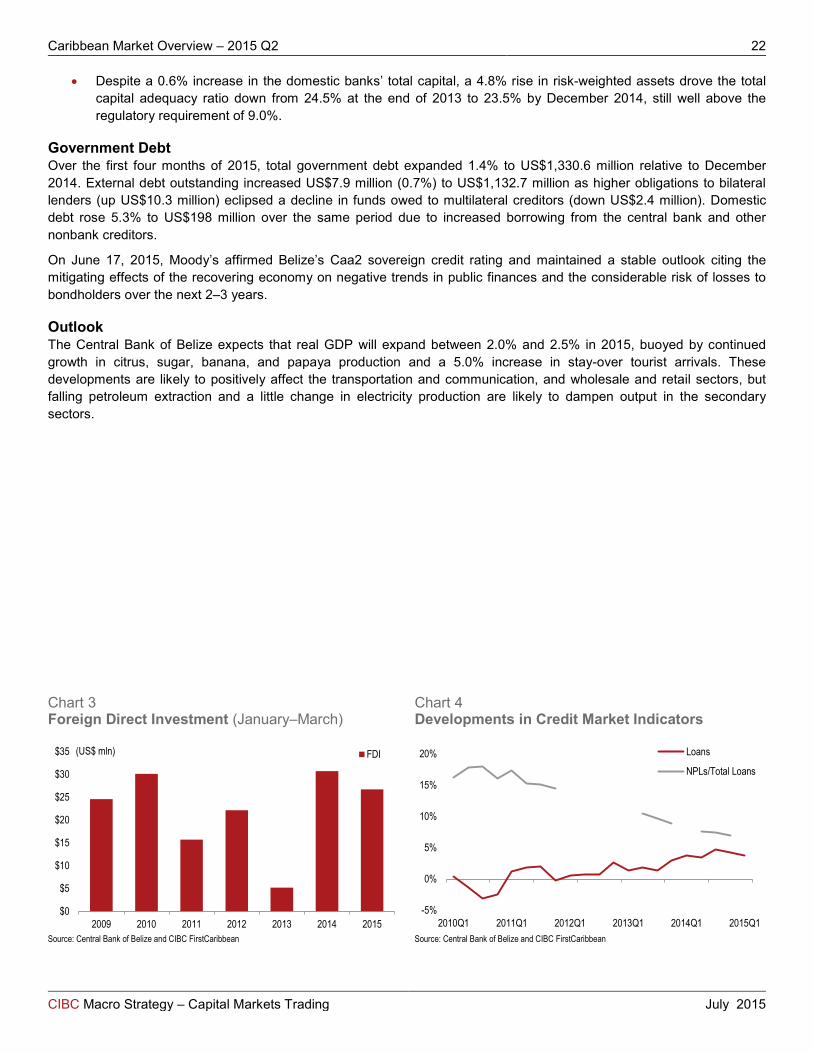
• Despite a 0.6% increase in the domestic banks’ total capital, a 4.8% rise in risk-weighted assets drove the total capital adequacy ratio down from 24.5% at the end of 2013 to 23.5% by December 2014, still well above the regulatory requirement of 9.0%.
Government Debt Over the first four months of 2015, total government debt expanded 1.4% to US$1,330.6 million relative to December 2014. External debt outstanding increased US$7.9 million (0.7%) to US$1,132.7 million as higher obligations to bilateral lenders (up US$10.3 million) eclipsed a decline in funds owed to multilateral creditors (down US$2.4 million). Domestic debt rose 5.3% to US$198 million over the same period due to increased borrowing from the central bank and other nonbank creditors.
On June 17, 2015, Moody’s affirmed Belize’s Caa2 sovereign credit rating and maintained a stable outlook citing the mitigating effects of the recovering economy on negative trends in public finances and the considerable risk of losses to bondholders over the next 2–3 years.
Outlook The Central Bank of Belize expects that real GDP will expand between 2.0% and 2.5% in 2015, buoyed by continued growth in citrus, sugar, banana, and papaya production and a 5.0% increase in stay-over tourist arrivals. These developments are likely to positively affect the transportation and communication, and wholesale and retail sectors, but falling petroleum extraction and a little change in electricity production are likely to dampen output in the secondary sectors.
Chart 3 Foreign Direct Investment (January–March)
Chart 4 Developments in Credit Market Indicators
Source: Central Bank of Belize and CIBC FirstCaribbean Source: Central Bank of Belize and CIBC FirstCaribbean
$0
$5
$10
$15
$20
$25
$30
$35
2009 2010 2011 2012 2013 2014 2015
(US$ mln) FDI
-5%
0%
5%
10%
15%
20%
2010Q1 2011Q1 2012Q1 2013Q1 2014Q1 2015Q1
Loans
NPLs/Total Loans
Caribbean Market Overview – 2015 Q2 23
CIBC Macro Strategy – Capital Markets Trading July 2015
Bermuda John H. Welch CIBC Macro Strategy
Bermuda: Economy and Fiscal Stance Still Struggling to Improve S&P lowered Bermuda’s long-term rating to A+ from AA- with a stable outlook on poor economic performance. This removes the split rating with Moody’s that has an A1 (stable) rating and Fitch with A+ (stable) as well. Bermuda’s growth disappointed. S&P cites weak economic performance and weak public finances with the six-year recession causing declining revenues and fiscal deficits in excess of 5% for the 2012 to 2015 period. Interest costs have grown to 11% of revenues. The split rating along with Bermuda’s poor 2014 real GDP growth made this decision by S&P not a surprise. It also removes the final negative outlook on Bermuda. The prospects for 2015 and beyond look much better, however, especially since Bermuda was chosen to host America’s Cup in 2017.
We expect real GDP to remain flat in 2015 (+0.3% growth), but then recover to 1.2% in 2016, 1.8% in 2017, and 2.2% in 2018 on better tourism, especially from the USA. Tourism continued to struggle. Total visitors rose a mere 0.7% in 2014 and fell 5.6% in Q1 2015. Long-stay visitors declined 5.1% in 2014 and fell another 7% in Q1 2015. We expect better results later in 2015. On the other hand, Bermuda was chosen to host America’s Cup in 2017. This should provide a US$250 million injection into the economy over the next three years and further bolster the construction sector that has already showed significant activity concentrated in the hospital sector. Continuing growth in the USA and UK should, at some point, help tourism.
The main difference we had with S&P stemmed from their forecast of a contraction of 1.5% in real GDP, the source they attribute to the finance ministry. We have taken that forecast for our own. Moreover, we did not count capital expenditure as primary expenditure and now we do, increasing our estimates. The fiscal situation shows signs of future improvement but not yet. Revised figures show that government nominal fiscal deficit was 5.4% in 2014/15, down slightly from 6.0% of GDP in 2013/14. The primary deficit fell marginally from 4.1% of GDP in 2012 to 1.8% of GDP expected in 2015. Ongoing mild fiscal austerity should turn the primary balance positive only in 2018 to 0.6% of GDP and shrink the nominal deficit to 1.6% of GDP.
We expect gross government debt to fall in absolute terms to US$2.185 billion or 38.7% of GDP in 2014/15 from US$2.305 billion or 41.4% of GDP in 2013/14, mostly reflecting over-borrowing in the prior period. The government remains a net creditor to the tune of 6.0% of GDP in 2014/15, down from 13.6% in 2013/14. The government’s net creditor position should continue to decline and stabilize at 2.2% of GDP as of 2017.
Table 1 Key Economic Indicators & Forecasts
Chart 1 Net and Gross Public Sector Debt
Key Annual Indicators 2012 2013E 2014F 2015F 2016F 2017F GDP per capita (US$) 87,706 85,747 86,290 88,076 90,884 94,524 Real GDP per capita (% change) -4.8% -1.2% 0.1% 0.3% 0.8% 0.8% Real GDP (% change) -4.8% -2.5% -1.5% 0.3% 1.2% 1.8% Gross Public Sector Debt/GDP (%) 29% 41% 39% 41% 41% 41% Net Public Sector Debt/GDP (%) -9.2% -13.6% -6.1% -3.9% -2.7% -2.2% Public Sector Nom. Fiscal Bal./GDP (%) -4.4% -6.0% -5.4% -3.9% -3.2% -2.4% Public Sector Primary Fiscal Bal./GDP (%) -4.1% -3.3% -3.3% -1.8% -1.1% -0.2% Inflation (% change) 2.4% 2.4% 2.1% 1.6% 1.8% 1.8% Current Account Bal./GDP (%) 15.7% 16.8% 16.8% 15.5% 15.4% 15.4% Current Account Bal./CAR (%) 26.5% 24.5% 28.2% 26.2% 26.1% 26.1% Net ext. liabilities/CAR (%) -542% -583% -604% -621% -630% -635% Net fin. sector ext. debt/CAR (%) -177% -177% -177% -177% -177% -182% Net nonfin. private sector ext. debt/CAR (%) -566% -635% -683% -734% -777% -781%
Source: Gov’t of Bermuda, S&P, Bloomberg, and CIBC World Markets
Source: Gov’t of Bermuda, S&P, Bloomberg, and CIBC World Markets
-40%
-20%
0%
20%
40%
60%
2005 2008 2011 2014E 2017F
Net GG debt/GDP (%)GG debt/GDP (%)
Forecast
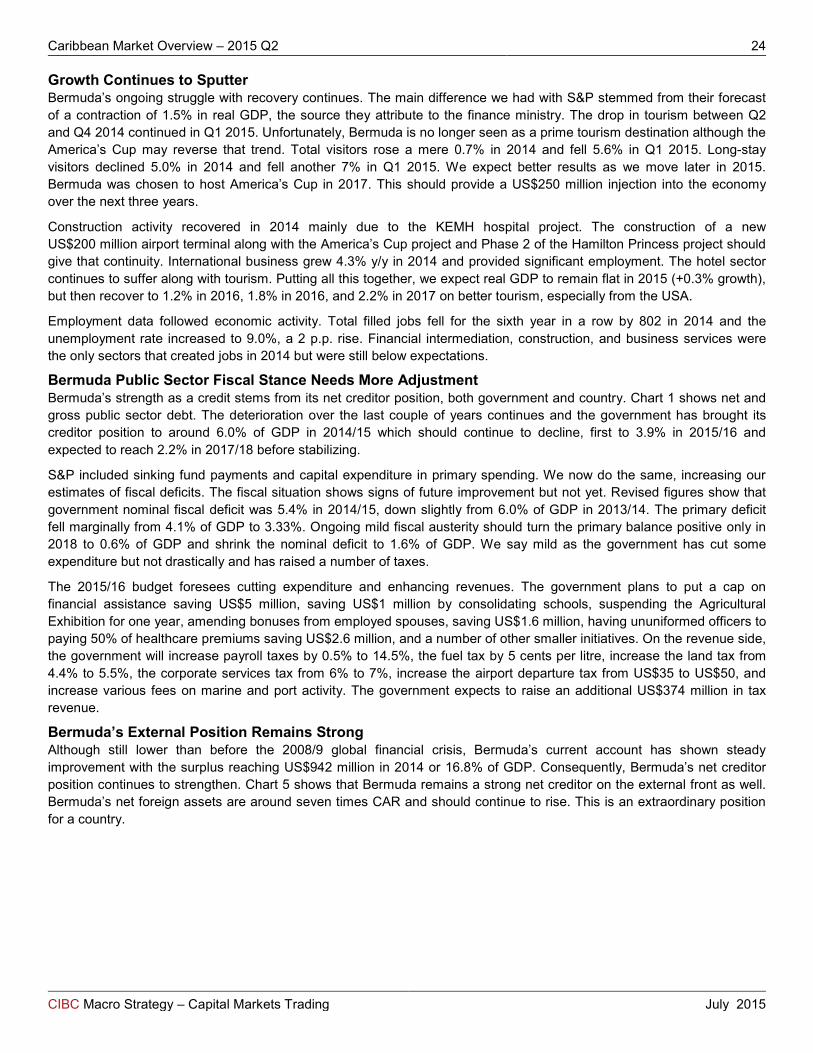
Caribbean Market Overview – 2015 Q2 24
CIBC Macro Strategy – Capital Markets Trading July 2015
Growth Continues to Sputter Bermuda’s ongoing struggle with recovery continues. The main difference we had with S&P stemmed from their forecast of a contraction of 1.5% in real GDP, the source they attribute to the finance ministry. The drop in tourism between Q2 and Q4 2014 continued in Q1 2015. Unfortunately, Bermuda is no longer seen as a prime tourism destination although the America’s Cup may reverse that trend. Total visitors rose a mere 0.7% in 2014 and fell 5.6% in Q1 2015. Long-stay visitors declined 5.0% in 2014 and fell another 7% in Q1 2015. We expect better results as we move later in 2015. Bermuda was chosen to host America’s Cup in 2017. This should provide a US$250 million injection into the economy over the next three years.
Construction activity recovered in 2014 mainly due to the KEMH hospital project. The construction of a new US$200 million airport terminal along with the America’s Cup project and Phase 2 of the Hamilton Princess project should give that continuity. International business grew 4.3% y/y in 2014 and provided significant employment. The hotel sector continues to suffer along with tourism. Putting all this together, we expect real GDP to remain flat in 2015 (+0.3% growth), but then recover to 1.2% in 2016, 1.8% in 2016, and 2.2% in 2017 on better tourism, especially from the USA.
Employment data followed economic activity. Total filled jobs fell for the sixth year in a row by 802 in 2014 and the unemployment rate increased to 9.0%, a 2 p.p. rise. Financial intermediation, construction, and business services were the only sectors that created jobs in 2014 but were still below expectations.
Bermuda Public Sector Fiscal Stance Needs More Adjustment Bermuda’s strength as a credit stems from its net creditor position, both government and country. Chart 1 shows net and gross public sector debt. The deterioration over the last couple of years continues and the government has brought its creditor position to around 6.0% of GDP in 2014/15 which should continue to decline, first to 3.9% in 2015/16 and expected to reach 2.2% in 2017/18 before stabilizing.
S&P included sinking fund payments and capital expenditure in primary spending. We now do the same, increasing our estimates of fiscal deficits. The fiscal situation shows signs of future improvement but not yet. Revised figures show that government nominal fiscal deficit was 5.4% in 2014/15, down slightly from 6.0% of GDP in 2013/14. The primary deficit fell marginally from 4.1% of GDP to 3.33%. Ongoing mild fiscal austerity should turn the primary balance positive only in 2018 to 0.6% of GDP and shrink the nominal deficit to 1.6% of GDP. We say mild as the government has cut some expenditure but not drastically and has raised a number of taxes.
The 2015/16 budget foresees cutting expenditure and enhancing revenues. The government plans to put a cap on financial assistance saving US$5 million, saving US$1 million by consolidating schools, suspending the Agricultural Exhibition for one year, amending bonuses from employed spouses, saving US$1.6 million, having ununiformed officers to paying 50% of healthcare premiums saving US$2.6 million, and a number of other smaller initiatives. On the revenue side, the government will increase payroll taxes by 0.5% to 14.5%, the fuel tax by 5 cents per litre, increase the land tax from 4.4% to 5.5%, the corporate services tax from 6% to 7%, increase the airport departure tax from US$35 to US$50, and increase various fees on marine and port activity. The government expects to raise an additional US$374 million in tax revenue.
Bermuda’s External Position Remains Strong Although still lower than before the 2008/9 global financial crisis, Bermuda’s current account has shown steady improvement with the surplus reaching US$942 million in 2014 or 16.8% of GDP. Consequently, Bermuda’s net creditor position continues to strengthen. Chart 5 shows that Bermuda remains a strong net creditor on the external front as well. Bermuda’s net foreign assets are around seven times CAR and should continue to rise. This is an extraordinary position for a country.

Caribbean Market Overview – 2015 Q2 25
CIBC Macro Strategy – Capital Markets Trading July 2015
Chart 2 Visitors by Mode of Arrival (4-qtr sum)
Chart 3 Long-Stay Visitors vs. Total Visitors (4-qtr sum)
Source: Gov’t of Bermuda and CIBC World Markets Source: Gov’t of Bermuda and CIBC World Markets
Chart 4 Primary and Nominal Public Sector Balances
Chart 5 External Debt as a % Current Acct. Receipts (CAR)
Source: Gov’t of Bermuda, S&P, Bloomberg, and CIBC World Markets Source: Gov’t of Bermuda, S&P, Bloomberg, and CIBC World Markets
0
100,000
200,000
300,000
400,000
500,000
600,000
700,000
2010Q4 2011Q2 2011Q4 2012Q2 2012Q4 2013Q2 2013Q4 2014Q2 2014Q4
CruiseAir
0
100,000
200,000
300,000
400,000
500,000
600,000
700,000
2010Q4 2011Q2 2011Q4 2012Q2 2012Q4 2013Q2 2013Q4 2014Q2 2014Q4
Long-Stay TotalCruise+Air
-7%
-6%
-5%
-4%
-3%
-2%
-1%
0%
1%
2005 2007 2009 2011 2013E 2015F 2017F
Nominal BalancePrimary Balance
Forecast
-900%-800%-700%-600%-500%-400%-300%-200%-100%
0%
2012 2013E 2014E 2015F 2016F 2017F
Net ext. liabilities/CAR (%)Net fin. sector ext. debt/CAR (%)Net nonfin. private sector ext. debt/CAR (%)
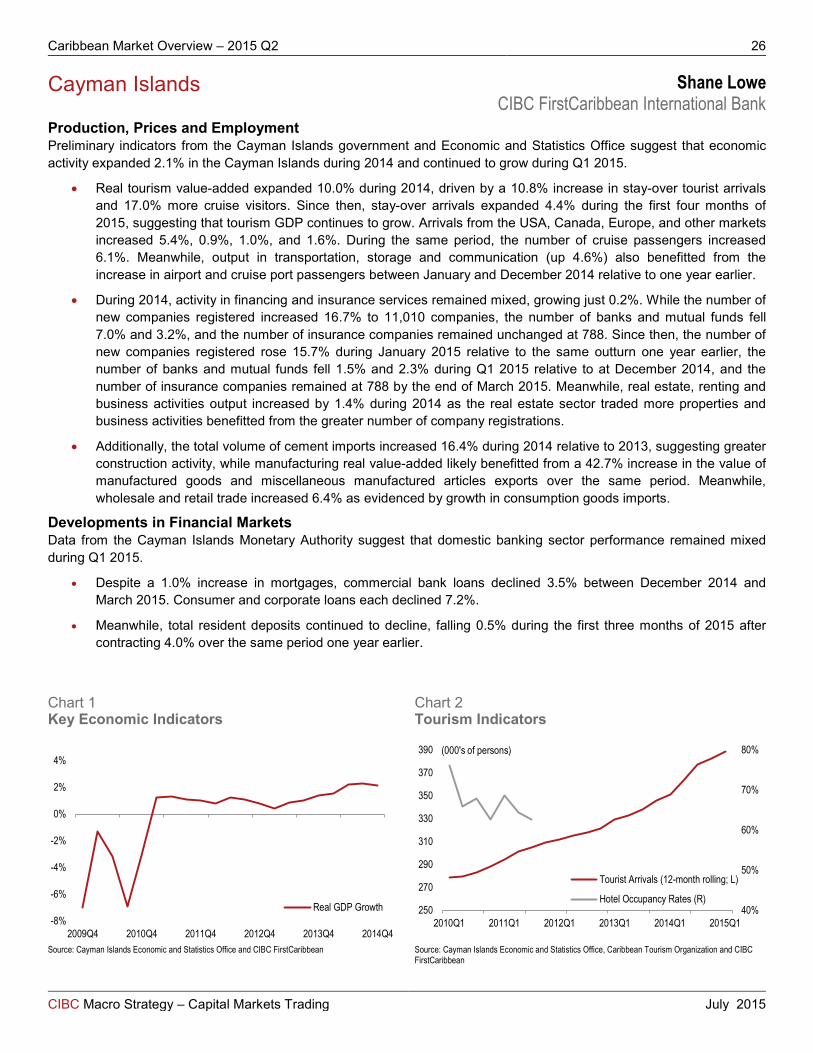
Caribbean Market Overview – 2015 Q2 26
CIBC Macro Strategy – Capital Markets Trading July 2015
Cayman Islands Shane Lowe CIBC FirstCaribbean International Bank
Production, Prices and Employment Preliminary indicators from the Cayman Islands government and Economic and Statistics Office suggest that economic activity expanded 2.1% in the Cayman Islands during 2014 and continued to grow during Q1 2015.
• Real tourism value-added expanded 10.0% during 2014, driven by a 10.8% increase in stay-over tourist arrivals and 17.0% more cruise visitors. Since then, stay-over arrivals expanded 4.4% during the first four months of 2015, suggesting that tourism GDP continues to grow. Arrivals from the USA, Canada, Europe, and other markets increased 5.4%, 0.9%, 1.0%, and 1.6%. During the same period, the number of cruise passengers increased 6.1%. Meanwhile, output in transportation, storage and communication (up 4.6%) also benefitted from the increase in airport and cruise port passengers between January and December 2014 relative to one year earlier.
• During 2014, activity in financing and insurance services remained mixed, growing just 0.2%. While the number of new companies registered increased 16.7% to 11,010 companies, the number of banks and mutual funds fell 7.0% and 3.2%, and the number of insurance companies remained unchanged at 788. Since then, the number of new companies registered rose 15.7% during January 2015 relative to the same outturn one year earlier, the number of banks and mutual funds fell 1.5% and 2.3% during Q1 2015 relative to at December 2014, and the number of insurance companies remained at 788 by the end of March 2015. Meanwhile, real estate, renting and business activities output increased by 1.4% during 2014 as the real estate sector traded more properties and business activities benefitted from the greater number of company registrations.
• Additionally, the total volume of cement imports increased 16.4% during 2014 relative to 2013, suggesting greater construction activity, while manufacturing real value-added likely benefitted from a 42.7% increase in the value of manufactured goods and miscellaneous manufactured articles exports over the same period. Meanwhile, wholesale and retail trade increased 6.4% as evidenced by growth in consumption goods imports.
Developments in Financial Markets Data from the Cayman Islands Monetary Authority suggest that domestic banking sector performance remained mixed during Q1 2015.
• Despite a 1.0% increase in mortgages, commercial bank loans declined 3.5% between December 2014 and March 2015. Consumer and corporate loans each declined 7.2%.
• Meanwhile, total resident deposits continued to decline, falling 0.5% during the first three months of 2015 after contracting 4.0% over the same period one year earlier.
Chart 1 Key Economic Indicators
Chart 2 Tourism Indicators
Source: Cayman Islands Economic and Statistics Office and CIBC FirstCaribbean Source: Cayman Islands Economic and Statistics Office, Caribbean Tourism Organization and CIBC FirstCaribbean
-8%
-6%
-4%
-2%
0%
2%
4%
2009Q4 2010Q4 2011Q4 2012Q4 2013Q4 2014Q4
Real GDP Growth 40%
50%
60%
70%
80%
250
270
290
310
330
350
370
390
2010Q1 2011Q1 2012Q1 2013Q1 2014Q1 2015Q1
(000's of persons)
Tourist Arrivals (12-month rolling; L)
Hotel Occupancy Rates (R)
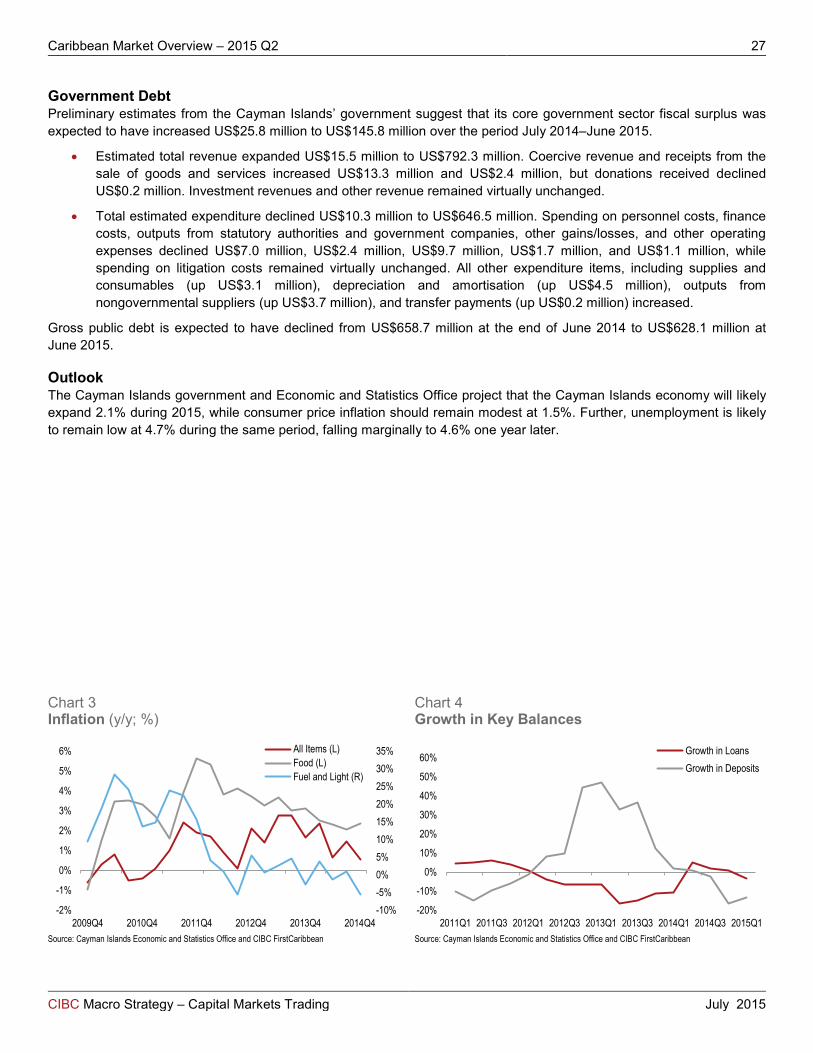
Caribbean Market Overview – 2015 Q2 27
CIBC Macro Strategy – Capital Markets Trading July 2015
Government Debt Preliminary estimates from the Cayman Islands’ government suggest that its core government sector fiscal surplus was expected to have increased US$25.8 million to US$145.8 million over the period July 2014–June 2015.
• Estimated total revenue expanded US$15.5 million to US$792.3 million. Coercive revenue and receipts from the sale of goods and services increased US$13.3 million and US$2.4 million, but donations received declined US$0.2 million. Investment revenues and other revenue remained virtually unchanged.
• Total estimated expenditure declined US$10.3 million to US$646.5 million. Spending on personnel costs, finance costs, outputs from statutory authorities and government companies, other gains/losses, and other operating expenses declined US$7.0 million, US$2.4 million, US$9.7 million, US$1.7 million, and US$1.1 million, while spending on litigation costs remained virtually unchanged. All other expenditure items, including supplies and consumables (up US$3.1 million), depreciation and amortisation (up US$4.5 million), outputs from nongovernmental suppliers (up US$3.7 million), and transfer payments (up US$0.2 million) increased.
Gross public debt is expected to have declined from US$658.7 million at the end of June 2014 to US$628.1 million at June 2015.
Outlook The Cayman Islands government and Economic and Statistics Office project that the Cayman Islands economy will likely expand 2.1% during 2015, while consumer price inflation should remain modest at 1.5%. Further, unemployment is likely to remain low at 4.7% during the same period, falling marginally to 4.6% one year later.
Chart 3 Inflation (y/y; %)
Chart 4 Growth in Key Balances
Source: Cayman Islands Economic and Statistics Office and CIBC FirstCaribbean Source: Cayman Islands Economic and Statistics Office and CIBC FirstCaribbean
-10%-5%0%5%10%15%20%25%30%35%
-2%
-1%
0%
1%
2%
3%
4%
5%
6%
2009Q4 2010Q4 2011Q4 2012Q4 2013Q4 2014Q4
All Items (L)Food (L)Fuel and Light (R)
-20%
-10%
0%
10%
20%
30%
40%
50%
60%
2011Q1 2011Q3 2012Q1 2012Q3 2013Q1 2013Q3 2014Q1 2014Q3 2015Q1
Growth in LoansGrowth in Deposits
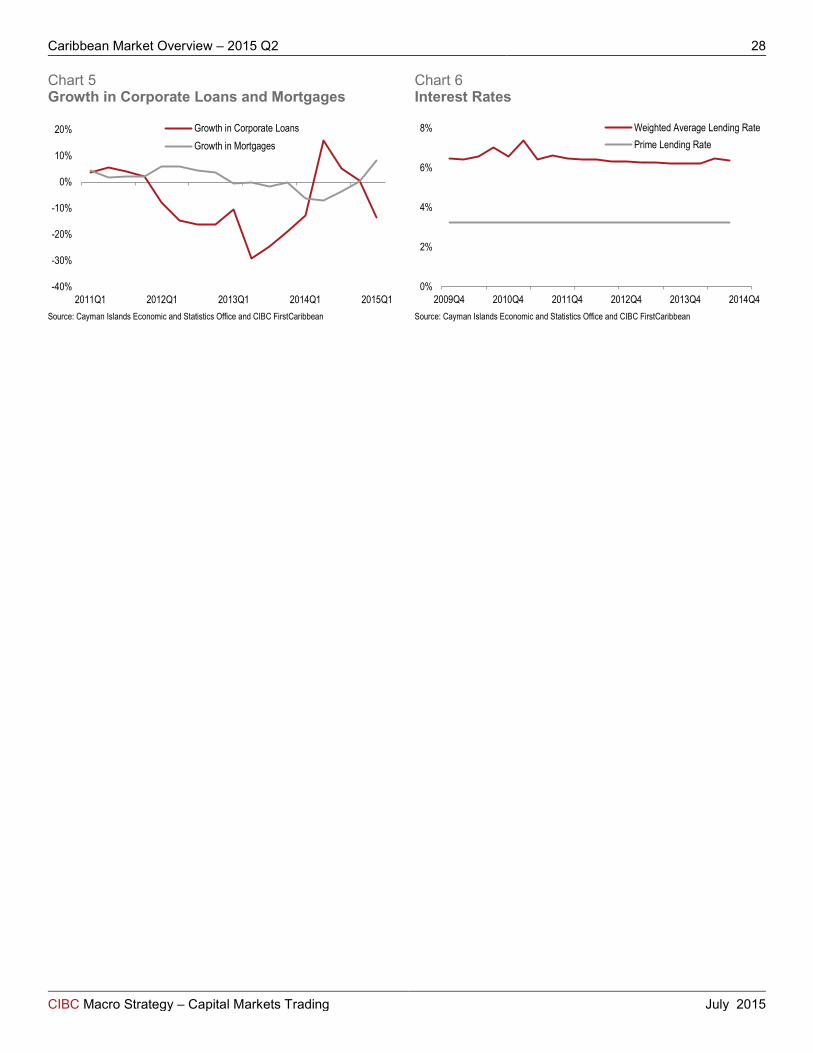
Caribbean Market Overview – 2015 Q2 28
CIBC Macro Strategy – Capital Markets Trading July 2015
Chart 5 Growth in Corporate Loans and Mortgages
Chart 6 Interest Rates
Source: Cayman Islands Economic and Statistics Office and CIBC FirstCaribbean Source: Cayman Islands Economic and Statistics Office and CIBC FirstCaribbean
-40%
-30%
-20%
-10%
0%
10%
20%
2011Q1 2012Q1 2013Q1 2014Q1 2015Q1
Growth in Corporate LoansGrowth in Mortgages
0%
2%
4%
6%
8%
2009Q4 2010Q4 2011Q4 2012Q4 2013Q4 2014Q4
Weighted Average Lending RatePrime Lending Rate
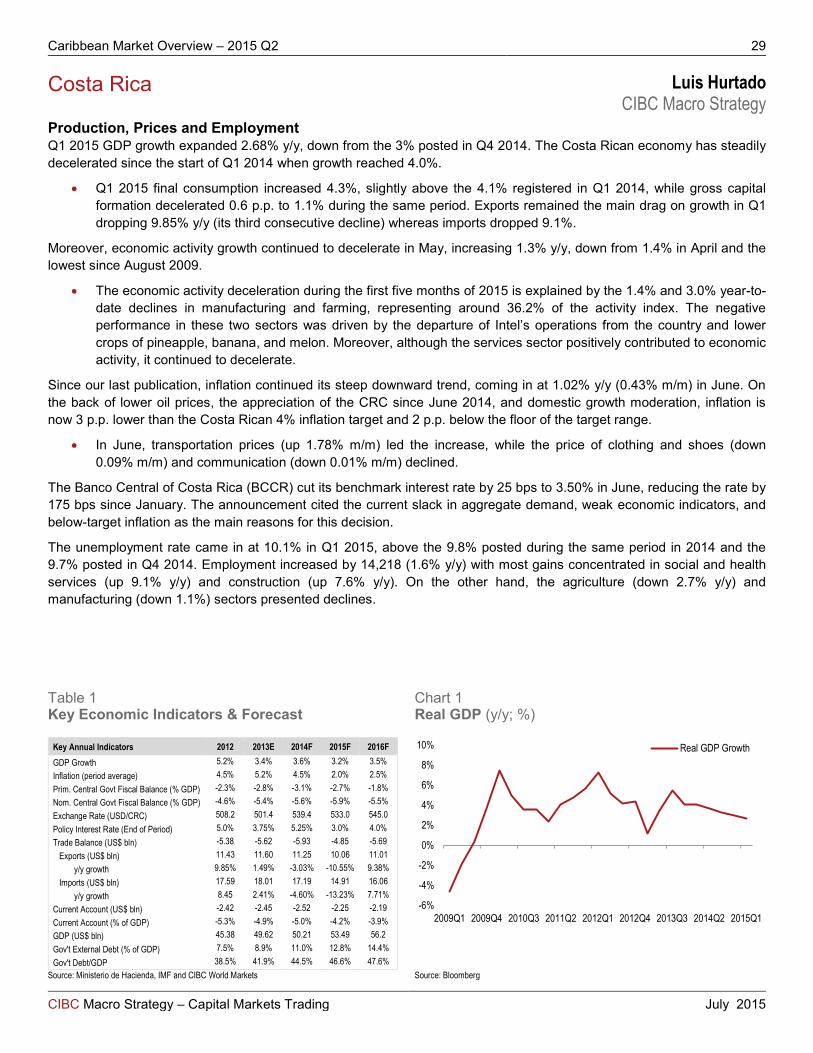
Caribbean Market Overview – 2015 Q2 29
CIBC Macro Strategy – Capital Markets Trading July 2015
Costa Rica Luis Hurtado CIBC Macro Strategy
Production, Prices and Employment Q1 2015 GDP growth expanded 2.68% y/y, down from the 3% posted in Q4 2014. The Costa Rican economy has steadily decelerated since the start of Q1 2014 when growth reached 4.0%.
• Q1 2015 final consumption increased 4.3%, slightly above the 4.1% registered in Q1 2014, while gross capital formation decelerated 0.6 p.p. to 1.1% during the same period. Exports remained the main drag on growth in Q1 dropping 9.85% y/y (its third consecutive decline) whereas imports dropped 9.1%.
Moreover, economic activity growth continued to decelerate in May, increasing 1.3% y/y, down from 1.4% in April and the lowest since August 2009.
• The economic activity deceleration during the first five months of 2015 is explained by the 1.4% and 3.0% year-to-date declines in manufacturing and farming, representing around 36.2% of the activity index. The negative performance in these two sectors was driven by the departure of Intel’s operations from the country and lower crops of pineapple, banana, and melon. Moreover, although the services sector positively contributed to economic activity, it continued to decelerate.
Since our last publication, inflation continued its steep downward trend, coming in at 1.02% y/y (0.43% m/m) in June. On the back of lower oil prices, the appreciation of the CRC since June 2014, and domestic growth moderation, inflation is now 3 p.p. lower than the Costa Rican 4% inflation target and 2 p.p. below the floor of the target range.
• In June, transportation prices (up 1.78% m/m) led the increase, while the price of clothing and shoes (down 0.09% m/m) and communication (down 0.01% m/m) declined.
The Banco Central of Costa Rica (BCCR) cut its benchmark interest rate by 25 bps to 3.50% in June, reducing the rate by 175 bps since January. The announcement cited the current slack in aggregate demand, weak economic indicators, and below-target inflation as the main reasons for this decision.
The unemployment rate came in at 10.1% in Q1 2015, above the 9.8% posted during the same period in 2014 and the 9.7% posted in Q4 2014. Employment increased by 14,218 (1.6% y/y) with most gains concentrated in social and health services (up 9.1% y/y) and construction (up 7.6% y/y). On the other hand, the agriculture (down 2.7% y/y) and manufacturing (down 1.1%) sectors presented declines.
Table 1 Key Economic Indicators & Forecast
Chart 1 Real GDP (y/y; %)
Key Annual Indicators 2012 2013E 2014F 2015F 2016F GDP Growth 5.2% 3.4% 3.6% 3.2% 3.5% Inflation (period average) 4.5% 5.2% 4.5% 2.0% 2.5% Prim. Central Govt Fiscal Balance (% GDP) -2.3% -2.8% -3.1% -2.7% -1.8% Nom. Central Govt Fiscal Balance (% GDP) -4.6% -5.4% -5.6% -5.9% -5.5% Exchange Rate (USD/CRC) 508.2 501.4 539.4 533.0 545.0 Policy Interest Rate (End of Period) 5.0% 3.75% 5.25% 3.0% 4.0% Trade Balance (US$ bln) -5.38 -5.62 -5.93 -4.85 -5.69 Exports (US$ bln) 11.43 11.60 11.25 10.06 11.01 y/y growth 9.85% 1.49% -3.03% -10.55% 9.38% Imports (US$ bln) 17.59 18.01 17.19 14.91 16.06 y/y growth 8.45 2.41% -4.60% -13.23% 7.71% Current Account (US$ bln) -2.42 -2.45 -2.52 -2.25 -2.19 Current Account (% of GDP) -5.3% -4.9% -5.0% -4.2% -3.9% GDP (US$ bln) 45.38 49.62 50.21 53.49 56.2 Gov't External Debt (% of GDP) 7.5% 8.9% 11.0% 12.8% 14.4% Gov't Debt/GDP 38.5% 41.9% 44.5% 46.6% 47.6%
Source: Ministerio de Hacienda, IMF and CIBC World Markets Source: Bloomberg
-6%
-4%
-2%
0%
2%
4%
6%
8%
10%
2009Q1 2009Q4 2010Q3 2011Q2 2012Q1 2012Q4 2013Q3 2014Q2 2015Q1
Real GDP Growth

Caribbean Market Overview – 2015 Q2 30
CIBC Macro Strategy – Capital Markets Trading July 2015
Developments in Financial Markets The monetary base increased by CRC19.2 billion in May, supported by the central bank’s net purchase of USD and the government’s withdrawal of deposits in local currency. Furthermore, total liquidity in the financial system increased 10.7% or around 0.5 p.p. above the growth rate registered in May 2014, while private sector credit grew 11.6% y/y (15.2% in May 2014) with credit in CRC and USD increasing by 12.9% y/y (17.4% in May 2014) and 9.9% y/y (12.3% in May 2014).
In the first 6 months of 2015, USD/CRC (538 at the end of June) presented a relative stability with a tendency towards the downside, similar to the trend experienced in H2 2014 and below the high of 552.5 in May 2014. This stability was a result of a combination of factors, in particular the private sector FX operating surplus of US$1.6 billion (as of June 16), the US$1.0 billion sovereign debt issued in March, and lower oil prices. Subsequently, international reserves increased from US$7.2 billion in December 2014 to US$8.7 billion in June 2015.
Government Debt Costa Rican fiscal accounts continued to deteriorate as central government spending increased 4.5% y/y in May while revenues decreased 1.4%. The central government salary expense increased 4.5% y/y in May, while government transfers jumped 9.8% y/y. On a positive note, income tax revenue increased 13.8% y/y in May, accumulating a year-to-date gain of 18.1% with respect to the same period last year. With these numbers, 2015 central government accumulated nominal deficit widened 0.4 p.p. to 2.3% of GDP, while the primary deficit increased by the same amount to 1.4% of GDP.
Following the IMF’s recommendation of a permanent improvement in the primary balance of around 3.75% of GDP, the government announced two major revenue measures late in 2014. These measures included converting the sales tax into a VAT, a reform to expand the VAT base to include services, and an income tax bill that establishes a 30% tax on medium/large companies and taxes of 10% to 30% for small companies and individuals depending on their tax bracket. Nevertheless, the opposition took control of congress in May after an alliance was formed to block the proposed revenue bills without any reduction in government spending. Moreover, the opposition now holds 35 out of the 57 votes in congress (61.4%), thus, controlling the bill discussion agenda. In the most optimistic scenario, congress would discuss these measures in Q4 2015 and introduce them in early 2016. Having said that, the government is expected to face further financing challenges in 2016 and delay its plans towards fiscal sustainability.
Outlook As growth prospects moderate, we expect GDP to rise by 3.2% in 2015 with growth increasing to an average of 4% for the 2016–2019 period. With fiscal consolidation of around 2.2% of GDP over the medium term but with some delays this year, we see central government deficit increasing to 5.9% of GDP in 2015 with the public debt ratio moving closer to 51% of GDP by 2019. Moreover, we expect inflation to come in well below the 4% target as crude prices decline and aggregate demand pressures remain calmed. Nevertheless, the persistence of large fiscal deficits and the government’s inaction could worsen Costa Rica’s vulnerabilities to sudden changes in financial market sentiment this year.
Chart 2 Inflation (y/y; %)
Chart 3 Government Debt and Deficits
Source: Central Bank of Costa Rica Source: IMF, CIBC World Markets
0%
1%
2%
3%
4%
5%
6%
7%
Dec-09 Aug-10 Apr-11 Dec-11 Aug-12 Apr-13 Dec-13 Aug-14 Apr-15
CPI Inflation
25%
30%
35%
40%
45%
50%
-6%
-5%
-4%
-3%
-2%
-1%
0%
1%
2002 2004 2006 2008 2010 2012 2014E 2016F
Nominal Gov. Bal. (% GDP, L)Govt Debt (% GDP, R)

Caribbean Market Overview – 2015 Q2 31
CIBC Macro Strategy – Capital Markets Trading July 2015
Curaçao Shane Lowe CIBC FirstCaribbean International Bank
Production, Prices and Employment The Centrale Bank van Curaçao en Sint Maarten reports that despite greater output in tourism and manufacturing, real economic activity contracted 0.3% during 2014 after falling 0.8% during the previous year.
• Despite a reduction in the level of refining and ship repair activities, manufacturing output benefitted from additional trading activities by the Isla refinery during January–December 2014. Also, a 2.5% increase in stay-over tourist arrivals and 6.8% more cruise visitors boosted real economic value-added in tourism during 2014. Since then, stay-over arrivals have expanded 10.3% during the first four months of 2015, with more visitors from the USA (up 21.6%), Canada (up 27.4%), Europe (up 2.1%), and other markets (up 14.2%). However, the number of cruise passenger arrivals plunged 10.4% over the same period one year earlier.
• In contrast, output in wholesale and retail trade, construction, financial intermediation, and transport, storage and communication declined over the full calendar year. Despite higher tourist expenditure, lower domestic demand and activities in the free-zone area reduced wholesale and retail trade, while use of imported pre-fabricated construction materials in local building projects hampered growth in construction value-added. Meanwhile, declining net interest income and lower operational spending suggested reduced output in domestic and international financial services, while fewer transit airport passengers and commercial landings lowered output in transport, storage and communication.
Between April 2014 and 2015, average consumer prices fell 0.2%. However, the price of food increased 4.8% over the same period.
Developments in Financial Markets On September 1, 2014, the Centrale Bank van Curaçao en Sint Maarten lifted lending restrictions put in place on March 14, 2012 to protect the international reserves. While net official reserves are now US$1,812.5 million at April 2015, 27.9% higher y/y, credit growth remains weak.
• Total commercial bank loans and advances fell 0.3% during the first four months of 2015 as a 6.4% reduction in loans to nonresidents eclipsed a 0.3% increase in lending to residents. Total retail loans fell 1.2% due to lower balances for both mortgages (down 0.9%) and consumer (down 1.6%) loans, but lending to businesses improved 0.4%.
• Total deposits continue to grow, advancing 1.7% between December 2014 and April 2015. Retail, corporate, and nonresident balances increased 0.2%, 3.4%, and 0.3%.
Chart 1 Key Economic Indicators
Chart 2 Inflation (y/y; %)
Source: Central Bank of Curaçao and St. Maarten, Caribbean Tourism Organization and CIBC FirstCaribbean
Source: Central Bank of Curaçao and St. Maarten and CIBC FirstCaribbean
-40%
-30%
-20%
-10%
0%
10%
20%
30%
-1.0%
-0.5%
0.0%
0.5%
1.0%
2010Q1 2011Q1 2012Q1 2013Q1 2014Q1 2015Q1
Real GDP growth (L)Tourist Arrivals (R)
-4%
-2%
0%
2%
4%
6%
8%
10%
Apr-11 Oct-11 Apr-12 Oct-12 Apr-13 Oct-13 Apr-14 Oct-14 Apr-15
All Items
Food

Caribbean Market Overview – 2015 Q2 32
CIBC Macro Strategy – Capital Markets Trading July 2015
During the first four months of 2015, the average lending rate increased 63 bps to 7.40%, while the deposit rate increased just 2 bps to 1.22%.
Government Debt During 2014, government budget surplus declined to US$8.4 million (0.3% of GDP) from US$46.1 million one year earlier. Lower tax revenues reduced total revenue by US$34.6 million, but tight expenditure restraint limited the increase in spending to US$3.9 million.
Outlook The Centrale Bank van Curaçao en Sint Maarten projects economic growth of 0.3% in 2015 as higher disposable incomes and investments in tourism, transportation, and a new hospital and road infrastructure boost private and public demand for goods and services. However, ongoing fiscal restraint and a projected rise in merchandise and construction imports will likely dampen public consumption and net foreign demand over the 12-month period.
Chart 3 Developments in Credit Market Indicators
Source: Central Bank of Curaçao and St. Maarten and CIBC FirstCaribbean
-5%
0%
5%
10%
15%
20%
2010Q1 2011Q1 2012Q1 2013Q1 2014Q1 2015Q1
Loans
NPLs/Total Loans

Caribbean Market Overview – 2015 Q2 33
CIBC Macro Strategy – Capital Markets Trading July 2015
Dominica Shane Lowe CIBC FirstCaribbean International Bank
Production, Prices and Employment The ECCB estimates that during 2014 real GDP rebounded 2.0% as greater output in tourism, construction, transport, storage and communications, and agriculture eclipsed a marginal decline in manufacturing.
• The ECCB reports that a 6.6% increase in stay-over tourist arrivals and a 24.3% rise in cruise arrivals boosted real tourism value-added by 13.8% during 2014. However, CTO estimates show that since then both stay-over (down 0.8%) and cruise (down 10.0%) visitors declined during the first three months of 2015. Stay-over arrivals from the USA and Europe fell 8.1% and 6.9%, but Canadian and other visitors increased 3.0% and 7.1% over the same period. The improved tourism performance buoyed output in transport, storage and communications by 3.4% during 2014.
• Intensified public sector construction activity eclipsed persistent weakness in private construction, leading to a 5.0% increase in real construction value-added during 2014. Public building benefitted from increased work on housing, water supply and road network projects, but a 25.0% reduction in the number of private construction starts and a 1.3% decline in credit extended for home construction and renovation suggests lower private sector output. Mining and quarrying output improved 2.0%.
• Agriculture output rose 4.3% as growth in nonbanana crops (up 6.5%) and livestock (up 3.0%) outstripped a 20.0% decline in banana production. Fishing output also increased 3.5%, but lower output of soaps (down 4.8%), beverages (down 3.8%), and paints and varnishes (down 3.7%) contributed to a 1.0% decline in manufacturing GDP.
Notwithstanding a 0.8% rise in food and nonalcoholic beverages prices, a 7.9% decline in the price of housing, utilities, and gas and fuels, and a 2.4% drop in transportation prices pushed average consumer prices down 2.5% between March 2014 and 2015.
Public sector employment increased 2.7% during 2014 as increases in temporary (up 15.3%) and contractual (up 4.5%) workers offset a 1.3% contraction in the number of permanent workers.
Developments in Financial Markets During the first two months of 2015, the faster rate of growth in deposits relative to loans exacerbated already high excess liquidity.
• Total loans and advances increased 0.7% between December 2014 and February 2015. Retail and business loans fell 0.1% and 0.5%, only partially mitigating a 10.8% rise in lending to the public sector.
Chart 1 Stay-Over Tourist Arrivals
Chart 2 Inflation (y/y; %)
Source: Eastern Caribbean Central Bank and CIBC FirstCaribbean Source: Eastern Caribbean Central Bank and CIBC FirstCaribbean
68
70
72
74
76
78
80
82
84
$0
$500
$1,000
$1,500
$2,000
$2,500
Mar-11 Sep-11 Mar-12 Sep-12 Mar-13 Sep-13 Mar-14 Sep-14 Mar-15
(000's) (US$/person) Visitor Expenditure/person (L)Stay-Over Arrivals (R)
-10%
-5%
0%
5%
10%
15%
20%
25%
-4%
-2%
0%
2%
4%
6%
8%
2010Q1 2011Q1 2012Q1 2013Q1 2014Q1 2015Q1
All Items (L)Food (L)Fuel and Light (R)
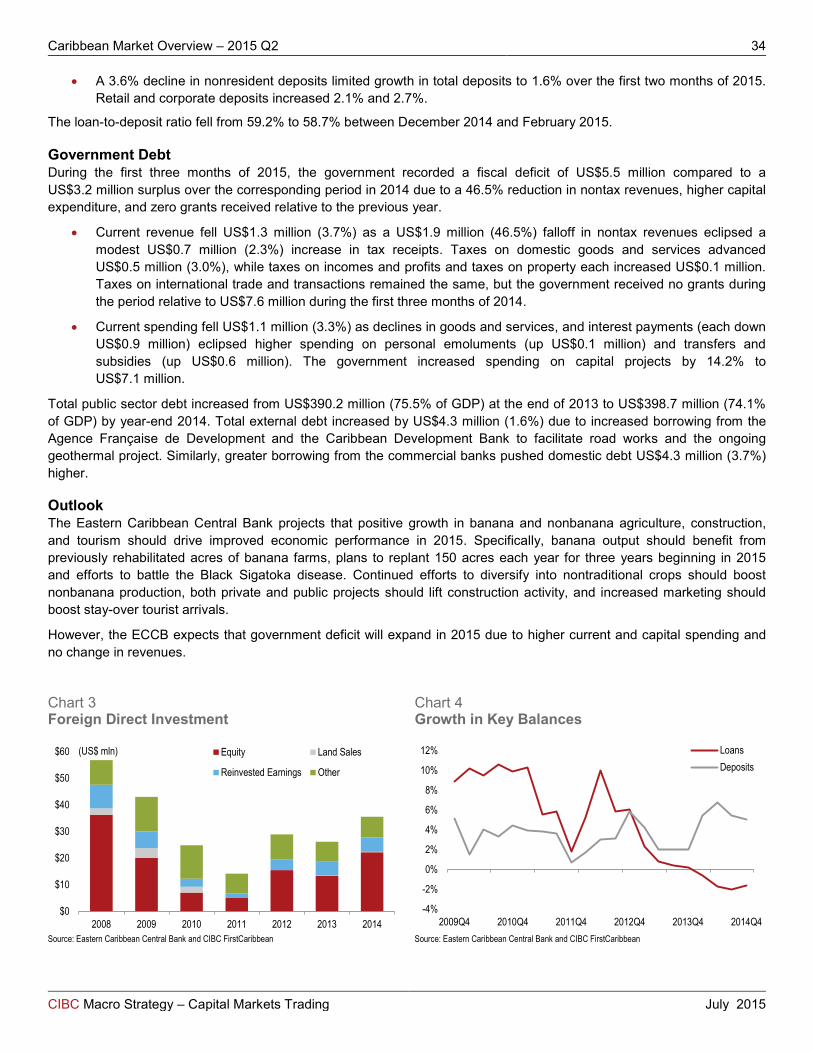
Caribbean Market Overview – 2015 Q2 34
CIBC Macro Strategy – Capital Markets Trading July 2015
• A 3.6% decline in nonresident deposits limited growth in total deposits to 1.6% over the first two months of 2015. Retail and corporate deposits increased 2.1% and 2.7%.
The loan-to-deposit ratio fell from 59.2% to 58.7% between December 2014 and February 2015. Government Debt During the first three months of 2015, the government recorded a fiscal deficit of US$5.5 million compared to a US$3.2 million surplus over the corresponding period in 2014 due to a 46.5% reduction in nontax revenues, higher capital expenditure, and zero grants received relative to the previous year.
• Current revenue fell US$1.3 million (3.7%) as a US$1.9 million (46.5%) falloff in nontax revenues eclipsed a modest US$0.7 million (2.3%) increase in tax receipts. Taxes on domestic goods and services advanced US$0.5 million (3.0%), while taxes on incomes and profits and taxes on property each increased US$0.1 million. Taxes on international trade and transactions remained the same, but the government received no grants during the period relative to US$7.6 million during the first three months of 2014.
• Current spending fell US$1.1 million (3.3%) as declines in goods and services, and interest payments (each down US$0.9 million) eclipsed higher spending on personal emoluments (up US$0.1 million) and transfers and subsidies (up US$0.6 million). The government increased spending on capital projects by 14.2% to US$7.1 million.
Total public sector debt increased from US$390.2 million (75.5% of GDP) at the end of 2013 to US$398.7 million (74.1% of GDP) by year-end 2014. Total external debt increased by US$4.3 million (1.6%) due to increased borrowing from the Agence Française de Development and the Caribbean Development Bank to facilitate road works and the ongoing geothermal project. Similarly, greater borrowing from the commercial banks pushed domestic debt US$4.3 million (3.7%) higher.
Outlook The Eastern Caribbean Central Bank projects that positive growth in banana and nonbanana agriculture, construction, and tourism should drive improved economic performance in 2015. Specifically, banana output should benefit from previously rehabilitated acres of banana farms, plans to replant 150 acres each year for three years beginning in 2015 and efforts to battle the Black Sigatoka disease. Continued efforts to diversify into nontraditional crops should boost nonbanana production, both private and public projects should lift construction activity, and increased marketing should boost stay-over tourist arrivals.
However, the ECCB expects that government deficit will expand in 2015 due to higher current and capital spending and no change in revenues.
Chart 3 Foreign Direct Investment
Chart 4 Growth in Key Balances
Source: Eastern Caribbean Central Bank and CIBC FirstCaribbean Source: Eastern Caribbean Central Bank and CIBC FirstCaribbean
$0
$10
$20
$30
$40
$50
$60
2008 2009 2010 2011 2012 2013 2014
(US$ mln) Equity Land Sales
Reinvested Earnings Other
-4%
-2%
0%
2%
4%
6%
8%
10%
12%
2009Q4 2010Q4 2011Q4 2012Q4 2013Q4 2014Q4
LoansDeposits

Caribbean Market Overview – 2015 Q2 35
CIBC Macro Strategy – Capital Markets Trading July 2015
Dominican Republic John H. Welch CIBC Macro Strategy
Economic growth slowed slightly to 6.2% y/y in Q1 2015 from 6.6% in Q4 2014. As with the rest of the region, the decline in energy prices, as well as the increase in tourism, bode well for both economic activity and fiscal results in 2015. We expect 5.5% growth in 2015 and 4.9% in 2016.
President Danilo Medina (PLD Partido de la Liberación Dominicana) capitalized on his high approval ratings of above 80% to pass a constitution amendment to allow for re-election, with not only the last minute approval of former-president Leonel Fernandez (PLD) but also the once opposition PRD (Partido Revolucionario Dominicano) party. Defections from the PRD and resentment of the move have strengthened the newly formed PRM (Partido Revolucionario Moderno) party under Luis Abinader.
The most important news on the fiscal front was the buyback of PetroCaribe debt by the government. This caused government debt to fall almost 2% of GDP but the cash outlay expanded government deficit as well by about 0.3% of GDP in Q1 2015 and has put off the expected improvement of the primary balance to a significant surplus. However, the overall fiscal situation was improved by the operation.
Fiscal accounts should improve in 2015 with lower energy costs that should have important effects but that have still not shown up explicitly in the numbers. Arrears to the electricity sector that reached DOP758 million do not yet appear in the fiscal accounts. Subsidies allocated through the FETE (Fund for the Stabilization of Electricity Tariffs) that usually comprise about 40% of the subsidies signal a subsidy of a mere 1%. With no large improvement of the primary balance, there is speculation that the government is spending the money on investment. Still, we expect the primary balance to end 2015 at 1.1% of GDP surplus and a nominal deficit of 2.74% because the outlays from the PetroCaribe deal are one-off.
The fall in the current account remains intact, ending 2014 with a deficit of 3.4%, lower than our original 3.9% of GDP forecast and down from 2013’s 5.1%. We expect a mild slowing of GDP growth in 2015 and 2016, a mild widening of the current account deficit, and continued good fiscal performance.
S&P upgraded the Dominican Republic’s credit rating to BB- on May 20, 2015, bringing back the split rating with Fitch at B+ (Moody’s is at Ba2). We expect further upgrades from all three rating agencies over the next six months. We think that DOMREP is at least a BB+/Ba1 credit and more upgrades are overdue.
Table 1 Key Economic Indicators & Forecasts
Chart 1 Real GDP (4qtrs/4qtrs; %)
Key Annual Indicators 2013 2014E 2015F 2016F 2017F GDP Growth 4.1% 6.6% 5.5% 4.9% 4.7% Inflation 3.9% 1.6% 1.1% 1.8% 1.9% Prim. Central Govt Fiscal Balance (% GDP) -0.51 -0.18 0.10 1.10 1.61 Nom. Central Govt Fiscal Balance (% GDP) -2.84 -2.70 -2.74 -1.74 -1.23 Exchange Rate (USD/DOP) 41.4 44.4 48.9 51.3 51.8 Average Interest Rates 15.2 15.2 15.2 15.2 15.2 Trade Balance (US$ bln) -7.4 -7.4 -7.5 -7.8 -8.2 Exports (G&S) 9.4 9.9 10.6 11.2 11.8 y/y growth 5.6 4.6 6.5 6.2 5.5 Imports (G&S) 16.8 17.3 18.0 19.0 20.0 y/y growth -4.9 3.6 4.2 5.5 5.2 Current Account (US$ bln) -3.1 -2.0 -2.2 -2.4 -2.7 Current Account (% of GDP) -5.1 -3.4 -3.8 -4.2 -4.4 GDP (US$ bln) 59.0 59.4 57.6 58.6 61.9 Gov't External Debt 14.9% 16.1% 14.7% 15.9% 15.9% Gov't Debt/GDP 37.9% 37.2% 36.5% 37.8% 39.1% Gov't Ext. Debt/Exports 1.58% 1.62% 1.40% 1.42% 1.35%
Source for Chart 1 and Table 1: Banco Central de DR, GlobalSource and CIBC World Markets
-2%
0%
2%
4%
6%
8%
10%
12%
Mar-05 May-08 Jul-11 Oct-14 Dec-17
Real GDP
Forecast

Caribbean Market Overview – 2015 Q2 36
CIBC Macro Strategy – Capital Markets Trading July 2015
Growth Continues Economic growth slowed slightly to 6.2% y/y in Q1 2015 from 6.6% in Q4 2014. As with the rest of the region, the decline in energy prices as well as the increase in tourism bode well for 2015 for both economic activity and fiscal results. We expect 5.5% growth in 2015 and 4.9% in 2016.
The drop in energy prices continues to keep inflation close to 0%, ending May at 0.23% y/y. We expect inflation to slowly rebound and only expect a mild acceleration to 1.1% in 2015 and to rise slightly in 2016 to 1.8%. After leaving the policy rate at 6.25% since August 2013, the central bank cut to 5.75% in March 2015 followed by three consecutive 25 bp cuts to 5.00% before pausing in June. The massive drop in energy prices gave them solace in cutting.
USD/DOP continues to rise mildly and stands at 45.0 in July after following global USD higher earlier in 2015. Although, USD/DOP is at a competitive level, we expect another run higher on easier monetary policy.
Fiscal Adjustment Continues, Helped By Strong Growth and Lower Energy Prices The Medina administration has continued to position itself as aggressive on electricity subsidies, although these should decline with oil prices. The decline should help fiscal accounts significantly in 2015. However, the buyback of PetroCaribe debt at once decreased government debt by 2% of GDP but increased primary expenditure by 0.3% of GDP. Hence, we have revised down both our debt/GDP forecasts and fiscal balance forecasts for 2015.
Lower energy prices have not yet shown up explicitly in the numbers. Arrears to the electricity sector that reached DOP758 million do not yet appear in the fiscal accounts while subsidies allocated through the FETE (Fund for the Stabilization of Electricity Tariffs, which usually comprise about 40% of the subsidies signal a subsidy of a mere 1%. With no large improvement of the primary balance, there is speculation that the government is spending the money on investment. Still, we expect the primary balance to end 2015 at a now lower 0.1% of GDP surplus and a nominal deficit of 2.74%. Because the outlays from the PetroCaribe deal are one-off, we expect improvement in 2016 to a primary surplus of 1.1% of GDP and nominal deficit of 1.74%.
Government debt fell slightly to 37.2% of GDP in 2014 from 37.9% 2013. The PetroCaribe buyback caused government debt to fall by 2% of GDP – we now expect debt to end 2015 at 36.5% of GDP and 37.6% in 2016.
Tax revenues continue to increase at a slower pace. In the 12 months to April, total tax revenues increased 7.81%, down from the 12% growth of 2014. Total expenditure growth also decelerated to 9.28% in the 12 months to April from 14.76% in 2014, with current expenditure growing 12%, down from 17.34% in 2014. Further gains in deficit reduction will come slowly (Chart 3).
Chart 2 CPI Inflation (y/y; %)
Chart 3 Government Debt and Deficits
Source: Banco Central de DR, GlobalSource and CIBC World Markets Source: Banco Central de DR, GlobalSource and CIBC World Markets
-4%
0%
4%
8%
12%
16%
Jan-06 Sep-07 May-09 Jan-11 Sep-12 May-14 Jan-16 Sep-17
CPI Inflation
Forecast
-50%-40%-30%-20%-10%0%10%20%30%40%50%
-6.00
-4.00
-2.00
0.00
2.00
4.00
6.00
2013 2014E 2015F 2016F 2017F
Nominal Govt Bal. (% GDP, L)Govt Debt (% GDP, R)
Caribbean Market Overview – 2015 Q2 37
CIBC Macro Strategy – Capital Markets Trading July 2015
External Accounts: Persistent Current Account Deficit Improvement The current account gains of recent years remain, with the deficit ending 2014 at 3.4% of GDP, down from 5.1% in 2013. We expect a mild increase in the deficit to 3.8% in 2015 and 4.2% in 2016. The 2014 improvement occurred despite imports growing 3.6% in 2014 while exports expanded 4.6%.
Beyond 2014, we expect growth in exports of goods and services to accelerate, reaching 6.5% in 2015 and 6.2% in 2016. Imports should grow again in 2015 as the economy continues to grow. The combination should keep the DR’s current account deficit below 5% of GDP for the next couple of years.
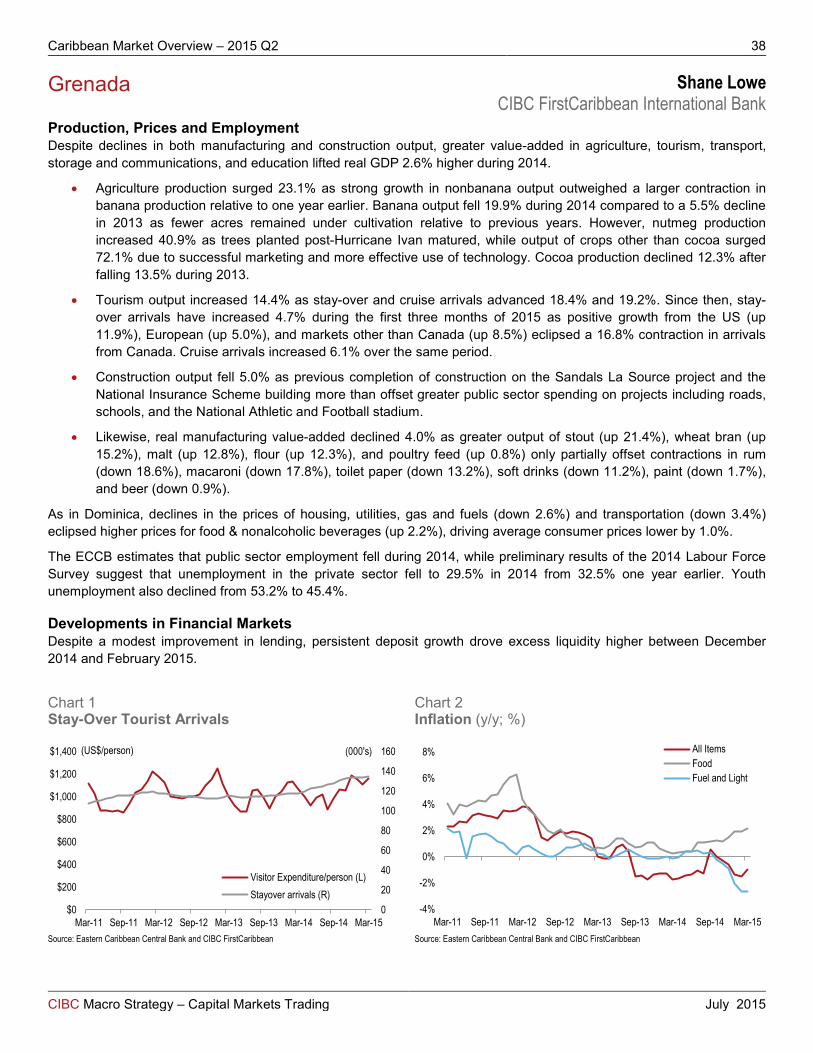
Caribbean Market Overview – 2015 Q2 38
CIBC Macro Strategy – Capital Markets Trading July 2015
Grenada Shane Lowe CIBC FirstCaribbean International Bank
Production, Prices and Employment Despite declines in both manufacturing and construction output, greater value-added in agriculture, tourism, transport, storage and communications, and education lifted real GDP 2.6% higher during 2014.
• Agriculture production surged 23.1% as strong growth in nonbanana output outweighed a larger contraction in banana production relative to one year earlier. Banana output fell 19.9% during 2014 compared to a 5.5% decline in 2013 as fewer acres remained under cultivation relative to previous years. However, nutmeg production increased 40.9% as trees planted post-Hurricane Ivan matured, while output of crops other than cocoa surged 72.1% due to successful marketing and more effective use of technology. Cocoa production declined 12.3% after falling 13.5% during 2013.
• Tourism output increased 14.4% as stay-over and cruise arrivals advanced 18.4% and 19.2%. Since then, stay-over arrivals have increased 4.7% during the first three months of 2015 as positive growth from the US (up 11.9%), European (up 5.0%), and markets other than Canada (up 8.5%) eclipsed a 16.8% contraction in arrivals from Canada. Cruise arrivals increased 6.1% over the same period.
• Construction output fell 5.0% as previous completion of construction on the Sandals La Source project and the National Insurance Scheme building more than offset greater public sector spending on projects including roads, schools, and the National Athletic and Football stadium.
• Likewise, real manufacturing value-added declined 4.0% as greater output of stout (up 21.4%), wheat bran (up 15.2%), malt (up 12.8%), flour (up 12.3%), and poultry feed (up 0.8%) only partially offset contractions in rum (down 18.6%), macaroni (down 17.8%), toilet paper (down 13.2%), soft drinks (down 11.2%), paint (down 1.7%), and beer (down 0.9%).
As in Dominica, declines in the prices of housing, utilities, gas and fuels (down 2.6%) and transportation (down 3.4%) eclipsed higher prices for food & nonalcoholic beverages (up 2.2%), driving average consumer prices lower by 1.0%.
The ECCB estimates that public sector employment fell during 2014, while preliminary results of the 2014 Labour Force Survey suggest that unemployment in the private sector fell to 29.5% in 2014 from 32.5% one year earlier. Youth unemployment also declined from 53.2% to 45.4%.
Developments in Financial Markets Despite a modest improvement in lending, persistent deposit growth drove excess liquidity higher between December 2014 and February 2015.
Chart 1 Stay-Over Tourist Arrivals
Chart 2 Inflation (y/y; %)
Source: Eastern Caribbean Central Bank and CIBC FirstCaribbean Source: Eastern Caribbean Central Bank and CIBC FirstCaribbean
0
20
40
60
80
100
120
140
160
$0
$200
$400
$600
$800
$1,000
$1,200
$1,400
Mar-11 Sep-11 Mar-12 Sep-12 Mar-13 Sep-13 Mar-14 Sep-14 Mar-15
(000's) (US$/person)
Visitor Expenditure/person (L)Stayover arrivals (R)
-4%
-2%
0%
2%
4%
6%
8%
Mar-11 Sep-11 Mar-12 Sep-12 Mar-13 Sep-13 Mar-14 Sep-14 Mar-15
All ItemsFoodFuel and Light
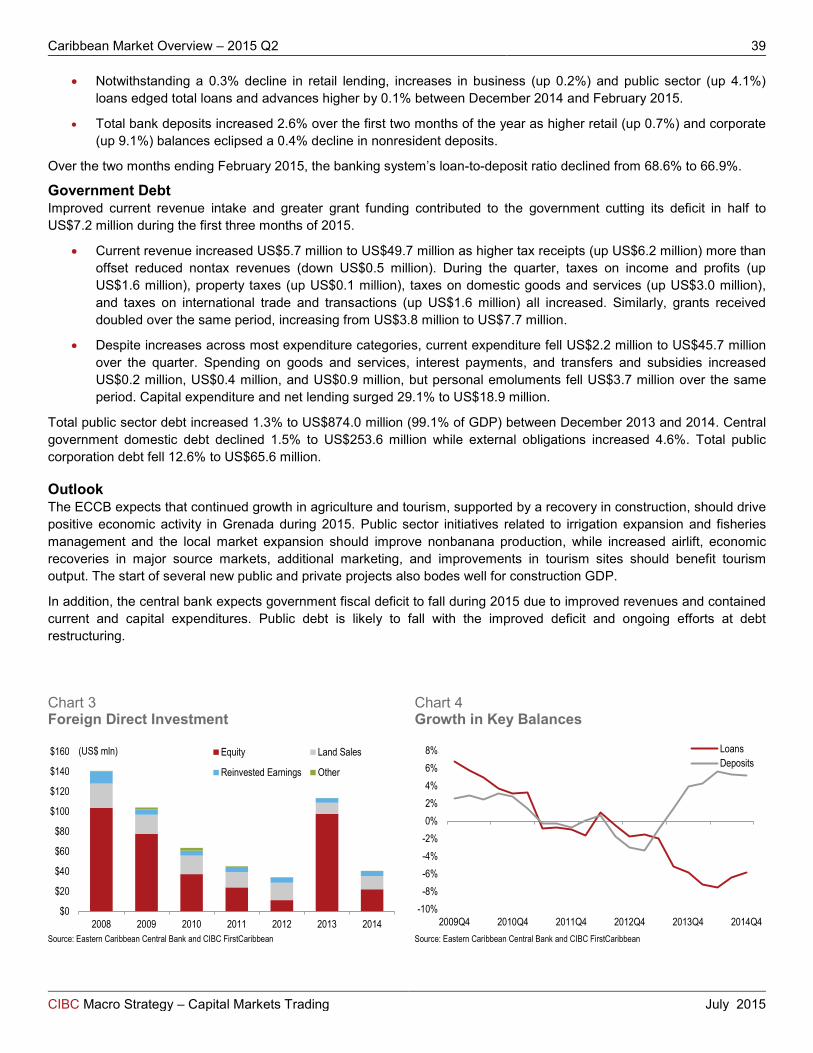
Caribbean Market Overview – 2015 Q2 39
CIBC Macro Strategy – Capital Markets Trading July 2015
• Notwithstanding a 0.3% decline in retail lending, increases in business (up 0.2%) and public sector (up 4.1%) loans edged total loans and advances higher by 0.1% between December 2014 and February 2015.
• Total bank deposits increased 2.6% over the first two months of the year as higher retail (up 0.7%) and corporate (up 9.1%) balances eclipsed a 0.4% decline in nonresident deposits.
Over the two months ending February 2015, the banking system’s loan-to-deposit ratio declined from 68.6% to 66.9%.
Government Debt Improved current revenue intake and greater grant funding contributed to the government cutting its deficit in half to US$7.2 million during the first three months of 2015.
• Current revenue increased US$5.7 million to US$49.7 million as higher tax receipts (up US$6.2 million) more than offset reduced nontax revenues (down US$0.5 million). During the quarter, taxes on income and profits (up US$1.6 million), property taxes (up US$0.1 million), taxes on domestic goods and services (up US$3.0 million), and taxes on international trade and transactions (up US$1.6 million) all increased. Similarly, grants received doubled over the same period, increasing from US$3.8 million to US$7.7 million.
• Despite increases across most expenditure categories, current expenditure fell US$2.2 million to US$45.7 million over the quarter. Spending on goods and services, interest payments, and transfers and subsidies increased US$0.2 million, US$0.4 million, and US$0.9 million, but personal emoluments fell US$3.7 million over the same period. Capital expenditure and net lending surged 29.1% to US$18.9 million.
Total public sector debt increased 1.3% to US$874.0 million (99.1% of GDP) between December 2013 and 2014. Central government domestic debt declined 1.5% to US$253.6 million while external obligations increased 4.6%. Total public corporation debt fell 12.6% to US$65.6 million.
Outlook The ECCB expects that continued growth in agriculture and tourism, supported by a recovery in construction, should drive positive economic activity in Grenada during 2015. Public sector initiatives related to irrigation expansion and fisheries management and the local market expansion should improve nonbanana production, while increased airlift, economic recoveries in major source markets, additional marketing, and improvements in tourism sites should benefit tourism output. The start of several new public and private projects also bodes well for construction GDP.
In addition, the central bank expects government fiscal deficit to fall during 2015 due to improved revenues and contained current and capital expenditures. Public debt is likely to fall with the improved deficit and ongoing efforts at debt restructuring.
Chart 3 Foreign Direct Investment
Chart 4 Growth in Key Balances
Source: Eastern Caribbean Central Bank and CIBC FirstCaribbean Source: Eastern Caribbean Central Bank and CIBC FirstCaribbean
$0
$20
$40
$60
$80
$100
$120
$140
$160
2008 2009 2010 2011 2012 2013 2014
(US$ mln) Equity Land Sales
Reinvested Earnings Other
-10%-8%-6%-4%-2%0%2%4%6%8%
2009Q4 2010Q4 2011Q4 2012Q4 2013Q4 2014Q4
LoansDeposits

Caribbean Market Overview – 2015 Q2 40
CIBC Macro Strategy – Capital Markets Trading July 2015
Jamaica Shane Lowe CIBC FirstCaribbean International Bank
Production, Prices and Employment Preliminary estimates from the Planning Institute of Jamaica suggest that economic activity rebounded marginally by 0.3% during the first three months of 2015.
• Output in the services industry expanded 0.6% due to growth across all sectors except electricity and water supply (down 2.8%) and government services (down 0.2%). Specifically, real value-added in transport, storage and communication benefitted from higher cruise and stay-over tourist arrivals and expansion in mobile data subscriptions, but electricity and water supply likely suffered from more conservative use of electricity and lower rainfall levels relative to prior year.
• Further, the Bank of Jamaica (BoJ) estimates that output in tourism increased between 3.5% and 4.5% during the first quarter of the year. Data from the Jamaica Tourist Board suggest that during the first four months of 2015, stay-over and cruise arrivals increased 4.9% and 11.2%. Stay-over arrivals from the USA, UK, and Latin America increased 9.1%, 9.1%, and 2.6%, but the number of passengers travelling from Canada and the Caribbean declined by 5.3% and 0.2%.
• Real economic value-added from the goods-producing sectors contracted 0.7% during January–March 2015 as weak performance in manufacturing (down 3.1%) outweighed positive growth in construction (up 1.4%) and mining and quarrying (up 0.2%). The BoJ reports that manufacturing production suffered from maintenance-related stoppages in petroleum refining and reduced sugar processing, but greater infrastructure and hotel construction activities and increases in alumina and crude bauxite production boosted activity in construction, and mining, and quarrying.
The 12-month rate of increase in consumer prices slowed to 3.9% by May 2015 relative to 8.1% one year earlier due to lower prices for housing, water, gas, electricity, and other fuels (down 10.4%) and slower exchange rate depreciation.
Data from the Statistical Institute of Jamaica suggest that the average unemployment rate increased from 13.4% at January 2014 to 14.2% 12 months later. Further, while unemployment among teenagers fell modestly from 41.8% to 41.0%, the percentage of persons unemployed in the 20–24 and 25–34 age groups increased from 31.4% and 16.0% to 33.0% and 16.8% over the same period.
Developments in Financial Markets Despite slowing deposit growth and rising demand for personal loans, market interest rates continue to trend downward as liquidity conditions generally improve. Further, improving foreign exchange buffers and lower crude oil prices have slowed the rate of exchange rate depreciation.
• During the first three months of 2015, total banking sector loans increased 0.3% as higher retail balances (up 1.6%) more than offset a 1.7% decline in corporate loans. Consumer loans, mortgages, and public sector lending advanced 1.9%, 1.3%, and 3.1%, but loans outstanding to businesses fell 2.4%.
• Total deposits fell 0.7% between December 2014 and March 2015, with growth in retail balances (up 2.0%) eclipsing declines in corporate (down 2.9%) and nonresident (down 1.1%) deposits.
• Over the period December 2014 to March 2015, the yields on 1-month, 3-month and 6-month Treasury bills declined from 6.38%, 6.96%, and 7.14% to 6.30%, 6.73%, and 7.00%. Similarly, average commercial bank lending and deposit rates declined 9 bps and 95 bps to 17.10% and 1.69% over the same period.
• The JMD/USD exchange rate depreciated 4.3% to J$116.98 between June 2014 and 2015 compared to 10.7% over the same period one year earlier. Over the 12 months ended June 2015, the BoJ’s net international reserves improved US$740 million to US$2.1 billion, equivalent to 19.8 weeks of goods and services import cover.
Commercial bank nonperforming loans remained at 4.9% of total gross loans between December 2014 and March 2015. Meanwhile, bank capital adequacy ratio remained above the regulatory requirement of 10%, declining marginally from 14.5% to 14.1% over the same period.

Caribbean Market Overview – 2015 Q2 41
CIBC Macro Strategy – Capital Markets Trading July 2015
Government Debt Overall, Jamaica continues to meet most IMF-agreed benchmarks. In May and June 2015, Moody’s and S&P upgraded Jamaica’s sovereign debt rating from Caa3 and B- to Caa2 and B.
Preliminary data from the Ministry of Finance suggest that government fiscal deficit contracted US$14.7 million (12.9%) to US$99.8 million during April–May 2015 compared to the performance registered one year earlier and fell US$43.2 million relative to the budgeted outturn.
• Total revenue and grants advanced US$36.6 million y/y to US$526.7 million as higher tax receipts (up US$51.7 million) eclipsed lower nontax (down US$14.9 million) and capital (down US$0.2 million) revenues. Taxes on production and consumption, and international trade increased US$52.0 million and US$20.9 million, but receipts from taxes on income and profits declined US$21.2 million. Grants received remained unchanged at US$1.5 million.
• Total recurrent expenditure declined US$6.4 million y/y to US$556.9 million as higher spending on programs (up US$42.8 million) only partially offset declines in wages and salaries (down US$27.5 million), and interest payments (down US$21.8 million). Capital expenditure surged US$28.3 million to US$69.6 million.
The IMF estimates that total public sector debt declined from 141.6% of GDP at the end of March 2014 to approximately 136.9% of GDP one year later. Government direct debt fell marginally from 124.2% of GDP to 122.7% of GDP over the same period.
Outlook The IMF now projects that lower crude oil prices, improvements in the business environment and confidence, and recovery from the previous year’s drought should drive economic growth of 1.9% during 2015/16. Additionally, the central bank has maintained its annual inflation forecast of 5.5%–7.5% over 2015/16 as a projected uptick in commodity prices during the latter half of the year offsets lower price increases over the first half of the period.
Chart 1 Key Economic Indicators
Chart 2 Inflation (y/y; %)
Source: Planning Institute of Jamaica, Bank of Jamaica, Caribbean Tourism Organization and CIBC FirstCaribbean
Source: Bank of Jamaica and CIBC FirstCaribbean
-15%
-10%
-5%
0%
5%
10%
15%
20%
-4%
-3%
-2%
-1%
0%
1%
2%
3%
2010Q1 2011Q1 2012Q1 2013Q1 2014Q1 2015Q1
Real GDP Growth (L)Tourist Arrivals (R)Unemployment Rate (R) -10%
0%
10%
20%
30%
40%
May-10 Nov-10 May-11 Nov-11 May-12 Nov-12 May-13 Nov-13 May-14 Nov-14 May-15
All ItemsFoodHousing, Utilities & Other Fuels
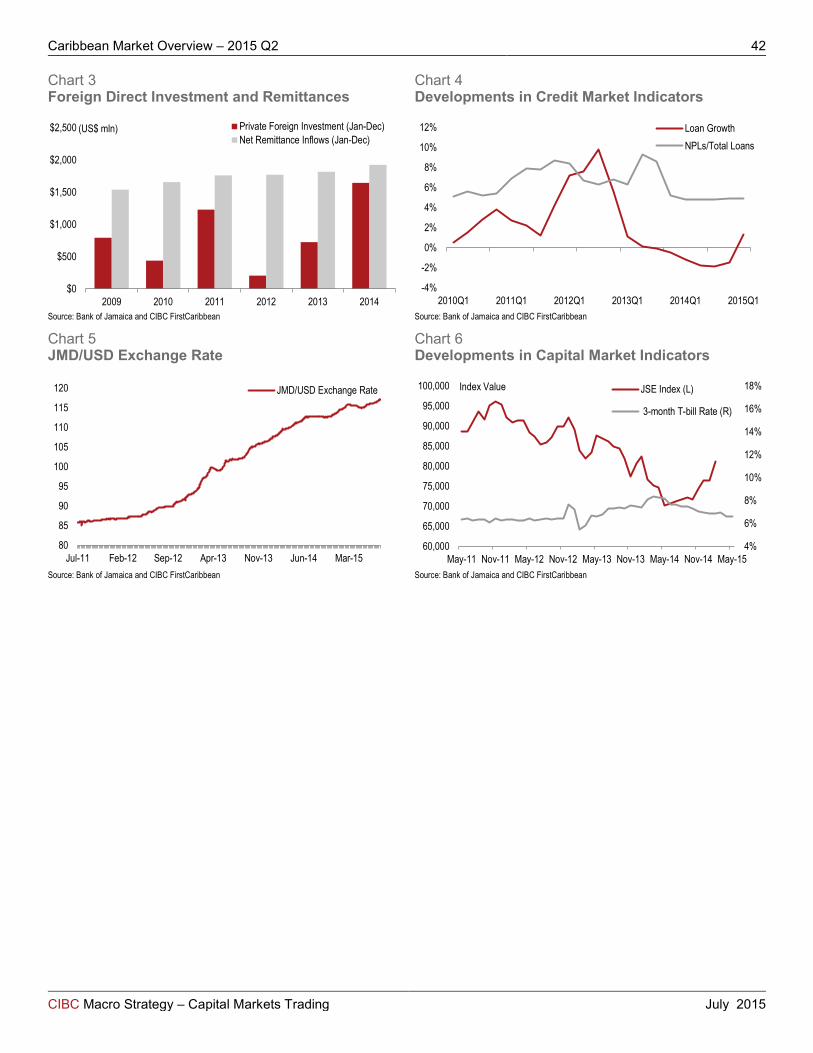
Caribbean Market Overview – 2015 Q2 42
CIBC Macro Strategy – Capital Markets Trading July 2015
Chart 3 Foreign Direct Investment and Remittances
Chart 4 Developments in Credit Market Indicators
Source: Bank of Jamaica and CIBC FirstCaribbean Source: Bank of Jamaica and CIBC FirstCaribbean
Chart 5 JMD/USD Exchange Rate
Chart 6 Developments in Capital Market Indicators
Source: Bank of Jamaica and CIBC FirstCaribbean Source: Bank of Jamaica and CIBC FirstCaribbean
$0
$500
$1,000
$1,500
$2,000
$2,500
2009 2010 2011 2012 2013 2014
(US$ mln) Private Foreign Investment (Jan-Dec)Net Remittance Inflows (Jan-Dec)
-4%
-2%
0%
2%
4%
6%
8%
10%
12%
2010Q1 2011Q1 2012Q1 2013Q1 2014Q1 2015Q1
Loan GrowthNPLs/Total Loans
80
85
90
95
100
105
110
115
120
Jul-11 Feb-12 Sep-12 Apr-13 Nov-13 Jun-14 Mar-15
JMD/USD Exchange Rate
4%
6%
8%
10%
12%
14%
16%
18%
60,000
65,000
70,000
75,000
80,000
85,000
90,000
95,000
100,000
May-11 Nov-11 May-12 Nov-12 May-13 Nov-13 May-14 Nov-14 May-15
Index Value JSE Index (L)
3-month T-bill Rate (R)
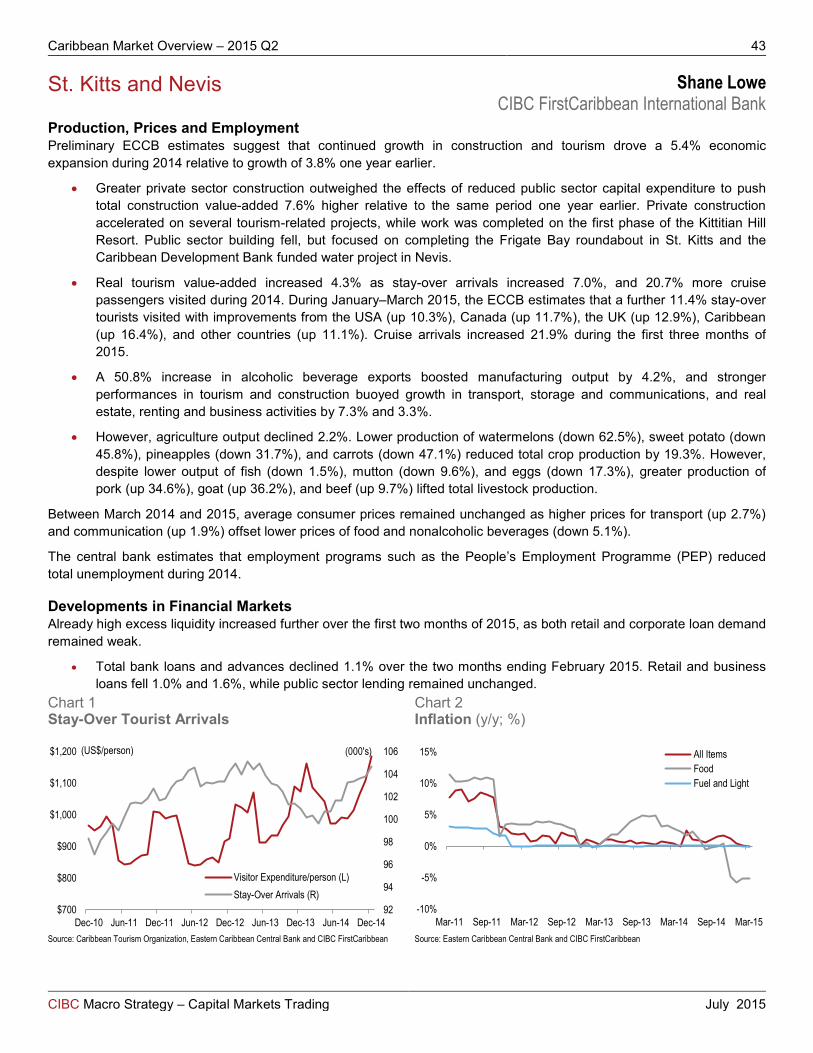
Caribbean Market Overview – 2015 Q2 43
CIBC Macro Strategy – Capital Markets Trading July 2015
St. Kitts and Nevis Shane Lowe CIBC FirstCaribbean International Bank
Production, Prices and Employment Preliminary ECCB estimates suggest that continued growth in construction and tourism drove a 5.4% economic expansion during 2014 relative to growth of 3.8% one year earlier.
• Greater private sector construction outweighed the effects of reduced public sector capital expenditure to push total construction value-added 7.6% higher relative to the same period one year earlier. Private construction accelerated on several tourism-related projects, while work was completed on the first phase of the Kittitian Hill Resort. Public sector building fell, but focused on completing the Frigate Bay roundabout in St. Kitts and the Caribbean Development Bank funded water project in Nevis.
• Real tourism value-added increased 4.3% as stay-over arrivals increased 7.0%, and 20.7% more cruise passengers visited during 2014. During January–March 2015, the ECCB estimates that a further 11.4% stay-over tourists visited with improvements from the USA (up 10.3%), Canada (up 11.7%), the UK (up 12.9%), Caribbean (up 16.4%), and other countries (up 11.1%). Cruise arrivals increased 21.9% during the first three months of 2015.
• A 50.8% increase in alcoholic beverage exports boosted manufacturing output by 4.2%, and stronger performances in tourism and construction buoyed growth in transport, storage and communications, and real estate, renting and business activities by 7.3% and 3.3%.
• However, agriculture output declined 2.2%. Lower production of watermelons (down 62.5%), sweet potato (down 45.8%), pineapples (down 31.7%), and carrots (down 47.1%) reduced total crop production by 19.3%. However, despite lower output of fish (down 1.5%), mutton (down 9.6%), and eggs (down 17.3%), greater production of pork (up 34.6%), goat (up 36.2%), and beef (up 9.7%) lifted total livestock production.
Between March 2014 and 2015, average consumer prices remained unchanged as higher prices for transport (up 2.7%) and communication (up 1.9%) offset lower prices of food and nonalcoholic beverages (down 5.1%).
The central bank estimates that employment programs such as the People’s Employment Programme (PEP) reduced total unemployment during 2014.
Developments in Financial Markets Already high excess liquidity increased further over the first two months of 2015, as both retail and corporate loan demand remained weak.
• Total bank loans and advances declined 1.1% over the two months ending February 2015. Retail and business loans fell 1.0% and 1.6%, while public sector lending remained unchanged.
Chart 1 Stay-Over Tourist Arrivals
Chart 2 Inflation (y/y; %)
Source: Caribbean Tourism Organization, Eastern Caribbean Central Bank and CIBC FirstCaribbean Source: Eastern Caribbean Central Bank and CIBC FirstCaribbean
92
94
96
98
100
102
104
106
$700
$800
$900
$1,000
$1,100
$1,200
Dec-10 Jun-11 Dec-11 Jun-12 Dec-12 Jun-13 Dec-13 Jun-14 Dec-14
(000's) (US$/person)
Visitor Expenditure/person (L)Stay-Over Arrivals (R)
-10%
-5%
0%
5%
10%
15%
Mar-11 Sep-11 Mar-12 Sep-12 Mar-13 Sep-13 Mar-14 Sep-14 Mar-15
All ItemsFoodFuel and Light

Caribbean Market Overview – 2015 Q2 44
CIBC Macro Strategy – Capital Markets Trading July 2015
• Bank deposits advanced 2.8% between December 2014 and February 2015 due to increases in retail (up 2.4%), corporate (up 2.9%), and nonresident (up 3.1%) balances.
The loan-to-deposit ratio moved from 35.8% to 34.5% over the two months ending February 2015.
Government Debt Continued growth in nontax revenues boosted government fiscal surplus by US$22.1 million to US$38.8 million during January–March 2015 relative to the same period in 2014.
• Current revenues expanded US$27.2 million to US$94.6 million, as a US$8.1 million (19.9%) increase in tax receipts supported a US$19.1 (72.1%) surge in nontax revenues. Taxes on income and profits, property taxes, and taxes on international trade and transactions increased US$4.5 million, US$0.5 million, and US$3.3 million, eclipsing a modest US$0.1 million fall in taxes on domestic goods and services. Capital revenue increased US$1.8 million to US$2.5 million, but grants received contracted US$2.4 million to US$1.9 million.
• Current spending fell just US$0.1 million to US$48.0 million as lower outlays on goods and services (down US$0.9 million), interest payments (down US$0.1 million), and transfers and subsidies (down US$0.2 million) offset higher spending on personal emoluments (up US$1.1 million). Capital expenditure and net lending increased 64.2% to US$12.1 million.
Between December 2013 and 2014, outstanding public sector debt fell from US$790.8 million (102.1% of GDP) to US$650.1 million (78.0% of GDP). Ongoing debt restructuring reduced domestic debt by 22.3% to US$366.0 million, while external obligations fell 11.2% to US$284.1 million.
Outlook The IMF expects the economy to expand by 4.5% during 2015. The ECCB suggests that sustained growth in construction and greater tourist arrivals from major source markets should drive expansion in wholesale and retail trade, transport, storage and communications, and real estate, renting and business activities.
Additionally, the central bank expects that notwithstanding higher tax and nontax revenues, higher current and capital expenditures and lower capital grant receipts are likely to reduce government fiscal deficit during 2015.
Chart 3 Foreign Direct Investment
Chart 4 Growth in Key Balances
Source: Eastern Caribbean Central Bank and CIBC FirstCaribbean Source: Eastern Caribbean Central Bank and CIBC FirstCaribbean
$0
$50
$100
$150
$200
2008 2009 2010 2011 2012 2013 2014
(US$ mln) Equity Land Sales
Reinvested Earnings Other
-30%
-20%
-10%
0%
10%
20%
30%
40%
2009Q4 2010Q4 2011Q4 2012Q4 2013Q4 2014Q4
LoansDeposits

Caribbean Market Overview – 2015 Q2 45
CIBC Macro Strategy – Capital Markets Trading July 2015
St. Lucia Shane Lowe CIBC FirstCaribbean International Bank
Production, Prices and Employment Preliminary ECCB estimates suggest that despite growth in tourism, economic activity in St. Lucia fell by 2.7% in 2014 due to weak construction, manufacturing, and banana output, the third consecutive year of decline.
• A weaker-than-projected rebound in FDI and a 21.0% cut to capital expenditure reduced construction activity by 23.3% during 2014. Public sector activity focused on infrastructure development while private activity included a few residential projects.
• Agriculture output declined 8.9% as a 16.1% rebound in livestock production could only partially mitigate a 26.5% contraction in banana output, as the effects of the Black Sigatoka disease, hurricane Tomas, and the December 2013 floods continue to adversely impact the sector. Similarly, manufacturing production fell 2.1% as food and beverages output contracted and beverages and tobacco exports declined 19.4%.
• 6.1% additional stay-over tourists visited St. Lucia during 2014, driving tourism output 3.2% higher. Further, the CTO reports that stay-over and cruise arrivals advanced an additional 5.2% and 8.9% during the first four months of 2015. Stay-over visitors from the USA, Canada, and markets other than Europe increased 10.6%, 10.2%, and 11.8%, while the number of European tourists declined 7.7%.
As at March 2015, the 12-month rate of consumer inflation declined to -1.0% from 3.7% one year earlier. Higher prices for food and nonalcoholic beverages (up 4.7%), housing, utilities, gas and fuels (up 6.7%), and communication (up 8.8%) could only partially offset lower prices for transportation (down 7.7%), household furnishings, supplies and maintenance, (down 8.1%) and miscellaneous items (down 21.2%).
During 2014, average unemployment increased to 25.8% from 24.9% one year earlier.
Developments in Financial Markets Higher corporate deposits and fragile business lending increased bank excess liquid assets over the first two months of 2015.
• Despite increases in both retail (up 0.2%) and public sector (up 2.2%) lending, a 0.8% decline in business loans reduced total bank loans by 0.2%.
• Total deposits increased 4.8% between December 2014 and February 2015 as higher retail (up 1.6%) and corporate (up 10.0%) balances eclipsed a modest 0.2% decline in nonresident deposits.
Commercial bank loan-to-deposit ratio fell from 109.0% at the end of 2014 to 103.9% two months later.
Chart 1 Stay-Over Tourist Arrivals
Chart 2 Inflation (y/y; %)
Source: Caribbean Tourism Organization, Eastern Caribbean Central Bank and CIBC FirstCaribbean Source: Eastern Caribbean Central Bank and CIBC FirstCaribbean
270
280
290
300
310
320
330
340
350
$700
$800
$900
$1,000
$1,100
$1,200
$1,300
$1,400
$1,500
Apr-11 Oct-11 Apr-12 Oct-12 Apr-13 Oct-13 Apr-14 Oct-14 Apr-15
(000's) (US$/person)
Visitor Expenditure/person (L)Stay-Over Arrivals (R)
-10%
-5%
0%
5%
10%
15%
Mar-11 Sep-11 Mar-12 Sep-12 Mar-13 Sep-13 Mar-14 Sep-14 Mar-15
All ItemsFoodUtilities and Housing
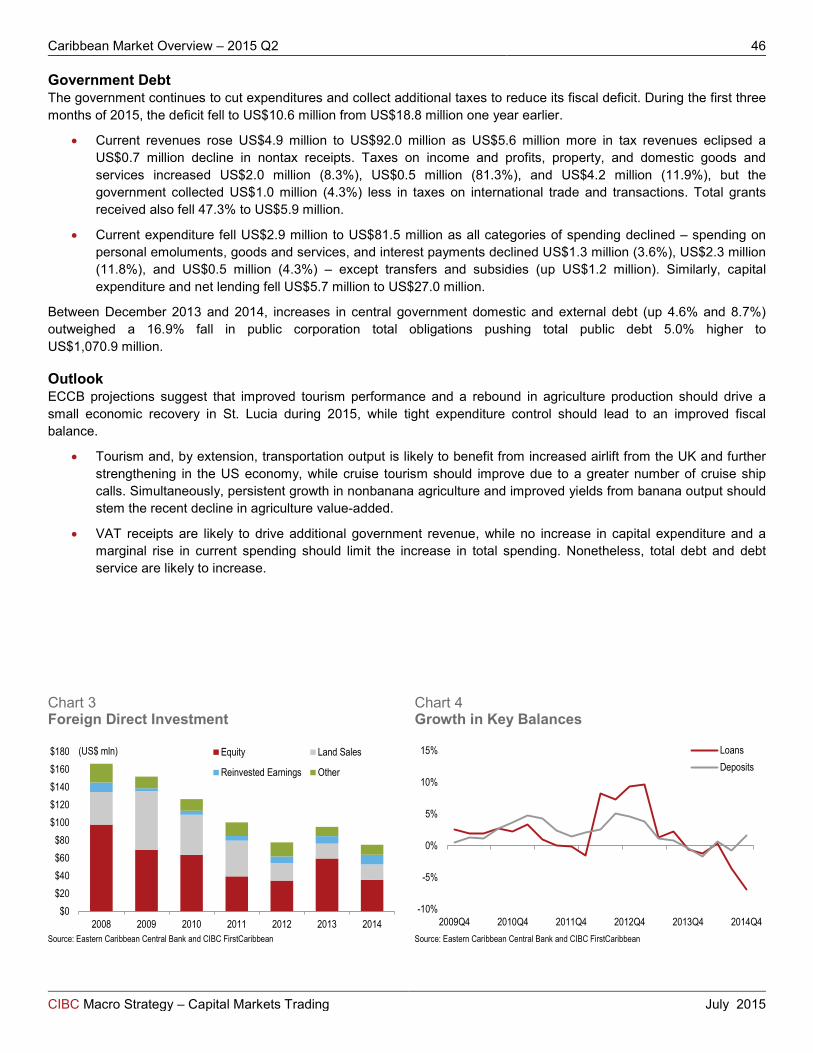
Caribbean Market Overview – 2015 Q2 46
CIBC Macro Strategy – Capital Markets Trading July 2015
Government Debt The government continues to cut expenditures and collect additional taxes to reduce its fiscal deficit. During the first three months of 2015, the deficit fell to US$10.6 million from US$18.8 million one year earlier.
• Current revenues rose US$4.9 million to US$92.0 million as US$5.6 million more in tax revenues eclipsed a US$0.7 million decline in nontax receipts. Taxes on income and profits, property, and domestic goods and services increased US$2.0 million (8.3%), US$0.5 million (81.3%), and US$4.2 million (11.9%), but the government collected US$1.0 million (4.3%) less in taxes on international trade and transactions. Total grants received also fell 47.3% to US$5.9 million.
• Current expenditure fell US$2.9 million to US$81.5 million as all categories of spending declined – spending on personal emoluments, goods and services, and interest payments declined US$1.3 million (3.6%), US$2.3 million (11.8%), and US$0.5 million (4.3%) – except transfers and subsidies (up US$1.2 million). Similarly, capital expenditure and net lending fell US$5.7 million to US$27.0 million.
Between December 2013 and 2014, increases in central government domestic and external debt (up 4.6% and 8.7%) outweighed a 16.9% fall in public corporation total obligations pushing total public debt 5.0% higher to US$1,070.9 million.
Outlook ECCB projections suggest that improved tourism performance and a rebound in agriculture production should drive a small economic recovery in St. Lucia during 2015, while tight expenditure control should lead to an improved fiscal balance.
• Tourism and, by extension, transportation output is likely to benefit from increased airlift from the UK and further strengthening in the US economy, while cruise tourism should improve due to a greater number of cruise ship calls. Simultaneously, persistent growth in nonbanana agriculture and improved yields from banana output should stem the recent decline in agriculture value-added.
• VAT receipts are likely to drive additional government revenue, while no increase in capital expenditure and a marginal rise in current spending should limit the increase in total spending. Nonetheless, total debt and debt service are likely to increase.
Chart 3 Foreign Direct Investment
Chart 4 Growth in Key Balances
Source: Eastern Caribbean Central Bank and CIBC FirstCaribbean Source: Eastern Caribbean Central Bank and CIBC FirstCaribbean
$0$20$40$60$80
$100$120$140$160$180
2008 2009 2010 2011 2012 2013 2014
(US$ mln) Equity Land Sales
Reinvested Earnings Other
-10%
-5%
0%
5%
10%
15%
2009Q4 2010Q4 2011Q4 2012Q4 2013Q4 2014Q4
LoansDeposits

Caribbean Market Overview – 2015 Q2 47
CIBC Macro Strategy – Capital Markets Trading July 2015
Sint Maarten Shane Lowe CIBC FirstCaribbean International Bank
Production, Prices and Employment The Centrale Bank van Curaçao en Sint Maarten estimates that economic growth in Sint Maarten accelerated to 1.7% during 2014 relative to 1.0% one year earlier.
• 7.0% more stay-over tourists and 12.1% more cruise passengers boosted real tourism value-added during 2014. Higher stay-over arrivals reflected improvements in the North American and European economies and new airline routes between the USA and Sint Maarten, while weaker economic conditions in Venezuela limited greater expansion in tourists from South America. Further, additional cruise ship calls and larger vessels boosted the cruise tourism sector during the year. Output in transport, storage and communication, and wholesale and retail trade benefitted from higher tourist traffic and spending.
• Public construction output suffered from delays in government financing, while the number of building permits issued declined, suggesting weaker private investment output. Meanwhile, fewer yacht repairs and declining net interest income reduced output in manufacturing and financial intermediation.
The average consumer inflation rate declined from 2.5% during 2013 to 1.9% one year later. Since then, consumer prices increased 1.5% y/y April 2015.
Developments in Financial Markets (Windward Islands) On September 1, 2014, the Centrale Bank van Curaçao en Sint Maarten lifted lending restrictions put in place on March 14, 2012 to protect the international reserves. While net official reserves had recovered by April 2015, credit demand remains weak.
• Bank total loans and advances fell 0.6% between December 2014 and April 2015. Retail lending declined 0.7% as mortgages expanded 0.5%, but consumer loans declined 2.3%. Corporate loans fell 0.5% due to declines in both business (down 0.5%) and public sector (down 13.0%) loans.
• Total banking sector deposit balances increased 5.3% over the first four months of 2015 as retail, corporate, and nonresident deposits increased 6.1%, 8.6%, and 2.8%.
• The average lending rate increased 63 bps to 7.40% between December 2014 and April 2015, while deposit rates increased just two bps over the same period.
• The Centrale Bank van Curaçao en Sint Maarten’s net official reserves increased 27.9% y/y to US$1,812.5 million by April 2015.
Chart 1 Key Economic Indicators
Chart 2 Inflation (y/y; %)
Source: Caribbean Tourism Organization and CIBC FirstCaribbean Source: Central Bank of Curaçao and St. Maarten and CIBC FirstCaribbean
-8%-6%-4%-2%0%2%4%6%8%
10%
Dec-10 Jun-11 Dec-11 Jun-12 Dec-12 Jun-13 Dec-13 Jun-14 Dec-14
Tourist Arrivals
-15%
-10%
-5%
0%
5%
10%
15%
20%
25%
0%2%4%6%8%
10%12%14%16%18%
Apr-11 Oct-11 Apr-12 Oct-12 Apr-13 Oct-13 Apr-14 Oct-14 Apr-15
All Items (L)Food (L)Energy (R)

Caribbean Market Overview – 2015 Q2 48
CIBC Macro Strategy – Capital Markets Trading July 2015
Government Debt The Sint Maarten Department of Economic Affairs, Transportation and Telecommunication estimates that Sint Maarten’s fiscal operating balance deteriorated from a US$0.3 million surplus (0.03% of GDP) in 2013 to a US$4.6 million deficit (0.43% of GDP) during 2014.
• Total revenues declined US$34.2 million to US$240.3 million as declines in fees and concessions (down US$16.7 million) and miscellaneous income (down US$25.9 million) eclipsed higher collections for tax (up US$5.8 million) and permit (up US$2.5 million) revenues.
• Government expenses fell US$29.4 million to US$244.9 million, primarily due to a US$27.5 million (66.2%) reduction in social services as the government ceased coverage of social security premiums of public workers’ family members. The government also cut spending on goods and services (down US$8.6 million), but spent more on personnel expenses (up US$0.9 million), subsidies (up US$4.5 million), study finance (up US$0.4 million), and interest (up US$0.5 million), while incurring US$0.3 million more in depreciation than it did during 2013.
During 2014, government capital investment increased US$33.6 million to US$42.5 million. Total public debt increased from US$322.0 million at the end of 2013 to US$392.0 million 12 months later.
Outlook The Centrale Bank van Curaçao en Sint Maarten expects that economic recoveries in the USA, the Netherlands, and France should boost output in tourism and transportation during 2015, driving overall economic activity higher by 1.9%. Further, despite lower global commodity prices, the central bank still projects average consumer prices to rise 1.8% due to rising inflation in the country’s major import trading partner – the USA.
Chart 3 Developments in Credit Market Indicators
Source: Central Bank of Curaçao and St. Maarten and CIBC FirstCaribbean
0%
2%
4%
6%
8%
10%
12%
14%
-6%
-4%
-2%
0%
2%
4%
6%
8%
10%
2010Q1 2011Q1 2012Q1 2013Q1 2014Q1 2015Q1
Loan Growth (L)NPLs/Total Loans (R)

Caribbean Market Overview – 2015 Q2 49
CIBC Macro Strategy – Capital Markets Trading July 2015
St. Vincent and the Grenadines Shane Lowe CIBC FirstCaribbean International Bank
Production, Prices and Employment The central bank estimates suggest that lower construction and tourism output reduced total economic value-added by 1.3% during 2014.
• A decelerated pace of construction activity on the Argyle International Airport and stoppage of work on a major tourism project eclipsed growth in private residential construction, pushing total construction value-added 7.4% lower. Consequently, mining and quarrying output contracted 15.0%. Output in agriculture (down 1.7%), wholesale and retail (down 3.5%), electricity and water (down 1.9%), and transport, storage and communications (down 1.4%) also declined.
• Similarly, tourism activity fell 1.7% as 1.4% fewer stay-over visitors travelled to the country during 2014. Since then, stay-over arrivals have shrunk modestly, by 0.1%, during the first four months of 2015, driven by declines in arrivals from the USA (down 0.2%) and markets other than Canada and Europe (down 5.0%). Stay-over arrivals from Canada and Europe increased 3.8% and 3.0%, but total cruise arrivals fell 4.8% over the same period.
• Meanwhile, greater production of feeds (up 7.7%), flour (up 6.4%), and beer (up 7.2%) outweighed a 19.2% reduction in rice output to lift manufacturing real value-added 3.5% higher.
Between March 2014 and 2015, lower prices for housing, utilities, gas and fuels (down 5.8%) and transportation (down 2.0%) outstripped the higher cost of food and nonalcoholic beverages (up 6.3%), pushing consumer prices down by 1.8%.
Developments in Financial Markets Unlike in the other Eastern Caribbean Currency Union markets, commercial bank liquidity declined slightly over the two months ending February 2015 as stronger credit growth outpaced a modest increase in deposit balances.
• Total banking sector loans and advances advanced 1.1% between December 2014 and February 2015 as a modest 0.3% rise in retail loans and a 12.2% surge in lending to the public sector more than offset a 0.9% decline in business loans.
• Total deposits increased just 0.1% over the first two months of 2015. Retail deposits increased 0.3%, nonresident deposits fell 0.6%, and corporate deposits remained unchanged.
The banking system’s loan-to-deposit ratio increased from 68.1% to 68.8%.
Chart 1 Stay-Over Tourist Arrivals
Chart 2 Inflation (y/y; %)
Source: Eastern Caribbean Central Bank and CIBC FirstCaribbean Source: Eastern Caribbean Central Bank and CIBC FirstCaribbean
67 68 69 70 71 72 73 74 75 76 77
$600
$800
$1,000
$1,200
$1,400
$1,600
$1,800
$2,000
Apr-11 Oct-11 Apr-12 Oct-12 Apr-13 Oct-13 Apr-14 Oct-14 Apr-15
(000's) (US$/person)
Visitor Expenditure/person (L)Stay-Over Arrivals (R) -8%
-6%-4%-2%0%2%4%6%8%
10%12%
2010Q1 2011Q1 2012Q1 2013Q1 2014Q1 2015Q1
All ItemsFoodFuel and Light
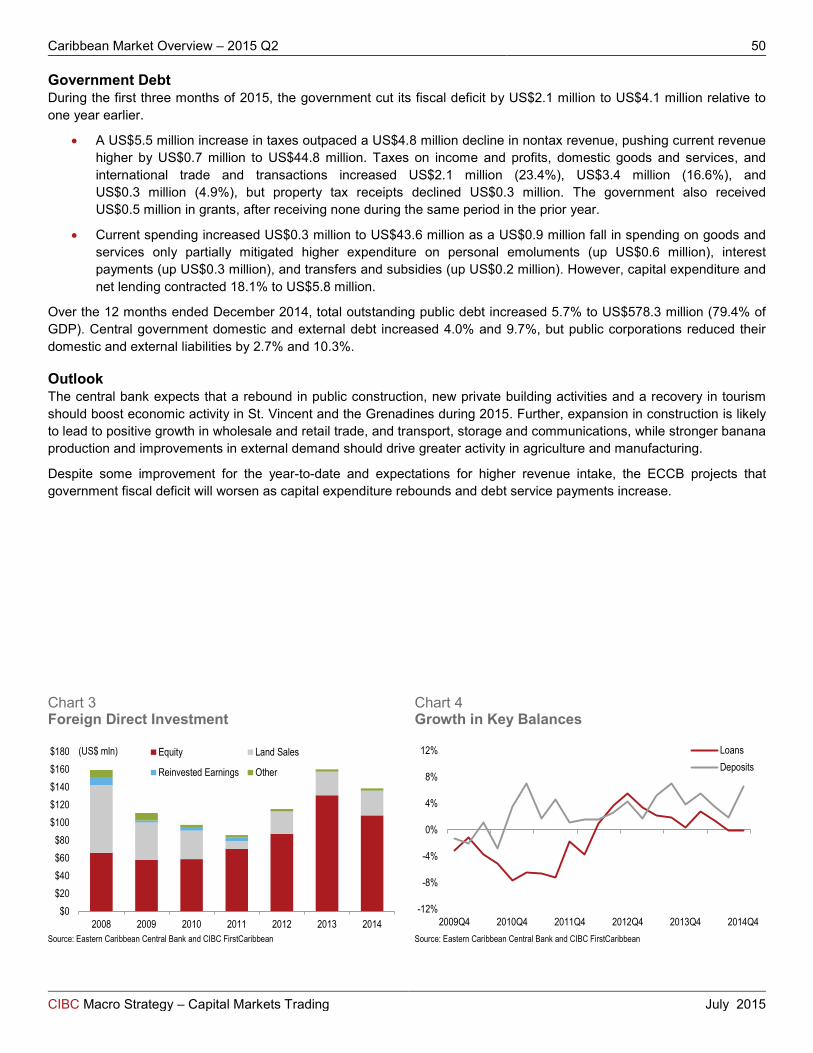
Caribbean Market Overview – 2015 Q2 50
CIBC Macro Strategy – Capital Markets Trading July 2015
Government Debt During the first three months of 2015, the government cut its fiscal deficit by US$2.1 million to US$4.1 million relative to one year earlier.
• A US$5.5 million increase in taxes outpaced a US$4.8 million decline in nontax revenue, pushing current revenue higher by US$0.7 million to US$44.8 million. Taxes on income and profits, domestic goods and services, and international trade and transactions increased US$2.1 million (23.4%), US$3.4 million (16.6%), and US$0.3 million (4.9%), but property tax receipts declined US$0.3 million. The government also received US$0.5 million in grants, after receiving none during the same period in the prior year.
• Current spending increased US$0.3 million to US$43.6 million as a US$0.9 million fall in spending on goods and services only partially mitigated higher expenditure on personal emoluments (up US$0.6 million), interest payments (up US$0.3 million), and transfers and subsidies (up US$0.2 million). However, capital expenditure and net lending contracted 18.1% to US$5.8 million.
Over the 12 months ended December 2014, total outstanding public debt increased 5.7% to US$578.3 million (79.4% of GDP). Central government domestic and external debt increased 4.0% and 9.7%, but public corporations reduced their domestic and external liabilities by 2.7% and 10.3%.
Outlook The central bank expects that a rebound in public construction, new private building activities and a recovery in tourism should boost economic activity in St. Vincent and the Grenadines during 2015. Further, expansion in construction is likely to lead to positive growth in wholesale and retail trade, and transport, storage and communications, while stronger banana production and improvements in external demand should drive greater activity in agriculture and manufacturing.
Despite some improvement for the year-to-date and expectations for higher revenue intake, the ECCB projects that government fiscal deficit will worsen as capital expenditure rebounds and debt service payments increase.
Chart 3 Foreign Direct Investment
Chart 4 Growth in Key Balances
Source: Eastern Caribbean Central Bank and CIBC FirstCaribbean Source: Eastern Caribbean Central Bank and CIBC FirstCaribbean
$0$20$40$60$80
$100$120$140$160$180
2008 2009 2010 2011 2012 2013 2014
(US$ mln) Equity Land Sales
Reinvested Earnings Other
-12%
-8%
-4%
0%
4%
8%
12%
2009Q4 2010Q4 2011Q4 2012Q4 2013Q4 2014Q4
LoansDeposits
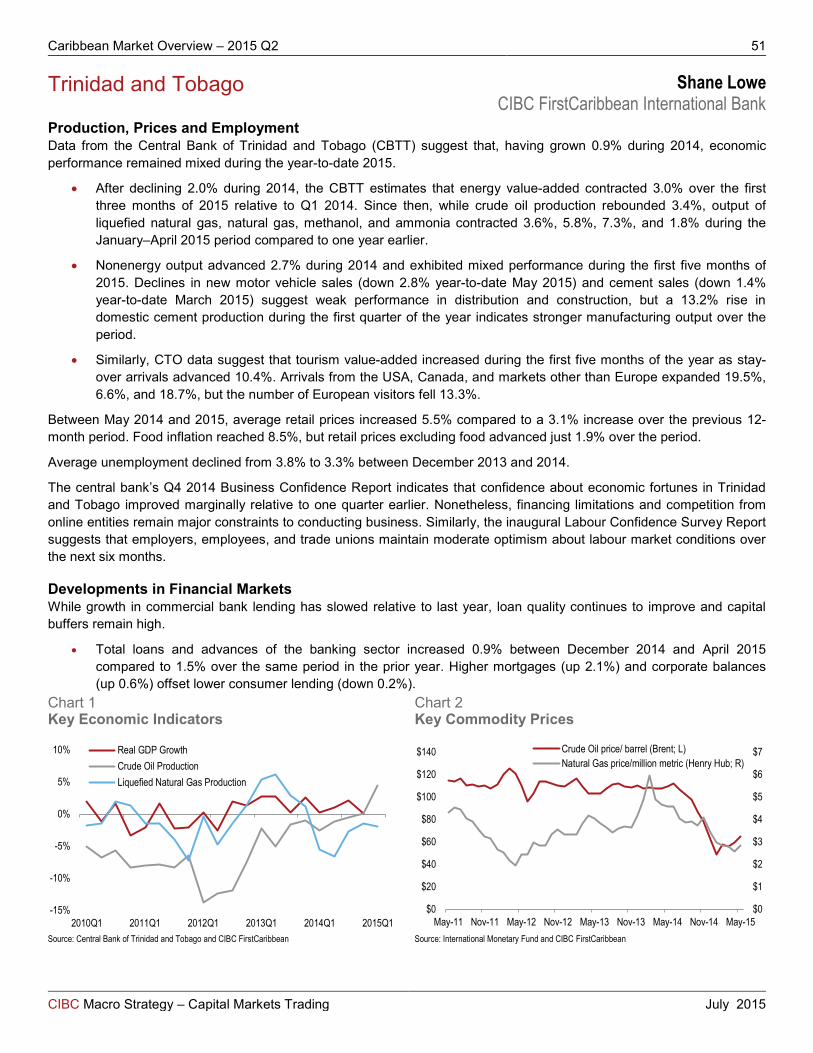
Caribbean Market Overview – 2015 Q2 51
CIBC Macro Strategy – Capital Markets Trading July 2015
Trinidad and Tobago Shane Lowe CIBC FirstCaribbean International Bank
Production, Prices and Employment Data from the Central Bank of Trinidad and Tobago (CBTT) suggest that, having grown 0.9% during 2014, economic performance remained mixed during the year-to-date 2015.
• After declining 2.0% during 2014, the CBTT estimates that energy value-added contracted 3.0% over the first three months of 2015 relative to Q1 2014. Since then, while crude oil production rebounded 3.4%, output of liquefied natural gas, natural gas, methanol, and ammonia contracted 3.6%, 5.8%, 7.3%, and 1.8% during the January–April 2015 period compared to one year earlier.
• Nonenergy output advanced 2.7% during 2014 and exhibited mixed performance during the first five months of 2015. Declines in new motor vehicle sales (down 2.8% year-to-date May 2015) and cement sales (down 1.4% year-to-date March 2015) suggest weak performance in distribution and construction, but a 13.2% rise in domestic cement production during the first quarter of the year indicates stronger manufacturing output over the period.
• Similarly, CTO data suggest that tourism value-added increased during the first five months of the year as stay-over arrivals advanced 10.4%. Arrivals from the USA, Canada, and markets other than Europe expanded 19.5%, 6.6%, and 18.7%, but the number of European visitors fell 13.3%.
Between May 2014 and 2015, average retail prices increased 5.5% compared to a 3.1% increase over the previous 12-month period. Food inflation reached 8.5%, but retail prices excluding food advanced just 1.9% over the period.
Average unemployment declined from 3.8% to 3.3% between December 2013 and 2014.
The central bank’s Q4 2014 Business Confidence Report indicates that confidence about economic fortunes in Trinidad and Tobago improved marginally relative to one quarter earlier. Nonetheless, financing limitations and competition from online entities remain major constraints to conducting business. Similarly, the inaugural Labour Confidence Survey Report suggests that employers, employees, and trade unions maintain moderate optimism about labour market conditions over the next six months.
Developments in Financial Markets While growth in commercial bank lending has slowed relative to last year, loan quality continues to improve and capital buffers remain high.
• Total loans and advances of the banking sector increased 0.9% between December 2014 and April 2015 compared to 1.5% over the same period in the prior year. Higher mortgages (up 2.1%) and corporate balances (up 0.6%) offset lower consumer lending (down 0.2%).
Chart 1 Key Economic Indicators
Chart 2 Key Commodity Prices
Source: Central Bank of Trinidad and Tobago and CIBC FirstCaribbean Source: International Monetary Fund and CIBC FirstCaribbean
-15%
-10%
-5%
0%
5%
10%
2010Q1 2011Q1 2012Q1 2013Q1 2014Q1 2015Q1
Real GDP GrowthCrude Oil ProductionLiquefied Natural Gas Production
$0
$1
$2
$3
$4
$5
$6
$7
$0
$20
$40
$60
$80
$100
$120
$140
May-11 Nov-11 May-12 Nov-12 May-13 Nov-13 May-14 Nov-14 May-15
Crude Oil price/ barrel (Brent; L)Natural Gas price/million metric (Henry Hub; R)

Caribbean Market Overview – 2015 Q2 52
CIBC Macro Strategy – Capital Markets Trading July 2015
• The NPL ratio declined from 4.2% at the end of March 2014 to 4.1% 12 months later, while the total capital adequacy ratio declined from 23.7% to 23.0% over the same period; capital buffers remain above the regulatory 8% minimum.
Total deposits declined 1.3% over the first four months of 2015 as lower demand deposit balances (down 7.8%) eclipsed higher savings (up 3.6%) and time (up 6.6%) deposits.
During May 2015, the CBTT increased its repo rate by 25 bps to 4.0% – the fifth consecutive increase since September 2014 – due to expected rising inflationary pressures, a positive growth outlook for the nonenergy sector, and the potential for a tightening of monetary policy by the US FOMC.
The TTD/USD exchange rate appreciated 0.8% to 6.3167 between June 2014 and 2015.
Government Debt During the period October 2014 to April 2015, government fiscal balance declined to a deficit of approximately US$365.2 million compared to a surplus of US$505.4 million one year earlier.
• Total revenue contracted US$378.8 million to US$4,657.9 million as higher tax revenues (up US$75.1 million) only partially offset lower revenues from nontax (down US$298.2 million) and capital (down US$155.6 million) sources. Taxes on property, goods and services, and international trade increased US$34.0 million, US$174.7 million, and US$1.0 million, while taxes on income and profits declined US$112.4 million.
• Total expenditure expanded US$491.8 million to US$5,023.1 million with increases in both current (up US$437.4 million) and capital (up US$54.3 million) expenditures. Spending on wages and salaries, goods and services, transfers to statutory boards and similar bodies, and expenditure on other transfers and subsidies increased US$51.4 million (7.0%), US$7.9 million (1.2%), US$119.7 million (18.0%), and US$259.8 million (14.2%), while interest payments fell US$1.3 million (0.6%).
Between December 2014 and April 2015, total central government debt outstanding increased from US$12,480.5 million to US$12,719.2 million. Domestic debt increased 2.4% to US$10,537.0 million, while external obligations fell marginally by 0.3% to US$2,182.2 million.
In May 2015, Moody’s downgraded the sovereign’s government bond rating from Baa1 to Baa2 with a negative outlook citing poor quality of macroeconomic data, high exposure to oil- and gas-related shocks, and the lack of a medium-term fiscal framework and rigid public expenditures structure.
Outlook The CBTT expects that economic growth should remain modest in 2015 due to weak energy production and slower growth in nonenergy output.
• Despite a projected increase in crude oil production, total energy sector value-added is likely to remain weak as less output is extracted from maturing oil and gas fields.
• Further, nonenergy output will likely grow less quickly than during 2014 as limited activity associated with a few private sector projects already underway offset some of the gains from the government’s capital expenditure program.
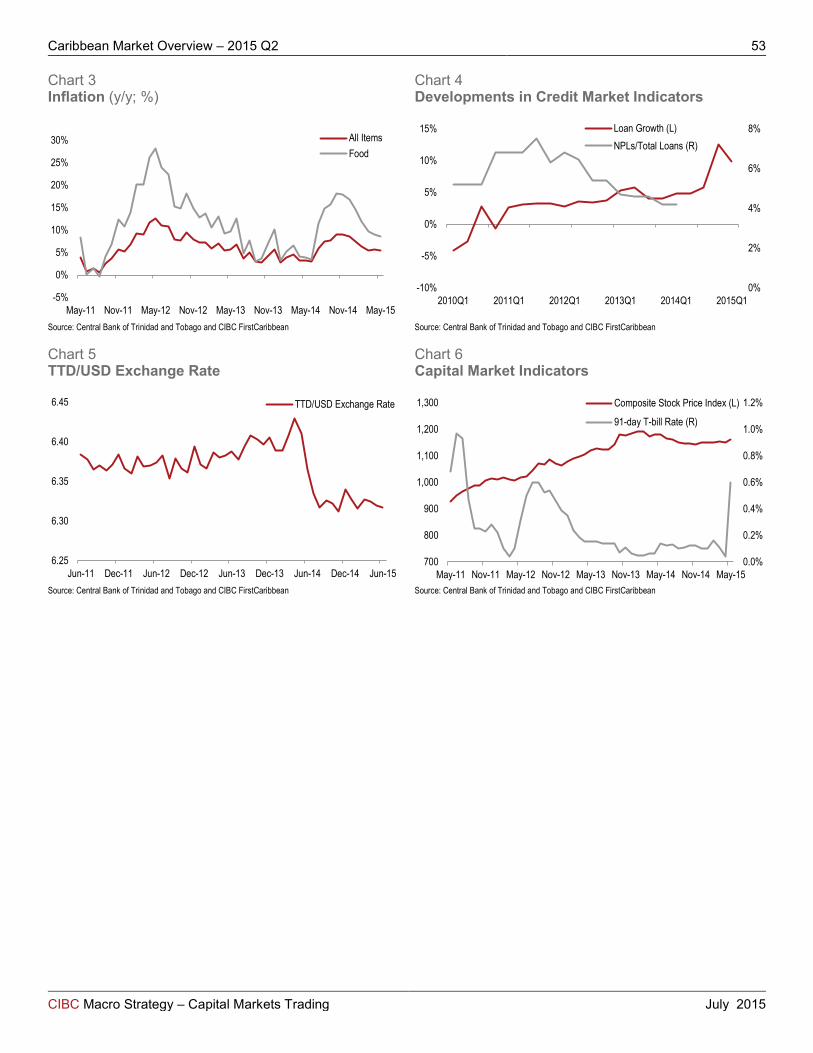
Caribbean Market Overview – 2015 Q2 53
CIBC Macro Strategy – Capital Markets Trading July 2015
Chart 3 Inflation (y/y; %)
Chart 4 Developments in Credit Market Indicators
Source: Central Bank of Trinidad and Tobago and CIBC FirstCaribbean Source: Central Bank of Trinidad and Tobago and CIBC FirstCaribbean
Chart 5 TTD/USD Exchange Rate
Chart 6 Capital Market Indicators
Source: Central Bank of Trinidad and Tobago and CIBC FirstCaribbean Source: Central Bank of Trinidad and Tobago and CIBC FirstCaribbean
-5%
0%
5%
10%
15%
20%
25%
30%
May-11 Nov-11 May-12 Nov-12 May-13 Nov-13 May-14 Nov-14 May-15
All ItemsFood
0%
2%
4%
6%
8%
-10%
-5%
0%
5%
10%
15%
2010Q1 2011Q1 2012Q1 2013Q1 2014Q1 2015Q1
Loan Growth (L)NPLs/Total Loans (R)
6.25
6.30
6.35
6.40
6.45
Jun-11 Dec-11 Jun-12 Dec-12 Jun-13 Dec-13 Jun-14 Dec-14 Jun-15
TTD/USD Exchange Rate
0.0%
0.2%
0.4%
0.6%
0.8%
1.0%
1.2%
700
800
900
1,000
1,100
1,200
1,300
May-11 Nov-11 May-12 Nov-12 May-13 Nov-13 May-14 Nov-14 May-15
Composite Stock Price Index (L)
91-day T-bill Rate (R)
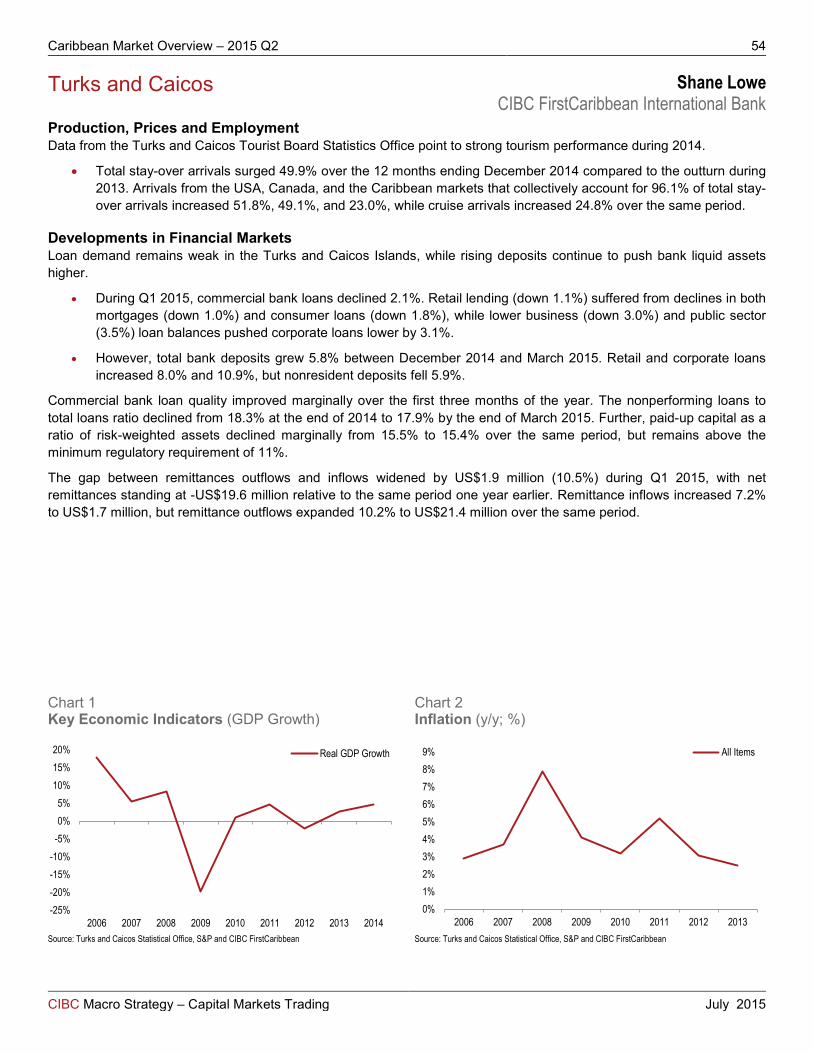
Caribbean Market Overview – 2015 Q2 54
CIBC Macro Strategy – Capital Markets Trading July 2015
Turks and Caicos Shane Lowe CIBC FirstCaribbean International Bank
Production, Prices and Employment Data from the Turks and Caicos Tourist Board Statistics Office point to strong tourism performance during 2014.
• Total stay-over arrivals surged 49.9% over the 12 months ending December 2014 compared to the outturn during 2013. Arrivals from the USA, Canada, and the Caribbean markets that collectively account for 96.1% of total stay-over arrivals increased 51.8%, 49.1%, and 23.0%, while cruise arrivals increased 24.8% over the same period.
Developments in Financial Markets Loan demand remains weak in the Turks and Caicos Islands, while rising deposits continue to push bank liquid assets higher.
• During Q1 2015, commercial bank loans declined 2.1%. Retail lending (down 1.1%) suffered from declines in both mortgages (down 1.0%) and consumer loans (down 1.8%), while lower business (down 3.0%) and public sector (3.5%) loan balances pushed corporate loans lower by 3.1%.
• However, total bank deposits grew 5.8% between December 2014 and March 2015. Retail and corporate loans increased 8.0% and 10.9%, but nonresident deposits fell 5.9%.
Commercial bank loan quality improved marginally over the first three months of the year. The nonperforming loans to total loans ratio declined from 18.3% at the end of 2014 to 17.9% by the end of March 2015. Further, paid-up capital as a ratio of risk-weighted assets declined marginally from 15.5% to 15.4% over the same period, but remains above the minimum regulatory requirement of 11%.
The gap between remittances outflows and inflows widened by US$1.9 million (10.5%) during Q1 2015, with net remittances standing at -US$19.6 million relative to the same period one year earlier. Remittance inflows increased 7.2% to US$1.7 million, but remittance outflows expanded 10.2% to US$21.4 million over the same period.
Chart 1 Key Economic Indicators (GDP Growth)
Chart 2 Inflation (y/y; %)
Source: Turks and Caicos Statistical Office, S&P and CIBC FirstCaribbean Source: Turks and Caicos Statistical Office, S&P and CIBC FirstCaribbean
-25%-20%-15%-10%-5%0%5%
10%15%20%
2006 2007 2008 2009 2010 2011 2012 2013 2014
Real GDP Growth
0%1%2%3%4%5%6%7%8%9%
2006 2007 2008 2009 2010 2011 2012 2013
All Items
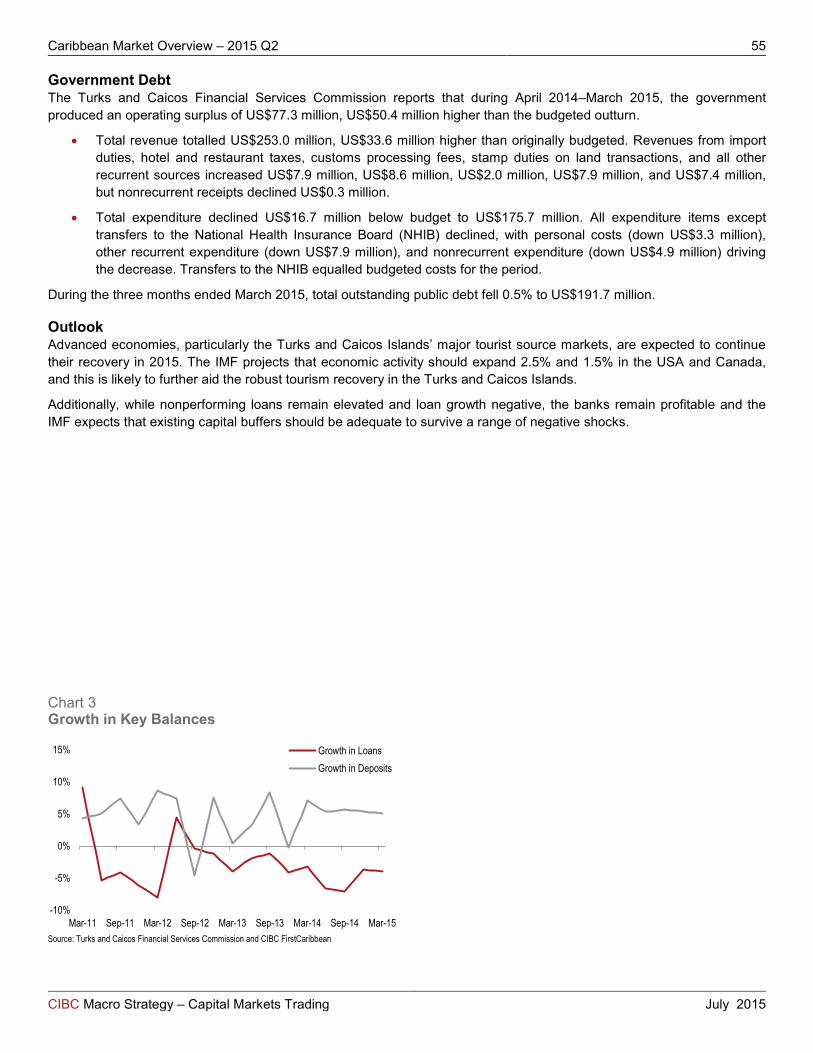
Caribbean Market Overview – 2015 Q2 55
CIBC Macro Strategy – Capital Markets Trading July 2015
Government Debt The Turks and Caicos Financial Services Commission reports that during April 2014–March 2015, the government produced an operating surplus of US$77.3 million, US$50.4 million higher than the budgeted outturn.
• Total revenue totalled US$253.0 million, US$33.6 million higher than originally budgeted. Revenues from import duties, hotel and restaurant taxes, customs processing fees, stamp duties on land transactions, and all other recurrent sources increased US$7.9 million, US$8.6 million, US$2.0 million, US$7.9 million, and US$7.4 million, but nonrecurrent receipts declined US$0.3 million.
• Total expenditure declined US$16.7 million below budget to US$175.7 million. All expenditure items except transfers to the National Health Insurance Board (NHIB) declined, with personal costs (down US$3.3 million), other recurrent expenditure (down US$7.9 million), and nonrecurrent expenditure (down US$4.9 million) driving the decrease. Transfers to the NHIB equalled budgeted costs for the period.
During the three months ended March 2015, total outstanding public debt fell 0.5% to US$191.7 million.
Outlook Advanced economies, particularly the Turks and Caicos Islands’ major tourist source markets, are expected to continue their recovery in 2015. The IMF projects that economic activity should expand 2.5% and 1.5% in the USA and Canada, and this is likely to further aid the robust tourism recovery in the Turks and Caicos Islands.
Additionally, while nonperforming loans remain elevated and loan growth negative, the banks remain profitable and the IMF expects that existing capital buffers should be adequate to survive a range of negative shocks.
Chart 3 Growth in Key Balances
Source: Turks and Caicos Financial Services Commission and CIBC FirstCaribbean
-10%
-5%
0%
5%
10%
15%
Mar-11 Sep-11 Mar-12 Sep-12 Mar-13 Sep-13 Mar-14 Sep-14 Mar-15
Growth in LoansGrowth in Deposits
Caribbean Market Overview – 2015 Q2 56
CIBC Macro Strategy – Capital Markets Trading July 2015
About CIBC
CIBC (TSX, NYSE: CM) is a leading Canadian-based financial institution with a market capitalization of $30.1 billion and a Tier 1 capital ratio of 14.7%. We have three major businesses – Retail and Business Banking, Wealth Management and Wholesale Banking – focused in Canada and around the world. CIBC provides a full range of financial products and services to 11 million clients. We have more than 42,000 employees dedicated to helping our clients achieve what matters to them, delivering consistent and sustainable earnings for our shareholders, and giving back to our communities. At year-end (October 31, 2013):
• Net income was $3.4 billion or $8.23 per share diluted.
• Market capitalization was $30.1 billion.
• Tier 1 capital ratio was 9.47% (Basle III).
• CIBC had more than 43,000 employees worldwide.
• CIBC had 1,100 branches across Canada with nearly 4,000 bank machines, including 2,137 machines with Access for all technology.
• CIBC has been a constituent of the DJSI World Index for 10 consecutive years and a member of the DJSI North America Index since its inception in 2005.
• CIBC has been listed on the FTSE4Good Index since its inception in 2001.
• CIBC has been a member of the Jantzi Social Index since its inception in 2000.
CIBC is committed to causes that matter to our clients, employees and communities. Our goal is to make a difference through corporate donations, sponsorships and the volunteer spirit of employees. With a focus on Kids, Cures and Community, CIBC invested close to $35 million in communities across Canada in 2013.
CIBC Retail and Business Banking Retail and Business Banking provides clients across Canada with financial advice, products and services through a strong team of advisors and nearly 1,100 branches, as well as our ABMs, mobile sales force, telephone banking, online and mobile banking.
Our objective is to continually strengthen our focus as a client-centric organization. Across Retail and Business Banking, we are focused on our priorities: build deeper relationships with our clients; improve our sales and service capabilities; and acquire and retain clients who seek deeper and more rewarding relationships.
Wealth Management Wealth Management comprises asset management, retail brokerage and private wealth management businesses. Combined, these businesses offer an extensive suite of leading investment and relationship-based advisory services to meet the needs of institutional, retail, and high net worth clients.
Our objective is to be a leader in wealth management solutions in markets where we offer advice and to be a leading global asset manager by delivering exceptional value for our clients, our employees, our shareholders and our communities.
Wholesale Banking Wholesale Banking provides a wide range of credit, capital markets, investment banking, merchant banking and research products and services to government, institutional, corporate and retail clients in Canada and key markets around the world. Our objective is to be the premier client-focused wholesale bank centered in Canada, with a reputation for consistent and sustainable earnings, for risk-controlled growth and for being a well-managed firm known for excellence in everything we do.
Caribbean Market Overview – 2015 Q2 57
CIBC Macro Strategy – Capital Markets Trading July 2015
About CIBC FirstCaribbean
CIBC FirstCaribbean International Bank is a relationship bank offering a range of market-leading financial services through our Corporate Investment Banking, Wealth Management and Retail Banking segments.
Headquartered in Warrens, Barbados, we provide banking services to our clients through approximately 3,400 employees, in 100 branches and offices. We are one of the largest, regionally listed financial services institution in the English and Dutch-speaking Caribbean.
As a member of the CIBC Group of companies, we share with them an organizational culture based on core values of Trust, Teamwork, and Accountability.
CIBC FirstCaribbean operates within a well regulated environment, under the supervision of the ten banking regulators across our 17 markets, including Anguilla, Antigua and Barbuda, The Bahamas, Barbados, Belize, British Virgin Islands, Cayman Islands, Curaçao, Dominica, Grenada, Jamaica, St. Kitts and Nevis, St. Lucia, St. Maarten, St. Vincent and the Grenadines, Trinidad and Tobago and Turks and Caicos Islands.
CIBC FirstCaribbean is traded on the stock exchanges of Barbados, Trinidad and Tobago, Jamaica, The Bahamas and Eastern Caribbean.
A full service institution, we lead the market in providing innovative solutions for our clients, including:
• State-of-the-art branch banking which is currently being rolled out across the region, featuring a functional, ergonomic environment with electronic, seated queuing systems for service identification and prioritization; dedicated corporate banking facilities and wealth management services in an upscale, lounge-type setting
• A range of electronic banking solutions for full service in quick time, including an enhanced internet and mobile banking service.
• Enhanced private banking service for Domestic Wealth Management clients, including Platinum Service priority access in branches, dedicated wealth management centres, financial advice by certified financial planning experts and Platinum cards services for the discerning customer.
• Support for corporate clients with best-in-class relationship management products and services.
CIBC FirstCaribbean is focused on developing strong relationships with its clients and is committed to being a best practice institution, with a focus on listening to and working closely with our clients to help them achieve what matters to them.

Caribbean Market Overview – 2015 Q2 58
CIBC Macro Strategy – Capital Markets Trading July 2015
Notes

John H. Welch Executive Director
Macro Strategy Fixed Income Currencies & Distribution
CIBC World Markets Inc. Brookfield Place
161 Bay Street, 5th Floor Toronto, ON M5J 2S8 Tel. +1 416 956-6983
Paul Douglas Executive Director
Capital Markets Trading Caribbean and Latin America
CIBC World Markets Inc. Brookfield Place 161 Bay Street
Toronto, ON M5J 2S8 Tel. +1 416 594-8506
Martin Peichl Executive Director & Head
Client Solutions Group CIBC FirstCaribbean
International Bank Head Office
Warrens, St. Michael BB22026 Barbados Tel: 246 367-2169
Shane Lowe Strategy &
Economic Analyst CIBC FirstCaribbean
International Bank Head Office
Warrens, St. Michael BB22026 Barbados Tel: 246 367-2227


