1 Date: 3/20/13 Analyst: Brady Parsons CIF Sector Recommendation Report (Spring 2013) Sector: Technology Review Period: February 28 st – March 13 th Section (A) Sector Performance Review Copy/paste “Sector Review Spreadsheet” (the entire spreadsheet) here As one can see from the graph presented above and the chart presented below the XLK performed fairly similar to the S&P500 for the two week time period consisting of February 28 th -March 13 th . That being said the market as a whole did see 0.7% more growth for the period observed which was somewhat surprising to me because the XLK is much more volatile than the market implying larger price changes. I would have speculated that the XLK would have experienced more growth or regression in response to the recent cyber-attacks on American business. Technology began to see growth after it had dropped in the last period examined but did not see significant growth because these attacks still had not been fixed which increased uneasiness among these technology companies as open market vulnerability became an increasing reality. According to Michael Chertoff, the former secretary of Homeland Security companies needs to use a strategy which he deemed “active defense”. This is the idea that states companies should not just erect walls to prevent cyber-attacks, but instead make it more difficult for hackers to climb into your systems and pursue aggressively those who do. All of our
Transcript
1
Date: 3/20/13
Analyst: Brady Parsons
CIF Sector Recommendation Report (Spring 2013)
Sector: Technology Review Period: February 28st – March 13th
Section (A) Sector Performance Review
Copy/paste “Sector Review Spreadsheet” (the entire spreadsheet) here
As one can see from the graph presented above and the chart presented below the XLK
performed fairly similar to the S&P500 for the two week time period consisting of February
28th-March 13th. That being said the market as a whole did see 0.7% more growth for the period
observed which was somewhat surprising to me because the XLK is much more volatile than the
market implying larger price changes. I would have speculated that the XLK would have
experienced more growth or regression in response to the recent cyber-attacks on American
business. Technology began to see growth after it had dropped in the last period examined but
did not see significant growth because these attacks still had not been fixed which increased
uneasiness among these technology companies as open market vulnerability became an
increasing reality. According to Michael Chertoff, the former secretary of Homeland Security
companies needs to use a strategy which he deemed “active defense”. This is the idea that
states companies should not just erect walls to prevent cyber-attacks, but instead make it more
difficult for hackers to climb into your systems and pursue aggressively those who do. All of our
2
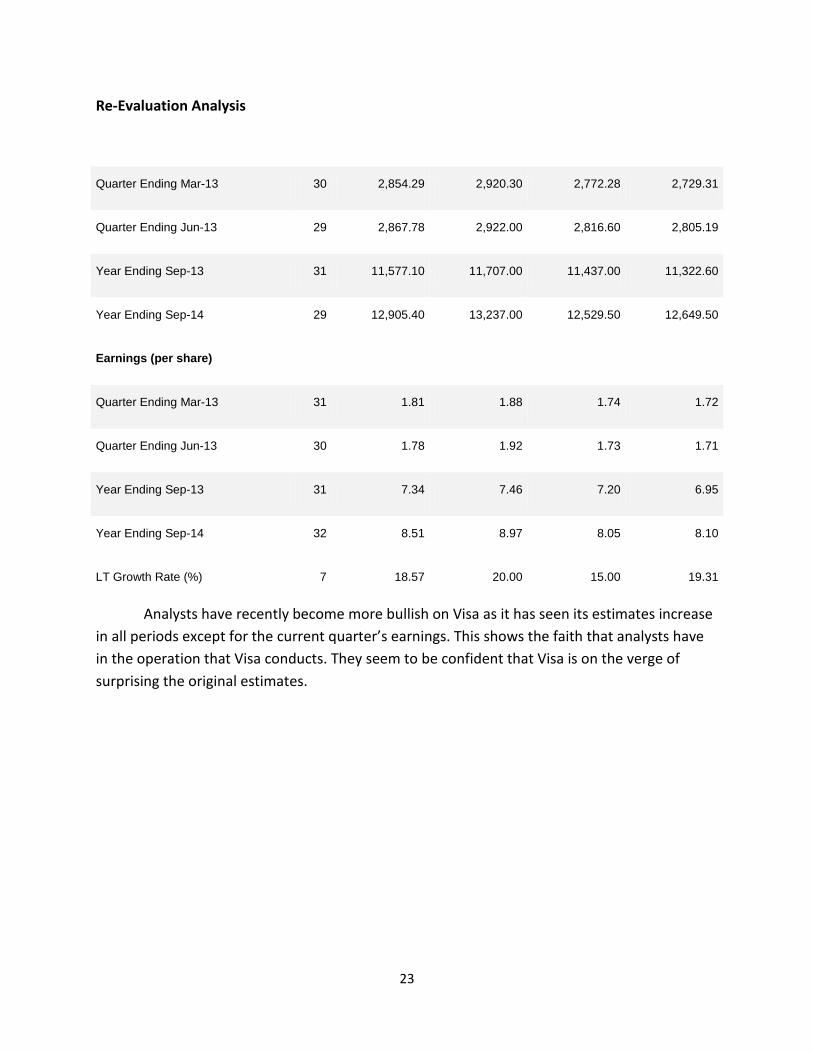
holdings except for Visa did see slight growth in the time period which did show that there is
progress being made to resolve these security breaches. Visa did not improve as they are a
company that relies heavily on the security that they can provide their customers in terms of
credit card and debit card security. Once the storm settles I believe Visa will rebound and
outperform their competition. The performance of the XLK leans heavily on the economy as a
whole (GDP) which improved by 0.1% in quarter 4 of 2012. This leads me to believe that the
technology sector will outperform the market for the year of 2013 once these cyber-attacks
have been resolved.
An industry that is on the rise within the technology sector is the tablet industry. In
recent time companies such as Apple have been releasing alternative smaller models which in
turn results in lower prices for the product. This has helped boost the industry because dollar
votes are critical in the retail industry where consumers are always looking for affordable
Market Research Firm International Data Corporation stated that they expect the worldwide
tablet market to reach 190.9 million units in 2013, which is a significant increase compared to
its previous forecast of 172.4 million units. Between 2013 and 2016, the tablet industry is
expected to grow at a rate equal to 11% annually. Tablet shipments are forecast to be upwards
of 350 million units by the end of 2017, due to the popularity of smaller tablets.
(Wallstcheatsheet.com)
Our first holding Qualcomm experienced fairly constant slight growth for the time
period. The company did see a large price spike on March 4th but two days later on March 6th
3
they saw an equal price decrease. The increase was due to the announcement that they would
launch a strategic collaboration with WebMD to form mHealth. Then two days later the
company announced an increase in their quarterly dividend by 40% which caused the stock to
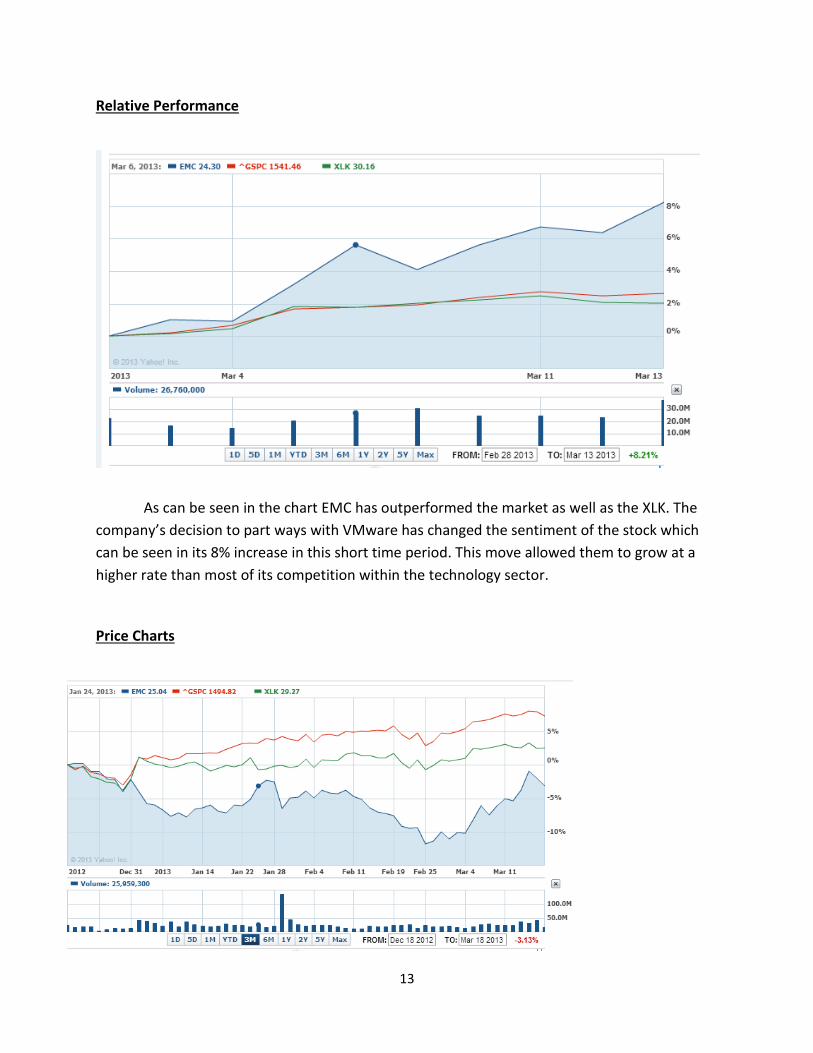
then fall. EMC Corp saw their stock price increase by two dollars for the two week period
examined. It was a positive sign to see the stock performing well because prior to this time the
stock had lost value since we had purchased it. Many fund managers do believe that the stock is
undervalued and is now bouncing back from its sub-par guidance for VMware. Visa saw a slight
decrease in their price but not to a significant degree. That being said we are still in the green
for Visa and their new mobile phone system shows signs of significant growth in the future. In
regards to Cisco the newest holding for the XLK, they have seen positive growth which is a
positive sign because of their underperformance in 2012.
GAINERS +
Cree, Inc. (CREE): +19%
o Unveiled their new $10 LED light bulb which will make them a low cost leader
which caused unusually high volume.
Affymetrix Inc. (AFFX): +14%
o Beat analyst estimates by a significant margin and also signed a partnership with
DNA Link which resulted in an upgrade for the stock.
Hewlett Packard (HPQ): +8%
o Rode the momentum of beating analyst estimations and the unveiling of their
new media player.
LOSERS –
AVG Technologies (AVG): -24.5%
o They received many downgrades after their CEO J.R. Smith stepped down.
Maxwell Technologies (MXWL): -17%
o On March 9th Faruqi & Faruqi LLP which is a national law firm began an investigation on MXWL concerning possible breaches of fiduciary duty and other violations of law related to their financial statements.
Apple Inc. (AAPL): -4% o Apple’s downward spiral continued leaving them wondering how much farther
their share price will fall.
4
Highlight the largest two holdings from the sector and note any headline news on the
companies
When examining the XLK it is important to look at its largest holding Apple Inc. because
of the large influence they have on the ETF. After hitting its $705 peak in the fall of 2012, Apple
hit a fresh 52-week low on March 1st. The stock has now fallen 39% from its peak to the $430
range. According to finance.yahoo.com a 20% price decline is the definition of a bear market.
The drop to the bottom was a result of the recent lawsuit David Einhorn filed against the
company for hoarding cash on the balance sheet. Mr. Einhorn wants Apple to offer preferred
stock to its shareholders for $50. This would offer investors high yields as well as help to
improve the state of their common stock. Also I believe this dramatic decline could be an
indicator for what the future holds for the rest of the stock market.
The second largest holding within the technology sector is International Business
Machines (IBM). Over the time period examined they saw their share price increase by
approximately $10 even though they saw a decrease in volume. The company has positioned
itself in the front of the pack for the big data market. According to themotleyfool.com they
have beaten Teradata and Oracle to the major data storage marketplace. IBM’s data storage
unit is growing at a rate of 60% a year which shows where the company is focusing its assets.
The company believes that they will unlock $16 billion in revenue by 2015 in this big data
market.
I expect that technology sector to perform very well in the near future and outperform
the market as a whole. Very few companies have been experiencing consistent decreases and
most companies have relatively low valuation ratios showing the potential for future growth.
Because this sector is affected so largely by the domestic GDP I am watching very intently on
the consequences of the sequester budget cuts. If these cuts decrease the consumer sentiment
it will affect the sales volume of these companies which will drive down their share prices.
Because the XLK experienced a 2% increase in my two week period I believe that these cuts
impact will not be felt to significant degree which will continue the growth of technology
companies.
5
Section (B) Sector Holding Updates
Company #1: Qualcomm (QCOM)
Date Recommended: 12-6-12
Date Re-evaluated: 3-20-13
Company Update
Over the two weeks Qualcomm saw relatively no changes as their price changed from
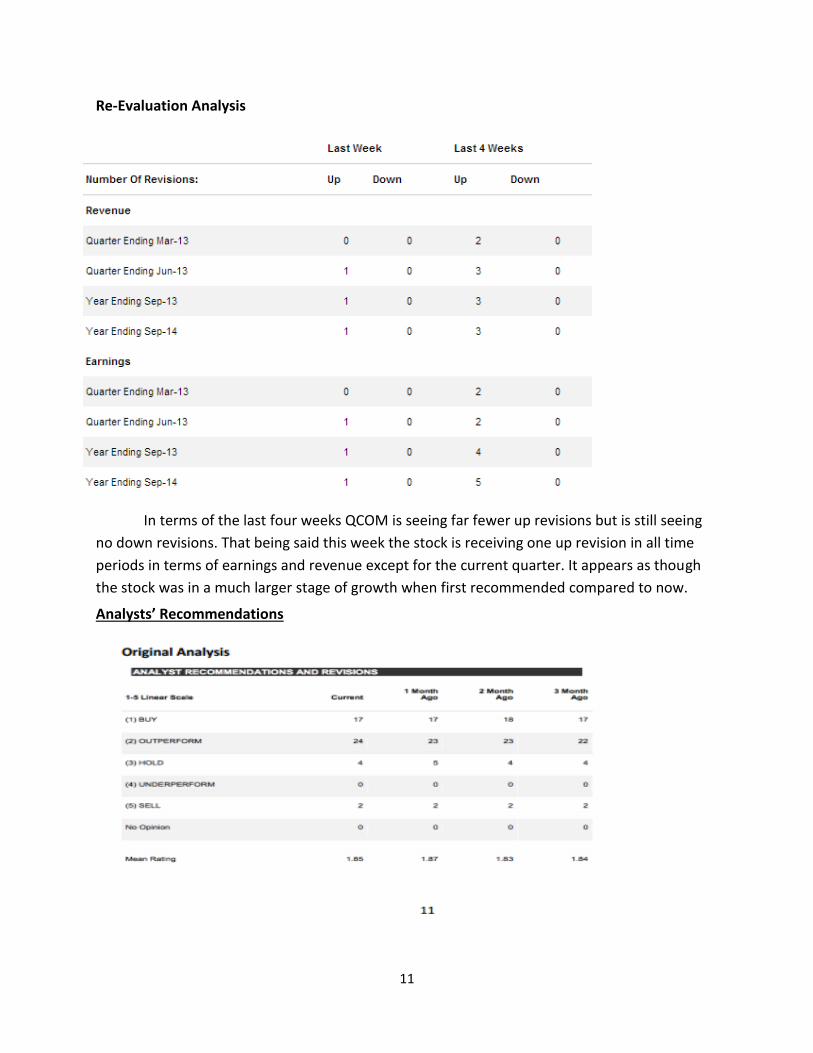
$65.64 to $66.75. Qualcomm’s future looks bright as they surpassed estimates for the first
quarter of 2013 which caused them to raise their guidance for the fiscal year 2013. The
company is dominating the LTE market and controls 86% of the market currently. This
stranglehold looks like it will not end as they recently released their next generation of
processor which they call Snapdragon. The company already has secured contracts to be in 50
different products already. The company is excited about the release of the Samsung Galaxy S4
which will feature these chips. This phone is expected to become the most popular on the
market which would be huge for Qualcomm.
Relative Performance
Qualcomm saw close to 2% growth for the two weeks which was less significant than both the
XLK and the market as a whole. The company did start fast and saw a large price spike on March 4th but
two days later on March 6th they saw an equal price decrease. The increase was due to the
announcement that they would launch a strategic collaboration with WebMD to form mHealth. Then
6
two days later the company announced an increase in their quarterly dividend by 40% which caused the
stock to then fall. Investors seemed to be reluctant within the technology sector in the wake of the
cyber-attacks which caused the market to grow faster than QCOM as well as the XLK.
Price Charts
3 Month
1 Year
7
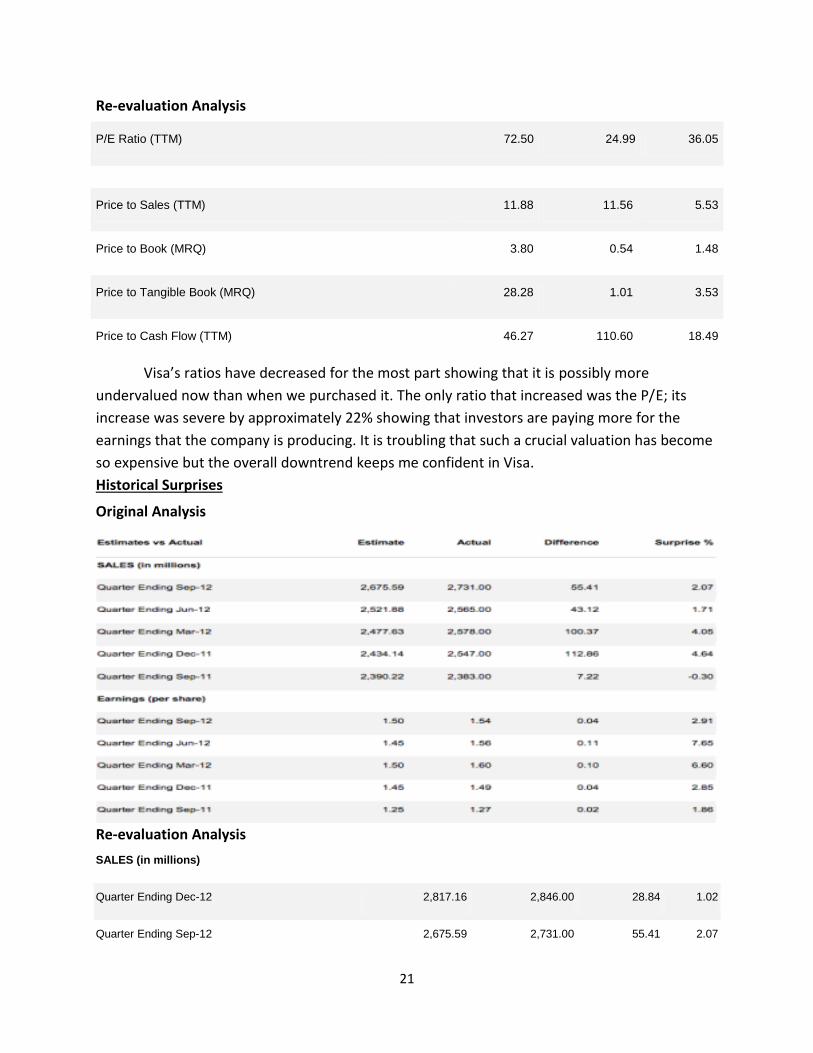
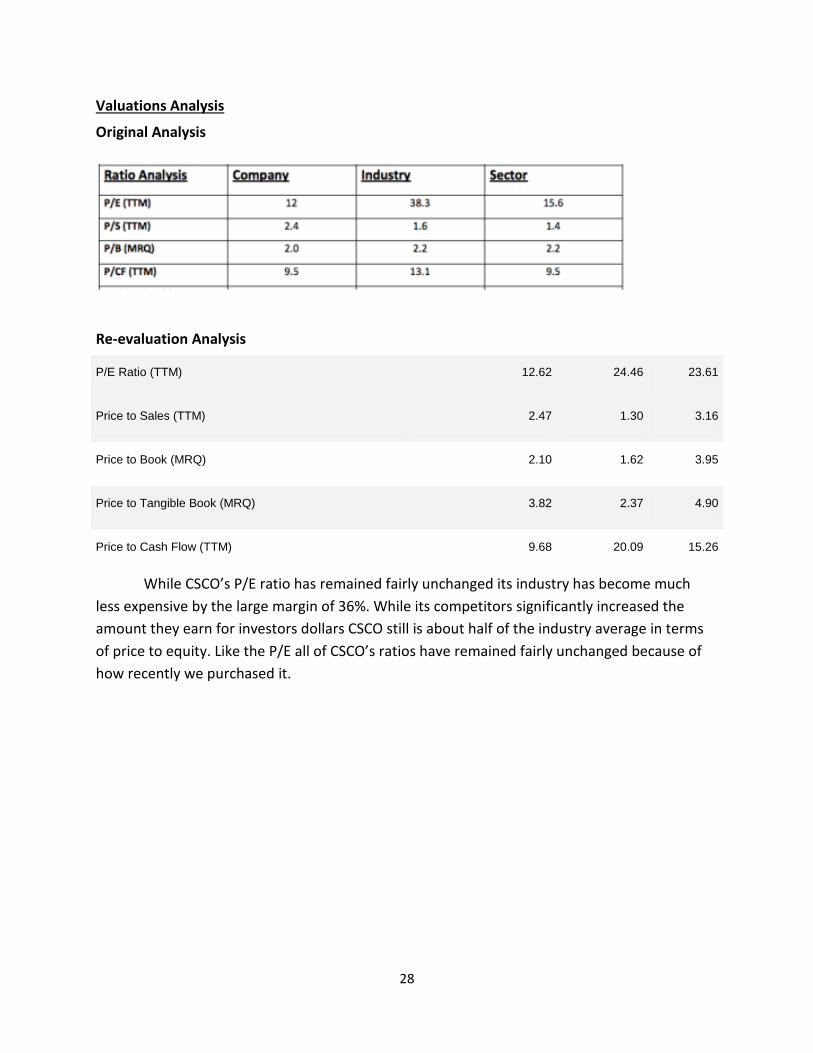
Valuations Analysis
Original Analysis
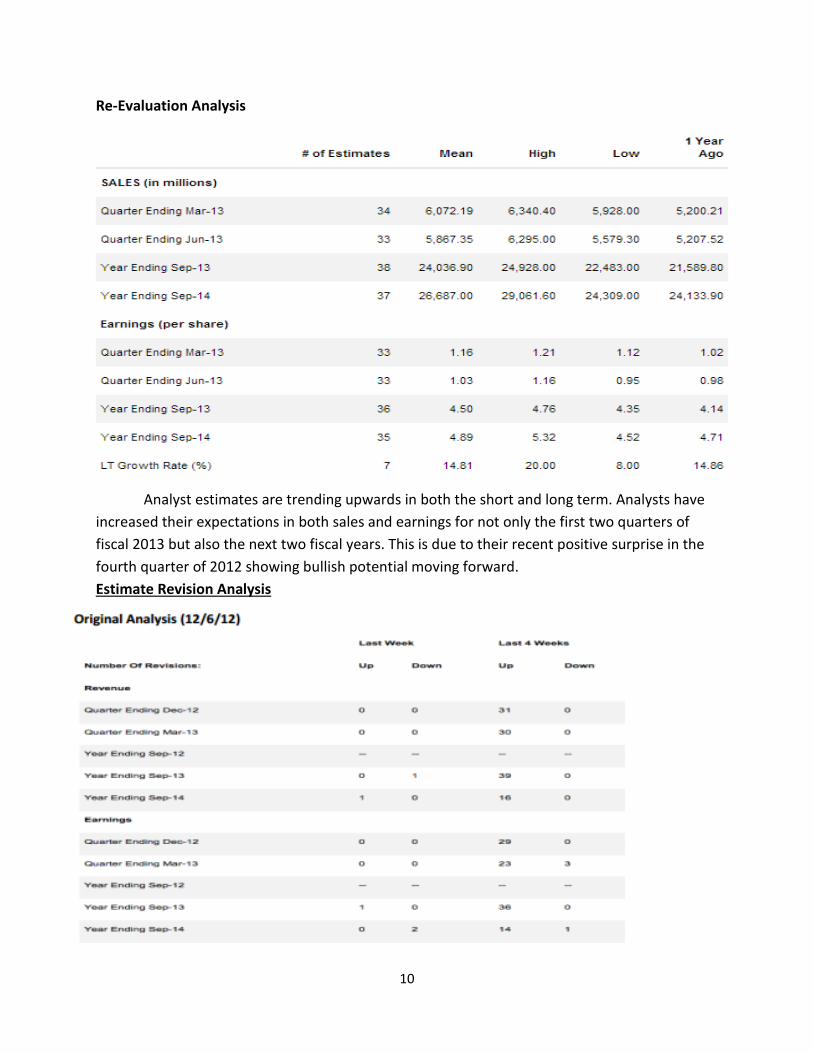
Re-evaluation Analysis
P/E Ratio (TTM) 19.48 24.46 23.61
Price to Sales (TTM) 5.46 1.30 3.16
Price to Book (MRQ) 3.16 1.62 3.95
Price to Tangible Book (MRQ) 3.91 2.37 4.90
Price to Cash Flow (TTM) 16.62 20.09 15.26
Qualcomm has seen all of its valuation ratios decrease since the time that it was first
examined. This means that the company is now more undervalued than it was when it was first
recommended. That being said the valuations are not very attractive for Qualcomm because
they still suggest that they are more overvalued than their industry and sector.