28
CURRENT SITUATION AND FUTURE PROSPECTS CITIZENS AND IN BARCELONA

CURRENT SITUATION AND FUTURE PROSPECTS
CITIZENS AND
IN BARCELONA

Created by:
With the contribution of:
Authors : Charlotte Bouchet, Martí Jofre, Víctor Moyano, Sergi Paniagua and Alba RieraAdvisor: Josep Sala
1
Contents
02 Preface
03 Objectives
04 Current situation: figures and citizens’ perception
Figures on daily mobilityThe arrival of new mobility services Measures to restrict traffic in BarcelonaBusinesses and employees’ mobilityCitizens’ profiles
14 Future prospects
The tie between users and vehicles persistsNew mobility services: a complement to public transport?What impact could restrictions on the private vehicle have?The role of businesses in resolving mobility issues
22 Key learnings
24 Methodology
Acknowledgements

2 Creafutur 2017Citizens and mobility in Barcelona
Current situation and future prospects
We are all aware that we are standing at the threshold of an important change in the way we move in our cities. The serious problems related to pollution and congestion that affect the major European cities (including Barcelona) have led public authorities to take measures to favour sustainable mobility.
Such measures are expected to continue during the next few years and, in particular, measures taken to limit the impact of road traffic 1. Passenger transport in the Metropolitan Area of Barcelona (whether by private vehicle or public transport) is responsible for 62% of CO2 emissions generated by road traffic. In fact, last February, the European Commission issued an ultimatum to Spain due to its continuous failure to comply with atmospheric pollution limits in Madrid and Barcelona and its metropolitan area. The community executive warned Spain that the measures implemented so far are insufficient, and that a much greater effort is needed on a local, regional and national level to comply with the obligations set by the EU legislation and to protect public health.
On the other hand, the mass use of smartphones and connected devices has given rise to the development of a series of shared mobility services. Such new services offer an alternative to the mobility pattern consolidated in recent decades, based on private vehicles (mainly cars) and public transport.
In view of the above context, the present study aims to analyse the extent to which citizens’ attitudes and behaviour will evolve in the future in relation to their everyday trips in Barcelona and its metropolitan area. Three change factors have been analysed: new shared mobility services; the imposing of measures by public authorities to limit the number of cars; and the role of businesses in relation to the mobility of their employees.
The study was conducted by Creafutur Foundation and funded and co-created by 11 private and public entities: Abertis Foundation, Barcelona City Council, Barcelona Metropolitan Area (AMB), Metropolitan Transport Authority (ATM), Municipal Services of Barcelona (BSM), Clear Channel, Ferrocarrils de la Generalitat de Catalunya (FGC), SABA, RACC, Repsol and SEAT.
Preface
1 Source: “Seguiment de l’evolució de la mobilitat i les emissions de gasos d’efecte hivernacle i contaminants a la Regió Metropolitana de Barcelona el 2014” (“Monitoring of the evolution of mobility and the pollutant
greenhouse gas emission effect in the Metropolitan Area of Barcelona in 2014”), ATM (July 2016)

3
The main objective of the study was to analyse the extent to which attitudes and behaviour of citizens will evolve in the future in relation to their everyday trips on weekdays. More specifically, the study objectives were the following:
1. To segment citizens according to their attitudes and perceptions regarding mobility, technology and sustainability.
2. To identify and quantify the key indicators that define the mobility pattern and behaviour of each citizen.
3. To evaluate the expectations related to changes in behaviour in each segment by responding to the following questions:
How will the private ownership of vehicles evolve?
How interested are they in new shared mobility services?
What influence can dissuasive measures on the use of private vehicles have? For instance, restrictions on more contaminating vehicles in the event of episodes of environmental pollution.
What impact can teleworking and other measures implemented by businesses have on their working day mobility?
The study focused on analysing mobility on weekdays in the metropolitan area and its evolution over the next 10-15 years. Its scope of analysis does not include the impact of autonomous vehicles on our cities, as the experts interviewed consider their mass implementation extremely unlikely within these terms.
Objectives

4 Creafutur 2017Citizens and mobility in Barcelona
Current situation and future prospects
5
Current situation : figures and citizens’ perception
Following the worst years of the economic crash, the use of all means of transport has recovered: the use of bicycles and public transport has grown at a fast pace, the latter reaching record numbers, and the use of private vehicles is also growing again. This situation combines with the appearance of new mobility services that can serve as a complement to current transport alternatives and the implementation of measures to restrict the use of private vehicles in the city. In front of this picture, we have observed different attitudinal profiles among citizens in terms of their vision of mobility and their mobility behaviour.

6 Creafutur 2017Citizens and mobility in Barcelona
Current situation and future prospects
2 Source: “Dades bàsiques de mobilitat 2015” (“Basic mobility data 2015”, Barcelona City Council) 3 Source: IDESCAT (2016) - City of Barcelona
4 Source: Barcelona City Council Statistics Department
EVOLUTION OF THE NUMBER OF STAGES OF TRIPS WITHIN THE CITY OF BARCELONA AND IN CONNECTION WITH OTHER MUNICIPALITIES2
Almost 5 million trips are made within the city of Barcelona every day, most of them on foot or bicycle (56%), 30% on public transport and 14% on private transport. Connection trips (from or to other municipalities of the metropolitan area) stands at 1.83 million. Of these, private transport becomes much more relevant than within the premises of the city, reaching 47% of all trips, but public transport still accounts for most of the trips (50%) 2.
Transport is the third most important category in terms of household expenditure, after food and housing, representing around 10% of the total expenditure. During the economic crisis, people’s expenditure on transport decreased more than on the rest of categories 3.
Trips on public and private transport have fallen during the crash, reaching minimum values in 2012 and in 2014, respectively. This coincides with the period with the highest unemployment figures 4. This shows the important correlation between employment and mobility levels. In fact, all means of transport evolved positively in 2015.
3.200.00
2.875.000
2.550.000
2.225.000
1.900.0002006 2007 2008 2009 2010 2011 2012 2013 2014 2015
Public transport Walking and cycling Private transport
Note: the use of any of the above considered means of transport for over 5 minutes is accounted for as a stage of the trip, so one trip can add more than one stage to the total.
METHODOLOGICAL NOTE The figures for which no source is referenced come from the research produced by this study
Figures on daily mobility

7
CarIn Barcelona, the ratio of passenger cars for every 1,000 inhabitants was 350.3 in 2014, lower than in most European cities of a similar size. However, the number of passenger cars with respect to the total surface area of the city is the highest of all these, standing at 5,500 passenger cars/km2. 2
On the other hand, the cost of owning a car (taking into consideration the purchase, insurance, maintenance, petrol and parking costs, among others) in Barcelona is 16.62 euros per hour of use, i.e., 3,284.67 euros per year, which is similar to that of other European cities 5.
In respect of the possession of a driving licence, over the past few years a fall has been observed in the number of driving licences issued in developed countries, thus giving rise to a constant decrease in the number of young people with driving licences. This trend is also observed in Spain, where the number of new drivers in 2013 was the lowest in decades. Nonetheless, said indicator rose again in 2014 and 2015, with an increase in the number of new drivers of 5.2% between 2013 and 2015 6. This could lead us to think that the reduction in the number of driving licences issued during such years is related to the economic crash, and not to a change in the behaviour pattern.
In this study we observed a lower possession of driving licences among young people (18-29 age group). 75.1% of them hold a licence, while this percentage increases to 89.6% for the other age groups studied. We have also detected a significantly lower car ownership among young people (18-29 age group): 44.5% of them do not have a car, while this percentage falls to 24.6% in the rest of age groups. The “future prospects” section of this report gives an idea of how young people envisage their relationship with vehicles today and within 10 years.
2 Source: “Dades bàsiques de mobilitat 2015” (“Basic mobility data 2015”, Barcelona City Council) 5 Source: study conducted by Avancar in 2016 6 Source: DGT (General Traffic Directorate)
CAR FLEET WITH RESPECT TO POPULATION AND SURFACE IN EUROPEAN CITIES, 2014 2
Passenger cars/1,000 inh. Passenger cars (thousands)/km2
700 6
525 4,5
350 3
175 1,5
0 0Warsaw Prague Milan Munich Hamburg Vienna Barcelona Budapest
2,1
614,
1
1,5
574,
2
3,8
513,3
2,2
454
1
421,1
1,638
6,8
5,5
350,
3
1,1
334,
6
8 Creafutur 2017Citizens and mobility in Barcelona
Current situation and future prospects
The distance I have to travel is too long
There are no bike lanes on my way
I think they are not safe
It takes me too long
I sweat a lot when I use it
I get wet if it rains
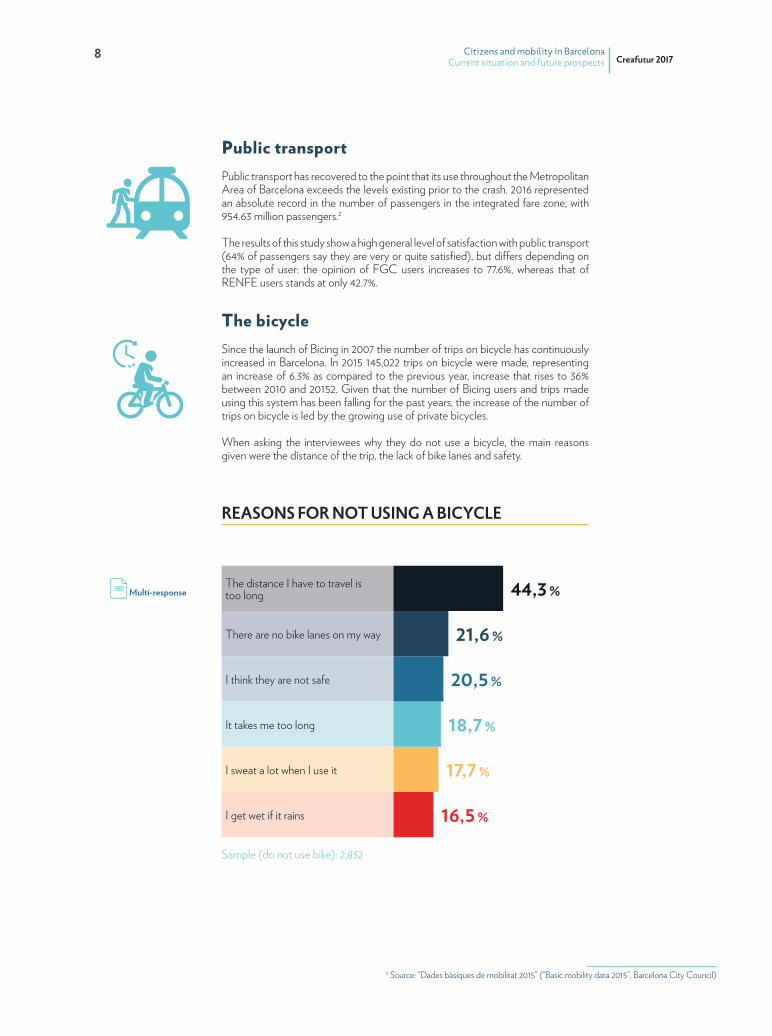
Public transportPublic transport has recovered to the point that its use throughout the Metropolitan Area of Barcelona exceeds the levels existing prior to the crash. 2016 represented an absolute record in the number of passengers in the integrated fare zone, with 954.63 million passengers.2
The results of this study show a high general level of satisfaction with public transport (64% of passengers say they are very or quite satisfied), but differs depending on the type of user: the opinion of FGC users increases to 77.6%, whereas that of RENFE users stands at only 42.7%.
The bicycleSince the launch of Bicing in 2007 the number of trips on bicycle has continuously increased in Barcelona. In 2015 145,022 trips on bicycle were made, representing an increase of 6.3% as compared to the previous year, increase that rises to 36% between 2010 and 20152. Given that the number of Bicing users and trips made using this system has been falling for the past years, the increase of the number of trips on bicycle is led by the growing use of private bicycles.
When asking the interviewees why they do not use a bicycle, the main reasons given were the distance of the trip, the lack of bike lanes and safety.
REASONS FOR NOT USING A BICYCLE
44,3 %
21,6 %
20,5 %
18,7 %
17,7 %
16,5 %Sample (do not use bike): 2,832
2 Source: “Dades bàsiques de mobilitat 2015” (“Basic mobility data 2015”, Barcelona City Council)
Multi-response

9
Carsharing Fleet of cars distributed throughout the city and available 24/7 for being used by the minute, hour or day. E.g. Avancar, Car2GoWhen the vehicle is owned by an individual and rented out to another individual it’s called P2P Carsharing. E.g. SocialcarThere are two schemes: round-trip carsharing (the car needs to be returned to the same spot) and one-way carsharing (the car can be returned at a different location).
Motosharing Fleet of scooters distributed throughout the city and available 24/7. The scooters can be found and unlocked through a mobile app. They are usually electric scooters. E.g. eCooltra, Motit
Bikesharing Fleet of bikes usually available for users at on-street stations. The user usually pays an annual fee and a price per minute/trip. The service is frequently subsidized by a public authority. E.g. Bicing
Carpooling Drivers with available seats for trips planned in advance share the trip and the costs with strangers. The connection is set up through an online platform. E.g. BlaBlaCar
Ride-hailing Drivers (individuals or professional drivers with a license) registered on a platform offer on-demand transportation services for individuals who request rides. They can also offer the option of sharing the trip and costs with other passengers. E.g. Uber, Cabify
On-demand bus
Service that allows to request a trip on a vehicle with more capacity for passengers than a car and share the trip with other users that the vehicle picks up along the journey, which changes dynamically according to the requests received. E.g. Shotl, Via
The massive adoption of smartphones, the creation of platforms connecting supply and demand and the possibility of monitoring vehicles using remote technologies have led to the development of shared mobility services, in the form of different models.
Despite the considerable increase in the roll-out of such services on an international level in recent years, some are still non-existent or not widely implemented in Barcelona. In fact, the study reveals that such services are not very often used.
BICING
13,6% BLA BLA CAR
11,1% UBER
5,5% AVANCAR
5,0% e-COOLTRA
1,5% CABIFY
1,3% SOCIAL CAR
1,1% NONE OF THEM
74,4%
Sam
ple:
3.004
inte
rview
s.USE OF MOBILITY SERVICES
The arrival of new mobility services
Multi-response
10 Creafutur 2017Citizens and mobility in Barcelona
Current situation and future prospects
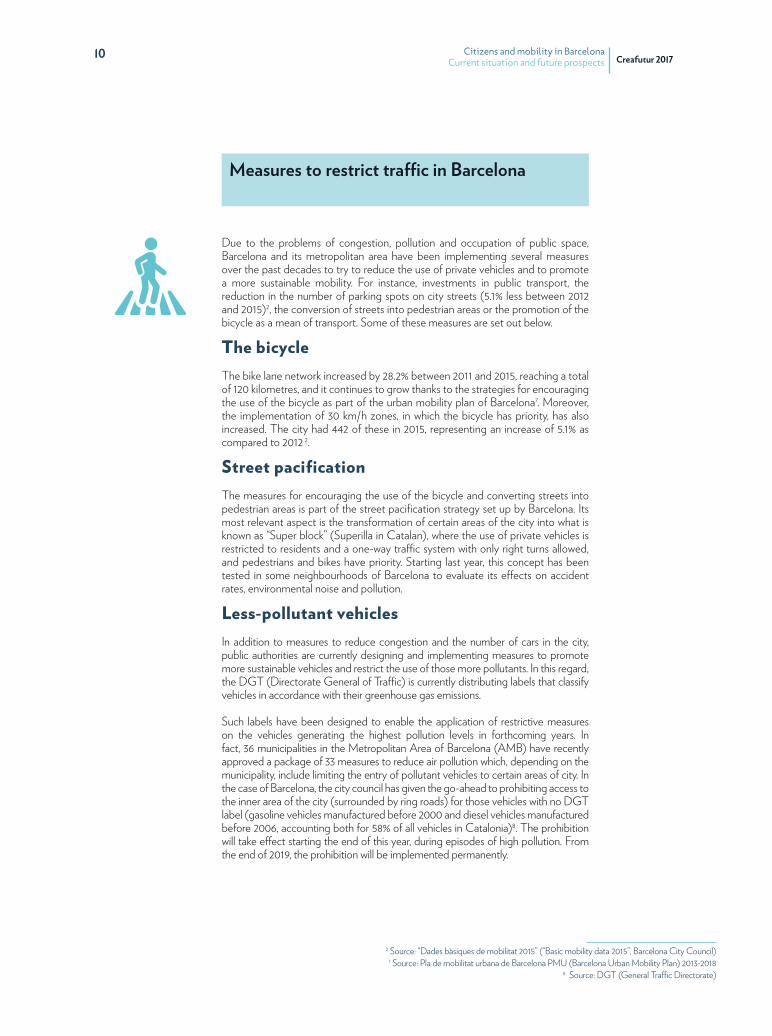
Measures to restrict traffic in Barcelona
Due to the problems of congestion, pollution and occupation of public space, Barcelona and its metropolitan area have been implementing several measures over the past decades to try to reduce the use of private vehicles and to promote a more sustainable mobility. For instance, investments in public transport, the reduction in the number of parking spots on city streets (5.1% less between 2012 and 2015)2, the conversion of streets into pedestrian areas or the promotion of the bicycle as a mean of transport. Some of these measures are set out below.
The bicycleThe bike lane network increased by 28.2% between 2011 and 2015, reaching a total of 120 kilometres, and it continues to grow thanks to the strategies for encouraging the use of the bicycle as part of the urban mobility plan of Barcelona7. Moreover, the implementation of 30 km/h zones, in which the bicycle has priority, has also increased. The city had 442 of these in 2015, representing an increase of 5.1% as compared to 2012 2.
Street pacificationThe measures for encouraging the use of the bicycle and converting streets into pedestrian areas is part of the street pacification strategy set up by Barcelona. Its most relevant aspect is the transformation of certain areas of the city into what is known as “Super block” (Superilla in Catalan), where the use of private vehicles is restricted to residents and a one-way traffic system with only right turns allowed, and pedestrians and bikes have priority. Starting last year, this concept has been tested in some neighbourhoods of Barcelona to evaluate its effects on accident rates, environmental noise and pollution.
Less-pollutant vehiclesIn addition to measures to reduce congestion and the number of cars in the city, public authorities are currently designing and implementing measures to promote more sustainable vehicles and restrict the use of those more pollutants. In this regard, the DGT (Directorate General of Traffic) is currently distributing labels that classify vehicles in accordance with their greenhouse gas emissions.
Such labels have been designed to enable the application of restrictive measures on the vehicles generating the highest pollution levels in forthcoming years. In fact, 36 municipalities in the Metropolitan Area of Barcelona (AMB) have recently approved a package of 33 measures to reduce air pollution which, depending on the municipality, include limiting the entry of pollutant vehicles to certain areas of city. In the case of Barcelona, the city council has given the go-ahead to prohibiting access to the inner area of the city (surrounded by ring roads) for those vehicles with no DGT label (gasoline vehicles manufactured before 2000 and diesel vehicles manufactured before 2006, accounting both for 58% of all vehicles in Catalonia)8. The prohibition will take effect starting the end of this year, during episodes of high pollution. From the end of 2019, the prohibition will be implemented permanently.
2 Source: “Dades bàsiques de mobilitat 2015” (“Basic mobility data 2015”, Barcelona City Council) 7 Source: Pla de mobilitat urbana de Barcelona PMU (Barcelona Urban Mobility Plan) 2013-2018
8 Source: DGT (General Traffic Directorate)
11
Multi-response
Businesses and employees’ mobility
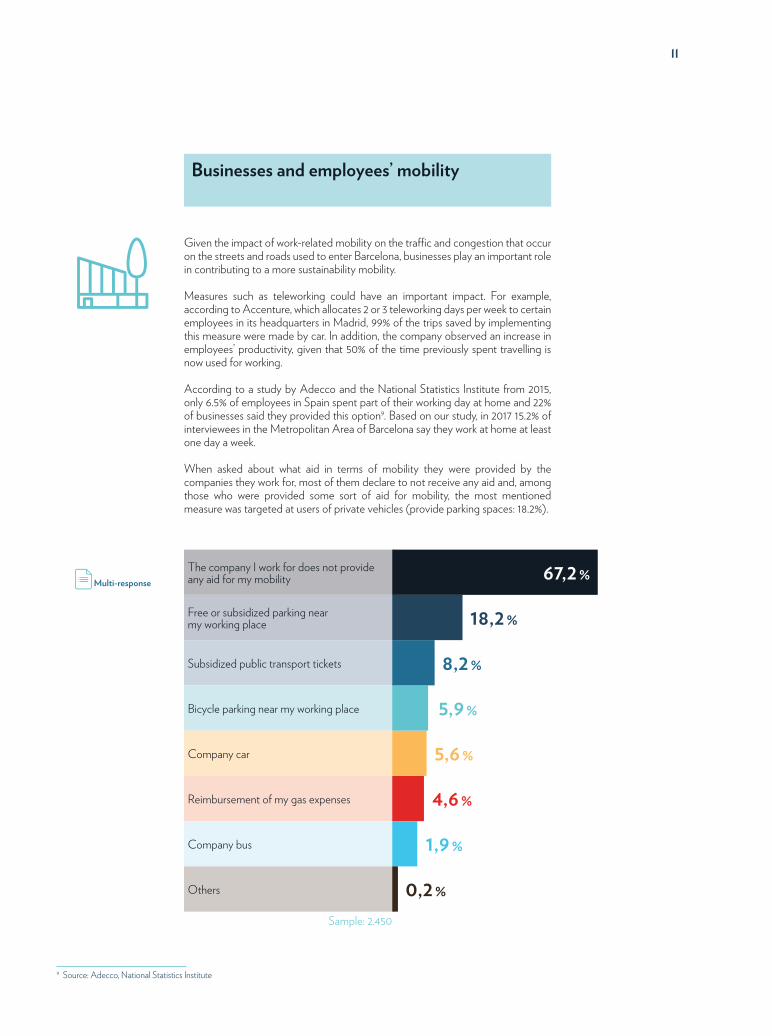
Given the impact of work-related mobility on the traffic and congestion that occur on the streets and roads used to enter Barcelona, businesses play an important role in contributing to a more sustainability mobility.
Measures such as teleworking could have an important impact. For example, according to Accenture, which allocates 2 or 3 teleworking days per week to certain employees in its headquarters in Madrid, 99% of the trips saved by implementing this measure were made by car. In addition, the company observed an increase in employees’ productivity, given that 50% of the time previously spent travelling is now used for working.
According to a study by Adecco and the National Statistics Institute from 2015, only 6.5% of employees in Spain spent part of their working day at home and 22% of businesses said they provided this option9. Based on our study, in 2017 15.2% of interviewees in the Metropolitan Area of Barcelona say they work at home at least one day a week.
When asked about what aid in terms of mobility they were provided by the companies they work for, most of them declare to not receive any aid and, among those who were provided some sort of aid for mobility, the most mentioned measure was targeted at users of private vehicles (provide parking spaces: 18.2%).
The company I work for does not provide any aid for my mobility
Free or subsidized parking near my working place
Subsidized public transport tickets
Bicycle parking near my working place
Company car
Reimbursement of my gas expenses
Company bus
Others
67,2 %
18,2 %
8,2 %
5,9 %
5,6 %
4,6 %
1,9 %
0,2 %Sample: 2.450
9 Source: Adecco, National Statistics Institute

12 Creafutur 2017Citizens and mobility in Barcelona
Current situation and future prospects
4 profiles have been identified, based on attitudes and behaviours related to mobility, sustainability and use of technology.
Older population segment, consisting of people who mainly use public transport and are very satisfied with its performance.
They do not normally have their own vehicle nor do they intend to purchase one.
They have internalized the sustainability concept and are therefore willing to change their mobility habits.
They are in favour of public authorities taking action to improve mobility in Barcelona.
New mobility services do not suit their travel needs.
A younger profile that is accustomed to using technological tools.
They use public transport very often and are satisfied with its performance.
They do not have their own vehicle and, if they do, they only use it from time to time.
They are in favour of restricting the use of vehicles in the city and prefer to use public transport and bicycle.
They are really environmentally aware and are willing to change their mobility habits and pay more for a non-pollutant vehicle.
They are receptive to new mobility services and have even used some of them.
A profile with a higher number of users who only use private vehicles.
They enjoy driving and use their cars every day.
They are very dissatisfied with public transport.
They are the ones who least value sustainability as a relevant factor for choosing a mean of transport.
They are not in favour of public authorities restricting the use of private cars in the city and they do not consider it necessary.
They have no intention of changing the way in which they travel.
They have a negative opinion of the alternatives offered by new mobility services.
They are mostly car users, but they consider public transport to be a good way to get around Barcelona.
They have doubts about the suitability of restricting the use of cars in Barcelona and of public intervention for that matter.
They would consider reducing the use of their car if public transport was improved.
This profile includes the highest number of commuters (people who live in Barcelona and work outside the city, or vice versa).
After the Eco-Tech group, it is the group where people are most receptive to using new mobility services.
Citizens’ profiles
Aware Adults Eco-Tech Car Lovers Undecided

13
15,2%
Sample of 3.004 interviews*. The percentages shown represent the addition of “Totally agree” and “Quite agree” answers.
TOTAL
More access roads and parking lots for the city of Barcelona should be built. 55% 52% 45% 54% 60%
Public transport is the best way to get around Barcelona. 71% 89% 88% 50% 76%
I am willing to change my mobility habits in order to contribute to a better city. 46% 75% 89% 16% 48%
Use of cars in Barcelona should be lower, even if they are electric. 37% 70% 79% 13% 35%
I think it is good that the public administration limits or prohibits certain mobility behaviours. 44% 75% 84% 14% 47%
I am willing to pay more for purchasing a non-pollutant car. 41% 56% 71% 17% 45%
More bike lanes should be built. 44% 62% 81% 19% 47%
I like trying new services that make my mobility easier. 39% 22% 75% 17% 45%
Attitudes and behaviours related to mobility, sustainability and use of technology.
46%7,2%
31,7%

14 Creafutur 2017Citizens and mobility in Barcelona
Current situation and future prospects
Future prospects
The far-reaching changes that are taking place and will continue to do so in the next few years in relation to the mobility outlook give rise to many uncertainties about the adaptation by citizens to the new scenario, such as whether there will be a reduction of the dependence on private vehicles; what impact the future traffic restrictions will have on the mobility patterns of citizens; to what extent new mobility services will be accepted, and whether businesses will implement measures regarding conciliation of working life and family life in order to help reduce traffic congestion.

15
WILL YOU HAVE A CAR IN 2027?
As we have seen, despite the fall in the number of car owners and driving licences holders in the years following the start of the economic crash, both variables have increased since 2014. This fact leads us to associate a great share of the evolution of these variables to the effect of the economic crash. This argument is strengthened by the observation in this study of the tie between citizens and private vehicles (and, in particular, cars) that still exists, even among the young population segment.
Generally speaking, there is no decrease in the intention to buy a car and citizens do not see themselves without a private vehicle in the future. If we observe the responses of the 18-29 age group compared to the other age groups on the sample, it has the highest number of people who are certain about having a car within 10 years (80%). It is also the age group in which people show the greatest attachment to their private car when asked whether they would lend it to another person or not.
As regards the profiles identified in this study, there was no apparent reduction in the intention of owning a car among the two most important segments: Car Lovers and Undecided. 74.1% and 70.9%, respectively, say they will certainly or probably have their own car in 2027.
Sample: Aware Adults (216); Eco-tech (456); Car Lovers (952); Undecided (1,381)
Certainly Probably I don’t know Probably not Certainly not
100 %
75%
50%
25%
0%
21,5%
21,7%
21,4%
12,9%
22,6%
37,3%
29,9%
15,8%
10,5%
6,6%
47%
27,1%
13,3%
6,1%6,5%
41,3% 41,1%
TOTAL
29,6% 28,3%
16,1% 15,6%
8,2% 8,2%4,8% 6,9%
The tie between users and vehicles persists
16 Creafutur 2017Citizens and mobility in Barcelona
Current situation and future prospects
0% 25% 50% 75% 100%
RELATIONSHIP WITH YOUR CAR
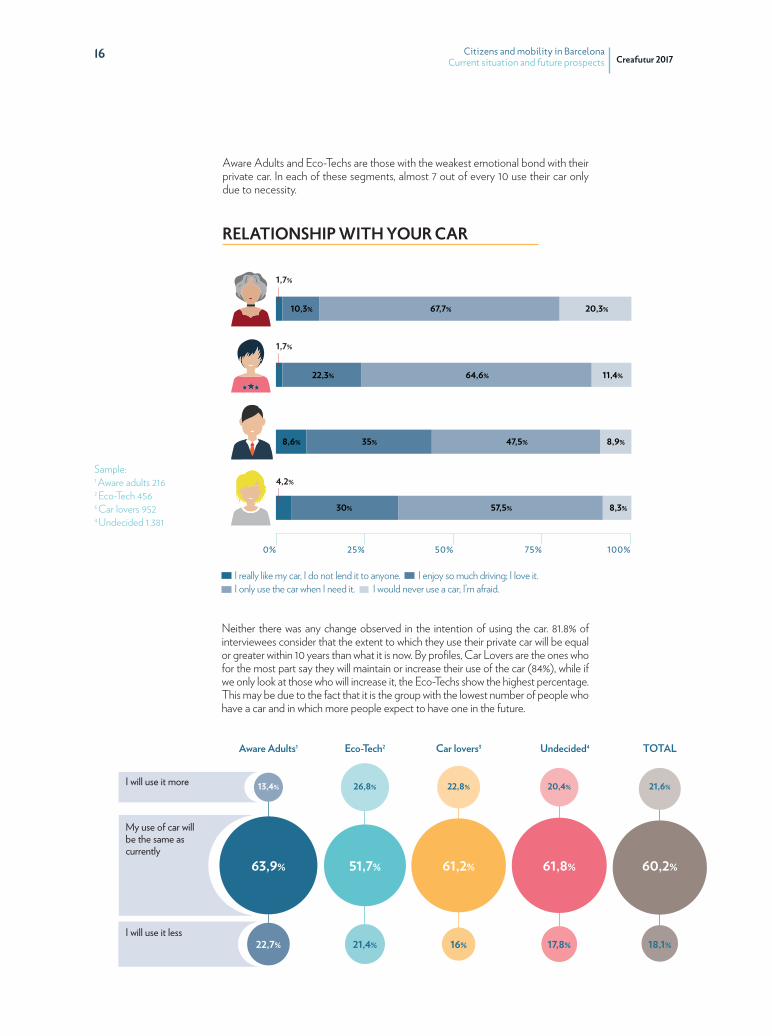
Neither there was any change observed in the intention of using the car. 81.8% of interviewees consider that the extent to which they use their private car will be equal or greater within 10 years than what it is now. By profiles, Car Lovers are the ones who for the most part say they will maintain or increase their use of the car (84%), while if we only look at those who will increase it, the Eco-Techs show the highest percentage. This may be due to the fact that it is the group with the lowest number of people who have a car and in which more people expect to have one in the future.
16%
13,4%
17,8%
26,8% 22,8% 20,4%
63,9% 51,7% 61,2% 61,8%
22,7% 21,4%
I will use it more
My use of car will be the same as currently
I will use it less
1,7%
1,7%
4,2%
I really like my car, I do not lend it to anyone. I enjoy so much driving; I love it. I only use the car when I need it. I would never use a car; I’m afraid.
10,3%
22,3%
35%
30%
20,3%
11,4%
8,9%8,6%
8,3%
67,7%
64,6%
47,5%
57,5%
Aware Adults and Eco-Techs are those with the weakest emotional bond with their private car. In each of these segments, almost 7 out of every 10 use their car only due to necessity.
Aware Adults1 Eco-Tech2 Car lovers3 Undecided4 TOTAL
Sample: 1 Aware adults 216 2 Eco-Tech 456 3 Car lovers 952 4 Undecided 1.381
18,1%
21,6%
60,2%
17
Multi-response
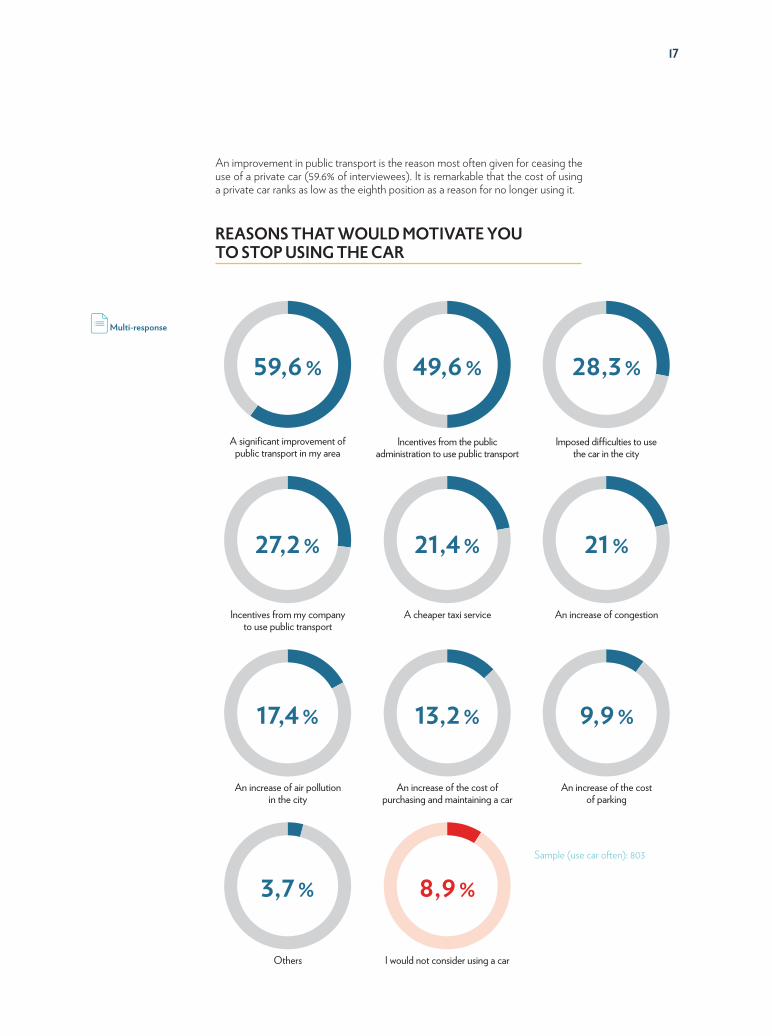
An improvement in public transport is the reason most often given for ceasing the use of a private car (59.6% of interviewees). It is remarkable that the cost of using a private car ranks as low as the eighth position as a reason for no longer using it.
Sample (use car often): 803
REASONS THAT WOULD MOTIVATE YOU TO STOP USING THE CAR
60+40J27+73J17+83J4+96J
50+50J22+78J13+87J9+91J
28+72J21+79J10+90J
A significant improvement of public transport in my area
Incentives from my company to use public transport
An increase of air pollution in the city
Others
Incentives from the public administration to use public transport
A cheaper taxi service
An increase of the cost of purchasing and maintaining a car
I would not consider using a car
Imposed difficulties to use the car in the city
An increase of congestion
An increase of the cost of parking
59,6 %
27,2 %
17,4 %
3,7 %
49,6 %
21,4 %
13,2 %
8,9 %
28,3 %
21 %
9,9 %
18 Creafutur 2017Citizens and mobility in Barcelona
Current situation and future prospects
Multi-response
Aware Adults
Undecided
Eco-Tech
Car lovers
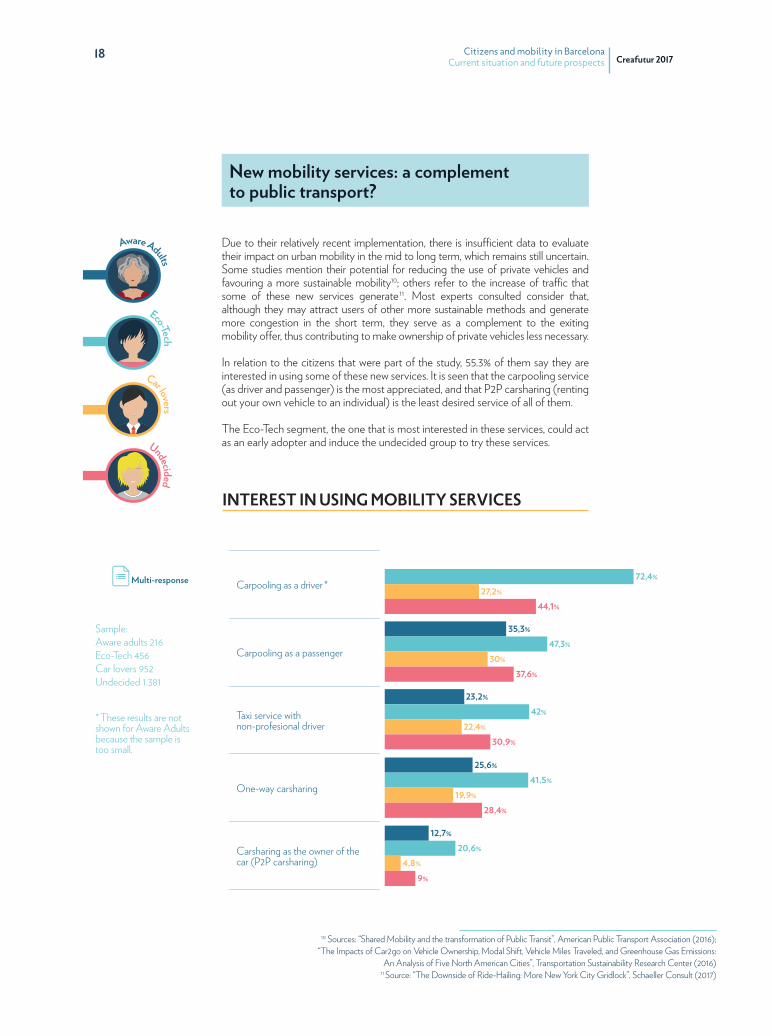
Due to their relatively recent implementation, there is insufficient data to evaluate their impact on urban mobility in the mid to long term, which remains still uncertain. Some studies mention their potential for reducing the use of private vehicles and favouring a more sustainable mobility10; others refer to the increase of traffic that some of these new services generate 11. Most experts consulted consider that, although they may attract users of other more sustainable methods and generate more congestion in the short term, they serve as a complement to the exiting mobility offer, thus contributing to make ownership of private vehicles less necessary.
In relation to the citizens that were part of the study, 55.3% of them say they are interested in using some of these new services. It is seen that the carpooling service (as driver and passenger) is the most appreciated, and that P2P carsharing (renting out your own vehicle to an individual) is the least desired service of all of them.
The Eco-Tech segment, the one that is most interested in these services, could act as an early adopter and induce the undecided group to try these services.
New mobility services: a complement to public transport?
INTEREST IN USING MOBILITY SERVICES
Carpooling as a driver *
Carpooling as a passenger
Taxi service with non-profesional driver
One-way carsharing
Carsharing as the owner of the car (P2P carsharing)
72,4%
27,2%
44,1%
35,3%
47,3%
30%
37,6%
23,2%
42%
22,4%
30,9%
25,6%
41,5%
19,9%
28,4%
12,7%
20,6%
4,8%
9%
* These results are not shown for Aware Adults because the sample is too small.
10 Sources: “Shared Mobility and the transformation of Public Transit”, American Public Transport Association (2016); “The Impacts of Car2go on Vehicle Ownership, Modal Shift, Vehicle Miles Traveled, and Greenhouse Gas Emissions:
An Analysis of Five North American Cities”, Transportation Sustainability Research Center (2016)
11 Source: “The Downside of Ride-Hailing: More New York City Gridlock”, Schaeller Consult (2017)
Sample: Aware adults 216 Eco-Tech 456 Car lovers 952 Undecided 1.381

19
Multi-response
Multi-response
The one-way carsharing service, along with carpooling, appear to be the services with the highest potential to replace private vehicles (only 44% of car owners say they need the car to travel every day), or as a complement to public transport (mostly in the Eco-Tech segment, followed by the Undecided).
It is worth mentioning that 24% of those who use their private car today think that a combination of these services would make them reconsider how they use their cars.
SERVICES THAT WOULD REPLACE THE CAR FOR REGULAR TRIPS
SERVICES THAT WOULD COMPLEMENT PUBLIC TRANSPORTATION FOR REGULAR TRIPS
One-way carsharing*
Carpooling*
One-way carsharing
Carpooling
55,3%
39%
50,4%
69,1%
31,5%
45,1%
21,3%
52,3%
30,4%
43,2%
35%
56,1%
20,3%
40,1%
20 Creafutur 2017Citizens and mobility in Barcelona
Current situation and future prospects
Multi-response
Multi-response
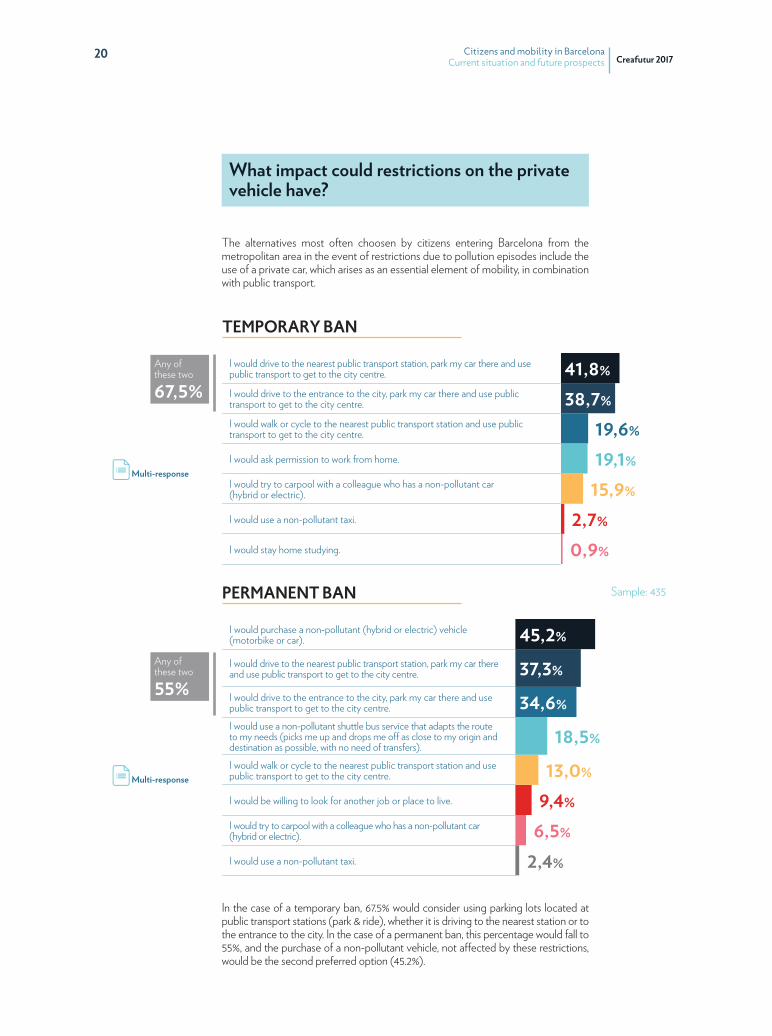
The alternatives most often choosen by citizens entering Barcelona from the metropolitan area in the event of restrictions due to pollution episodes include the use of a private car, which arises as an essential element of mobility, in combination with public transport.
What impact could restrictions on the private vehicle have?
In the case of a temporary ban, 67.5% would consider using parking lots located at public transport stations (park & ride), whether it is driving to the nearest station or to the entrance to the city. In the case of a permanent ban, this percentage would fall to 55%, and the purchase of a non-pollutant vehicle, not affected by these restrictions, would be the second preferred option (45.2%).
I would drive to the nearest public transport station, park my car there and use public transport to get to the city centre.
I would drive to the entrance to the city, park my car there and use public transport to get to the city centre.
I would walk or cycle to the nearest public transport station and use public transport to get to the city centre.
I would ask permission to work from home.
I would try to carpool with a colleague who has a non-pollutant car (hybrid or electric).
I would use a non-pollutant taxi.
I would stay home studying.
I would purchase a non-pollutant (hybrid or electric) vehicle (motorbike or car).
I would drive to the nearest public transport station, park my car there and use public transport to get to the city centre.
I would drive to the entrance to the city, park my car there and use public transport to get to the city centre.I would use a non-pollutant shuttle bus service that adapts the route to my needs (picks me up and drops me off as close to my origin and destination as possible, with no need of transfers).I would walk or cycle to the nearest public transport station and use public transport to get to the city centre.
I would be willing to look for another job or place to live.
I would try to carpool with a colleague who has a non-pollutant car (hybrid or electric).
I would use a non-pollutant taxi.
TEMPORARY BAN
PERMANENT BAN
19,6%
19,1%
15,9%
2,7%
0,9%
Sample: 435
41,8%
38,7%
Any of these two
55%
Any of these two
67,5%
45,2%
37,3%
34,6%
18,5%
13,0%
9,4%
6,5%
2,4%

21
Multi-response
As seen previously in the above section, most citizens say they receive no aid for mobility from their companies and, if they do, the most common aid is targeted at users with private vehicles (provision of parking space). The measures that companies could implement to promote a more sustainable mobility and prevent congestion during rush hours are of different types:
Reconsider the aid they provide to employees who use private cars: reimbursement of gas expenses, free parking or subsidised parking at the workplace, …
Promote alternative means of transport: corporate carsharing, subsidized public transport tickets, safe bicycle parking, company buses, carpooling, …
Flexible work schedules or teleworking, which avoid traveling during rush hours.
When being asked about measures for conciliating working life and family life, 54.1% of interviewees say that such measures are currently not implemented in their company, and 54.7% do not consider that such measures will be implemented in the future. On the contrary, almost all of them say they are in favour of such measures and the most preferred one is reducing the number of working days per week while maintaining the number of worked hours (34.3%).
The role of businesses in resolving mobility issues
16+37+47I47,5%
36,9%
15,6%
• My productivity would not be affected • It would boost my productivity • My productivity would decrease *Sample: 2.450
EXPECTED IMPACT ON PRODUCTIVITY
Likewise, employees have a positive perception of the impact working from home would have on their productivity (but only 22.5% think this measure will be implemented by their company in the future).
The company I work for doesn’t help me reconcile my working and familyFlexible schedules for entering and leaving workWork from home for one or more days a weekCompact the work week in less days (but working the same amount of hours)
None of them
Flexible schedules for entering and leaving workWork from home for one or more days a weekCompact the work week in less days (but working the same amount of hours)
None; I’ve got what I needFlexible schedules for entering and leaving workWork from home for one or more days a weekCompact the work week in less days (but working the same amount of hours)
Others
MEASURES TO HELP RECONCILE WORKING AND FAMILY LIFE
54,1%
40,2%
15,2% 4,9%
54,7%
31,3%
22,5% 10,3%2,0%
34,3%
2,5%
29,3% 30,7%
Current measures Measures expected to be implemented in the future Most desired measures to be
implemented

22 Creafutur 2017Citizens and mobility in Barcelona
Current situation and future prospects
Key Learnings
Car use and ownership
In general, no change in tendency is detected with respect to the willingness to own a car:
69.4% of interviewees believe they will own a car within 10 years, the same percentage of people as those who own one now.
Neither is any change in awareness observed in relation to the need of reducing the use of the car in the city:
55% are in favour of building more access roads and car parks in Barcelona.
81.8% think that they will use private cars to the same or a greater extent within 10 years.
69%of people in Barcelona still think they will have a car within 10 years
55%support building more access roads to Barcelona
41%of divers would use carpooling services
23
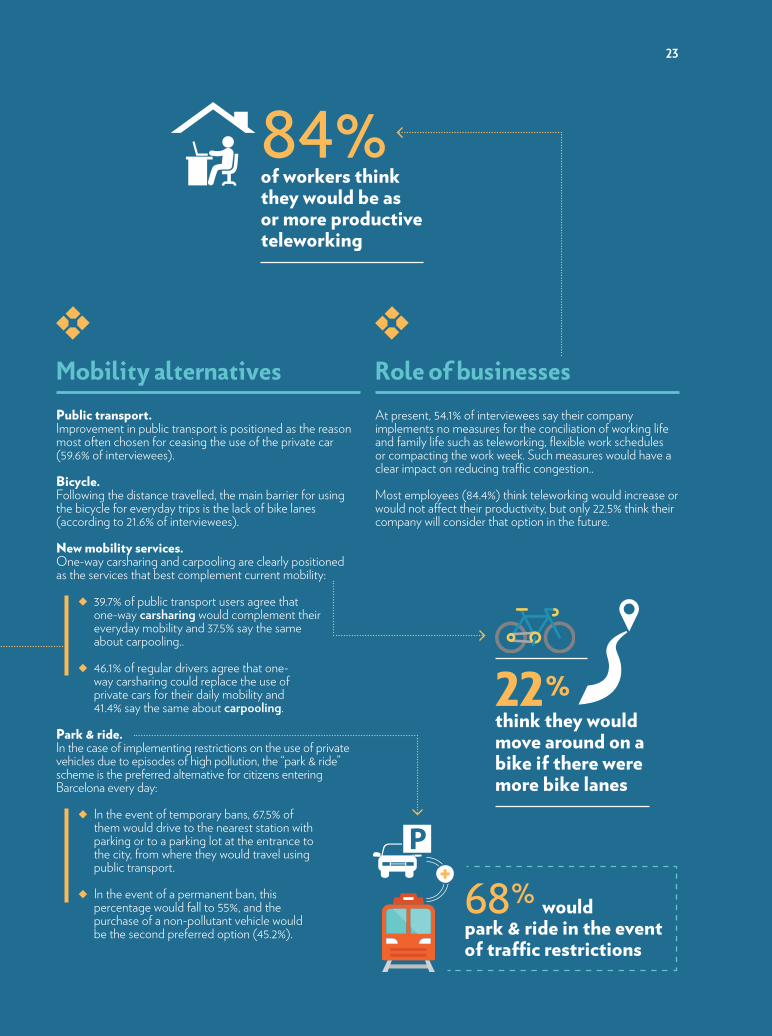
Mobility alternatives
Public transport. Improvement in public transport is positioned as the reason most often chosen for ceasing the use of the private car (59.6% of interviewees).
Bicycle. Following the distance travelled, the main barrier for using the bicycle for everyday trips is the lack of bike lanes (according to 21.6% of interviewees).
New mobility services. One-way carsharing and carpooling are clearly positioned as the services that best complement current mobility:
39.7% of public transport users agree that one-way carsharing would complement their everyday mobility and 37.5% say the same about carpooling..
46.1% of regular drivers agree that one-way carsharing could replace the use of private cars for their daily mobility and 41.4% say the same about carpooling.
Park & ride. In the case of implementing restrictions on the use of private vehicles due to episodes of high pollution, the “park & ride” scheme is the preferred alternative for citizens entering Barcelona every day:
In the event of temporary bans, 67.5% of them would drive to the nearest station with parking or to a parking lot at the entrance to the city, from where they would travel using public transport.
In the event of a permanent ban, this percentage would fall to 55%, and the purchase of a non-pollutant vehicle would be the second preferred option (45.2%).
Role of businesses
At present, 54.1% of interviewees say their company implements no measures for the conciliation of working life and family life such as teleworking, flexible work schedules or compacting the work week. Such measures would have a clear impact on reducing traffic congestion..
Most employees (84.4%) think teleworking would increase or would not affect their productivity, but only 22.5% think their company will consider that option in the future.
22 %think they would move around on a bike if there were more bike lanes
68 % would park & ride in the event of traffic restrictions
84%of workers think they would be as or more productive teleworking
24 Creafutur 2017Citizens and mobility in Barcelona
Current situation and future prospects
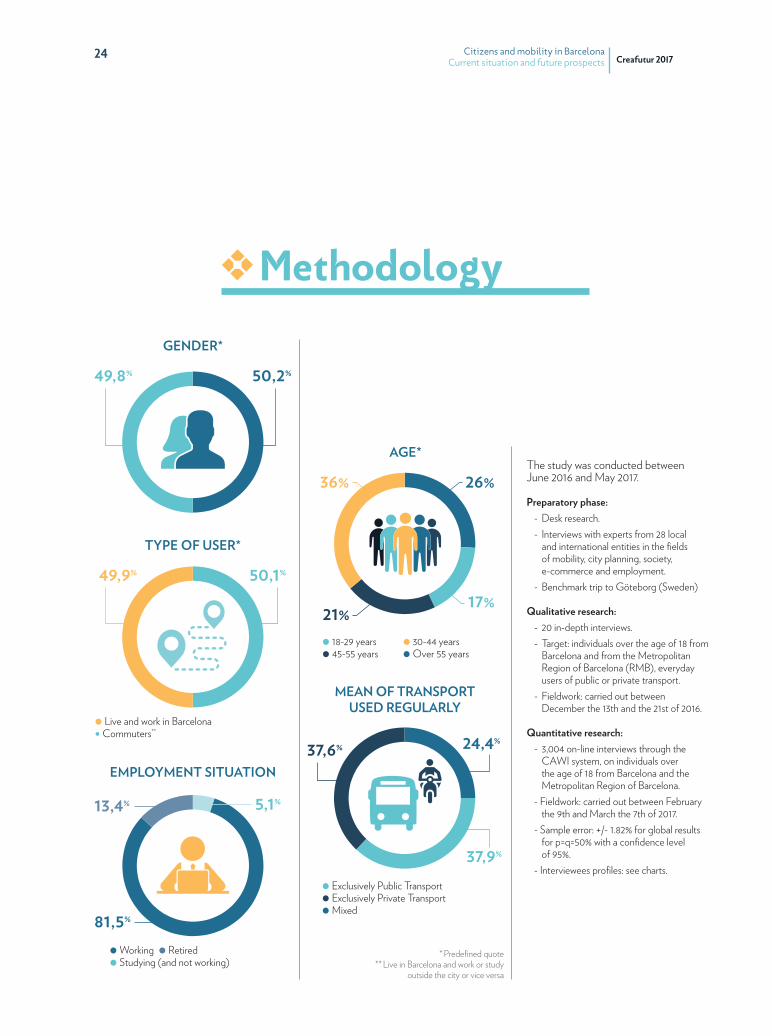
50+50J 26+17+21+36JThe study was conducted between June 2016 and May 2017.
Preparatory phase:- Desk research.- Interviews with experts from 28 local
and international entities in the fields of mobility, city planning, society, e-commerce and employment.
- Benchmark trip to Göteborg (Sweden) Qualitative research:
- 20 in-depth interviews.- Target: individuals over the age of 18 from
Barcelona and from the Metropolitan Region of Barcelona (RMB), everyday users of public or private transport.
- Fieldwork: carried out between December the 13th and the 21st of 2016.
Quantitative research:- 3,004 on-line interviews through the
CAWI system, on individuals over the age of 18 from Barcelona and the Metropolitan Region of Barcelona.
- Fieldwork: carried out between February the 9th and March the 7th of 2017.
- Sample error: +/- 1.82% for global results for p=q=50% with a confidence level of 95%.
- Interviewees profiles: see charts.
Methodology
TYPE OF USER*
AGE*
17%
26%36%
21%• 18-29 years • 30-44 years• 45-55 years • Over 55 years
• Live and work in Barcelona• Commuters**
50+50JGENDER*
49,8% 50,2%
49,9% 50,1%
25+37+38JMEAN OF TRANSPORT
USED REGULARLY
• Exclusively Public Transport• Exclusively Private Transport • Mixed
37,9%
37,6% 24,4%
* Predefined quote ** Live in Barcelona and work or study
outside the city or vice versa
• Working • Retired• Studying (and not working)
5+82+13J5,1%13,4%
81,5%
EMPLOYMENT SITUATION
Acknowledgements
Experts interviewed
Klaus BambergerWiener Linien Gmbh & Co KGIgnasi Gómez-Belinchón Railgrup
Oscar PuigdollersBarcelona Serveis Municipals
Jordi Fuster Barcelona Regiona
Antonio Cantalapiedra MyTaxi
Jaume Gomà Ulabox
Jose Manuel Jurado Villena CCOO
Joaquina Garrido Accenture
Mercedes Alonso Accenture
Carles Lloret Uber
Ildefonso Pastor Uber
Arnau Vilardell Som Mobilitat
Ricard Jornet Som Mobilitat
Orazio Corva Car2Go
Ángel Hernández Wazypark
Carlos Rodriguez Wazypark
Adrià Ramírez SHOTL
Manuel Molés Moovit
Yovav Meydad Moovit
Oriol Serra Nektria
Víctor Tejedo Nektria
Adam Cohen TSRC Berkeley
Gunnar NehrkeBundesverband Carsharing EVPhilipp Rode LSE Cities
Gabriele Grea Universitta L. Bocconi
Sampo Hietanen Whim
Judit Batayé OuiShare
Carlo Ratti MIT Senseable City Lab
Martin KruseCopenhaguen Institute for Future Studies
Vincent Rosso Investor
Hans Arby Ubigo
Christian Seiberlich Ubigo
Jan Hellaker Drive Sweeden
Malin Andersson City of Gothenburg
Jana Sochor Chalmers University
Helena Stromberg Chalmers University
Per-erik Holmberg Viktoria ICT
Steven Sarasini Viktoria ICT
Partners’ collaborators
Guillem Alsina AMB
Carles Conill AMB
Daniel Illa AMB
Carlos López Ajuntament de Barcelona
Oscar PuigdollersBarcelona Serveis Municipals
About CreafuturFundación Creafutur, an entity promoted by Generalitat de Catalunya (the Government of Catalonia) and by ESADE business school, acts as a bridge between the public and the private sectors. Its mission is to detect opportunities for innovation with a social and/or environmental impact, based on an analysis of the needs of consumers/citizens and economic, social and cultural trends. Its fields of specialisation are sustainable mobility, circular economy and social innovation. Published: June 2017
Carlos MurilloBarcelona Serveis Municipals
Ricard Fornesa Fundación Abertis
Josep Maria Mirmi Fundación Abertis
Diana Mesa SEAT
Arantxa Alonso SEAT
Carmen Tejedor SEAT
Josep Martínez Vila Saba
Joan Viaplana Saba
Pere Baulenas Clearchannel
Pedro Muntaner Clearchannel
Oriol Juncadella FGC
Jordi Quintana FGC
Lluís Puerto RACC
Martí Massot RACC
Miquel Roca RACC
Lluís Alegre ATM
Xavier Sanyer ATM
Cristina Pou ATM
Fernando Muñoz Repsol
Joan Ramirez Petrocat (Repsol)
Graphic Design
Aída de Miguel Alió Atypicas

@creafuturcom | [email protected]. (+34) 93.206.17.50www.creafutur.com


