Closing WoW ∆% WoW ∆ DSEX ↑ 6,244.5 1.0 61.7 Average Turnover, BDT Mn ↑ 4,777.2 11.7 500.3 Closing WoW ∆% WoW ∆, BDT Highest Gainer NAHEEACP 73.4 634.0 63.4 Highest Loser EMERALDOIL 18.2 (15.0) (3.2) Closing WoW ∆% % of Weekly Turnover Highest Turnover LAFSURCEML 69.9 28.7 8.3 CW LW % ∆ WoW WoW ∆ Turnover Weekly, BDT Billion 19.1 21.4 (2.3) Turnover Weekly, USD Million 231.3 258.9 (27.6) Weekly Trading Session 4 5 - (1) CW % ∆ WoW % ∆ YTD M Cap (Total), BDT Billion 4,228.9 USD Billion 51.2 Equiyt M Cap, BDT Billion 3,631.4 USD Billion 44.0 DSE Market Index (DSEX) and Turnover Trend Source: DSE, CBC Research City Bank Capital - Weekly Market Insight 24 December – 28 December 2017 DSE Market STAT YTD 2017 DSE Market Return (positive) 24%, DSEX up by 1208.5 points (10.6) 28.67 1.37 1.17 23.93 Market closed the last week of 2017 with positive movement gaining 58.1 points in last trading session of this year. In 2017 market return is positive 24.0% (1,208.5 points) against 8.8% return in 2016. Market reverse in this week from its bearish trend of the previous four weeks. The benchmark index DSEX gained (+0.5%) 31.4 points to closed at 6,244.5 points. Such moderate gain in market indices was backed by considerable gain in large cap stocks. Lafarge Surma Cement contributed most to keep the market positive due to the news of closing the acquisition deal with Holcim Cement Limited at Bangladesh Bank’s amended price of USD 708.57 per share. Currently the market is trading at trailing PE of 17.4x and PBV of 2.2x. The listed equities offer 12.3% ROE (trailing), 5.7% earnings yield, and 2.7% dividend yield. Free float share of the equity market stands at 41.0%. During the week Nahee Aluminum Composite Panel Limited (NAHEEACP), an engineering sector company with paid-up capital of 480.0 million got listed with the bourses on Sunday. The new comer topped the gainers chart with 780.0% gain; calculated based on weighted average price of BDT 88.0 and offer price of BDT 10.0 per share. Besides Alif Industries Limited (AIL) re-listed in main market from OTC and commenced its trade from today in “Z” category. The company gained 10.0% on first trading day; calculated based on closing price of BDT 143.0 and closing price of BDT 130.0 (traded at the OTC Market on 24 December 2017). The daily average turnover saw a healthy improvement and stood at BDT 4.8 billion (USD 57.8 million), 11.7% higher than the previous week. This week was cut short by one session due to public holyday on Monday, 25th December 2016. Sectors like bank, engineering, cement, textile, pharma & chemicals, food & allied, NBFIs and fuel & power hold the top position as turnover contributors. Lafarge Surma Cement Limited led the weekly turnover chart and contributed 8.3% of total weekly turnover (closed at BDT 69.9 per share with 28.7% weekly gain). Among the major sectors, cement (+15.9%), telco (+1.8%), bank (+1.7%) and fuel & power (+0.3%) were in the green zone; whereas ceramics (-1.3%), miscellaneous (-0.7%), IT (-0.6%), NBFIs (-0.4%) and engineering (-0.2%) faced most of the corrections. Stocks like Lafarge Surma Cement (+28.7%), Rupali Bank (+12.4%), Bangas (+12.2%) and Aziz Pipes (+8.8%) placed at weekly top gainer chart, whereas Emerald Oil (-15.0%), Sub 25% Convertible Bonds of BRAC Bank (-10.0%), Republic Insurance (-7.7%), Meghna Condensed Milk (-7.3%) and BBS Cables (-6.7%) faces most of the correction. Block trade contributed 8.6% to the total weekly turnover; where stocks like Olympic Industries (BDT 1,052.7 mn), Mercantile Bank (BDT 118.7 mn), City Bank (BDT 78.0 mn), Shahjibazar Power (BDT 71.8 mn), Grameenphone (BDT 52.4), British American Tobaco (BDT 51.0 mn), Ratanpur Steel Re-Rolling Mills (BDT 32.3 mn) and Confidence Cement (31.6 mn) dominated the block trade board. 3,800 3,950 4,100 4,250 4,400 4,550 4,700 4,850 5,000 5,150 5,300 5,450 5,600 5,750 5,900 6,050 6,200 6,350 6,500 30-Dec-14 30-Jan-15 28-Feb-15 31-Mar-15 30-Apr-15 31-May-15 30-Jun-15 31-Jul-15 31-Aug-15 30-Sep-15 31-Oct-15 30-Nov-15 31-Dec-15 31-Jan-16 29-Feb-16 31-Mar-16 30-Apr-16 31-May-16 30-Jun-16 31-Jul-16 31-Aug-16 30-Sep-16 31-Oct-16 30-Nov-16 31-Dec-16 31-Jan-17 28-Feb-17 31-Mar-17 30-Apr-17 31-May-17 30-Jun-17 31-Jul-17 31-Aug-17 30-Sep-17 31-Oct-17 30-Nov-17 DSEX DSEX, (30 Dec'14 to YTD'17 average)
Transcript
Closing WoW ∆% WoW ∆
DSEX ↑ 6,244.5 1.0 61.7
Average Turnover, BDT Mn ↑ 4,777.2 11.7 500.3
Closing WoW ∆% WoW ∆, BDT
Highest Gainer NAHEEACP 73.4 634.0 63.4
Highest Loser EMERALDOIL 18.2 (15.0) (3.2)
Closing WoW ∆%% of Weekly
Turnover
Highest Turnover LAFSURCEML 69.9 28.7 8.3
CW LW % ∆ WoW WoW ∆
Turnover Weekly, BDT Billion 19.1 21.4 (2.3)
Turnover Weekly, USD Million 231.3 258.9 (27.6)
Weekly Trading Session 4 5 - (1)
CW % ∆ WoW % ∆ YTD
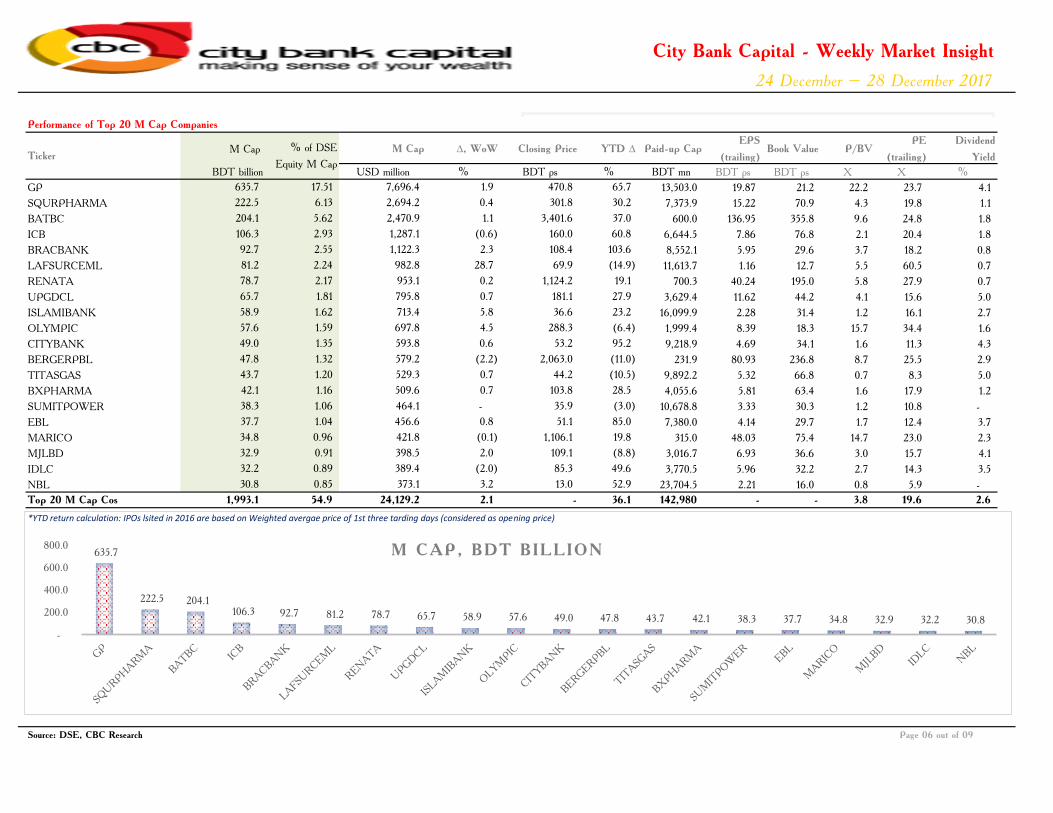
M Cap (Total), BDT Billion 4,228.9
USD Billion 51.2
Equiyt M Cap, BDT Billion 3,631.4
USD Billion 44.0
DSE Market Index (DSEX) and Turnover Trend
Source: DSE, CBC Research
City Bank Capital - Weekly Market Insight
24 December – 28 December 2017
DSE Market STAT
YTD 2017 DSE Market Return (positive) 24%, DSEX up by 1208.5 points
(10.6)
28.67 1.37
1.17 23.93
Market closed the last week of 2017 with positive movement gaining 58.1 points in last trading
session of this year. In 2017 market return is positive 24.0% (1,208.5 points) against 8.8% return in
2016.
Market reverse in this week from its bearish trend of the previous four weeks. The benchmark
index DSEX gained (+0.5%) 31.4 points to closed at 6,244.5 points. Such moderate gain in market
indices was backed by considerable gain in large cap stocks. Lafarge Surma Cement contributed
most to keep the market positive due to the news of closing the acquisition deal with Holcim
Cement Limited at Bangladesh Bank’s amended price of USD 708.57 per share.
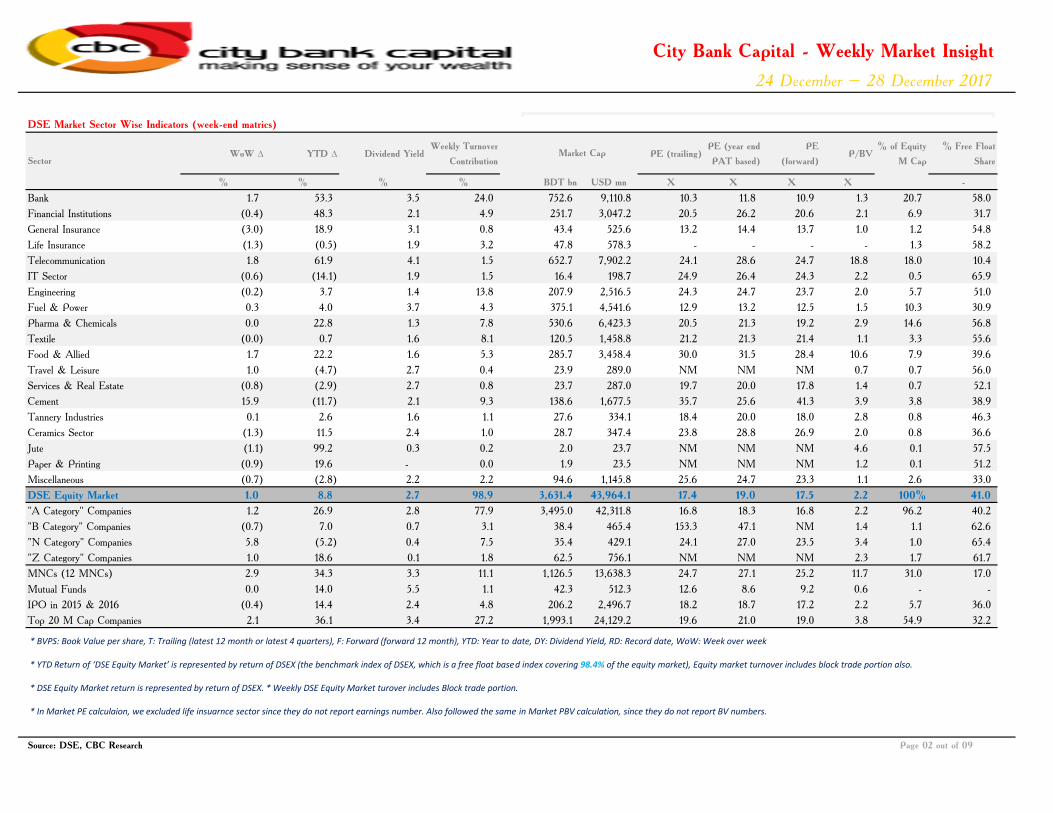
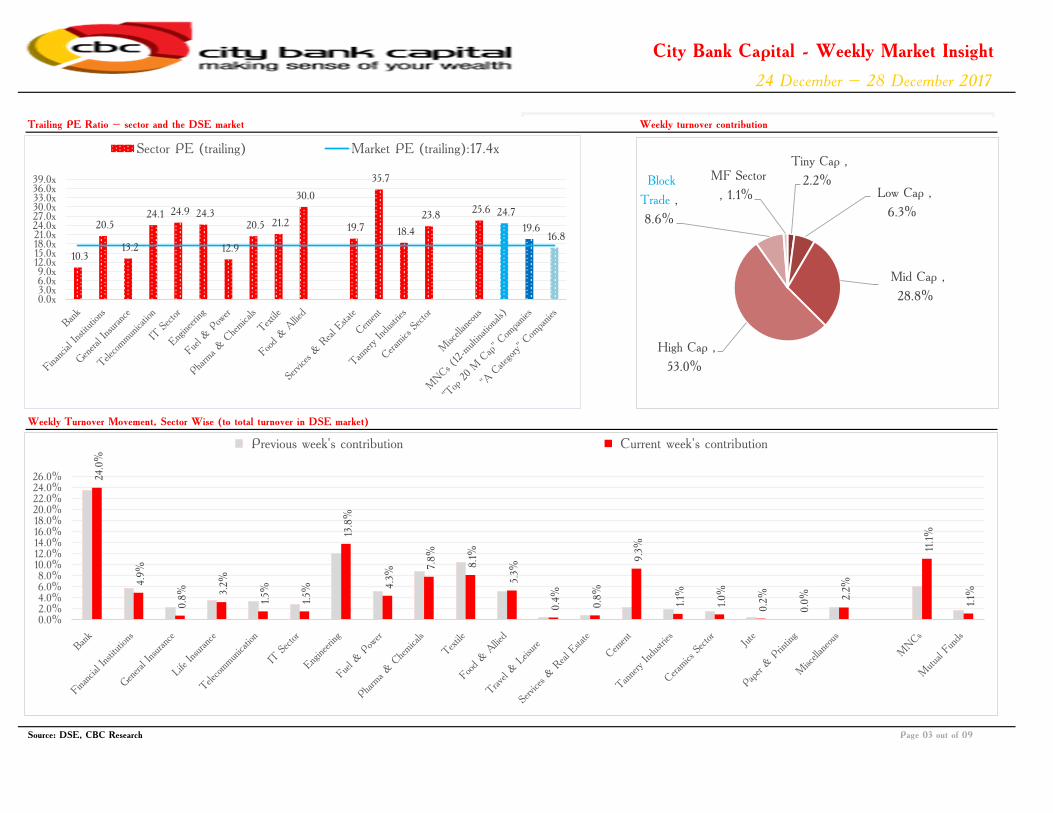
Currently the market is trading at trailing PE of 17.4x and PBV of 2.2x. The listed equities offer
12.3% ROE (trailing), 5.7% earnings yield, and 2.7% dividend yield. Free float share of the equity
market stands at 41.0%.
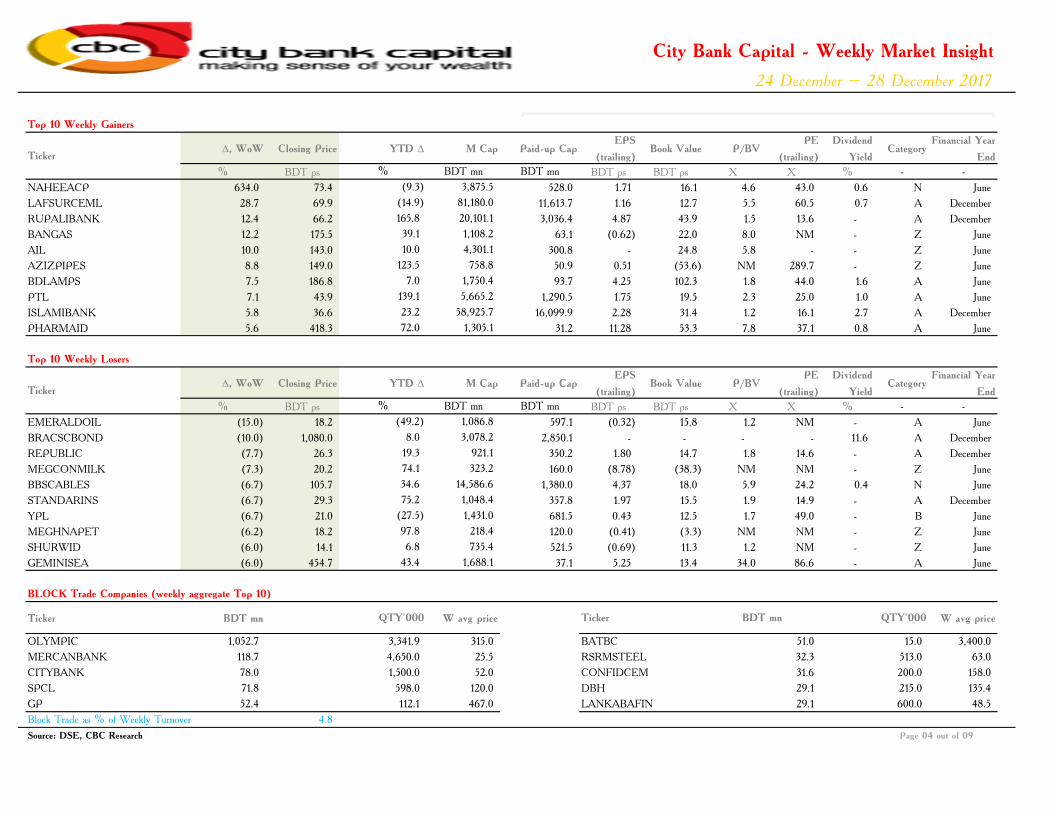
During the week Nahee Aluminum Composite Panel Limited (NAHEEACP), an engineering sector
company with paid-up capital of 480.0 million got listed with the bourses on Sunday. The new
comer topped the gainers chart with 780.0% gain; calculated based on weighted average price of
BDT 88.0 and offer price of BDT 10.0 per share. Besides Alif Industries Limited (AIL) re-listed in
main market from OTC and commenced its trade from today in “Z” category. The company gained
10.0% on first trading day; calculated based on closing price of BDT 143.0 and closing price of
BDT 130.0 (traded at the OTC Market on 24 December 2017).
The daily average turnover saw a healthy improvement and stood at BDT 4.8 billion (USD 57.8
million), 11.7% higher than the previous week. This week was cut short by one session due topublic holyday on Monday, 25th December 2016. Sectors like bank, engineering, cement, textile,
pharma & chemicals, food & allied, NBFIs and fuel & power hold the top position as turnover
contributors. Lafarge Surma Cement Limited led the weekly turnover chart and contributed 8.3%
of total weekly turnover (closed at BDT 69.9 per share with 28.7% weekly gain).
Among the major sectors, cement (+15.9%), telco (+1.8%), bank (+1.7%) and fuel & power
(+0.3%) were in the green zone; whereas ceramics (-1.3%), miscellaneous (-0.7%), IT (-0.6%),
NBFIs (-0.4%) and engineering (-0.2%) faced most of the corrections.
Stocks like Lafarge Surma Cement (+28.7%), Rupali Bank (+12.4%), Bangas (+12.2%) and Aziz
Pipes (+8.8%) placed at weekly top gainer chart, whereas Emerald Oil (-15.0%), Sub 25%
Convertible Bonds of BRAC Bank (-10.0%), Republic Insurance (-7.7%), Meghna Condensed
Milk (-7.3%) and BBS Cables (-6.7%) faces most of the correction.
Block trade contributed 8.6% to the total weekly turnover; where stocks like Olympic Industries
(BDT 1,052.7 mn), Mercantile Bank (BDT 118.7 mn), City Bank (BDT 78.0 mn), Shahjibazar
Power (BDT 71.8 mn), Grameenphone (BDT 52.4), British American Tobaco (BDT 51.0 mn),
Ratanpur Steel Re-Rolling Mills (BDT 32.3 mn) and Confidence Cement (31.6 mn) dominated the
YTD 2017 DSE Market Return (positive) 24%, DSEX up by 1208.5 points Market closed the last week of 2017 with positive movement gaining 58.1 points in last trading
* BVPS: Book Value per share, T: Trailing (latest 12 month or latest 4 quarters), F: Forward (forward 12 month), YTD: Year to date, DY: Dividend Yield, RD: Record date, WoW: Week over week
* YTD Return of ‘DSE Equity Market’ is represented by return of DSEX (the benchmark index of DSEX, which is a free float based index covering 98.4% of the equity market), Equity market turnover includes block trade portion also.
* DSE Equity Market return is represented by return of DSEX. * Weekly DSE Equity Market turover includes Block trade portion.
* In Market PE calculaion, we excluded life insuarnce sector since they do not report earnings number. Also followed the same in Market PBV calculation, since they do not report BV numbers.
City Bank Capital - Weekly Market Insight
24 December – 28 December 2017
YTD 2017 DSE Market Return (positive) 24%, DSEX up by 1208.5 points Market closed the last week of 2017 with positive movement gaining 58.1 points in last tradingTrailing PE Ratio – sector and the DSE market
Page 03 out of 09
Weekly Turnover Movement, Sector Wise (to total turnover in DSE market)
Previous week's contribution Current week's contribution
City Bank Capital - Weekly Market Insight
24 December – 28 December 2017
YTD 2017 DSE Market Return (positive) 24%, DSEX up by 1208.5 points Market closed the last week of 2017 with positive movement gaining 58.1 points in last trading
∆, WoW Closing Price YTD ∆ M Cap Paid-up CapEPS
(trailing)Book Value P/BV
PE
(trailing)
Dividend
YieldCategory
Financial Year
End
% BDT ps % BDT mn BDT mn BDT ps BDT ps X X % - -
NAHEEACP 634.0 73.4 (9.3) 3,875.5 528.0 1.71 16.1 4.6 43.0 0.6 N June
LAFSURCEML 28.7 69.9 (14.9) 81,180.0 11,613.7 1.16 12.7 5.5 60.5 0.7 A December
RUPALIBANK 12.4 66.2 165.8 20,101.1 3,036.4 4.87 43.9 1.5 13.6 - A December
BANGAS 12.2 175.5 39.1 1,108.2 63.1 (0.62) 22.0 8.0 NM - Z June
AIL 10.0 143.0 10.0 4,301.1 300.8 - 24.8 5.8 - - Z June
AZIZPIPES 8.8 149.0 123.5 758.8 50.9 0.51 (53.6) NM 289.7 - Z June
BDLAMPS 7.5 186.8 7.0 1,750.4 93.7 4.25 102.3 1.8 44.0 1.6 A June
PTL 7.1 43.9 139.1 5,665.2 1,290.5 1.75 19.5 2.3 25.0 1.0 A June
ISLAMIBANK 5.8 36.6 23.2 58,925.7 16,099.9 2.28 31.4 1.2 16.1 2.7 A December
PHARMAID 5.6 418.3 72.0 1,305.1 31.2 11.28 53.3 7.8 37.1 0.8 A June
∆, WoW Closing Price YTD ∆ M Cap Paid-up CapEPS
(trailing)Book Value P/BV
PE
(trailing)
Dividend
YieldCategory
Financial Year
End
% BDT ps % BDT mn BDT mn BDT ps BDT ps X X % - -
EMERALDOIL (15.0) 18.2 (49.2) 1,086.8 597.1 (0.32) 15.8 1.2 NM - A June
BRACSCBOND (10.0) 1,080.0 8.0 3,078.2 2,850.1 - - - - 11.6 A December
REPUBLIC (7.7) 26.3 19.3 921.1 350.2 1.80 14.7 1.8 14.6 - A December
MEGCONMILK (7.3) 20.2 74.1 323.2 160.0 (8.78) (38.3) NM NM - Z June
BBSCABLES (6.7) 105.7 34.6 14,586.6 1,380.0 4.37 18.0 5.9 24.2 0.4 N June
STANDARINS (6.7) 29.3 75.2 1,048.4 357.8 1.97 15.5 1.9 14.9 - A December
YPL (6.7) 21.0 (27.5) 1,431.0 681.5 0.43 12.5 1.7 49.0 - B June
MEGHNAPET (6.2) 18.2 97.8 218.4 120.0 (0.41) (3.3) NM NM - Z June
SHURWID (6.0) 14.1 6.8 735.4 521.5 (0.69) 11.3 1.2 NM - Z June
GEMINISEA (6.0) 454.7 43.4 1,688.1 37.1 5.25 13.4 34.0 86.6 - A June
Ticker BDT mn W avg price W avg price
OLYMPIC 1,052.7 315.0 3,400.0
MERCANBANK 118.7 25.5 63.0
CITYBANK 78.0 52.0 158.0
SPCL 71.8 120.0 135.4
GP 52.4 467.0 48.5
Block Trade as % of Weekly Turnover 4.8
BLOCK Trade Companies (weekly aggregate Top 10)
QTY'000
3,341.9
4,650.0
1,500.0
598.0
Ticker
BATBC
RSRMSTEEL
CONFIDCEM
DBH
51.0
32.3
31.6
29.1
29.1
15.0
513.0
215.0
600.0
Source: DSE, CBC Research Page 04 out of 09
112.1 LANKABAFIN
QTY'000BDT mn
200.0
Top 10 Weekly Gainers
Top 10 Weekly Losers
Ticker
Ticker
City Bank Capital - Weekly Market Insight
24 December – 28 December 2017
YTD 2017 DSE Market Return (positive) 24%, DSEX up by 1208.5 points Market closed the last week of 2017 with positive movement gaining 58.1 points in last trading
∆, WoW Closing Price YTD ∆ M Cap Paid-up CapEPS
(trailing)Book Value P/BV
PE
(trailing)
Dividend
Yield
BDT mn % of DSE % BDT ps % BDT bn BDT mn BDT ps BDT ps X X %
Top 30 Turnover Cos 9,633.7 50.4 3.0 - 4,307.9 1,548.5 186,915.9 - - 3.1 17.9 2.9
Weekly Turnover
Source: DSE, CBC Research Page 05 out of 09
Top 30 Turonover Companies (weekly aggregate)
Ticker
*BVPS: Book Value per share, T: Trailing (latest 12 month or latest 4 quarters), F: Forward (forward 12 month), YTD: Year to date, DY: Dividend Yield, RD: Record date, WoW: Week over week
City Bank Capital - Weekly Market Insight
24 December – 28 December 2017
YTD 2017 DSE Market Return (positive) 24%, DSEX up by 1208.5 points Market closed the last week of 2017 with positive movement gaining 58.1 points in last trading
M Cap, M Cap ∆, WoW Closing Price YTD ∆ Paid-up CapEPS
(trailing)Book Value P/BV
PE
(trailing)
Dividend
Yield
BDT billion USD million % BDT ps % BDT mn BDT ps BDT ps X X %
*YTD return calculation: IPOs lsited in 2016 are based on Weighted avergae price of 1st three tarding days (considered as opening price)
City Bank Capital - Weekly Market Insight
24 December – 28 December 2017
YTD 2017 DSE Market Return (positive) 24%, DSEX up by 1208.5 points Market closed the last week of 2017 with positive movement gaining 58.1 points in last trading
∆, WoW Closing Price YTD ∆ M Cap Paid-up CapEPS
(trailing)Book Value P/BV
PE
(trailing)
Dividend
YieldCategory
Financial Year
End
% BDT ps % BDT mn BDT mn BDT ps BDT ps X X % - -
IFADAUTOS (0.5) 126.0 75.1 28,406.2 2,254.5 5.63 33.7 3.7 22.4 0.4 A June
BSRMLTD (4.3) 98.8 (14.8) 21,203.2 2,146.1 3.62 51.5 1.9 27.3 0.9 A June
SHASHADNIM 1.1 61.7 (9.9) 7,376.5 1,195.5 5.04 45.8 1.3 12.2 1.9 A June
UPGDCL 0.7 181.1 27.9 65,729.3 3,629.4 11.62 44.2 4.1 15.6 5.0 A June
KDSALTD (0.1) 66.6 (20.0) 4,000.0 600.6 2.10 25.2 2.6 31.8 1.4 A June
ZAHEENSPIN 3.2 22.6 37.5 2,227.3 985.5 1.24 12.7 1.8 18.2 - A June
SIMTEX (0.3) 29.4 50.4 1,938.0 659.2 2.41 21.9 1.3 12.2 0.6 A June
REGENTTEX (1.4) 20.7 21.8 2,390.9 1,155.0 1.23 30.4 0.7 16.8 2.2 A June
OAL (1.0) 20.4 (13.7) 3,144.0 1,541.2 1.09 15.0 1.4 18.7 - A June
CNATEX 1.2 8.7 (22.3) 2,082.0 2,393.2 0.58 15.2 0.6 15.1 - Z June
AMANFEED - 63.6 1.7 7,387.8 1,161.6 4.26 32.2 2.0 14.9 2.9 A June
TOSRIFA 4.5 25.5 24.4 1,610.8 631.7 1.23 33.6 0.8 20.7 3.9 A June
NFML (1.1) 18.0 (3.4) 1,452.7 807.1 0.98 12.9 1.4 18.3 - A June
ITC 0.9 35.5 (21.9) 3,693.8 1,040.5 1.07 15.8 2.2 33.3 1.6 A June
DSSL 1.2 17.1 9.3 2,261.5 1,322.5 1.10 14.3 1.2 15.6 - A June
DOREENPWR (2.8) 114.2 22.8 12,059.5 1,056.0 7.52 35.1 3.3 15.2 0.2 A June
BNICL (3.4) 19.8 5.9 876.2 442.5 1.65 26.9 0.7 12.0 5.1 A December
ACMELAB (1.4) 114.0 15.2 24,122.6 2,116.0 6.81 82.1 1.4 16.7 3.1 A June
ETL 0.6 16.4 (4.6) 2,597.8 1,584.0 1.18 16.5 1.0 13.9 - A June
YPL (6.7) 21.0 (27.5) 1,431.0 681.5 0.43 12.5 1.7 49.0 - B June
FORTUNE (0.3) 39.7 (12.5) 4,313.0 1,086.4 1.89 14.0 2.8 21.1 - N June
PDL (1.0) 19.6 (18.9) 2,491.7 1,271.3 1.34 15.7 1.3 14.6 - N June
SHEPHERD (2.7) 28.5 (41.0) 3,893.9 1,366.3 1.08 16.9 1.7 26.3 - A June
NURANI - 18.7 (1.1) 1,707.3 913.0 1.35 12.0 1.6 13.9 - N June
BBSCABLES (6.7) 105.7 34.6 14,586.6 1,380.0 4.37 18.0 5.9 24.2 0.4 N June
AAMRANET (2.3) 97.7 (29.2) 5,182.1 530.4 3.82 31.0 3.1 25.6 1.0 N June
OIMEX (5.2) 65.2 (37.2) 3,291.4 504.8 1.50 16.1 4.1 43.5 - N June
NAHEEACP 634.0 73.4 (9.3) 3,875.5 528.0 1.71 16.1 4.6 43.0 0.6 N June
YTD 2017 DSE Market Return (positive) 24%, DSEX up by 1208.5 points Market closed the last week of 2017 with positive movement gaining 58.1 points in last trading
YTD 2017 DSE Market Return (positive) 24%, DSEX up by 1208.5 points Market closed the last week of 2017 with positive movement gaining 58.1 points in last trading
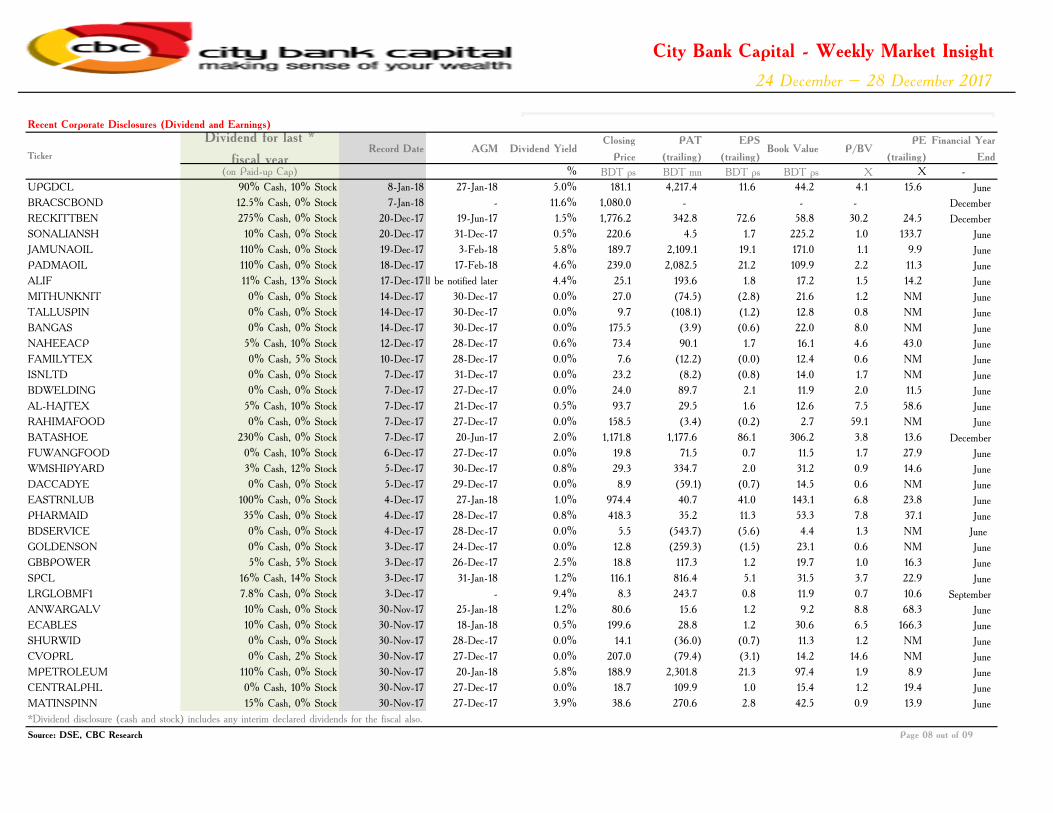
Recent Corporate Disclosures (Dividend and Earnings)
5% Cash, 10% Stock
0% Cash, 0% Stock
230% Cash, 0% Stock
0% Cash, 10% Stock
3% Cash, 12% Stock
0% Cash, 0% Stock
0% Cash, 2% Stock
110% Cash, 0% Stock
0% Cash, 0% Stock
100% Cash, 0% Stock
35% Cash, 0% Stock
0% Cash, 0% Stock
0% Cash, 0% Stock
0% Cash, 0% Stock
5% Cash, 10% Stock
0% Cash, 5% Stock
0% Cash, 0% Stock
0% Cash, 0% Stock
110% Cash, 0% Stock
110% Cash, 0% Stock
11% Cash, 13% Stock
0% Cash, 0% Stock
0% Cash, 0% Stock
0% Cash, 10% Stock
5% Cash, 5% Stock
16% Cash, 14% Stock
7.8% Cash, 0% Stock
10% Cash, 0% Stock
10% Cash, 0% Stock
15% Cash, 0% Stock
Source: DSE, CBC Research
*Dividend disclosure (cash and stock) includes any interim declared dividends for the fiscal also.
City Bank Capital - Weekly Market Insight
24 December – 28 December 2017
YTD 2017 DSE Market Return (positive) 24%, DSEX up by 1208.5 points Market closed the last week of 2017 with positive movement gaining 58.1 points in last trading
DISCLAIMER
This message is intended only for the use of the individual or entity to which it is addressed and may contain information which is privileged, confidential, proprietary, or exempt from disclosure under applicable law. If you are not
the intended recipient or the person responsible for delivering the message to the intended recipient, you are strictly prohibited from disclosing, distributing, copying, or in any way using this message. If you have received this
communication in error, please notify the sender and destroy and delete any copies you may have received. Further, the estimates and projections herein are our own and are based on assumptions that we believe to be reasonable.
Information presented herein, while obtained from sources we believe to be reliable, is not guaranteed either as to accuracy or completeness. Neither the information nor any opinion expressed herein constitutes a solicitation of the
purchase or sale of any security. As it acts for public companies from time to time, City Bank Capital may have a relationship with the above mentioned company(s). This report is intended for distribution in only those jurisdictions
in which City Bank Capital is registered. Re-distribution of this report in any format, to any recipient other than initially intended by the Firm, is strictly prohibited.”