Enterprise Energy Management System (EEMS) Strategic Assessment Energy Forum Overview
• Welcome City of Boston Energy Stakeholders
• Overview
• Introductions
• Energy Forum Agenda
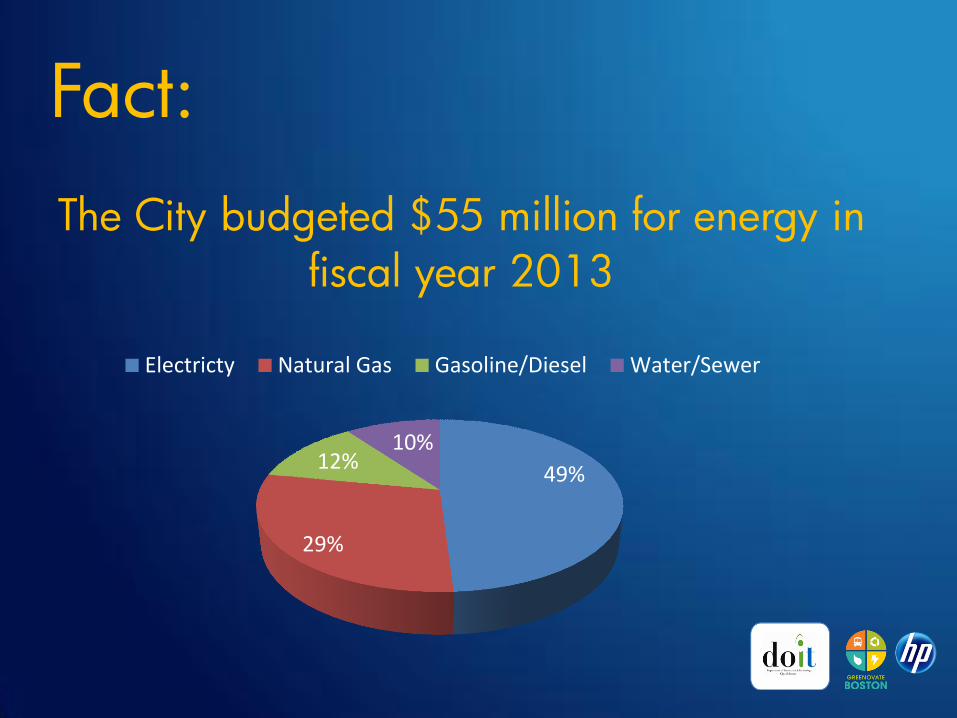
Fact:
49%
29%
12% 10%
Electricty Natural Gas Gasoline/Diesel Water/Sewer
The City budgeted $55 million for energy in
fiscal year 2013
EEMS Strategic Assessment
Energy Forum Overview
Goal: Evaluate how the City consumes energy, what that consumption costs, and how Information Technology can lower the City’s energy costs and greenhouse gas emissions.
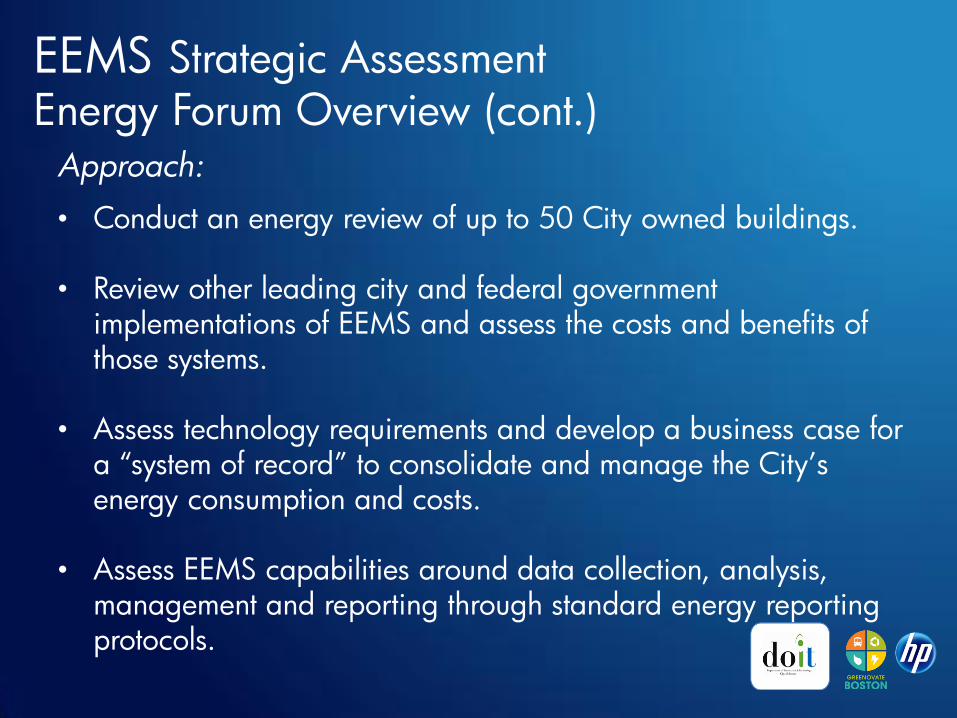
Approach:
• Conduct an energy review of up to 50 City owned buildings. • Review other leading city and federal government
implementations of EEMS and assess the costs and benefits of those systems.
• Assess technology requirements and develop a business case for a “system of record” to consolidate and manage the City’s energy consumption and costs.
• Assess EEMS capabilities around data collection, analysis, management and reporting through standard energy reporting protocols.
EEMS Strategic Assessment Energy Forum Overview (cont.)
P
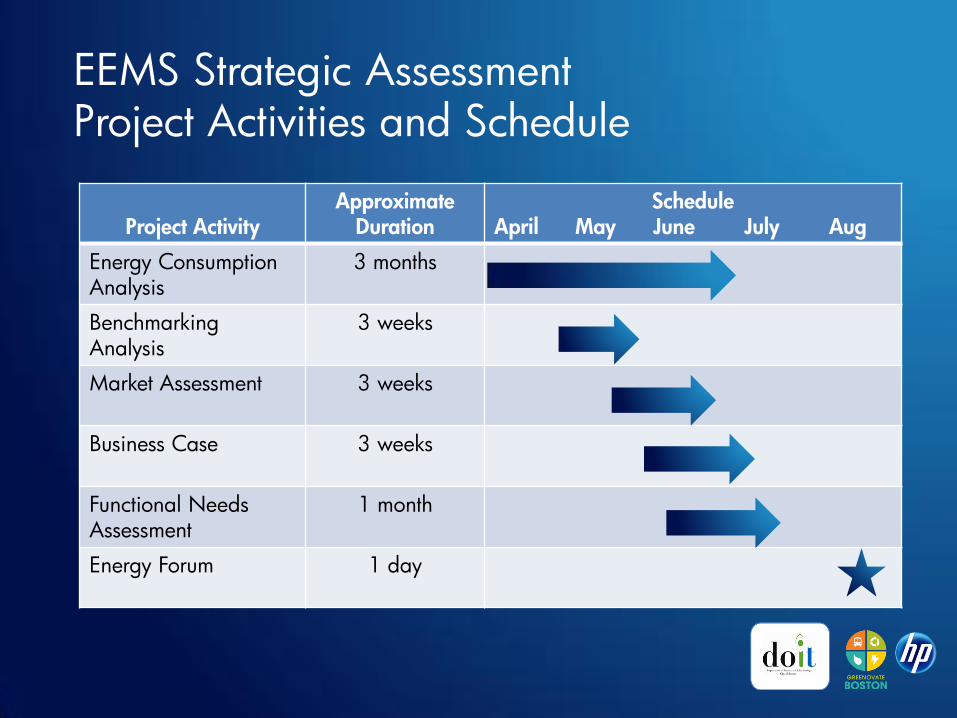
Project Activity Approximate
Duration Schedule
April May June July Aug
Energy Consumption Analysis
3 months
Benchmarking Analysis
3 weeks
Market Assessment
3 weeks
Business Case
3 weeks
Functional Needs Assessment
1 month
Energy Forum
1 day
EEMS Strategic Assessment Project Activities and Schedule
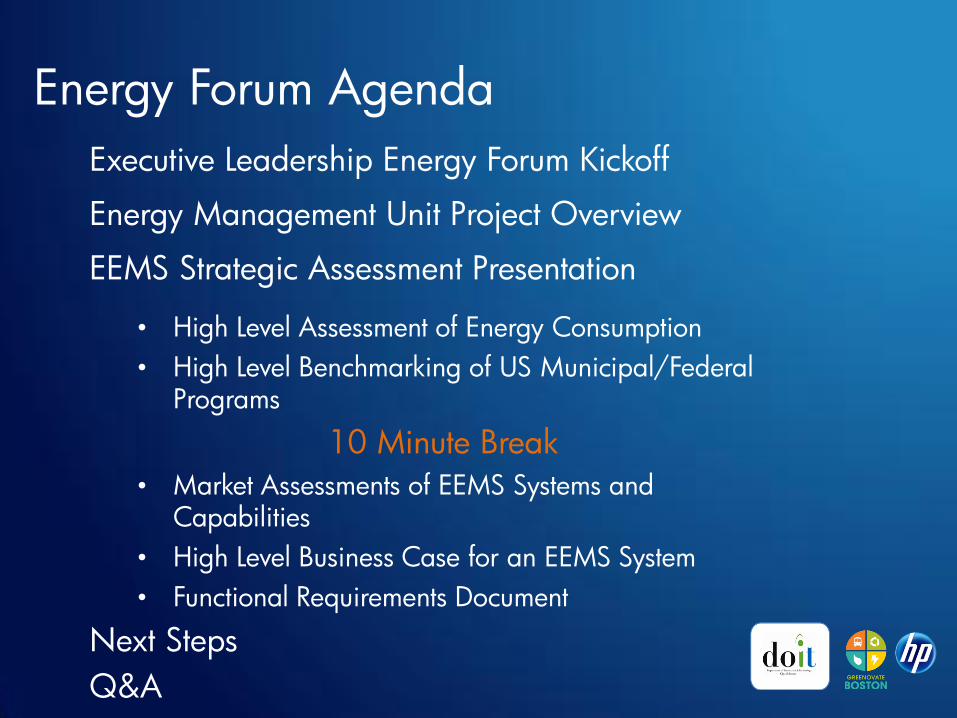
• High Level Benchmarking of US Municipal/Federal Programs
10 Minute Break
• Market Assessments of EEMS Systems and Capabilities
• High Level Business Case for an EEMS System
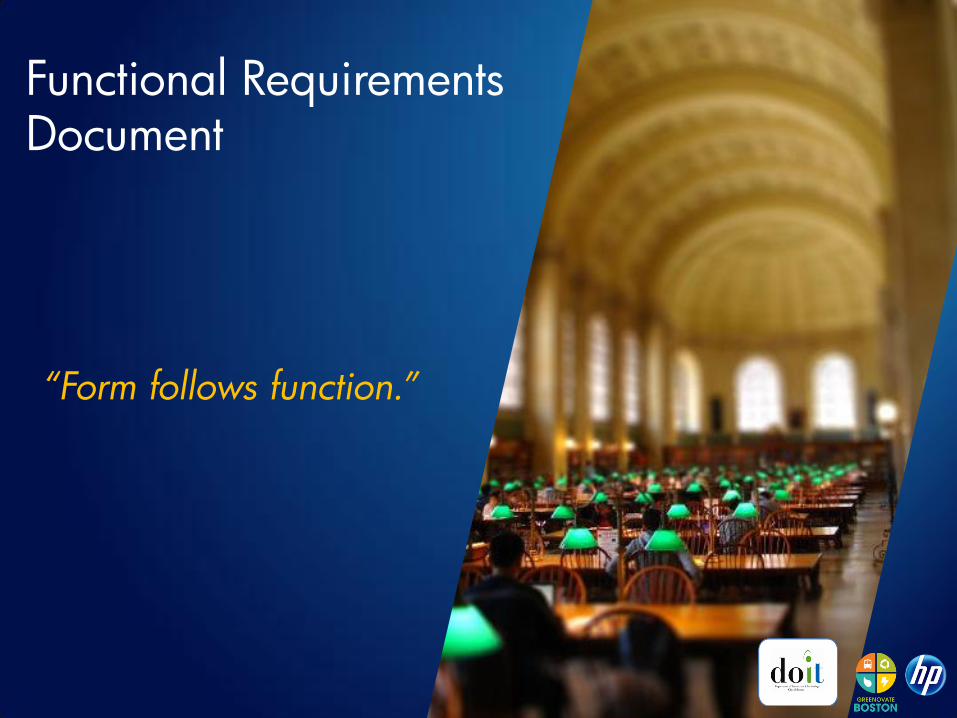
• Functional Requirements Document
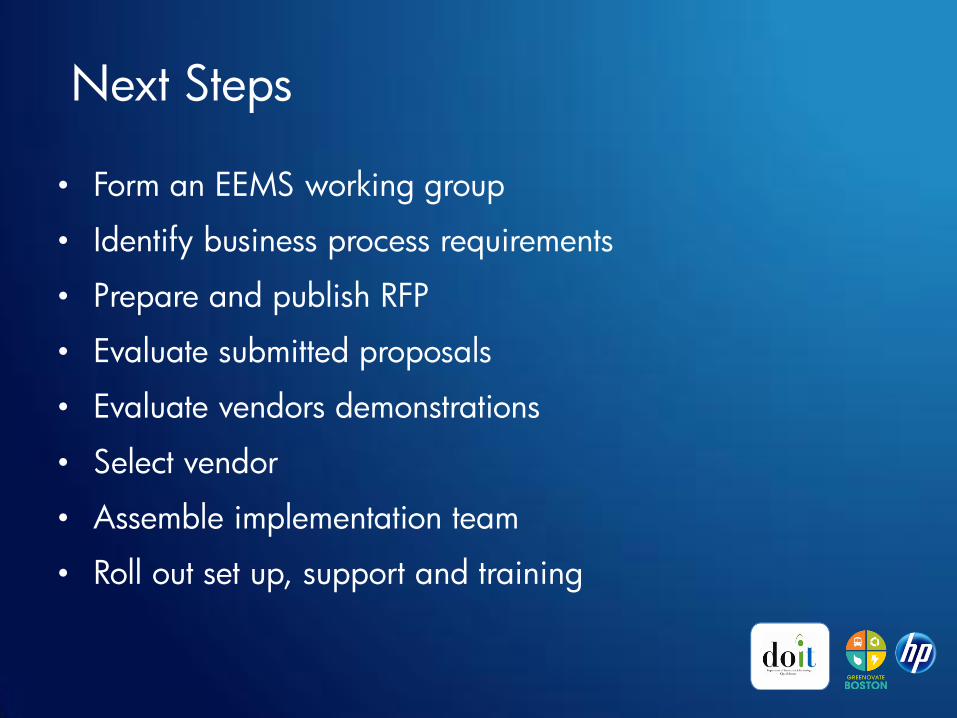
Next Steps
Q&A
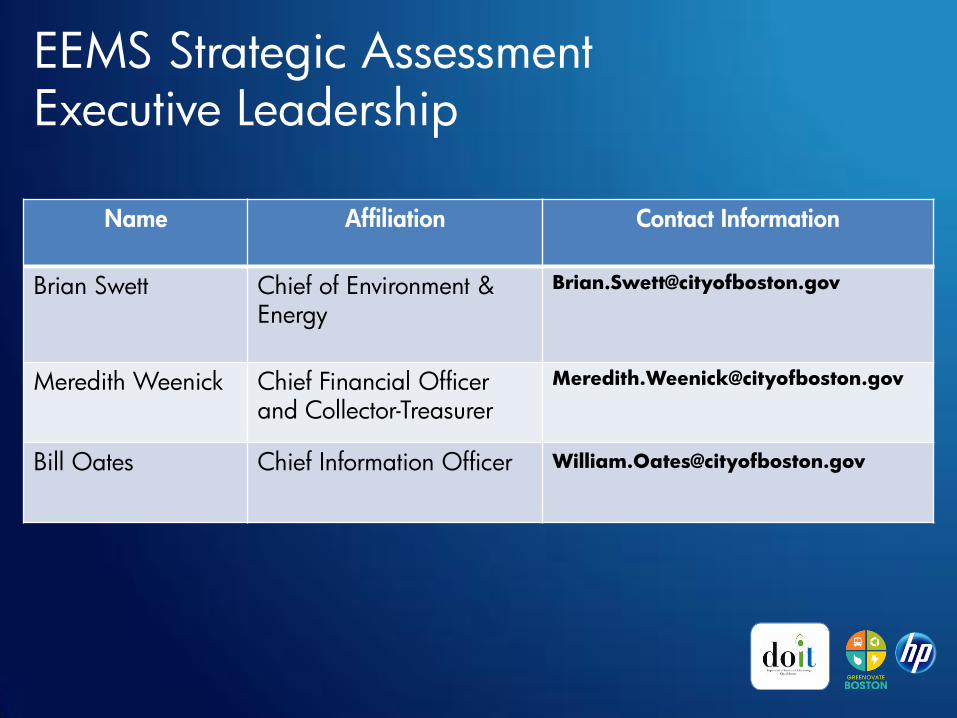
EEMS Energy Forum Executive Leadership Kickoff • Brian Swett, Chief of Environment & Energy
• Meredith Weenick, Chief Financial Officer
and Collector-Treasurer
• Bill Oates, Chief Information Officer
Environmental & Energy Services
• Proven in the private sector
• Makes your job easier
• Building Level Prioritization
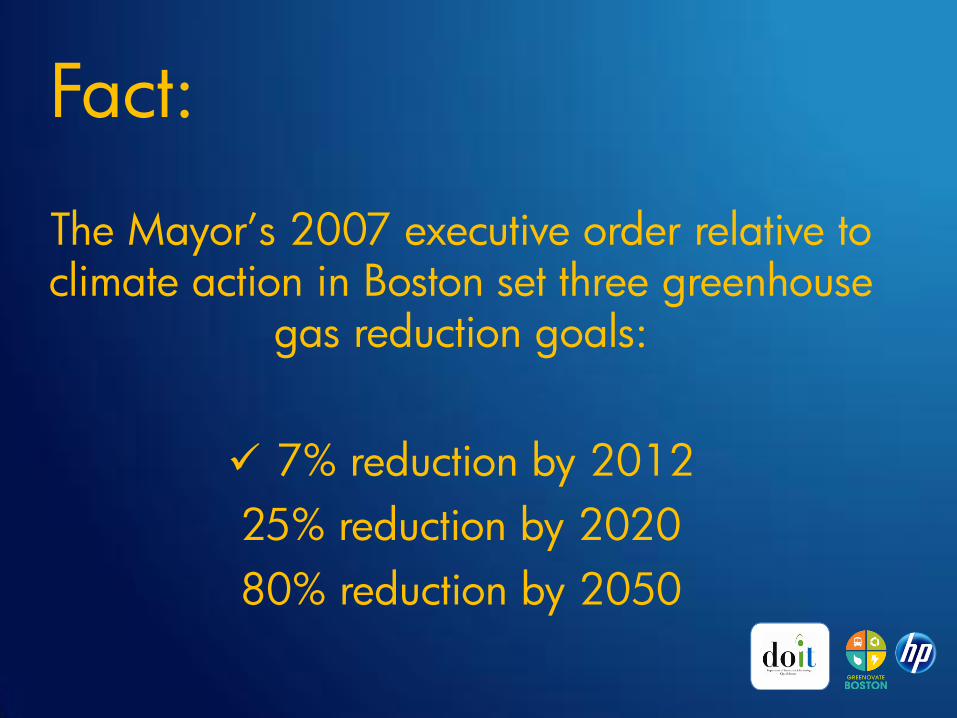
• Mayor’s 2007 Executive Order on Climate
• Climate Action Plan
• Energy Disclosure Ordinance
• Energy Management Unit
Brian Swett Chief of Environment & Energy
Administration & Finance
• An EEMS will help the City to maintain its high standards for financial and operational management.
• An EEMS will help to verify and validate the City’s energy consumption and utility billing.
• An EEMS will complement the IT resources the City already has at its disposal, like the BAIS financial system, that are necessary to manage and maintain the City’s $2.5 billion budget.
Meredith Weenick Chief Financial Officer and Collector-Treasurer
Dept. of Innovation & Technology
• EEMS aligns with DoIT’s mission of providing technology
to improve operations and to support strategic planning
efforts.
• Economies of Scale – aligning IT strategy with enterprise-
wide strategy.
Bill Oates Chief Information Officer
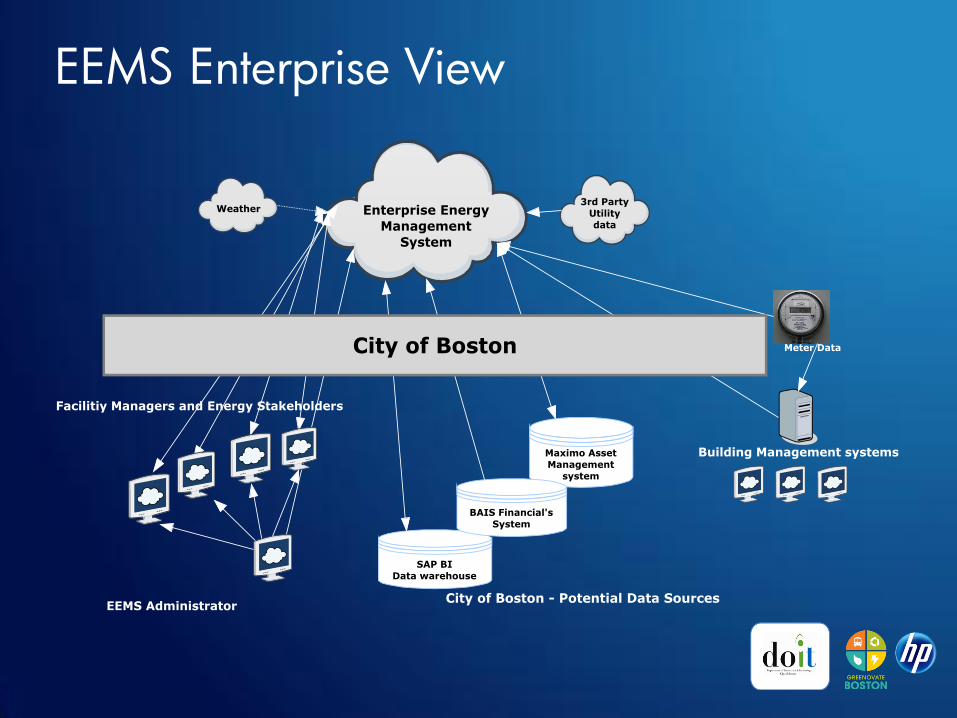
EEMS Enterprise View
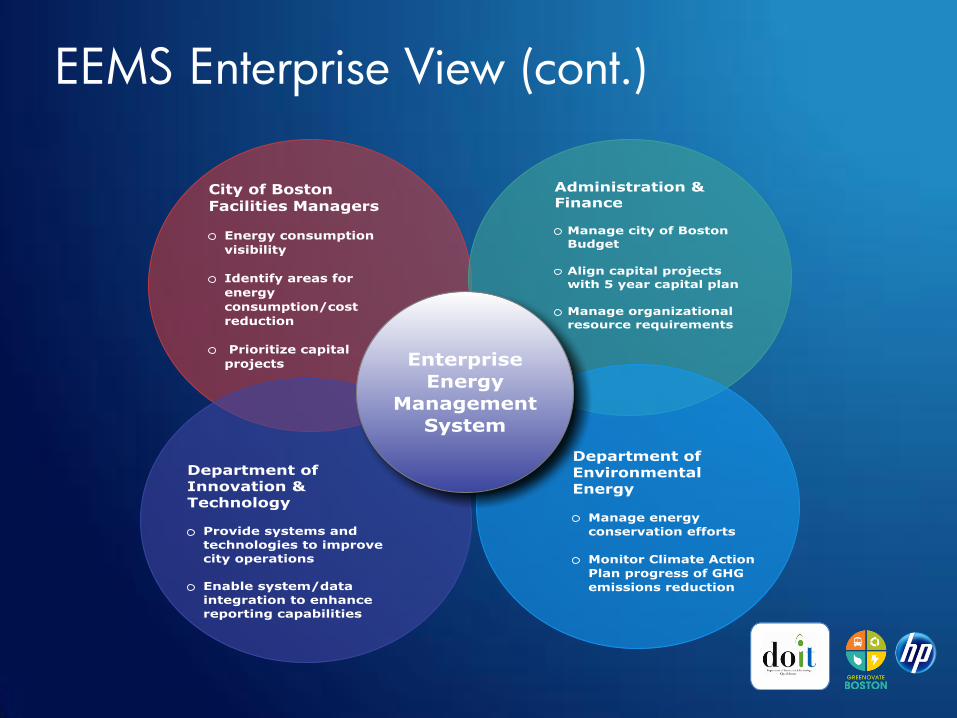
EEMS Enterprise View (cont.)
Energy Management Unit
• Energy Savings = Financial Savings
• Saving energy supports the delivery of services
• The City is obligated to maximize utility incentive payments
• An EEMS will help the City maximize energy savings
• An EEMS will allow the City to hold the line on energy consumption
Joe LaRusso Energy Efficiency & Renewable Energy Finance Manager
• Finding energy efficiency opportunities
• Working with budget & finance and utilities
• Implementing projects under MGL chapter 25A
• Developing and energy strategy
• Enterprise energy management system
Todd Isherwood Energy Efficiency & Alternative Energy Project Manager
Energy Management Unit
Question:
How much did the City budget for
energy in fiscal year 2013?
$55 million
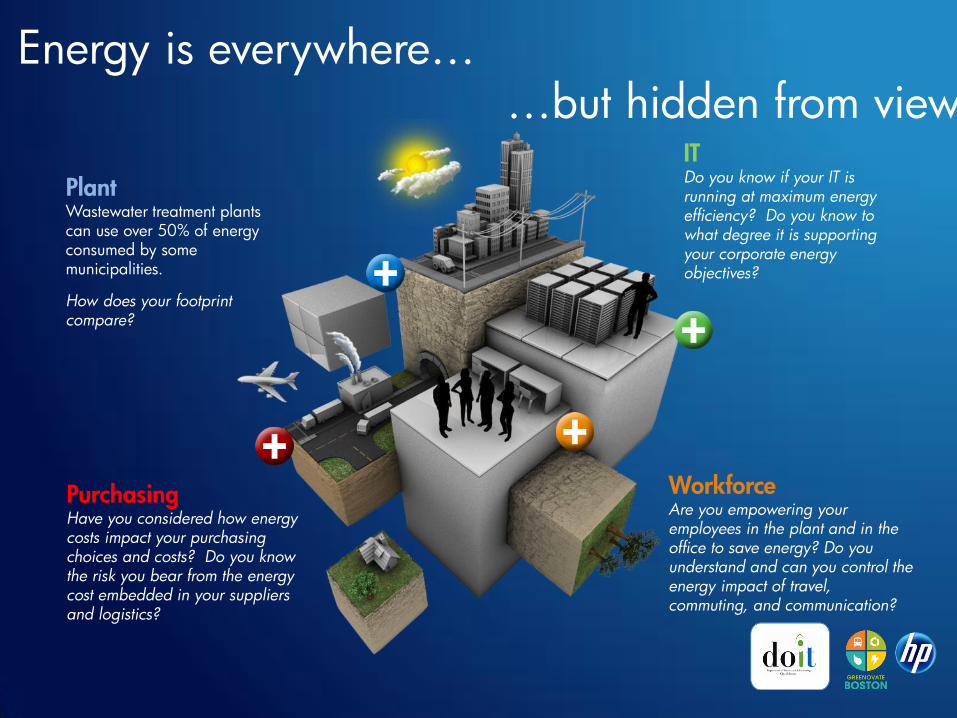
Energy is everywhere… …but hidden from view
Plant Wastewater treatment plants can use over 50% of energy consumed by some municipalities.
How does your footprint compare?
IT
Do you know if your IT is running at maximum energy efficiency? Do you know to what degree it is supporting your corporate energy objectives?
Purchasing
Have you considered how energy costs impact your purchasing choices and costs? Do you know the risk you bear from the energy cost embedded in your suppliers and logistics?
Workforce
Are you empowering your employees in the plant and in the office to save energy? Do you understand and can you control the energy impact of travel, commuting, and communication?
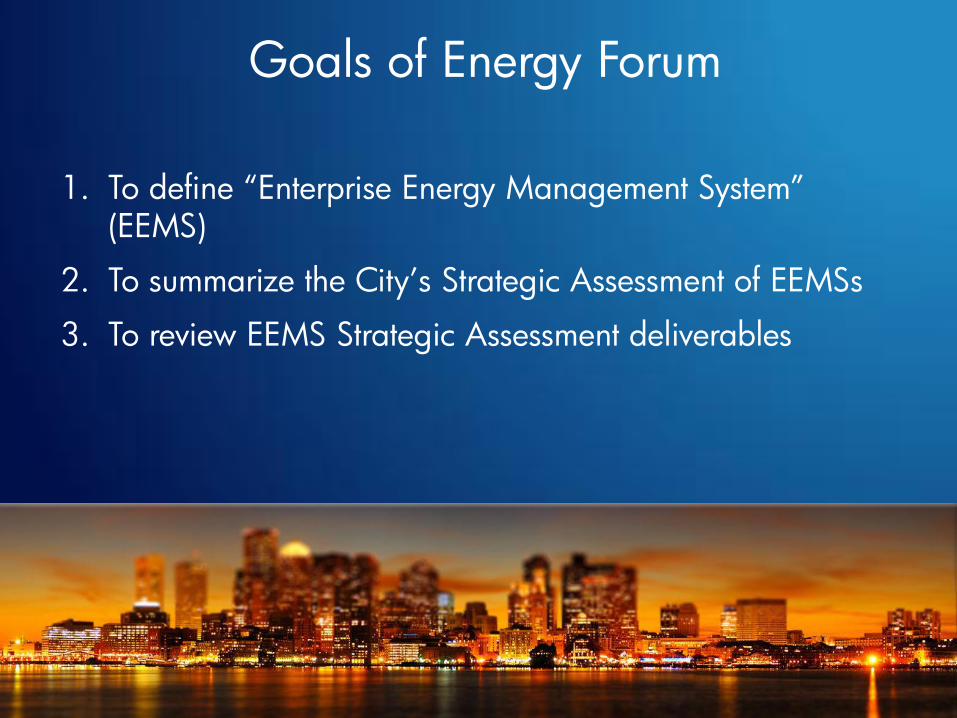
Goals of Energy Forum
1. To define “Enterprise Energy Management System” (EEMS)
2. To summarize the City’s Strategic Assessment of EEMSs
3. To review EEMS Strategic Assessment deliverables
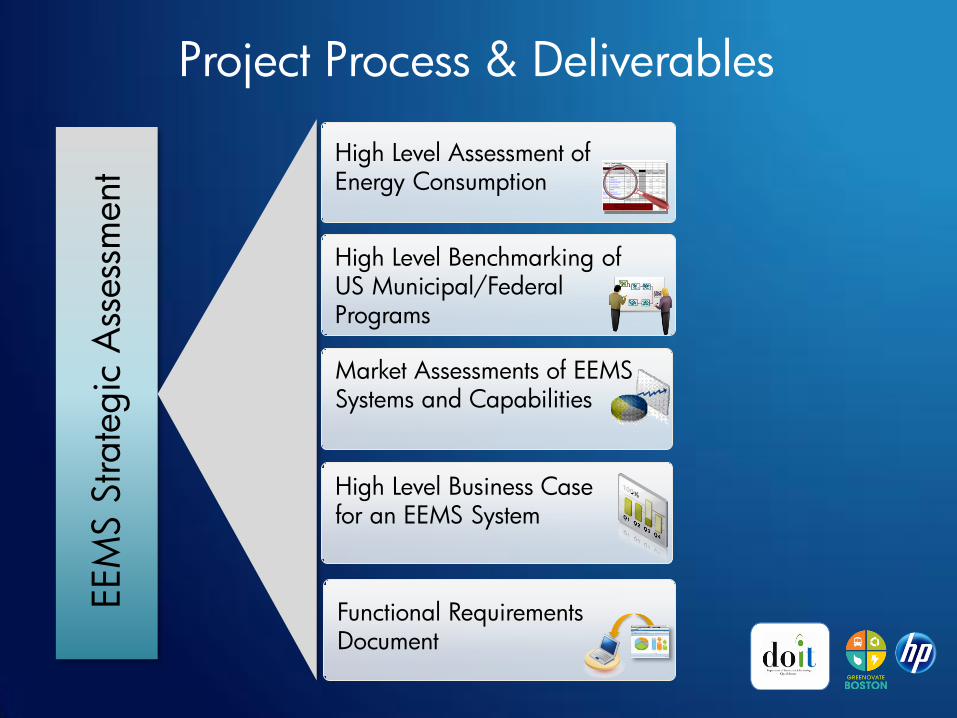
Project Process & Deliverables EEM
S S
trate
gic
Ass
ess
ment
Market Assessments of EEMS Systems and Capabilities
High Level Assessment of Energy Consumption
High Level Business Case for an EEMS System
High Level Benchmarking of US Municipal/Federal Programs
Functional Requirements Document
Project Process & Deliverables (cont.)
Detailed reports and summary documents are available at:
http://www.cityofboston.gov/environment/EEMS.asp
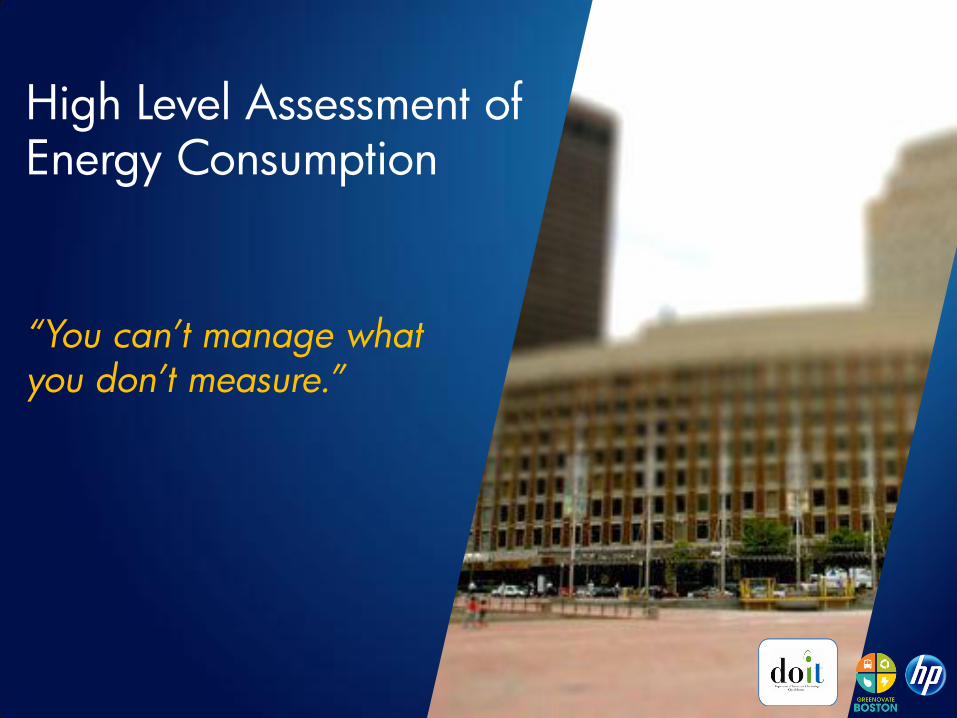
High Level Assessment of Energy Consumption
“You can’t manage what you don’t measure.”
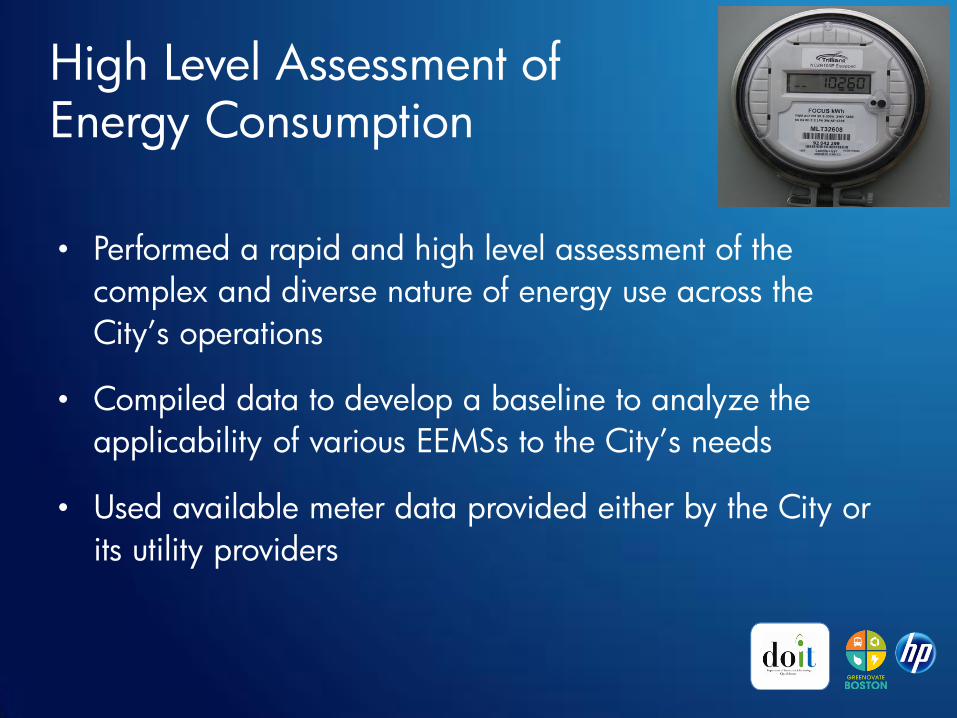
High Level Assessment of Energy Consumption
• Performed a rapid and high level assessment of the
complex and diverse nature of energy use across the
City’s operations
• Compiled data to develop a baseline to analyze the
applicability of various EEMSs to the City’s needs
• Used available meter data provided either by the City or
its utility providers
Facts:
The City used 171 million kWh in 2011.
City Hall used 13.7 million kWh in 2011.
__________________
The average single-family home in Massachusetts uses 6,000 kWh per year.
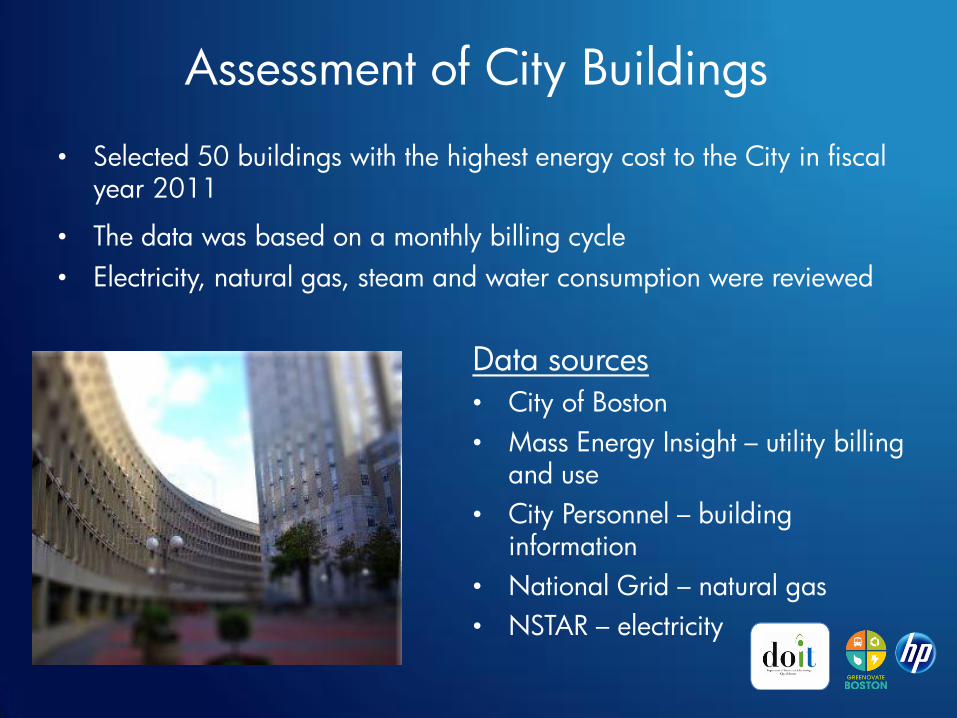
Assessment of City Buildings
• Selected 50 buildings with the highest energy cost to the City in fiscal year 2011
• The data was based on a monthly billing cycle
• Electricity, natural gas, steam and water consumption were reviewed
Data sources
• City of Boston
• Mass Energy Insight – utility billing and use
• City Personnel – building information
• National Grid – natural gas
• NSTAR – electricity
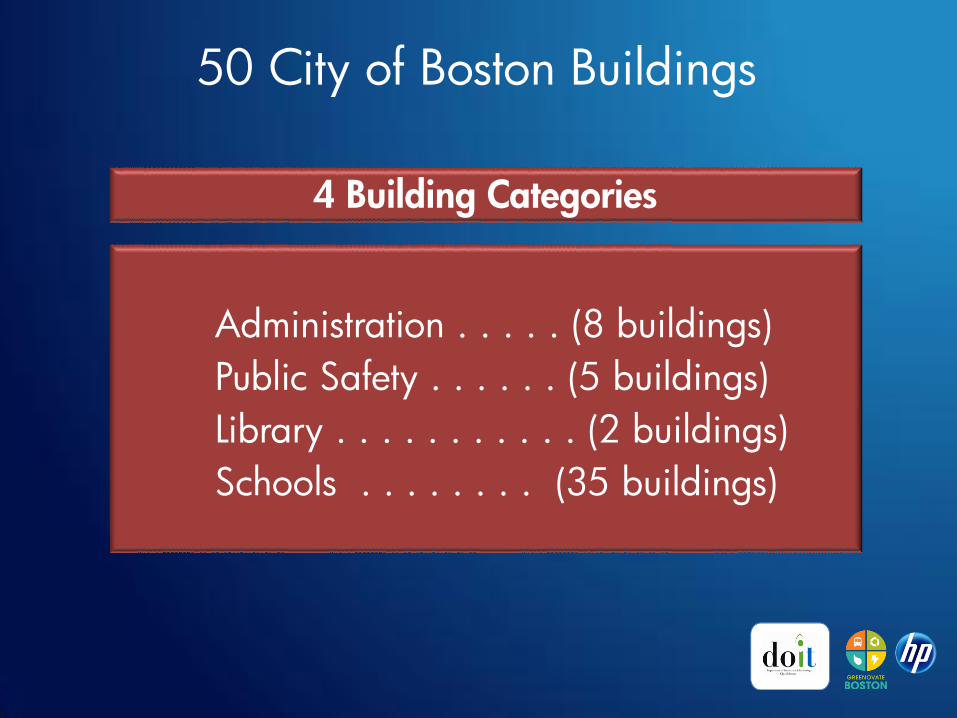
50 City of Boston Buildings
Administration . . . . . (8 buildings)
Public Safety . . . . . . (5 buildings)
Library . . . . . . . . . . . (2 buildings)
Schools . . . . . . . . (35 buildings)
4 Building Categories
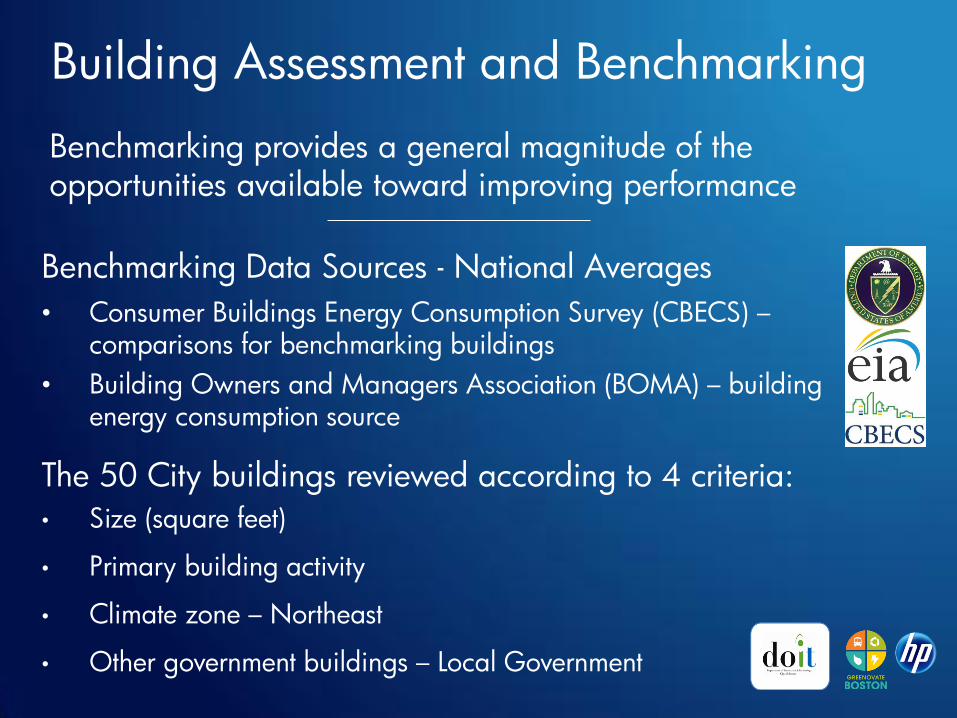
Building Assessment and Benchmarking
Benchmarking Data Sources - National Averages
• Consumer Buildings Energy Consumption Survey (CBECS) – comparisons for benchmarking buildings
• Building Owners and Managers Association (BOMA) – building energy consumption source
The 50 City buildings reviewed according to 4 criteria:
• Size (square feet)
• Primary building activity
• Climate zone – Northeast
• Other government buildings – Local Government
Benchmarking provides a general magnitude of the opportunities available toward improving performance
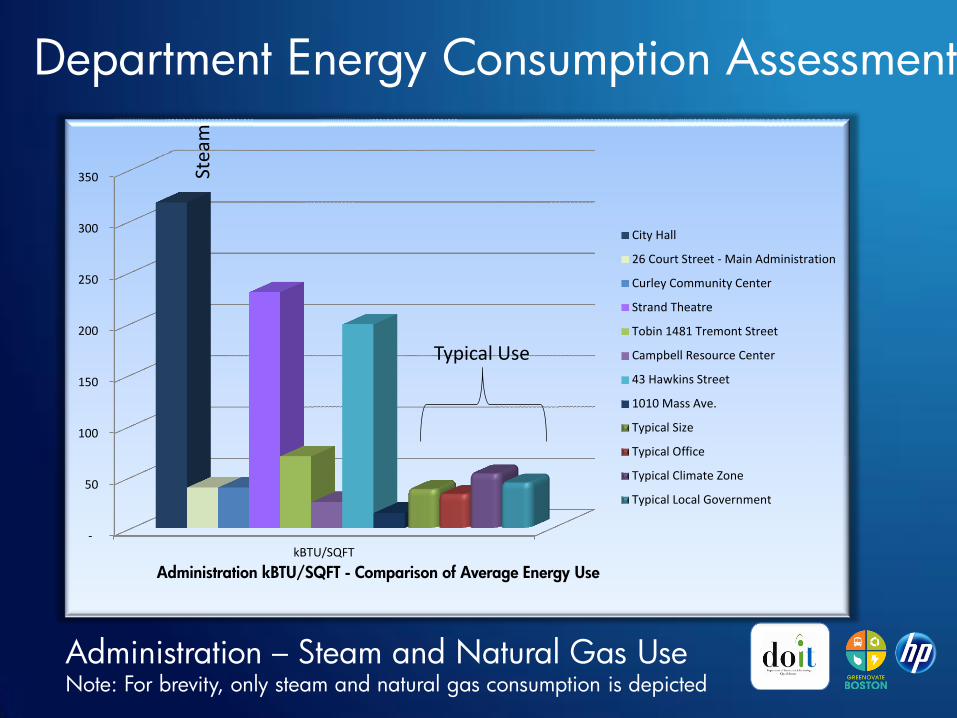
Administration – Steam and Natural Gas Use Note: For brevity, only steam and natural gas consumption is depicted
-
50
100
150
200
250
300
350
kBTU/SQFT
Administration kBTU/SQFT - Comparison of Average Energy Use
City Hall
26 Court Street - Main Administration
Curley Community Center
Strand Theatre
Tobin 1481 Tremont Street
Campbell Resource Center
43 Hawkins Street
1010 Mass Ave.
Typical Size
Typical Office
Typical Climate Zone
Typical Local Government
Typical Use
Stea
m
Department Energy Consumption Assessment
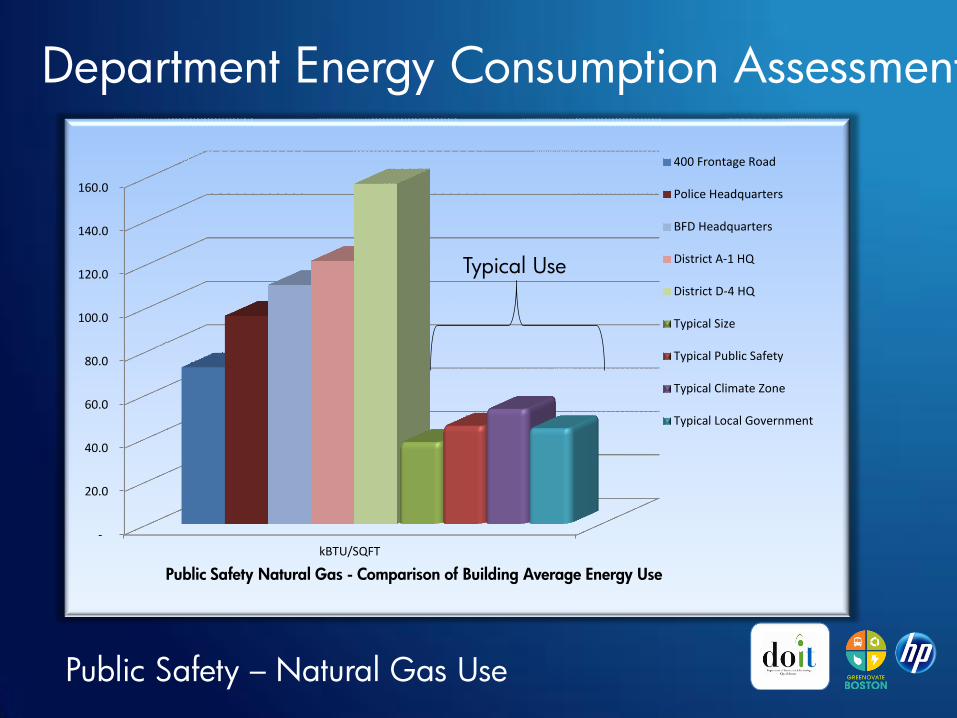
Public Safety – Natural Gas Use
-
20.0
40.0
60.0
80.0
100.0
120.0
140.0
160.0
kBTU/SQFT
Public Safety Natural Gas - Comparison of Building Average Energy Use
400 Frontage Road
Police Headquarters
BFD Headquarters
District A-1 HQ
District D-4 HQ
Typical Size
Typical Public Safety
Typical Climate Zone
Typical Local Government
Typical Use
Department Energy Consumption Assessment
Library – Steam & Natural Gas Use
-
100
200
300
400
500
600
700
800
900
kBTU/SQFT
Library kBTU/SQFT - Comparison of Average Energy Use
Copley Square
Mattapan Library
Typical Size
Typical Education
Typical Climate Zone
Typical Local Government
Typical Use
Stea
m
Department Energy Consumption Assessment
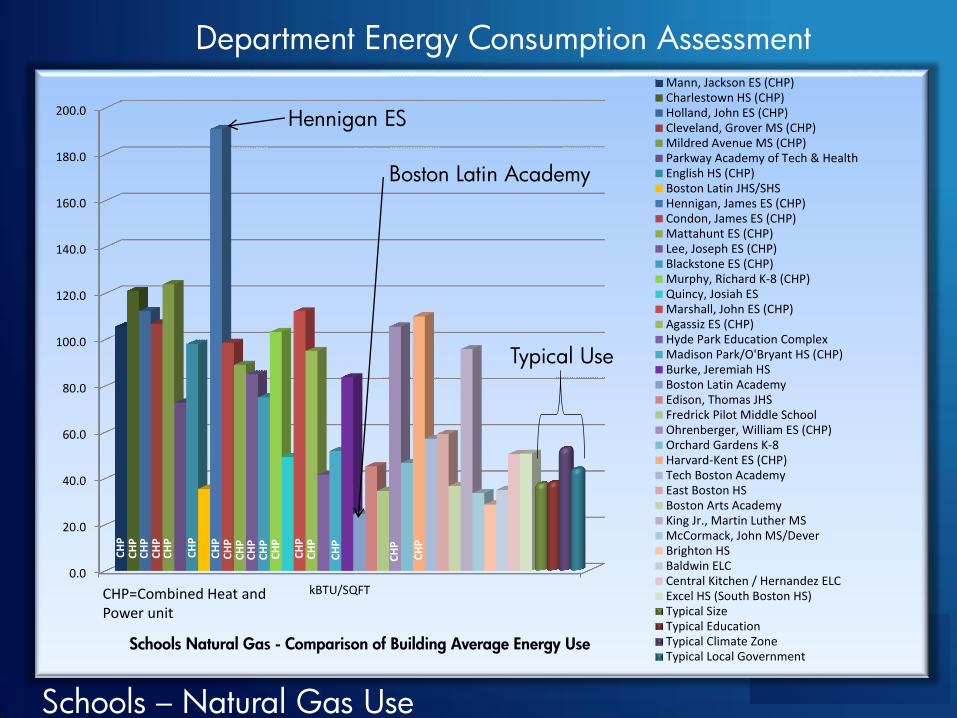
Schools – Natural Gas Use
0.0
20.0
40.0
60.0
80.0
100.0
120.0
140.0
160.0
180.0
200.0
kBTU/SQFT
Schools Natural Gas - Comparison of Building Average Energy Use
Mann, Jackson ES (CHP)Charlestown HS (CHP)Holland, John ES (CHP)Cleveland, Grover MS (CHP)Mildred Avenue MS (CHP)Parkway Academy of Tech & HealthEnglish HS (CHP)Boston Latin JHS/SHSHennigan, James ES (CHP)Condon, James ES (CHP)Mattahunt ES (CHP)Lee, Joseph ES (CHP)Blackstone ES (CHP)Murphy, Richard K-8 (CHP)Quincy, Josiah ESMarshall, John ES (CHP)Agassiz ES (CHP)Hyde Park Education ComplexMadison Park/O'Bryant HS (CHP)Burke, Jeremiah HSBoston Latin AcademyEdison, Thomas JHSFredrick Pilot Middle SchoolOhrenberger, William ES (CHP)Orchard Gardens K-8Harvard-Kent ES (CHP)Tech Boston AcademyEast Boston HSBoston Arts AcademyKing Jr., Martin Luther MSMcCormack, John MS/DeverBrighton HSBaldwin ELCCentral Kitchen / Hernandez ELCExcel HS (South Boston HS)Typical SizeTypical EducationTypical Climate ZoneTypical Local Government
Typical Use
Hennigan ES
Boston Latin Academy
CH
P
CH
P
CH
P
CH
P
CH
P
CH
P
CH
P
CH
P
CH
P
CH
P
CH
P
CH
P
CH
P
CH
P
CH
P
CH
P
CH
P
CHP=Combined Heat and Power unit
Department Energy Consumption Assessment
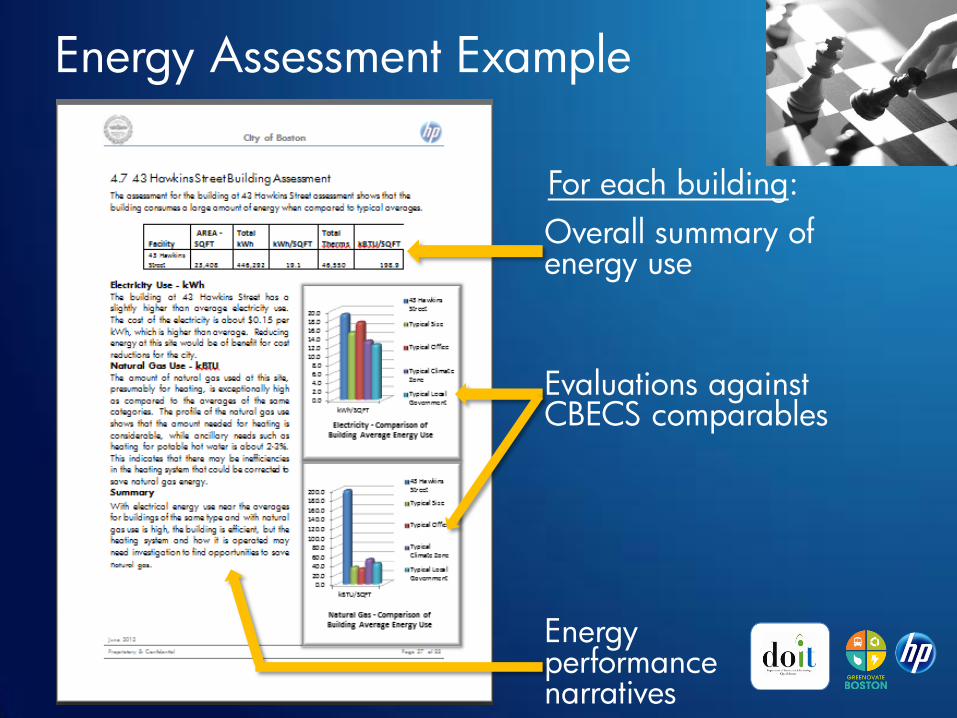
Energy Assessment Example
Overall summary of energy use
Energy performance narratives
Evaluations against CBECS comparables
For each building:
Conclusions and Recommendations
• Each of the 50 buildings was benchmarked against
Department of Energy data for electricity, natural gas,
steam, and water use.
• While many of the buildings exceeded the energy
consumption of comparable benchmarks, many were
equal to or less than those comparables.
• Current City energy conservation programs have been
effective in reducing energy consumption.
• An EEMS solution would allow the City to leverage the
current efficiency programs to realize greater savings.
Question:
How many kWh did the City consume in 2011?
171 million kWh Enough electricity to power 28,500
homes for one year.
High Level Benchmarking of U.S. Municipal and Federal EEMS Programs
“Get ahead of the pack!”
• Examples of other municipal or federal facilities that have
implemented an EEMS
• The level of energy savings those municipalities have achieved
• Key lessons-learned from those implementations
High Level Benchmarking of U.S. Municipal and Federal Programs
Fact:
City LED street light retrofits saved
11.3 million kWh in fiscal year 2012.
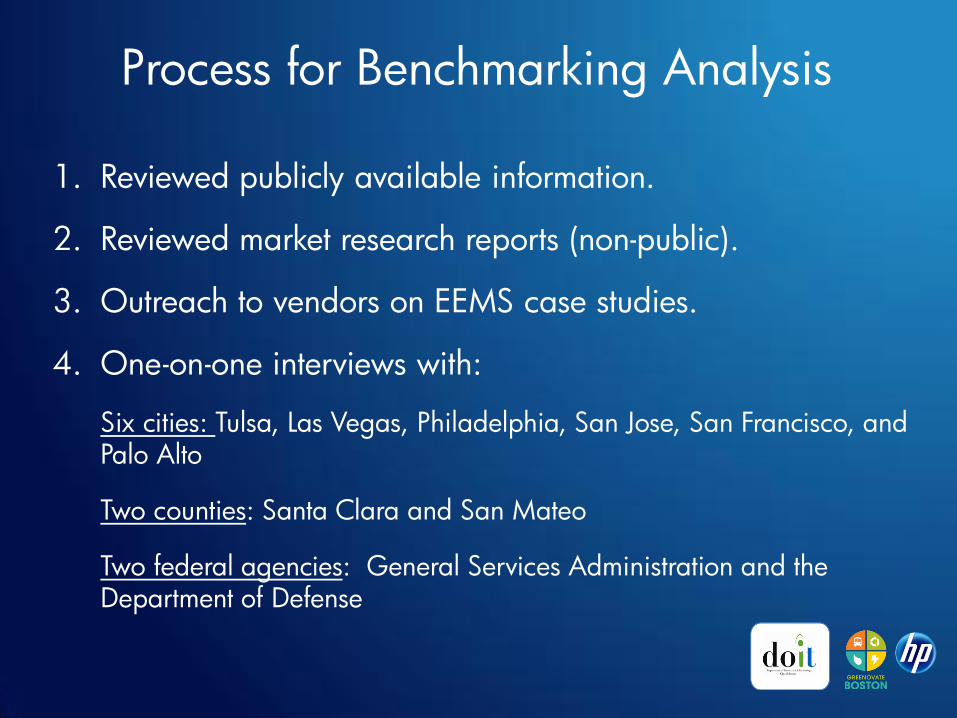
Process for Benchmarking Analysis
1. Reviewed publicly available information.
2. Reviewed market research reports (non-public).
3. Outreach to vendors on EEMS case studies.
4. One-on-one interviews with:
Six cities: Tulsa, Las Vegas, Philadelphia, San Jose, San Francisco, and Palo Alto
Two counties: Santa Clara and San Mateo
Two federal agencies: General Services Administration and the Department of Defense
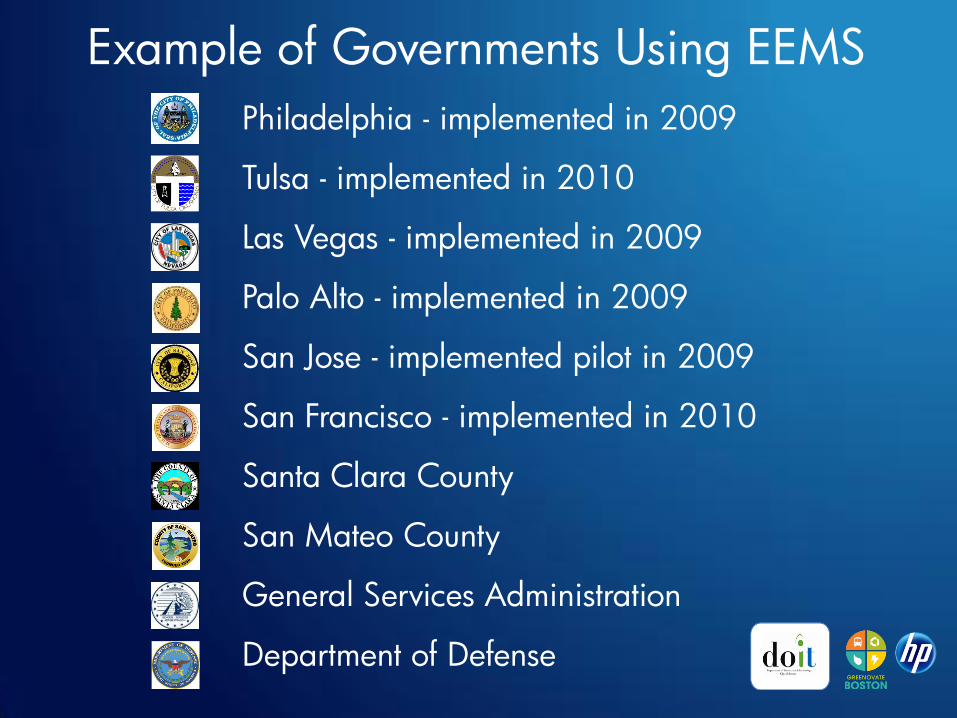
Example of Governments Using EEMS
Philadelphia - implemented in 2009
Tulsa - implemented in 2010
Las Vegas - implemented in 2009
Palo Alto - implemented in 2009
San Jose - implemented pilot in 2009
San Francisco - implemented in 2010
Santa Clara County
San Mateo County
General Services Administration
Department of Defense
• The comments were positive on the success of the EEMS implementation.
• Material energy reduction and cost savings were reported, including reduction in billing errors.
• Strong theme about driving the responsibility and reward to the departmental or facility level. This builds accountability and generates transparency in the governance process.
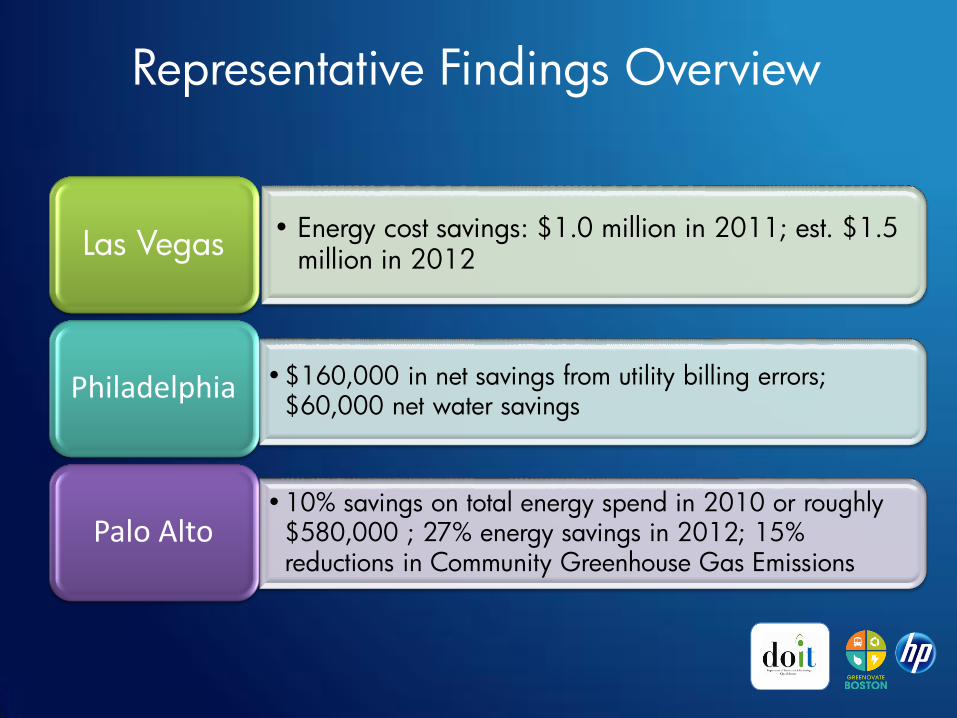
Representative Findings Overview
Representative Findings Overview
• Energy cost savings: $1.0 million in 2011; est. $1.5 million in 2012
Las Vegas
•$160,000 in net savings from utility billing errors; $60,000 net water savings
Philadelphia
•10% savings on total energy spend in 2010 or roughly $580,000 ; 27% energy savings in 2012; 15% reductions in Community Greenhouse Gas Emissions
Palo Alto
Conclusions and Recommendations
1. Based on the information gathered, begin to develop
functional requirements for an EEMS for the City.
2. Operational functionality and cost savings are critical
components to the success of an EEMS.
3. Invite EEMS vendors to demonstrate their solutions and
provide detailed case study data.
Question:
Which City energy conservation
measure yielded the greatest electricity
savings last year?
LED Street Light Retrofits
10 minute break
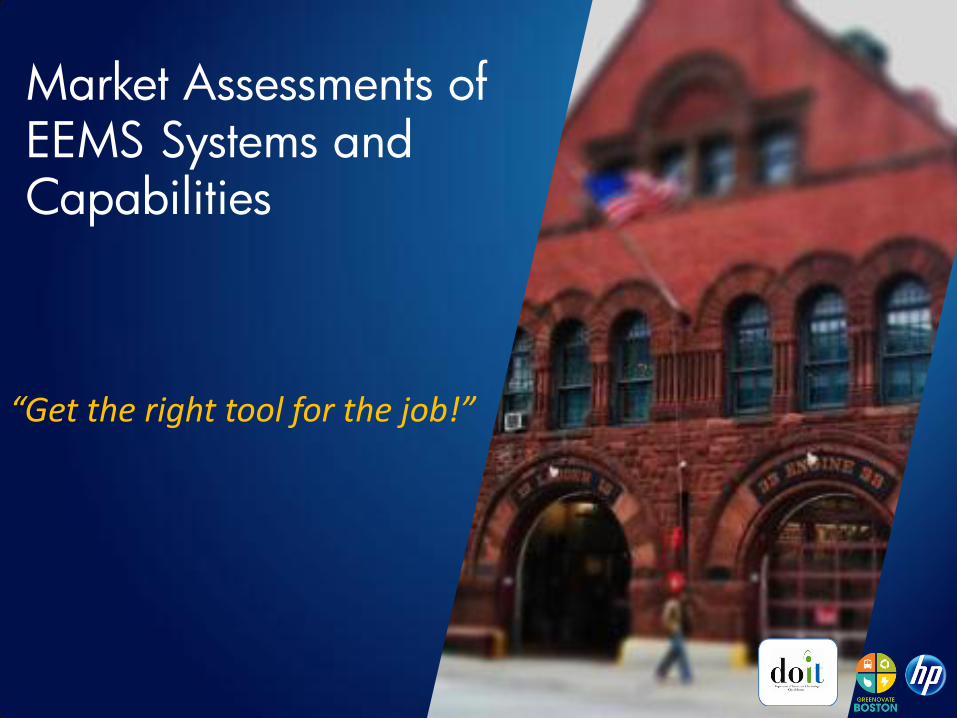
Market Assessments of EEMS Systems and Capabilities
“Get the right tool for the job!”
• Provide a review of the EEM systems on the market, including information on vendors’ clients, primary capabilities, and target markets.
• Present “real-world” implementation summaries to provide additional guidance.
Market Assessments of EEMS Systems and Capabilities
Fact:
There are 50+ EEMS vendors in the marketplace today.
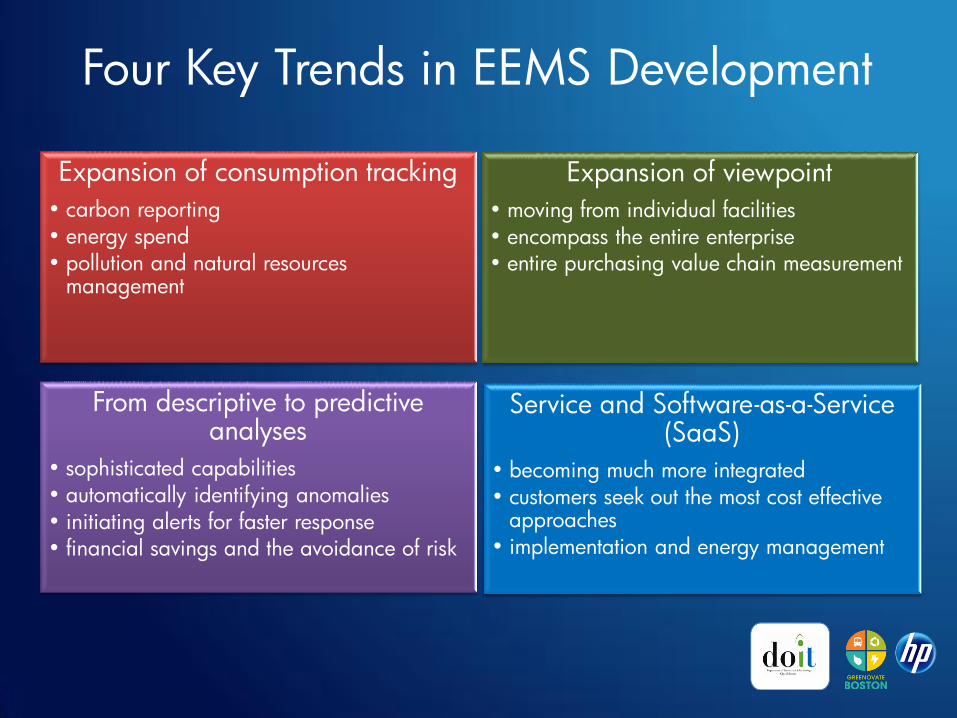
Expansion of consumption tracking
• carbon reporting
• energy spend
• pollution and natural resources management
Expansion of viewpoint
• moving from individual facilities
• encompass the entire enterprise • entire purchasing value chain measurement
From descriptive to predictive analyses
• sophisticated capabilities
• automatically identifying anomalies
• initiating alerts for faster response • financial savings and the avoidance of risk
Service and Software-as-a-Service (SaaS)
• becoming much more integrated
• customers seek out the most cost effective approaches
• implementation and energy management
Four Key Trends in EEMS Development
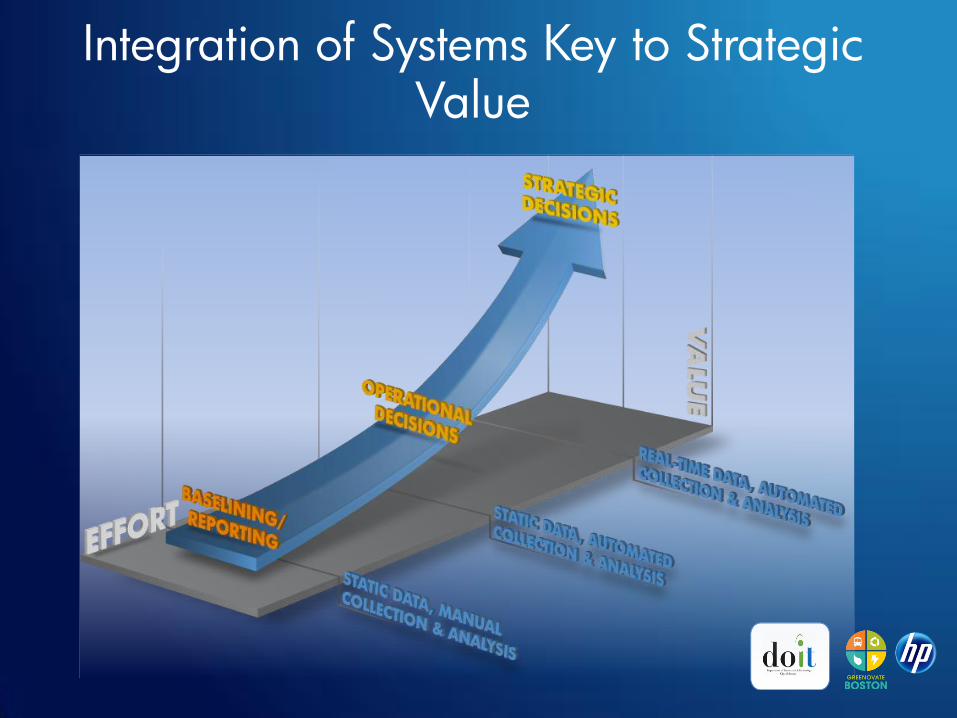
Integration of Systems Key to Strategic Value
Administration and Finance
Manage CAPEX and OPEX, verification of results, impact on General Fund expenditures
Environment and Energy
Drive policy, reporting and energy efficiency goals
Facilities and Public Works
Operate facilities and vehicles, implement efficiency projects
Information Technology
Manage data flow, oversee Data Centers
Roles Involved in Procurement and Implementing EEMS
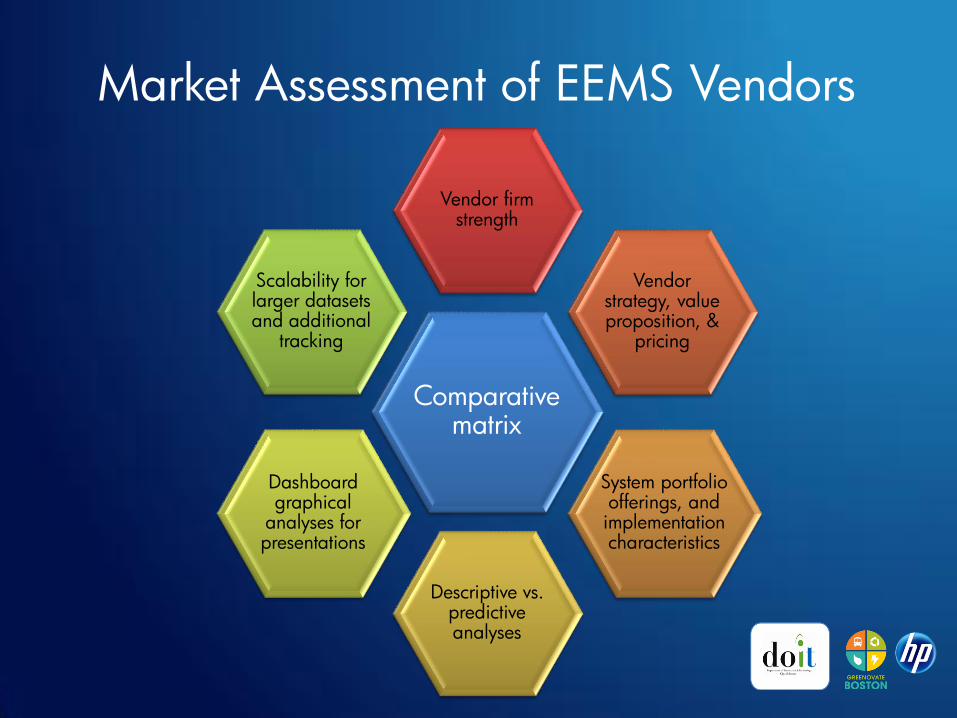
Market Assessment of EEMS Vendors
Comparative matrix
Vendor firm strength
Vendor strategy, value proposition, &
pricing
System portfolio offerings, and implementation characteristics
Descriptive vs. predictive analyses
Dashboard graphical
analyses for presentations
Scalability for larger datasets and additional
tracking
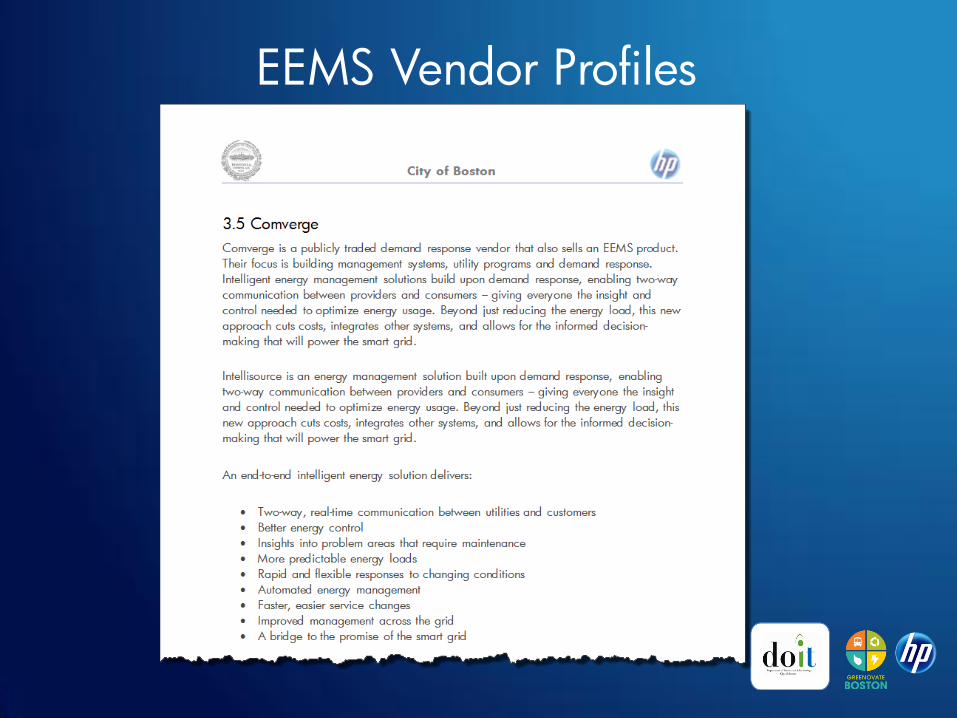
EEMS Vendor Profiles
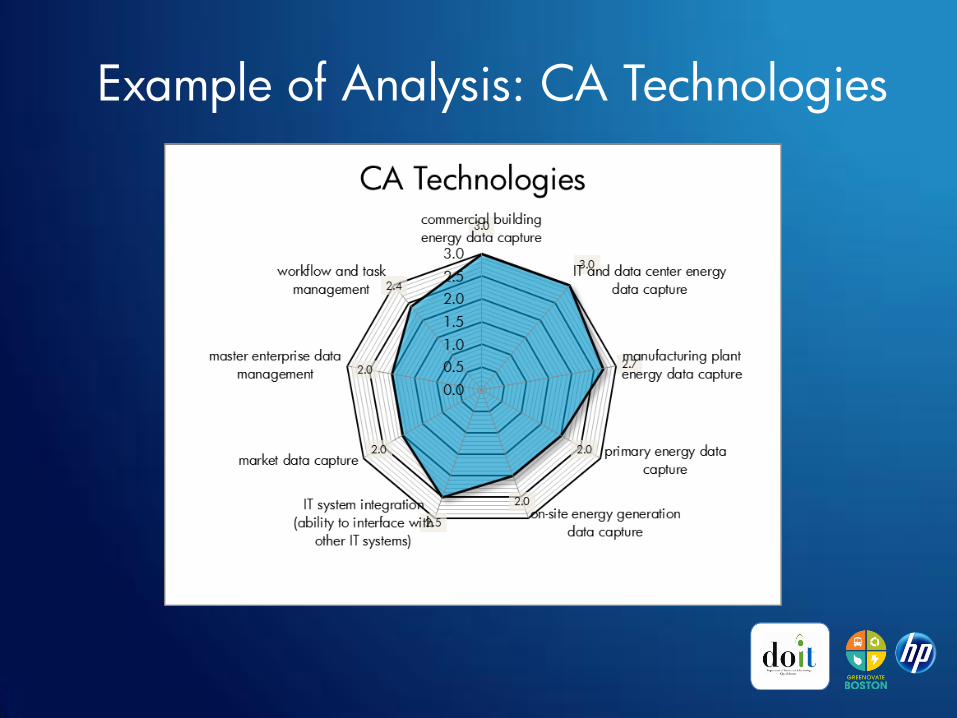
Example of Analysis: CA Technologies
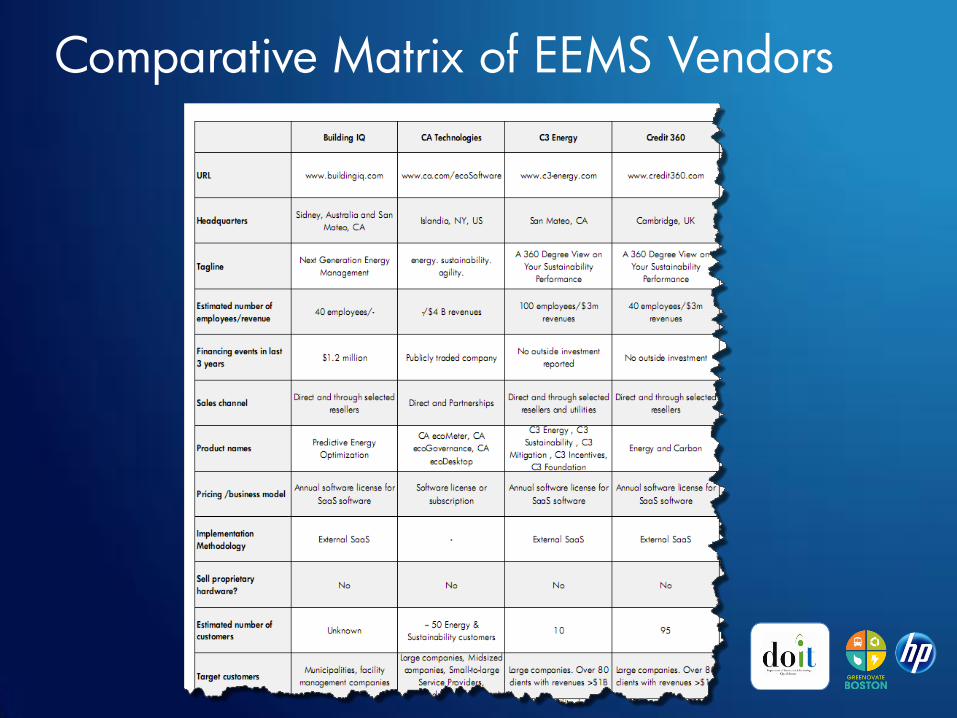
Comparative Matrix of EEMS Vendors
Conclusions and Recommendations
This study provided a high level overview of the leading EEMS systems.
The strengths and weaknesses of each system must be weighed and evaluated vis-à-vis the City’s:
• goals
• existing energy and financial management systems
• cost
• depth of team involved both in the implementation and day-to-day operation of the EEMS
Question:
How many EEMS vendor are there in
the marketplace today?
50+
High Level Business Case for an EEMS
“Strategically investing in our future.”
• Understand energy outlook
• Discuss ongoing energy consumption costs for the City operations
• Develop projected energy costs for a “business as usual” scenario for 5 years including “low,” “expected,” and “high” forward price scenarios
• Estimate initial up-front cost estimates for an EEMS including licensing fees, installation costs, City staff resource requirements, and on-going maintenance costs
• Projected energy cost savings based on ranges observed in other EEMS implementations
High Level Business Case for an EEMS
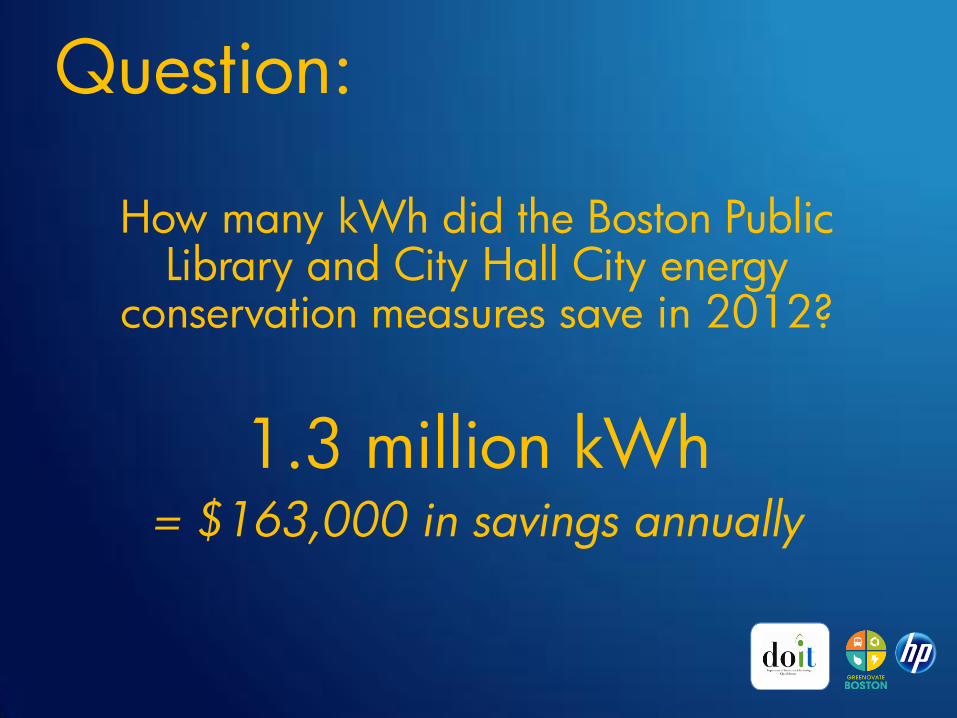
Fact:
Boston Public Library and City Hall energy conservation measures saved 1.3 million
kWh in fiscal year 2012.
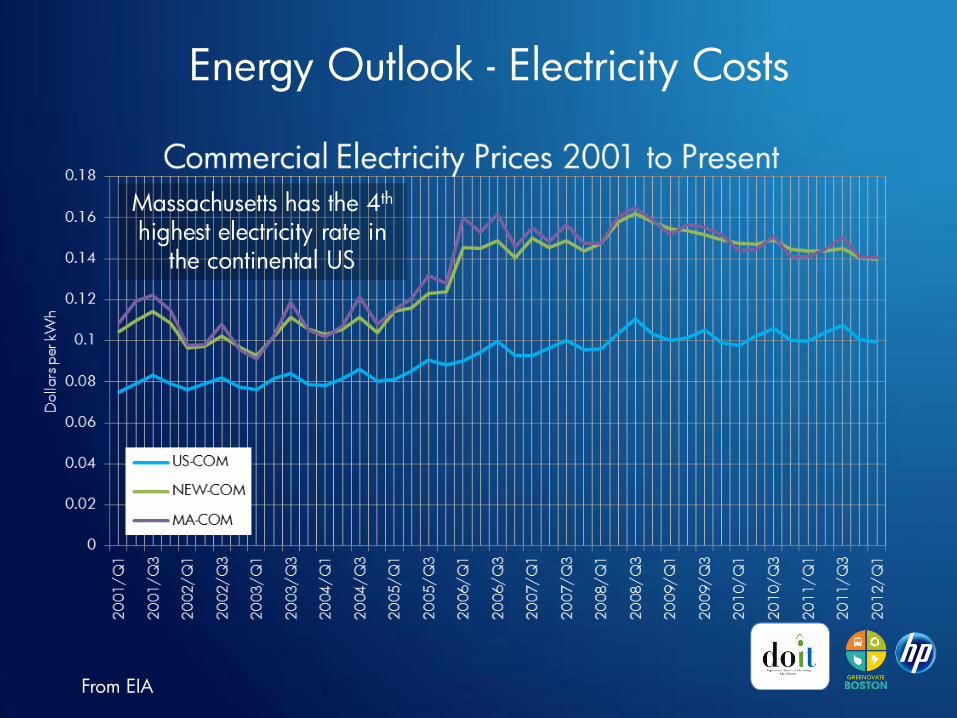
Energy Outlook - Electricity Costs
From EIA
Massachusetts has the 4th highest electricity rate in
the continental US
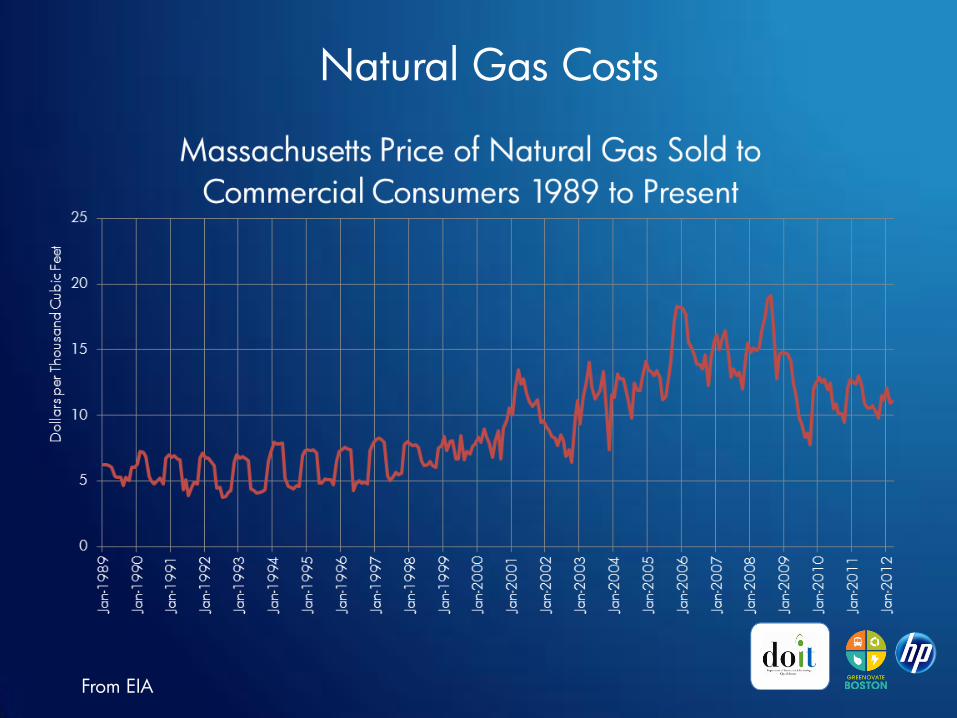
Natural Gas Costs
From EIA
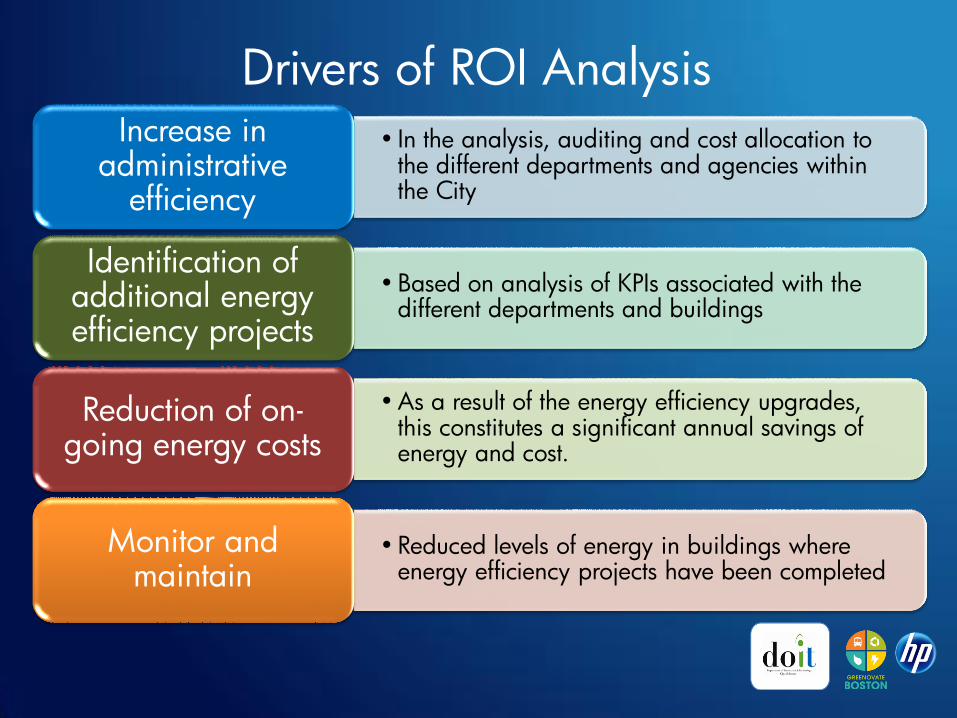
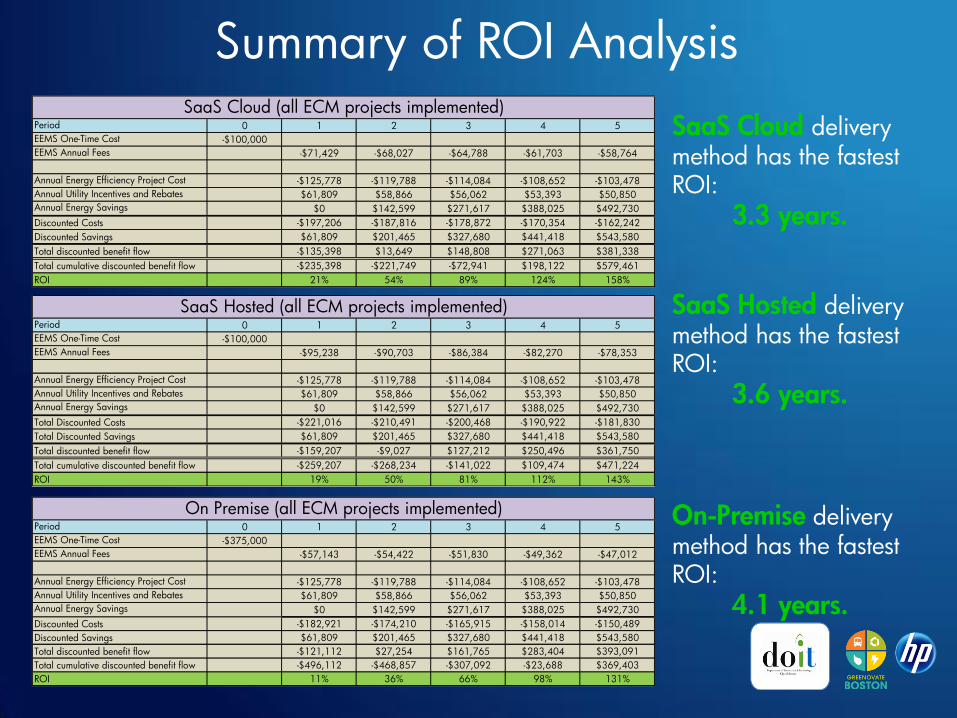
Drivers of ROI Analysis
• In the analysis, auditing and cost allocation to the different departments and agencies within the City
Increase in administrative
efficiency
• Based on analysis of KPIs associated with the different departments and buildings
Identification of additional energy efficiency projects
• As a result of the energy efficiency upgrades, this constitutes a significant annual savings of energy and cost.
Reduction of on-going energy costs
• Reduced levels of energy in buildings where energy efficiency projects have been completed