To: From: City of Richmond Gene ra l Purposes Committee David Weber Director, City Clerk's Office Chief Election Officer Report to Committee Date: May 1, 2018 File: 12-8125-80-05Nol 01 Re: Voting Divisions for the 2018 General Local and School Election Staff Recommendation That Civic Election Administration and Procedure Bylaw No. 7244, Amendment Bylaw No. 9876, which proposes adjustments to voting division boundaries and establishes 4 additional voting divisions for the 2018 General Local and School Election, be introduced and given first, second and third readings David Weber Director, City Clerk's Office Chief Election Officer (604-276-4098) Att. 7 5814102 REPORT CONCURRENCE CONCURRENCE OF GENERAL MANAGER A--- ....... .,.._ REVIEWED BY STAFF REPORT I INITIALS: AGENDA REVIEW SUBCOMMITTEE CJ" ' CNCL - 68
Transcript
To:
From:
City of Richmond
General Purposes Committee
David Weber Director, City Clerk's Office Chief Election Officer
Report to Committee
Date: May 1, 2018
File: 12-8125-80-05Nol 01
Re: Voting Divisions for the 2018 General Local and School Election
Staff Recommendation
That Civic Election Administration and Procedure Bylaw No. 7244, Amendment Bylaw No. 9876, which proposes adjustments to voting division boundaries and establishes 4 additional voting divisions for the 2018 General Local and School Election, be introduced and given first, second and third readings
David Weber Director, City Clerk's Office Chief Election Officer (604-276-4098)
Att. 7
5814102
REPORT CONCURRENCE
CONCURRENCE OF GENERAL MANAGER
A--- ....... .,.._
REVIEWED BY STAFF REPORT I INITIALS:
AGENDA REVIEW SUBCOMMITTEE CJ"
A~svcD ~
'
CNCL - 68
May 1, 2018 - 2-
Staff Report
Origin
At the November 27, 2017 Regular Council Meeting, Council considered a report on the 2018 General Local and School Election and endorsed a recommendation that a divisional-voting approach be taken in the upcoming election. This approach to election administration, which establishes that electors vote at neighbourhood voting places, is consistent with past practice in Richmond and consistent with the current Civic Election Administration and Procedure Bylaw.
In the November report it was noted that an analysis would be undertaken to determine whether additional voting divisions would be warranted in areas that have experienced significant population growth and where voter turnout has been very strong. The intention behind the establishment of new divisions, or the adjustment of existing divisions, is to provide a better experience for the electorate and a more manageable election operation.
This report supports Council's 2014-2018 Term Goal #9 A Well-Informed Citizenry:
Continue to develop and provide programs and services that ensure the Richmond community is well-informed and engaged on City business and decision making.
This Council Term Goal would be supported by ensuring that voting divisions are reasonably balanced for the 2018 election which would allow the public to better engage in this significant and fundamental public process.
The deadline for the adoption of any bylaws that apply to the 2018 General Local and School Election is July 9, 2018.
Analysis
Under a divisional-voting approach, electors who vote on General Voting Day are required to vote at a specific voting place designated for their specific neighbourhood. Voting divisions are used to effectively balance and distribute administrative resources for an election. The boundaries for a voting division must therefore encompass reasonably balanced and manageable portions of the local population so that election administrators may effectively plan for and allocate equipment, supplies and appropriate levels of staffing at the voting places. These measures are taken to ensure an orderly and positive experience for the voting public.
In addition to considering the number of registered electors within a given area, election administrators also consider the following factors when establishing voting division boundaries:
• the availability of an appropriately-sized facility to conduct the vote within the division that is accessible, secure and has adequate parking (often a school building);
• ensuring that the voting place is conveniently located for residents who wish to drive, walk or take transit on election day; and
• ensuring that divisional boundaries are logically drawn along natural boundaries, major roads, or other familiar neighbourhood boundaries.
5814102 CNCL - 69
May 1, 2018 - 3 -
The Current Voting Divisions
When the current voting divisions were first established in 1993, there were only 70,600 registered electors in Richmond. The original 34 voting divisions were drawn so that the majority of divisions would encompass no more than 2,600 registered electors (Attachment 1 ).
Today, there are 125,350 registered electors in Richmond and, using the Richmond Interactive Map system (RIM/GIS) to plot today's Voters list using the same grid of neighbourhood voting divisions that was established in 1993, the number of registered electors that would be assigned to some divisions is now double or triple the original range.
In addition to the increase in the numbers of registered electors across all voting divisions, the RIM/GIS analysis also showed that the distribution of registered electors across the City has not been uniform, with some areas becoming significantly more densely populated than other areas over time.
To illustrate, Table 1 below provides four examples of voting divisions where the number of registered electors and the number of ballots cast has increased over time, but in a manner that can still be reasonably managed. With these four divisions and other similarly-sized divisions, an orderly and efficient experience for electors on General Voting Day can be provided by adjusting resources and staffing levels accordingly.
Table 1: Examples of Voting Divisions with a MANAGEABLE Amount of Change Between 1993 and 2014
Voting Division Total Registered Voters per Division Ballots Cast per Division
1993 2014 %change 1993 2014 %change
RC03 1,717 1,770 3% 598 594 1%
Gilmore increase decrease
RElO 1,929 2,699 40% 515 874 70%
Woodward increase increase
RS09 2,505 3,123 25% 659 788 20%
Blundell increase increase
RE09 2,504 3,484 39% 624 927 49%
McNair increase increase
In contrast, the RIM/GIS analysis also showed that some voting divisions have increased significantly and disproportionately compared to the rest. For example, there are now 6 voting divisions that would encompass between 5,000 and 9,000 registered electors compared to the original maximum number of2,600. This represents an increase for some voting divisions ofup to 280%, with similar increases over the same time period in the number of electors casting ballots in those same divisions.
To illustrate further, Table 2 below shows figures for four divisions that have had a significant amount of change over time. The areas that are have been most affected are in the City Centre, the area just south of the City Centre, the Steveston area, and some areas in East Richmond.
5814102 CNCL - 70
May 1, 2018 - 4-
Table 2: Examples of Voting Divisions with a SIGNIFICANT Amount of Change Between 1993 and 2014
Voting Division Total Registered Voters per Division Ballots Cast per Division
%change %change 1993 2014 1993 2014
RS05 2,427 6,193 155% 643 2,183 240%
Homma increase increase
RE06 2,164 7,369 241% 455 1,563 244%
Kate McNeely increase increase
RC12 2,371 7,146 201% 526 1,298 147%
Cook increase increase
RE01 2,356 8,947 280% 540 1,947 261%
General Currie increase increase
(A full listing of all 34 voting divisions showing the degree of change between 1993 and 2014 in the number of registered electors and the number of ballots cast can be found in Attachment 2. Attachment 3 depicts the same data visually in the form of 2 bar graphs which highlight the areas with the most significant and disproportionate increases).
The Proposed Voting Divisions
In terms of a target for the average voting place, experience has shown that processing approximately 1,000 electors in one day is a reasonable and manageable number. When the numbers of ballots cast at a single voting place starts to surpass 1,200 ballots per day, then it can become challenging due to the voting place being overly busy and, as a result, electors may have a less than positive experience.
Using the RIM/GIS system, various options were explored to adjust voting division boundaries and to add additional divisions where necessary in order to even out the overall distribution of registered electors across divisions and to address the areas where the most significant increases have been recorded.
In many instances, no changes were necessary to maintain voting divisions within the target size and range. In other instances, a minor shift in boundaries was enough to even out the numbers between neighbouring divisions. In other areas, such as the City Centre and Steveston, some voting divisions were re-configured or divided in order to better serve the number of people now living in those areas.
Overall, 3 8 voting divisions are proposed for 2018 (Attachment 4 ), an increase of 4 divisions over the number that was originally established in 1993 (see Attachment 1 for the original 1993-2014 Voting Division map for comparison).
No more than 5,500 registered electors would fall into any of the proposed divisions, which is a significant shift in the range that would be present using the 1993-2014 divisional grid where the upper range would reach as high as 9,070 registered electors. Attachment 5 and 6 show how the number of registered electors would be significantly evened out under the proposed grid of voting divisions.
5814102 CNCL - 71
May 1, 2018 - 5 -
Financial Impact
The election budget that was approved in the fall of 2017 included provision for the possibility of adding a few additional voting divisions.
Conclusion
The voting divisions in Richmond have not been adjusted since they were first established 25 years ago. However, there have been significant and uneven increases in population across Richmond during this time frame. The proposed 2018 voting divisions are more manageable in size and more evenly distributed which would allow the City to plan more effectively for a better experience for the public on General Voting Day.
David Weber Director, City Clerk's Office and Chief Election Officer (604-276-4098)
Attachments: 1: Map - Richmond Voting Divisions - 1993-2014 2: Voting Division Statistics- Difference Between 1993 and 2014 3: Bar Graphs - Registered Electors & Ballots Cast - Difference Between 1993 and 2014 4: Map- Proposed Richmond Voting Divisions- 2018 5: Registered Electors Per Voting Division - Current Divisional Grid vs. Proposed Divisions 6: Bar Graph- Registered Electors for 2018- Showing the Impact of the Proposed Divisions 7: Civic Election Administration and Procedure Bylaw No. 7244, Amendment Bylaw No. 9876
5814102 CNCL - 72
RE
01
RC
06
RE
02
RE
07
1l1c
info
nllll
tion)
)IO
""" onlhiJn~>piJ<;nn>t•ilo.l f
mno
\'Driuu
~ oo
urc.
slln
dthc
Cii
)'M
l:doo
no .
. ·arr.~ntic:s.aprcsscdorimrtical.
mlo
lhci
CC
IIr.l
l<:y
orc:
nmpl
cto:
ncnn
rlhc
info
mlll
tion.
U"""an:rcminde.J
ih~t
luls
i1CS
8Mdl
q:nl
dc:s
crip
tion
n 1:
00fi
nncd
atl
hc
Llm
d Tilkomc~ in
New
Woun
insl~
. )>
T
his
I.S N
OT
1 l~ol
docm
naot
. nnd
is
pnbl
i•hc
d fo
r in
fc
1UK
IW!m
:nic
nccp
o0fl'
Cl'S
C$O
UI)'
. O
('iry
of R
ichm
ond.
:!01
6, A
U r
i~hl
• to
cr..-
cd.
Nott
obo:
r~:p
rodu
allo
rdis
trib
UIN"
·itl
loul
po:n
nis5
ion
.
1:67
,572
·~
Dat
o:M
ey3
,20
18
r+
r+
Q) 0 ::r
3 CD
::l
r+ ~
CNCL - 73
Voting Division I Place
RC13 Sea Island RE08 Whiteside RC10 Talmey RC03 Gilmore RC04 Grauer RE04 William Bridge RC07 Brighouse RS10 Maple Lane RS09 Blundell RC11 Tomsett RS02 Steves RC09 Richmond High RC06 McKay RE10 Woodward RC05 Blair RE03 Walter Lee RE07 Kingswood RE09 McNair RE02 Palmer RSOl Dixon RE11 Hamilton RS03 Byng RC02 Quilchena RC08 Minoru Seniors Centre RE05 Tait RS08 Westwind RS04 Diefenbaker RS07 Steveston-London RS06 Wowk RCOl Thompson RC12 Cook RE06 McNeely REOl General Currie RS05 Homma
The Voting Divisions with the highest number of ballots cast in 2014 (circled in RED)
were moderately or significantly outside of the target range.
5818795 CNCL - 74
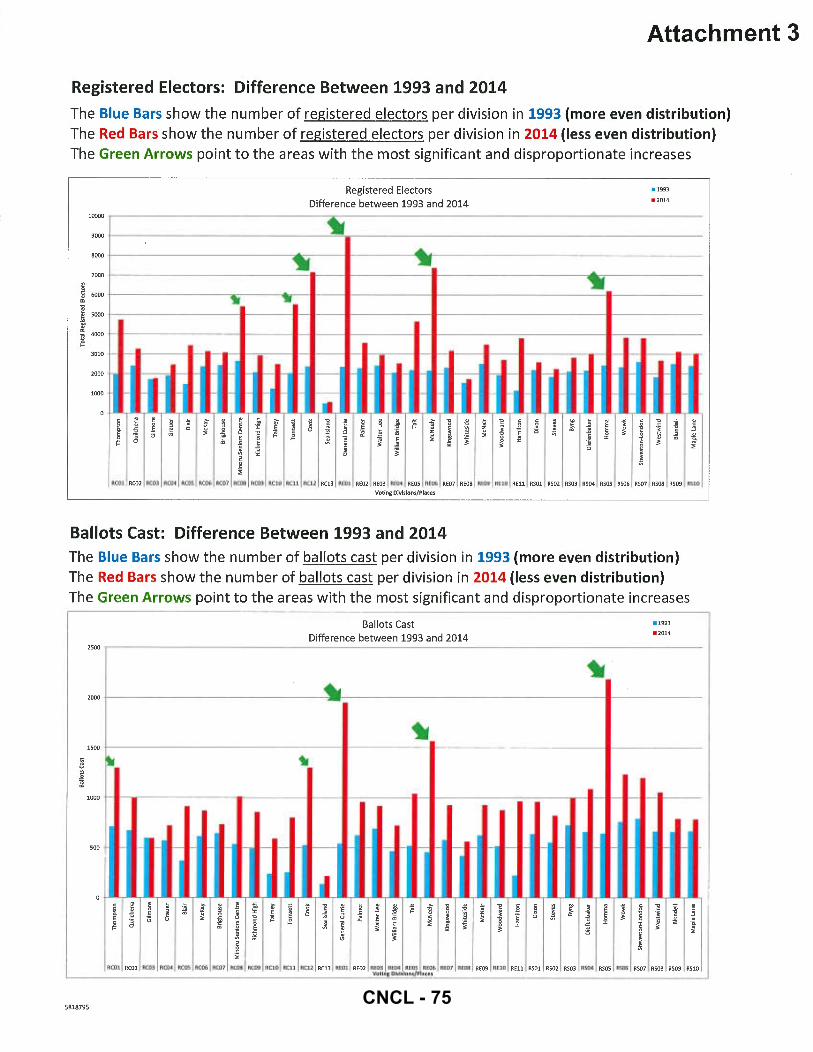
Attachment 3
Registered Electors: Difference Between 1993 and 2014
The Blue Bars show the number of registered electors per division in 1993 (more even distribution) The Red Bars show the number of registered electors per division in 2014 (less even distribution) The Green Arrows point to the areas with the most significant and disproportionate increases
Ballots Cast: Difference Between 1993 and 2014 The Blue Bars show the number of ballots cast per division in 1993 (more even distribution) The Red Bars show the number of ballots cast per division in 2014 (Jess even distribution)
The Green Arrows point to the areas with the most significant and disproportionate increases
Registered Electors Per Voting Division Current Divisional Grid (in use between 1993 and 2014)
vs.
Attachment 5
Proposed Divisional Grid for 2018
Sorted by# of Registered Electors If No Changes Made
With No Changes -~- Pro~osed Changes
Total# of Registered Electors Total # of Registered Electors Voting Division I Place per Division under the per Division under the Proposed
Current (1993-2014) 2018 Divisional Grid (all
Divisional Grid Divisions less than 5,500)
MacNeil (previously part of Cook) 0 5,463
Kwantlen (previously part of Tomsett) 0 4,443
C. C. C. Centre (previously part of Minoru) 0 1,907 McMath (previously part of Homma) 0 2,546
Sea Island 551 551
Gilmore 1,619 1,619
Whiteside 1,683 3,720
Steves 2,103 2,103
Grauer 2,133 2,133
Westwind 2,407 2,407
De beck 2,427 3,521
Dixon 2,528 2,528
Woodward 2,787 2,787
Blundell 2,834 2,834
Byng 2,847 3,610
Walter Lee 2,886 3,222
Talmey 2,932 3,299
Brighouse 2,995 2,995
Maple Lane 3,008 3,062
Kingswood 3,037 3,037
Diefenbaker 3,037 3,037
McKay 3,158 3,158
Quilchena 3,241 3,241
Minoru Centre (previously Rmd. High) 3,376 4,186
Blair 3,414 3,920
Steveston-London 3,461 3,461
McNair 3,522 3,522
Palmer 3,558 4,955
Wowk 3,623 3,623
Hamilton 3,810 3,810
Spul'u'kwuks 4,495 3,989
Tait 4,965 4,598
Kiwanis Twrs (previously part of Minoru) 5,997 X 1,941 v' Homma 6,294 X 2,985 "' Tomsett 6,602 X
4,477 "'· McNeely 7,332 X 5,014 v'/ Anderson (previously part of Cook) 7,649 _1( 3,618 y General Currie 9,070 ~ 4,058 v'
The proposed divisional grid would correct(~ ) the divisions with the highest number of registered electors and bring them back into a more manageable range. Overall, registered electors would be more evenly distributed across all divisions. The maximum number of registered electors per division would be 5,500.
CNCL - 77
Attachment 6
Registered Electors: 2018
The Red Bars show the number of registered electors per division for 2018 if no changes are made. The Green Arrows point to the areas that would remain problematic if no changes were made.
The Green Bars show the distribution of registered electors under the Proposed Divisions for 2018 which is much more evenly distributed across the City, more manageable for administrative purposes, and offers a more consistent election experience for the public.