Civil ServiceRetirement System Annuitants and Social Security by Robert Dalrymple, Susan Grad, and Duke Wilson* This article examines the extent to which annuitants of the Federal employee Civil Service Retirement System (CSRS) are entitled to Social Security benefits. It is based on linked admin- istrative data files from the two systems. Ninety-one percent of all those receiving CSRS annuities in 1979 had worked at some point in their careers in jobs that were covered by Social Securi- ty. Almost 80 percent of the annuitants aged 65 or older were entitled to Medicare benefits. Of those aged 62 or older, 73 per- cent were entitled to Social Security cash benefits, including 10 percent who were entitled only as spouses or survivors of work- ers covered under Social Security. About 39 percent of the fe- male annuitants aged 62 or older were entitled to benefits as wives or widows of workers, including some who were also in- sured for benefits based on their own earnings. The average combined benefit for those with Social Security was $845 among annuitants aged 62 or older. For those receiving only CSRS annuities, the average was $959. Those not entitled to a Social Security benefit tended to have more years of Federal service and higher annuities than did those entitled to both a Social Security benefit and a CSRS annuity. Virtually all permanent, civilian jobs in the Federal Government are covered under the Civil Service Retire- ment System (CSRS), rather than under Social Security. Founded 15 years before the enactment of Social Securi- ty, the CSRS was designed to stand alone. Unlike most employer-sponsored pensions in the private sector, CSRS annuities were not intended to supplement Social Security benefits. Yet, most Federal workers who earn a CSRS annuity also receive Social Security benefits at some time. Many earn benefits based on their work in Social Security cov- ered employment before, during, or after their Federal careers. Others become entitled to Social Security bene- fits because they are spouses or survivors of covered workers. Becausemost Federal annuitants ultimately re- ceive Social Security benefits and because their annuities were not designed to supplement Social Security, pro- posals intermittently have been made to coordinate the two systems. This article looks at the extent of overlapping receipt of benefits from CSRS and Social Security in 1979. It first describes the CSRS annuitant population, then re- ‘Dalrymple’and Wilson are with the Program Analysis Staff, Office of Research and Statistics (ORS), Office of Policy, Social Security Administration. Grad is with the ORS Division of Retirement and Survivors Studies. views the extent to which annuitants worked in employ- ment covered by Social Security. It next examines the extent to which annuitants receive various types of So- cial Security benefits and describes the size of those benefits. Finally, it provides data on the combined bene- fits-annuities and Social Security benefits-paid to an- nuitants. Findings from this study are compared with those from similar studies in 1967 and 1975.’ The study methodology is described in a technical appendix. Major Findings In general, CSRS annuitants in 1979 were relatively young, their number was increasing, and some were re- ceiving substantial annuities. t Preliminary results based on the 1979 sample were previously pub- lished by the authors in Federal Civil Service Annuitants and Social Security (Research and Statistics Note No. 6), Office of Research and Statistics, Office of Policy, Social Security Administration, 1982. For the 1967 findings, see Elizabeth M. Heidbreder, “Federal Civii-Serv- ice Annuitants and Social Security,” Social Security Bulletin, July 1969, pages 20-33, and Alfred M. Skolnik and Carolyn Jackson, Age and Sex Characteristics of Civil Service Annuitants in Relation to So- cial Security (Research and Statistics Note No. 13), Office of Research and Statistics, Social Security Administration, 1970. The 1975 data appear in Daniel N. Price and Andrea Novotny, “Federal Civil-Serv- ice Annuitants and Social Security, December 1975,” Social Swurity Bulletin, November 1977, pages 3-18, and Daniel N. Price, “Experi- ence of Federal Annuitants Under OASDHI: Age and Sex,” Social Security Bulletin, July 1979, pages 33-37. Social Security Bulletin, February 1983/Vol. 46, No. 2 39
Transcript
Civil Service Retirement System Annuitants and Social Security
by Robert Dalrymple, Susan Grad, and Duke Wilson*
This article examines the extent to which annuitants of the Federal employee Civil Service Retirement System (CSRS) are entitled to Social Security benefits. It is based on linked admin- istrative data files from the two systems. Ninety-one percent of all those receiving CSRS annuities in 1979 had worked at some point in their careers in jobs that were covered by Social Securi- ty. Almost 80 percent of the annuitants aged 65 or older were entitled to Medicare benefits. Of those aged 62 or older, 73 per- cent were entitled to Social Security cash benefits, including 10 percent who were entitled only as spouses or survivors of work- ers covered under Social Security. About 39 percent of the fe- male annuitants aged 62 or older were entitled to benefits as wives or widows of workers, including some who were also in- sured for benefits based on their own earnings. The average combined benefit for those with Social Security was $845 among annuitants aged 62 or older. For those receiving only CSRS annuities, the average was $959. Those not entitled to a Social Security benefit tended to have more years of Federal service and higher annuities than did those entitled to both a Social Security benefit and a CSRS annuity.
Virtually all permanent, civilian jobs in the Federal Government are covered under the Civil Service Retire- ment System (CSRS), rather than under Social Security. Founded 15 years before the enactment of Social Securi- ty, the CSRS was designed to stand alone. Unlike most employer-sponsored pensions in the private sector, CSRS annuities were not intended to supplement Social Security benefits.
Yet, most Federal workers who earn a CSRS annuity also receive Social Security benefits at some time. Many earn benefits based on their work in Social Security cov- ered employment before, during, or after their Federal careers. Others become entitled to Social Security bene- fits because they are spouses or survivors of covered workers. Because most Federal annuitants ultimately re- ceive Social Security benefits and because their annuities were not designed to supplement Social Security, pro- posals intermittently have been made to coordinate the two systems.
This article looks at the extent of overlapping receipt of benefits from CSRS and Social Security in 1979. It first describes the CSRS annuitant population, then re-
‘Dalrymple’and Wilson are with the Program Analysis Staff, Office of Research and Statistics (ORS), Office of Policy, Social Security Administration. Grad is with the ORS Division of Retirement and Survivors Studies.
views the extent to which annuitants worked in employ- ment covered by Social Security. It next examines the extent to which annuitants receive various types of So- cial Security benefits and describes the size of those benefits. Finally, it provides data on the combined bene- fits-annuities and Social Security benefits-paid to an- nuitants. Findings from this study are compared with those from similar studies in 1967 and 1975.’ The study methodology is described in a technical appendix.
Major Findings In general, CSRS annuitants in 1979 were relatively
young, their number was increasing, and some were re- ceiving substantial annuities.
t Preliminary results based on the 1979 sample were previously pub- lished by the authors in Federal Civil Service Annuitants and Social Security (Research and Statistics Note No. 6), Office of Research and Statistics, Office of Policy, Social Security Administration, 1982. For the 1967 findings, see Elizabeth M. Heidbreder, “Federal Civii-Serv- ice Annuitants and Social Security,” Social Security Bulletin, July 1969, pages 20-33, and Alfred M. Skolnik and Carolyn Jackson, Age and Sex Characteristics of Civil Service Annuitants in Relation to So- cial Security (Research and Statistics Note No. 13), Office of Research and Statistics, Social Security Administration, 1970. The 1975 data appear in Daniel N. Price and Andrea Novotny, “Federal Civil-Serv- ice Annuitants and Social Security, December 1975,” Social Swurity Bulletin, November 1977, pages 3-18, and Daniel N. Price, “Experi- ence of Federal Annuitants Under OASDHI: Age and Sex,” Social Security Bulletin, July 1979, pages 33-37.
Social Security Bulletin, February 1983/Vol. 46, No. 2 39
l The number of CSRS primary annuitants in- creased substantially during the 1970’s: By 1979, the number of annuitants had reached 1.2 million, 20 percent more than in 1975 and more than twice the number in 1967.
l In 1979, 30 percent of all annuitants were under age 62. Overall, 63 percent of all annuitants on the rolls in 1979 had claimed retirement or disability annuities under CSRS before reaching age 62,
l In constant 1979 dollars, the median CSRS annu- ity rose 45 percent between 1967 and 1975 and in- creased by 1 percent between 1975 and 1979 (to $667). Annuities were larger both because annui- tants were working longer and because of a change in the CSRS benefit formula in 1969.
As a rule, CSRS annuitants in 1979 had engaged in at least some (and often lengthy) employment covered un- der Social Security, despite the fact that their Federal service was not covered under that program.
Overall, only 9 percent of the CSRS annuitants had never had earnings in employment covered under Social Security. This proportion represents a significant decrease from the 24 percent of all CPRS annuitants in 1967 who had never had cov- ered earnings.
Forty-five percent of all CSRS annuitants were permanently insured under Social Security at the time they retired from the Federal Government. These annuitants already had sufficient coverage under Social Security to be eligible for Social Se- curity cash benefits at age 62.
Overall, 41 percent of all CSRS annuitants in 1979 worked in employment covered under Social Secu- rity after they retired under CSRS. Fourteen per- cent of all CSRS annuitants achieved permanently insured status under Social Security as a result of their covered work after CSRS retirement.
Thus, over time, most CSRS annuitants also become entitled to both Social Security cash benefits and to Hospital Insurance based on their own or their spouse’s covered earnings.
l Almost four out of five CSRS annuitants in 1979 who were aged 65 or older we’re entitled to Medi- care benefits: 79 percent were entitled to Hospital Insurance (HI) benefits and 70 percent were en- rolled in the Supplementary Medical Insurance (SMI) program.
l Of the CSRS annuitants who were aged 62 or older, 76 percent were eligible for cash benefits under Social Security: 63 percent were entitled to primary benefits, 10 percent were entitled to sec- ondary benefits, and 3 percent were permanently
insured under Social Security but had not yet claimed cash benefits.
l As would be expected, the Social Security cash benefits earned by CSRS annuitants tended to be smaller than those earned by non-Federal work- ers. To illustrate, 60 percent of all CSRS annui- tants who received retired-worker benefits, com- pared with 25 percent of all Social Security retired- worker beneficiaries, had a primary insurance amount of less than $200.
Taken together, CSRS annuities and Social Security benefits seemed to produce replacement rates at retire- ment that are roughly comparable to those afforded pri- vate sector workers who receive pensions.
The 27 percent of CSRS annuitants aged 62 or old- er who had not established entitlement to Social Security benefits tended to be workers with long Federal careers and, therefore, to have large CSRS annuities. Among annuitants at least aged 62, those who were not entitled to Social Security had a median of 3 1 years of Federal service, an average CSRS annuity of $959, and a median replacement rate of 56 percent. Those annuitants who received both a CSRS annuity and a Social Security benefit had a median of 24 years of Federal service, an av- erage combined benefit (CSRS plus Social Securi- ty) of $845, and a median combined replacement rate of 58 percent (their annuities alone provided a median replacement rate of 43 percent).
The median combined replacement rate for all male annuitants aged 62 or older was 59 percent- slightly higher than the 54 percent estimated in 1976 for men who had both Social Security and a pension from covered employment.
Those who earned both a CSRS annuity and their own Social Security benefit had widely varying lengths of Federal service and thus received a wide range of benefit amounts. The average combined benefit amount for annuitants aged 62 or older with a Social Security benefit and less than 10 years of Federal service was $422, compared with $1,229 for those with 30 or more years of Federal service.
About 39 percent of the female CSRS annuitants aged 62 or older were entitled to Social Security benefits as wives or widows. (Some of these women also were insured for benefits based on their own work.) If the public pension offset en- acted in December 1977 had applied to these women, their Social Security benefits as wives or widows would have been offset $1 for $1 against their annuity amount.2
2 The public pension offset, legislated in December 1977, was imme- diately effective for most men.
40 Social Security Bulletin, February 1983/Vol. 46, No. 2
The Data Base The CSRS Annuitant Population This study is based on the total population of retired
and disabled CSRS annuitants whose names were in the Office of Personnel Management (OPM) files in June 1979 and who were also included in the l-percent Con- tinuous Work History Sample (CWHS), a sample of all persons with Social Security numbers maintained by the Social Security Administration. The CWHS data on So- cial Security covered earnings were used to determine the extent of Social Security coverage earned by the annuitants. Social Security benefit data for these annui- tants were drawn from the Social Security Administra- tion’s Master Beneficiary Record.
In 1979, 1.2 million persons received CSRS annuities as retired or disabled Federal employees-more than twice as many as in 1967 (table 2): This section presents data on the age of these annuitants in 1979, the ages at which they claimed their annuities, the amount of their annuities, and the degree to which the annuities replaced preretirement earnings.
Age in 1979
After mismatched cases were excluded, the total sam- ple size for the study was 10,467. This number, which is about 10 percent less than the expected 1 percent of the total population of CSRS annuitants on the rolls in June 1979, was weighted to adjust for missing cases? The dis- tribution of annuitants by age and annuity amounts in this weighted sample is very similar to that for the total population of CSRS annuitants (table 1). Therefore, the estimates in this article appear to be reasonably repre- sentative of the CSRS annuitant population as a whole.
The study group includes only CSRS primary annui- tants-those receiving retirement or disability annuities on the basis of their own Federal employment. It ex- cludes those receiving CSRS annuities as survivors of annuitants.
The age distribution of CSRS annuitants reflects the variety of early retirement options available to Federal employees. A Federal employee may retire voluntarily under CSRS with a full annuity at age 55 with 30 years of service, at age 60 with 20 years of service, or at age 62 with 5 years of service. Other standards permitting re- tirement at earlier ages or with fewer years of service ap- ply to a small number of hazardous occupations and under special circumstances, such as early retirement due to reductions in force or reorganization. In addi- tion, a Federal employee with 5 years of service who be- comes disabled may receive a CSRS annuity at any age.
3 See the Technical Appendix for a description of the weighting procedure.
Thirty percent of all CSRS annuitants were younger than age 62 in 1979, 56 percent were aged 65 or older, and 27 percent were aged 72 or older (table 3). Seventy- two percent of the annuitants were men and 28 percent were women. On the average, female annuitants were older than male annuitants, in part because women tend to live longer than men. Thirty-three percent of the
Table l.-CSRS annuitants: Percentage distribution, by age and annuity amounts, June 1979
4 A variety of other, smaller Federal staff retirement plans exist, but these are, by law or practice, substantially the same as the CSRS. Many of these other plans were modeled on the CSRS when they were established. Other plans frequently contain amendments requiring them to change as the CSRS changes. The only clear exceptions to the CSRS pattern are small plans for the Federal judiciary.
Item
Number ..................
Age of annuitant: Under55 ..................... 55-59 ........................ 60-64 ........................ 65-69 ........................ 70-79 ........................ 80 or older. ...................
’ Source: Office of Personnel Management, Federal Fringe Benefit Facts, 1979, 1980, tables B-10 and B-l 1,
2 Includes the September 1, 1979, cost-of-living adjustment of 6.9 percent to permit comparison with Office of Personnel Management data. This adjust- ment is not included elsewhere in the study.
Table 2.-Number of CSRS annuitants on the rolls by June 30 of each year and net year-to-year increase, 1966-79
women but only 24 percent of the men were aged 72 or older.
Number. 1,154.7
Percent 100
Under 55 24 55-61......................... 39 62-64......................... 21 65-69, _...................._ I2 70 or older 3
347.0
100
64 36
Men
807.7
100
7 41 30 18 5
The population of annuitants was younger in 1979 than in 1967. Most of the change in the age distribution had occurred by 1975. The proportion of CSRS annui- tants who were aged 65 or older fell from 69 percent in 1967 to 57 percent in 1975 and to 56 percent in 1979. The following tabulation shows that the proportion who were aged 62 or older fell just as markedly-from 78 percent in 1967 to 69 percent in 1975 and to 70 percent in 1979.
Age When Annuity Was Claimed Note: The CSRS annuity effective date was not reported by 1 I I sample cases.
Overall, 63 percent of all CSRS annuitants in 1979 had claimed their retirement or disability annuity before age 62 (table 4). On the average, men went on the annui- ty rolls earlier than did women: 67 percent of the men but only 54 percent of the women claimed their annuity before reaching age 62.
The data file used for this study did not identify which persons were receiving annuities on the basis of a disability. Other OPM data, however, indicate that 28 percent of the annuitants on the rolls in 1979 were re- ceiving disability annuities.5 These data suggest that about one-third of all CSRS annuitants retired before age 62 for reasons other than disability.
About 15 percent of all annuitants did not claim their annuity until age 65 or later. Three percent waited until age 70, the mandatory retirement age that applied to Federal workers until 1978.
highest earnings6 and on length of Federal service. An annuitant receives 16.25 percent of the “high 3” aver- age salary for the first 10 years of service and 2 percent more for each additional year up to a maximum of 80 percent after nearly 42 years of service. With 20 years of service, the formula provides 36.25 percent of the high-3 average salary and with 30 years it replaces 56.25 per- cent of previous earnings.
Years of service. CSRS annuitants in 1979 had a median of 26 years of Federal employment (table 5). About 38 percent of the annuitants had at least 30 years of service, only 3 percent had 40 or more years, and 8 percent had fewer than 10.7
6 Although earnings used to calculate Social Security benefits are indexed to reflect changes in wage levels in the years before retire- ment, earnings used to calculate the CSRS annuity are not indexed.
Annuity Amounts The amount an annuitant receives is based on the av-
erage annual salary for the 3 consecutive years of
J Office of Personnel Management, Federal Fringe Benefit Facts, 1979, 1980, table B-3.
7 To help finance the Civil Service Retirement System, Federal em- ployees and their employing agencies each pay 7 percent of gross pay. The remaining cost is paid from Federal general revenues. Employees who leave Federal service before retirement may withdraw their own contributions to the CSRS and forgo any future annuity. Alterna- tively, if they have at least 5 years of service, they may leave their con- tributions in the CSRS and claim a deferred annuity when they reach retirement age. Only 6 percent of all annuitants on the rolls in 1979 were receiving a deferred annuity. Most workers who leave Federal employment withdraw their contributions. See Office of Personnel Management, op. cit., table B-3.
42 Social Security Bulletin, February 1983IVol. 46, No. 2
Table L-Years of Federal service and median Federal earnings for the high-3 years: Percentage distribution, by age and sex, 1979
[Number in thousands]
Years of Federal service
Number. .................
Percent ..................
Less than 10 .................... IO-19 ......................... 20-29 ......................... 30-39 ......................... 40ormore.. ...................
Median number of years. ..........
Median Federal earnings (high-3 years average). ................
Number. .................
Percent ..................
Less than 10. ................... IO-19 ......................... 20-29 ......................... 30-39 ......................... 40ormore.. ...................
Median number of years. ..........
Median Federal earnings (high-3 years average). ................
Number. .................
Percent ..................
Less than 10 .................... IO-19 ......................... 20-29 ......................... 30-39 ......................... 40ormore.. ...................
Median number of years. ..........
Median Federal earnings (high-3 years average). ................
t Less than0.5 percent.
All annuitants
1.165.8 I 347.0 I 818.8
$9,779 $12,377 $8,658
Men I I
837.5 1 265.3 1 572.2
E10.693 1 $13,310 / 59,561
Women
328.3 1 81.7 1 246.6 100 100 100
12 19 10 31 25 33 37 36 37
II-I- 19 20 I9
I 0 1
20.6 20.6 20.6
67,933 $10,278 ) $7,061
On the average, men had more years of service than did women-a median of 28 years, compared with 21 years for women. These medians reflect the fact that 44 percent of the men, but only 20 percent of the women, had 30 or more years of Federal service and that only 6 percent of the men, but 12 percent of the women, had fewer than 10 years of Federal service.
Annuitants younger than age 62 include both those with relatively short service who receive annuities on the basis of disability or other special provisions and those with relatively long service who are eligible to retire early. Those aged 62 or older had a median of 25 years of service, with older annuitants having somewhat fewer
years than those closer to age 62. Annuitants aged 62-64 had a median of 28 years of service, those aged 65-71 had 26 years, and those aged 72 or older had 24 years.
Annuity amounts and replacement rates. The median CSRS annuity in 1979 was $667 a month. About 10 per- cent of all annuitants received less than $250 and 8 per- cent had annuities of $1,500 or more (table 6). Because women tend to have fewer years of service and lower earnings than do men, their median annuity was only 63 percent of the median for men.
CSRS annuities replaced a median of 47 percent of the annuitant’s high 3 years of Federal earnings.8 The median replacement rate for men was 50 percent; for women, it was 41 percent.
The median CSRS annuity has increased in both cur- rent and constant dollars since 1967, as the following tabulation shows. In current dollars, the median amount in 1967 was $208 a month, and in 1975 it was $487. In constant dollars, the median increased 47 per- cent from 1967 to 1979. Most of that increase occurred by 1975; between 1975 and 1979, the median increased by only 1 percent in constant dollars. The increase after 1967 reflects at least four factors that affect the size of CSRS annuities. One factor was a 1969 change in the CSRS benefit formula, which lowered from 5 to 3 the number of consecutive high years used in calculating the annuity. This change tended to raise the measure of av- erage earnings. A second factor was the average wage increases for active Federal workers from July 1968 to January 1973, which resulted in a 13-percent increase in real wages.9 The annuity increase also reflects a third factor, which was the rise in years of service among an- nuitants. A final factor that raised the real level of CSRS annuities about 9 percent in this period was the legislated benefit increases from November 1969 to March 1976. These increases were 1 percentage point higher than the rise in the Consumer Price Index.
Item 1967 1975 1979
Median CSRS annuity . . . . . . . . $208 $487 $667 Median CSRS annuity in 1979
dollars . . . . . . . . . . . . . . . . . . . $453 $658 $667 Median years of Federal service . . 23 25 26 Percent with 30 years or more of
Federal Service . . . . . . . . . . 3 1 34 38
* In the replacement rate calculations, the annuitants’ high 3 years of earnings were indexed between the effective date of the annuity and 1979 by the amount of the cost-of-living increases applied to annuities during the period. See the Technical Appendix for a further explana- tion of the replacement rate calculation.
9 Except for the wage increase in October 1977, all of the annual in- creases in Federal wages from October 1973 to October 1982 have been less than the increase in the Consumer Price Index (CPI), result- ing in a decline in real wages. Since March 1976, CSRS benefit in- creases have been equal to the CPI. See Committee on Post Office and Civil Service, House of Representatives, Committee Print No. 97-5, April 26, 1982.
Social Security Bulletin, February 1983/Vol. 46, No. 2 43
Social Security Coverage Earned by CSRS Annuitants
This section provides data on the amount of Social Security coverage earned by CSRS annuitants, and the extent to which their coverage exceeded or fell short of the amount necessary to be entitled to Social Security benefits. Statistics are also provided on the extent to which this coverage was earned before or after CSRS annuities were received.
Quarters of Coverage Under Social Security To be insured for Social Security benefits, and thus be
eligible to receive retired-worker benefits at age 62, workers must earn 1 quarter of coverage for each year between 1950 and the year they turn age 62. Until 1978, a quarter of coverage was credited to a worker’s account if he or she had at least $50 in Social Security covered earnings in that calendar quarter. Beginning in 1978, Social Security coverage was determined on an annual basis and the amount needed for 1 quarter of coverage was set at $250 (with the amount indexed to the in- creases in average earnings thereafter). A person turning age 62 in 1979 needed 28 quarters of coverage to be per- manently insured.
In 1979, the annuitants had a median-of 28 quarters of coverage (32 for men and 20 for women).‘O Those with more years of service under the CSRS tended to have fewer quarters of coverage than those with shorter CSRS service. Among annuitants with fewer than 10 years of Federal service, 41 percent of the men and 13 percent of the women had at least 80 quarters (or 20 years) of coverage under Social Security (table 7). Only 9 percent of all annuitants in 1979 had no employment covered under Social Security, compared with 24 per- cent in 1967.”
Insured Status About 60 percent of all CSRS annuitants were perma-
nently insured for Social Security benefits-that is, they had enough quarters of covered employment to be eligi- ble for retired-worker benefits at age 62. Older annui- tants were more likely than younger annuitants to be insured: 65 percent of those aged 62 or older were per- manently insured, compared with 47 percent of those younger than age 62. Male annuitants were more likely to be permanently insured than were females: 64 per- cent of the men, compared with 49 percent of the women.
Coverage exceeding the minimum needed. Few of the annuitants who were insured for retired-worker benefits
10 The source of information on Social Security quarters of cover- age was complete only through 1977. See the technical appendix for the imputation procedure used to.calculate quarters of coverage for 1978 and 1979.
11 See Elizabeth M. Heidbreder, op. cit., table 3.
Table 6.-Monthly CSRS annuity and median CSRS annual annuity as a percent of average high-3 years of Federal earnings: Percentage distribution, by age and sex, 1979
[Number in thousands]
Number. .................
Percent ..................
Less than $250 .................. $250-$499 ..................... SSOO-$749 ..................... $750-$999 ...... : .............. $l,OOO-$1,499 .................. $1,5OOormore.. ................
Median amount .................
Median CSRS annual annuity as a percent of high-3 years of Federal earnings average. ........
Median CSRS annual annuity as a percent of high-3 years of Federal earnings average. ........ 50.2
Women
Number. ................. 328.3 81.7 246.6
Percent ..................
Less than $250 .................. $250-$499 ..................... $500-$749 ..................... S750-$999 ..................... $l.OOO-$1,499 .................. 51,500ormore ..................
Median amount .................
Median CSRS annual annuity as a percent of high-3 years of Federal earnings average. ........
100 100 loo
18 6 23 36 41 35 25 28 24 12 14 I1 7 9 7 I 2 1
$470 $519 5450
40.7 42.3 39.6
had only the minimum number of quarters of coverage needed for insured status. Although 60 percent were in- sured, only 2 percent had just the minimum number of quarters needed (table 8). For the insured annuitants, the median number of quarters above the minimum needed was 19 (or nearly 5 years). About 16 percent of all annuitants-or 27 percent of those who were perma- nently insured-had more than 40 quarters of coverage beyond the number needed for permanently insured status.
44 Social Security Bulletin, February 19831Vol. 46, No. 2
Table 7.-Quarters of Social Security coverage: Per- centage distribution, by years of Federal service and sex, 1979
Coverage short of the minimum needed. Annuitants who were not permanently insured included some who needed very little additional covered work in order to be insured. The 40 percent of all annuitants who were not insured included 12,percent who needed no more than 2 additional years (8 quarters) of covered employment in order to be insured.
Men aged 62 or older were the most likely to be in- sured, or almost insured: 69 percent were insured and 9 percent needed no more than 2 additional years of cov- ered employment to achieve that status. Among women aged 62 or older, 56 percent were insured and 14 percent needed no more than 2 more years of covered work to become insured.
Coverage earned before CSRS retirement. About 45 percent of all CSRS annuitants in 1979 had enough quarters of coverage when they retired from their Feder-
al jobs to be insured for Social Security benefits (table 9). Those who became annuitants at age 62 or later were more likely to be permanently insured than were those who became annuitants at younger ages. About 61 per- cent of those aged 62 or older when they retired from Federal service needed no more quarters of coverage, compared with 36 percent of those who claimed CSRS annuities before age 62. It is not possible to determine whether these annuitants earned their quarters of cover- age before or during their Federal careers.
Coverage earned after CSRS retirement. Although Social Security benefits are subject to an earnings test, CSRS annuities are not. Thus, postretirement work is common among annuitants: About 41 percent of all an- nuitants in 1979 had worked in Social Security covered jobs after becoming annuitants.
Of all annuitants, 14 percent gained permanently in- sured status after becoming annuitants. Those younger than age 62 when they retired under CSRS were twice as likely to earn the necessary additional quarters by 1979 as were those older than age 62, as shown below.
Age when CSRS annuity began
CSRS annuitants Total Under Aged 62 age 62 or older
All annuitants
Total percent . . . . . . 100 100 100
Worked in Social Security covered em- ployment after annuity began. . . . . 41 46 33
Insured when annuity began. . . . . . . . I8 17 21 Became insured as of June 1979. . . 14 18 9 Not insured by June 1979. . . . . 9 12 4
Did not work in Social Security covered employment after annuity began . 59 54 67
Pre-1975 annuitants
Total percent . . . . . . . . . 100 100 100
Worked after annuity began . . . . . . . 48 55 37 Insured when annuity began. . . . . . 20 19 22 Became insured as of June 1979. . . . 19 24 I1 Not insured by June 1979. . . . . . . . . 9 12 4
Did not work after annuity began . . . . . 52 45 63
When only those who had been annuitants for at least 5 years are considered, the importance of postretirement work becomes more clear. Of those who became annui- tants before 1975, 48 percent later worked in covered employment and 19 percent became permanently in- sured because of that work. Of the pre-1975 annuitants who retired before age 62, 24 percent had earned enough additional quarters of coverage within 5 years to become permanently insured.
Social Security and Medicare Entitlement
In 1982, Social Security covered workers and their employers each paid a tax of 6.7 percent on earnings up
Social Security Bulletin, February 1983/Vol. 46, No. 2 45
Table &-Quarters of Social Security coverage and insured status: Percentage distribution of CSRS annuitants, by quarters of coverage above and below number needed for permanently insured status, age, and sex, 1979
[Number in thousands]
P ~11 annuitants Men Women - Aged 62 or older
Under Aged 62 age62 or older
Under age 62
347.0
loo
Total Under Aged 62 age 62 or older Total
837.5 265.3 572.2 328.3 81.7 246.6
Quarters of coverage Total
Number .....................
Percent. .....................
Permanently insurec
Total percent. ....................... Number of quarters above the minimum:
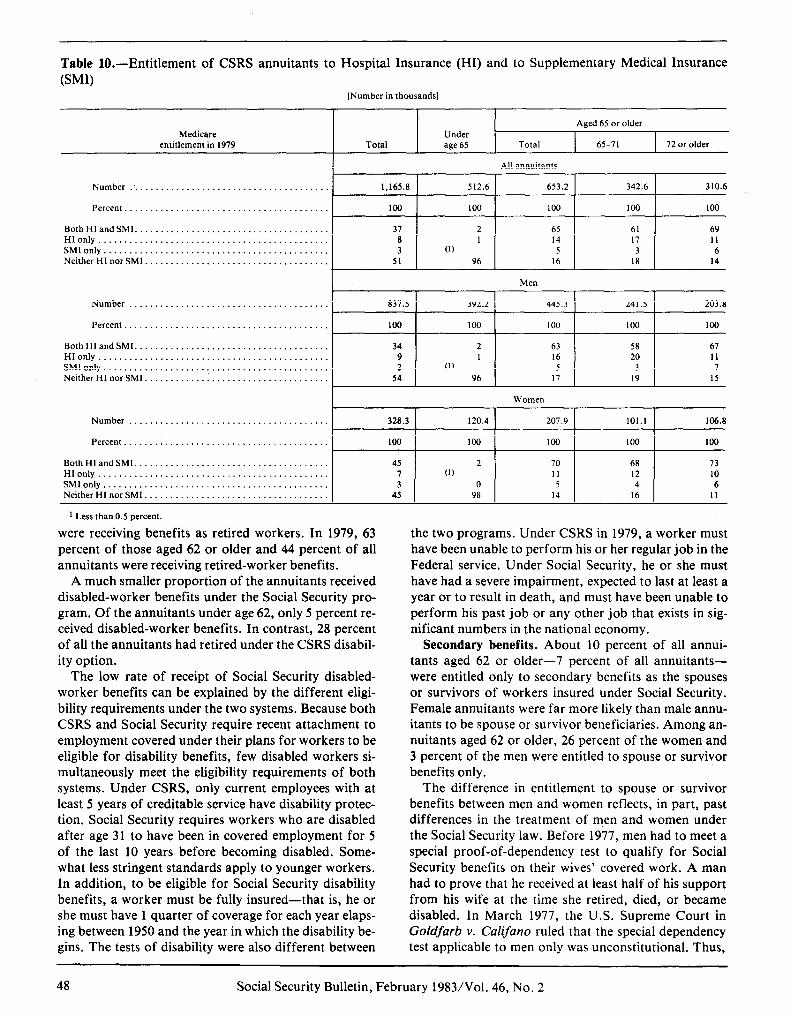
to $32,400-5.4 percent to finance benefits paid under the Old-Age, Survivors, and Disability Insurance pro- gram and 1.3 percent to finance Hospital Insurance ben- efits under Medicare. Because they are covered by CSRS and not Social Security, Federal employees did not pay either of these payroll taxes. Under provisions of the Tax Equity and Fiscal Responsibility Act of 1982, how- ever, Federal employees became subject to the Hospital Insurance portion of the tax in January 1983.
Despite the fact that their Federal employment was not covered under Social Security, many annuitants on the CSRS rolls in 1979 had gained entitlement to Social Security cash benefits or Medicare based either on their own covered work before, during, or after their Federal service or on the basis of the covered work of their spouse. This section examines the extent of Social Secu- rity and Medicare entitlement among the CSRS an- nuitants who were old enough to be eligible for these benefits.
Medicare Medicare is a health insurance program for the aged
and for certain disabled persons. It consists of two
parts: The Hospital Insurance (HI) program pays for most hospital services and the Supplementary Medical Insurance (SMI) program pays for part of the cost of physician and outpatient services.
The HI program is financed almost exclusively by the HI payroll tax on workers and their employers. At age 65, persons automatically become eligible for HI bene- fits with no payment of premiums if they are eligible for Social Security cash benefits based either on their own or their spouse’s covered work. In addition, some per- sons who did not qualify for cash benefits, but who were already relatively old when the Medicare program was enacted in 1965, became eligible for HI benefits under a phase-in provision.12 Finally, persons who do not qualify for HI benefits under the above provisions may elect to pay a premium for HI entitlement at age 65. The monthly premium rate in fiscal year 1979 was $63.
Altogether, 79 percent of the annuitants aged 65 or older were entitled to HI benefits under one of these provisions (table 10). Ten percent were entitled on the basis of their spouse’s covered work. Only 3 percent were entitled under the special phase-in provision and
12 The quarters-of-coverage requirements for HI benefit eligibility vary with the year of birth, from no quarters of coverage for those born before 1903 and increasing in 3-quarter increments annually to 21 quarters for those born between 1903 and 1909. (Federal employees and annuitants were excluded from the zero quarters of coverage re- quirement for HI benefits.) For persons born after 1909 the quarters- of-coverage requirement for HI is the same as that for permanently in- sured status. Most of the CSRS annuitants who achieve HI entitle- ment with fewer quarters of coverage than the number required for permanent insured status were aged 72 or older in 1979.
46 Social Security Bulletin, February 1983/Vol. 46, No. 2
almost all of them were aged 72 or older in 1979. Virtu- ally none (less than half of 1 percent) became entitled by paying the monthly premium.
Eligibility for and financing of the SMI part of Medi- care is different from HI, Anyone aged 65 or older may become entitled to SMI by enrolling in the program and paying a monthly premium. In fiscal year 1979, the pre- mium was $8.20 a month. These premiums cover about 30 percent of the cost of the program and the rest is fi- nanced from general revenues.
In 1979, 70 percent of the aged annuitants had en- rolled in the SMI program. They included 5 percent of the annuitants who were not entitled to Hospital Insur- ance but had opted for the SMI portion. Altogether, 14 percent of the aged annuitants were entitled to HI but had not opted for the SMI part of the program, as shown below.i3
Annuitants aged 65 or,older
Medicare entitlement Total Men Women
Total number (in thousands). 653.2 445.3 207.9
Total percent 100 100 100
Both HI and SMI. . 65 63 70 HIonly.. . 14 16 11 SMI only.. 5 5 5 Neither HI nor SMI. 16 17 14
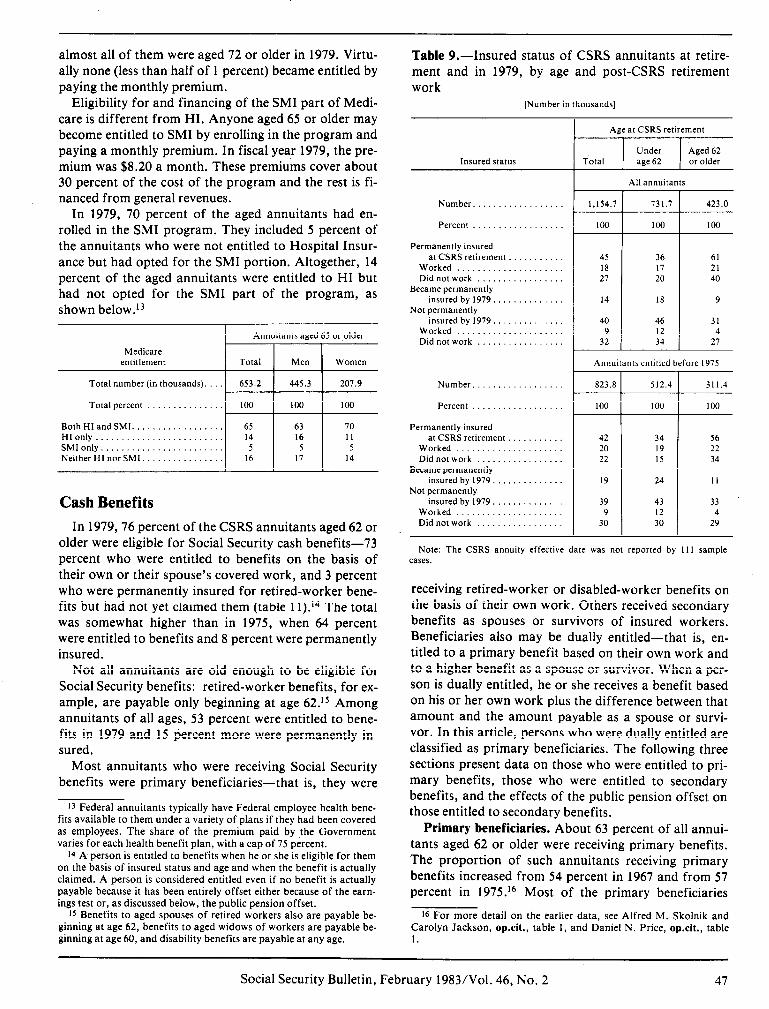
Cash Benefits In 1979,76 percent of the CSRS annuitants aged 62 or
older were eligible for Social Security cash benefits-73 percent who were entitled to benefits on the basis of their own or their spouse’s covered work, and 3 percent who were permanently insured for retired-worker bene- fits but had not yet claimed them (table 1 1).i4 The total was somewhat higher than in 1975, when 64 percent were entitled to benefits and 8 percent were permanently insured.
Not all annuitants are old enough to be eligible for Social Security benefits: retired-worker benefits, for ex- ample, are payable only beginning at age 62.” Among annuitants of all ages, 53 percent were entitled to bene- fits in 1979 and 15 percent more were permanently in- sured.
Most annuitants who were receiving Social Security benefits were primary beneficiaries-that is, they were
13 Federal annuitants typically have Federal employee health bene- fits available to them under a variety of plans if they had been covered as employees. The share of the premium paid by the Government varies for each health benefit plan, with a cap of 75 percent.
14 A person is entitled to benefits when he or she is eligible for them on the basis of insured status and age and when the benefit is actually claimed. A person is considered entitled even if no benefit is actually payable because it has been entirely offset either because of the earn- ings test or, as discussed below, the public pension offset.
ts Benefits to aged spouses of retired workers also are payable be- ginning at age 62, benefits to aged widows of workers are payable be- ginning at age 60, and disability benefits are payable at any age.
Table 9.-Insured status of CSRS annuitants at retire- ment and in 1979, by age and post-CSRS retirement work
[Number in thousands]
Insured status Total
Number. .................
Percent ..................
Permanently insured at CSRS retirement
Worked Did not work
Became permanently insured by 1979.
Not permanently insured by 1979.
Worked Didnotwork
Number. .
Percent
Permanently insured at CSRS retirement
Worked Didnotwork .
Became permanently insured by 1979,
Not permanently insured by 1979.
Worked Did not work
Age at CSRS retirement
Under Aged 62 age 62 or older
All annuitants
423.0 1.154.7 731.7
100 100 100
45 36 61 18 17 21 27 20 40
14 18 9
40 46 31 9 12 4
32 34 27
Annuitants entitled before 1975
42 34 20 19 22 15
19 24
39 43 9 12
30 30
311.4
100
56 22 34
II
33 4
29
Note: The CSRS annuity effective date was not reported by I I1 sample cases.
receiving retired-worker or disabled-worker benefits on the basis of their own work. Others received secondary benefits as spouses or survivors of insured workers. Beneficiaries also may be dually entitled-that is, en- titled to a primary benefit based on their own work and to a higher benefit as a spouse or survivor. When a per- son is dually entitled, he or she receives a benefit based on his or her own work plus the difference between that amount and the amount payable as a spouse or survi- vor. In this article, persons who were dually entitled are classified as primary beneficiaries. The following three sections present data on those who were entitled to pri- mary benefits, those who were entitled to secondary benefits, and the effects of the public pension offset on those entitled to secondary benefits.
Primary beneficiaries. About 63 percent of all annui- tants aged 62 or older were receiving primary benefits. The proportion of such annuitants receiving primary benefits increased from 54 percent in 1967 and from 57 percent in 1975. l6 Most of the primary beneficiaries
16 For more detail on the earlier data, see Alfred M. Skolnik and Carolyn Jackson, op.cit., table 1, and Daniel N. Price, op.cit., table 1.
Social Security Bulletin, February 1983/Vol. 46, No. 2 47
Table lo.--Entitlement of CSRS annuitants to Hospital Insurance (HI) and to Supplementary Medical Insurance (SW
[Number in thousands]
Medicare entitlement in 1979 Total
Under age 65 Total
Aged 65 or older
65-71 72 or older
Number . . . . . . . . . . . . . 1.165.8 5 12.6 653.2 342.6 310.6 1 I I I
Percent. . . . . . ..t.... loo 100 100 100 100 I I I I
Both HI and SMI. . ............. 37 HI only . . . ............. 8 SMI only. . . . ............. 3 Neither HI nor SMI ............. 51
All annuitants
2 65 61 69 1 14 17 11
(1) 5 3 6 96 16 18 14
Men
Number ....................................... 837.5 392.2 445.3 241.5 203.8
were receiving benefits as retired workers. In 1979, 63 percent of those aged 62 or older and 44 percent of all annuitants were receiving retired-worker benefits.
A much smaller proportion of the annuitants received disabled-worker benefits under the Social Security pro- gram. Of the annuitants under age 62, only 5 percent re- ceived disabled-worker benefits. In contrast, 28 percent of all the annuitants had retired under the CSRS disabil- ity option.
The low rate of receipt of Social Security disabled- worker benefits can be explained by the different eligi- bility requirements under the two systems. Because both CSRS and Social Security require recent attachment to employment covered under their plans for workers to be eligible for disability benefits, few disabled workers si- multaneously meet the eligibility requirements of both systems. Under CSRS, only current employees with at least 5 years of creditable service have disability protec- tion. Social Security requires workers who are disabled after age 31 to have been in covered employment for 5 of the last 10 years before becoming disabled. Some- what less stringent standards apply to younger workers. In addition, to be eligible for Social Security disability benefits, a worker must be fully insured-that is, he or she must have 1 quarter of coverage for each year elaps- ing between 1950 and the year in which the disability be- gins. The tests of disability were also different between
the two programs. Under CSRS in 1979, a worker must have been unable to perform his or her regular job in the Federal service. Under Social Security, he or she must have had a severe impairment, expected to last at least a year or to result in death, and must have been unable to perform his past job or any other job that exists in sig- nificant numbers in the national economy.
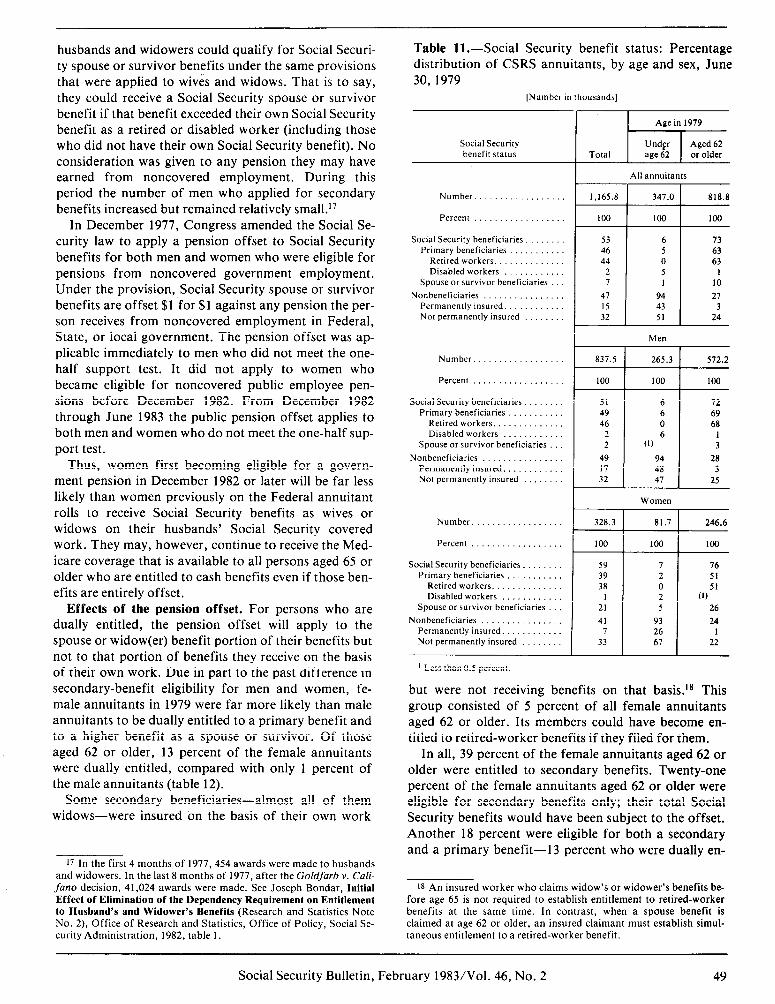
Secondary benefits. About 10 percent of all annui- tants aged 62 or older-7 percent of all annuitants- were entitled only to secondary benefits as the spouses or survivors of workers insured under Social Security. Female annuitants were far more likely than male annu- itants to be spouse or survivor beneficiaries. Among an- nuitants aged 62 or older, 26 percent of the women and 3 percent of the men were entitled to spouse or survivor benefits only.
The difference in entitlement to spouse or survivor benefits between men and women reflects, in part, past differences in the treatment of men and women under the Social Security law. Before 1977, men had to meet a special proof-of-dependency test to qualify for Social Security benefits on their wives’ covered work. A man had to prove that he received at least half of his support from his wife at the time she retired, died, or became disabled. In March 1977, the U.S. Supreme Court in Goldfarb v. Califano ruled that the special dependency test applicable to men only was unconstitutional. Thus,
48 Social Security Bulletin, February 19831Vol. 46, No. 2
husbands and widowers could qualify for Social Securi- ty spouse or survivor benefits under the same provisions that were applied to wives and widows. That is to say, they could receive a Social Security spouse or survivor benefit if that benefit exceeded their own Social Security benefit as a retired or disabled worker (including those who did not have their own Social Security benefit). No consideration was given to any pension they may have earned from noncovered employment. During this period the number of men who applied for secondary benefits increased but remained relatively small.17
In December 1977, Congress amended the Social Se- curity law to apply a pension offset to Social Security benefits for both men and women who were eligible for pensions from noncovered government employment. Under the provision, Social Security spouse or survivor benefits are offset $1 for $1 against any pension the per- son receives from noncovered employment in Federal, State, or local government. The pension offset was ap- plicable immediately to men who did not meet the one- half support test. It did not apply to women who became eligible for noncovered public employee pen- sions before December 1982. From December 1982 through June 1983 the public pension offset applies to both men and women who do not meet the one-half sup- port test.
Thus, women first becoming eligible for a govern- ment pension in December 1982 or later will be far less likely than women previously on the Federal annuitant rolls to receive Social Security benefits as wives or widows on their husbands’ Social Security covered work. They may, however, continue to receive the Med- icare coverage that is available to all persons aged 65 or older who are entitled to cash benefits even if those ben- efits are entirely offset.
Effects of the pension offset. For persons who are dually entitled, the pension offset will apply to the spouse or widow(er) benefit portion of their benefits but not to that portion of benefits they receive on the basis of their own work. Due in part to the past difference in secondary-benefit eligibility for men and women, fe- male annuitants in 1979 were far more likely than male annuitants to be dually entitled to a primary benefit and to a higher benefit as a spouse or survivor. Of those aged 62 or older, 13 percent of the female annuitants were dually entitled, compared with only 1 percent of the male annuitants (table 12).
Some secondary beneficiaries-almost all of them widows-were insured on the basis of their own work
17 In the first 4 months of 1977,454 awards were made to husbands and widowers. In the last 8 months of 1977, after the Goldfarb v. Cali- funo decision, 41,024 awards were made. See Joseph Bondar, Initial Effect of Elimination of the Dependency Requirement on Entitlement to Husband’s and Widower’s Benefits (Research and Statistics Note No. 2), Office of Research and Statistics, Office of Policy, Social Se- curity Administration, 1982, table 1.
Table Il.-Social Security benefit status: Percentage distribution of CSRS annuitants, by age and sex, June 30, 1979
[Number in thousands]
Social Security benefit status
Number..
Percent
Social Security beneficiaries Primary beneficiaries
Retired workers. Disabled workers
Spouse or survivor beneficiaries
Nonbeneficiaries Permanently insured. Not permanently insured
Number. 837.5
Percent . 100
Social Security beneficiaries 5’ Primary beneficiaries 49
Retired workers. 46 Disabled workers 2
Spouse or survivor beneficiaries 2
Nonbeneficiaries 49 Permanently insured. 17 Not permanently insured 32
Number. 328.3
Percent
Social Security beneficiaries Primary beneficiaries
Retired workers. Disabled workers
Spouse or survivor beneficiaries
Nonbeneficiaries Permanently insured. Not permanently insured
‘00
59 39 38
I 21
41 7
33
All annuitants
53 53 6 6 73 73 46 46 5 5 63 63 44 44 0 0 63 63
2 2 5 5 1 1 7 7 1 1 IO IO
47 47 94 94 27 27 15 15 43 43 3 3 32 51 24
Men
265.3
100
6 6 0 6
(1)
94 48 47
Women
81.7
100
7 2 0 2 5
93 26 67
I
I
572.2
‘00
72 69 68
1 3
28 3
25
246.6
loo
76 51 5’
(1) 26
24 1
22
t Less than 0.5 percent.
but were not receiving benefits on that basis.18 This group consisted of 5 percent of all female annuitants aged 62 or older. Its members could have become en- titled to retired-worker benefits if they filed for them.
In all, 39 percent of the female annuitants aged 62 or older were entitled to secondary benefits. Twenty-one percent of the female annuitants aged 62 or older were eligible for secondary benefits only; their total Social Security benefits would have been subject to the offset. Another 18 percent were eligible for both a secondary and a primary benefit-13 percent who were dually en-
1s An insured worker who claims widow’s or widower’s benefits be- fore age 65 is not required to establish entitlement to retired-worker benefits at the same time. In contrast, when a spouse benefit is claimed at age 62 or older, an insured claimant must establish simul- taneous entitlement to a retired-worker benefit.
Social Security Bulletin, February 1983/Vol. 46, No. 2 49
titled and 5 percent who were entitled to widow’s bene- fits and were insured but had not established entitlement to primary benefits. The pension offset would affect only their secondary benefits if it had applied to them. The percent of all female annuitants aged 62 or older who were entitled to secondary benefits is shown in the following tabulation. Widow’s benefits were more com- mon than wife’s benefits among the female annuitants aged 62 or older.
Wife’s Widow’s Female annuitants aged 62 or older Total benefit benefit
Total entitled to secondary benefits.. . 39 15 24
Eligible only for secondary benefit 21 10 11 Eligible for secondary and primary
benefit . 18 5 13 Dually entitled to primary benefit 13 5 8 Eligible, but bad not claimed
primary benefit . 5 (1) 5
1 Less than 0.5 percent.
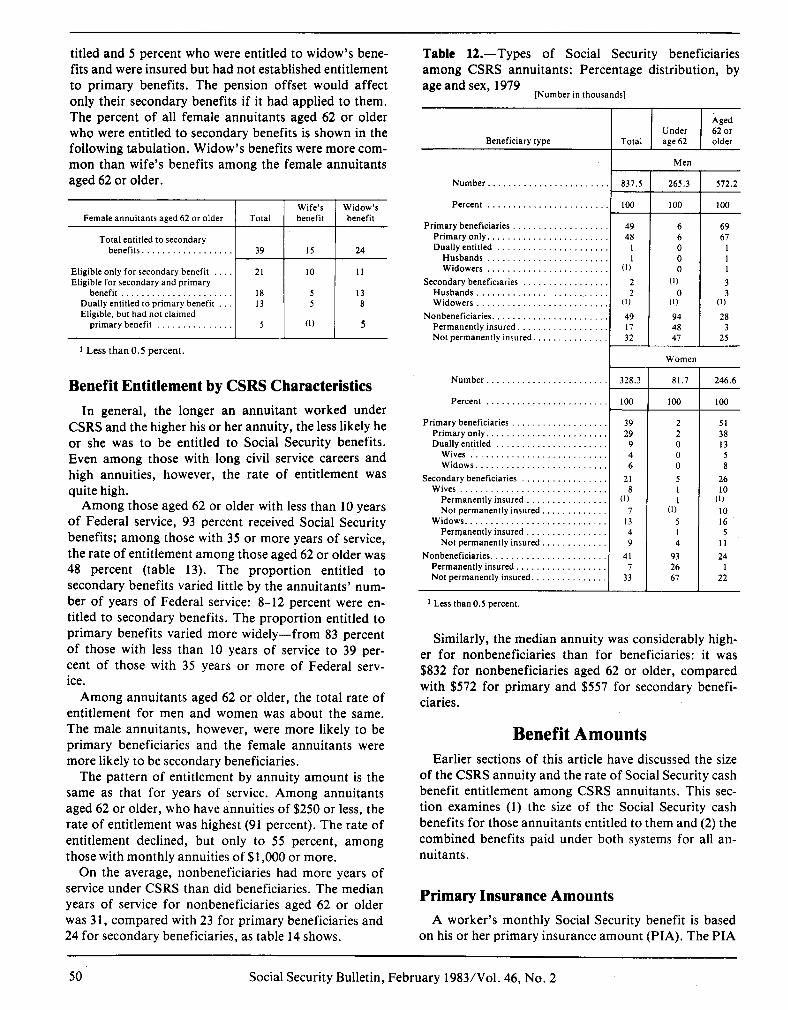
Benefit Entitlement by CSRS Characteristics
In general, the longer an annuitant worked under CSRS and the higher his or her annuity, the less likely he or she was to be entitled to Social Security benefits. Even among those with long civil service careers and high annuities, however, the rate of entitlement was quite high.
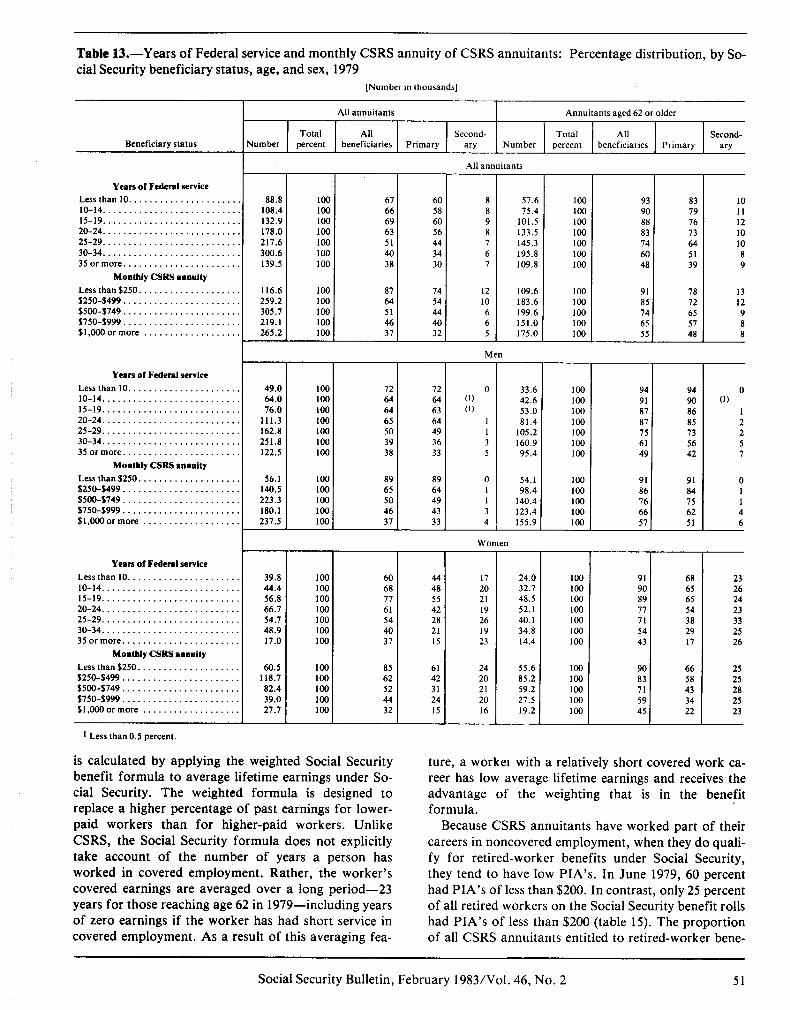
Among those aged 62 or older with less than 10 years of Federal service, 93 percent received Social Security benefits; among those with 35 or more years of service, the rate of entitlement among those aged 62 or older was 48 percent (table 13). The proportion entitled to secondary benefits varied little by the annuitants’ num- ber of years of Federal service: 8-12 percent were en- titled to secondary benefits. The proportion entitled to primary benefits varied more widely-from 83 percent of those with less than 10 years of service to 39 per- cent of those with 35 years or more of Federal serv- ice.
Among annuitants aged 62 or older, the total rate of entitlement for men and women was about the same. The male annuitants, however, were more likely to be primary beneficiaries and the female annuitants were more likely to be secondary beneficiaries.
The pattern of entitlement by annuity amount is the same as that for years of service. Among annuitants aged 62 or older, who have annuities of $250 or less, the rate of entitlement was highest (91 percent). The rate of entitlement declined, but only to 55 percent, among those with monthly annuities of $1,000 or more.
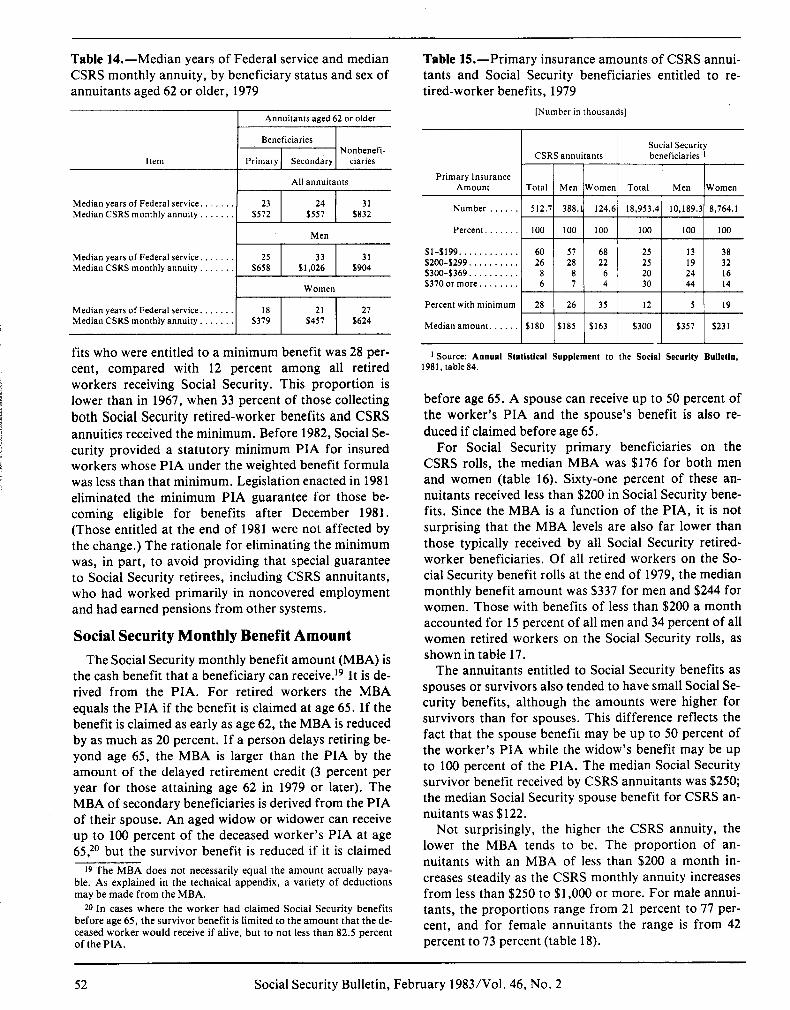
On the average, nonbeneficiaries had more years of service under CSRS than did beneficiaries. The median years of service for nonbeneficiaries aged 62 or older was 31, compared with 23 for primary beneficiaries and 24 for secondary beneficiaries, as table 14 shows.
Table 12.-Types of Social Security beneficiaries among CSRS annuitants: Percentage distribution, by age and sex, 1979
Similarly, the median annuity was considerably high- er for nonbeneficiaries than for beneficiaries: it was $832 for nonbeneficiaries aged 62 or older, compared with $572 for primary and $557 for secondary benefi- ciaries.
Benefit Amounts Earlier sections of this article have discussed the size
of the CSRS annuity and the rate of Social Security cash benefit entitlement among CSRS annuitants. This sec- tion examines (1) the size of the Social Security cash benefits for those annuitants entitled to them and (2) the combined benefits paid under both systems for all an- nuitants.
Primary Insurance Amounts A worker’s monthly Social Security benefit is based
on his or her primary insurance amount (PIA). The PIA
50 Social Security Bulletin, February 19831Vol. 46, No. 2
Table 13.-Years of Federal service and monthly CSRS annuity of CSRS annuitants: Percentage distribution, by So- cial Security beneficiary status, age, and sex, 1979
[Number in thousands]
Jumber
All annuitants Annuitants aged 62 or older
Total All Second- Total All Second- percent beneficiaries Primary w Number percent beneficiaries Primary w
All annuitants -F P Beneficiary status
Years of Federal service
Less than 10. .................... IO-14 .......................... 15-19 .......................... 20-24 .......................... 25-29 .......................... 30-34 .......................... 35ormore ......................
Monthly CSRS annuity
Less than $250. .................. $250-$499 ...................... SSOO-$749 ...................... S750-S999 ...................... $1,000 or more ..................
Years of Federal service
Less than 10 ..................... IO-14 .......................... 15-19 .......................... 20-24 .......................... 25-29 .......................... 30-34 .......................... 35ormore ......................
Monthly CSRS anaoity
Less than $250. .................. $250-0499 ...................... s500-$749 ...................... S750-S999 ...................... S1.OOOormore ..................
Years of Federal service
Less than 10 ..................... IO-14 .......................... 15-19 .......................... 20-24 .......................... 25-29 .......................... 30-34 .......................... 35ormore ......................
Monthly CSRS annuity
LessthanS250 ................... S250-S499 ...................... SSOO-$749 ...................... $750-$999 ...................... $1,000 or more ..................
is calculated by applying the weighted Social Security benefit formula to average lifetime earnings under So- cial Security. The weighted formula is designed to replace a higher percentage of past earnings for lower- paid workers than for higher-paid workers. Unlike CSRS, the Social Security formula does not explicitly take account of the number of years a person has worked in covered employment. Rather, the worker’s covered earnings are averaged over a long period-23 years for those reaching age 62 in 1979-including years of zero earnings if the worker has had short service in covered employment. As a result of this averaging fea-
ture, a worker with a relatively short covered work ca- reer has low average lifetime earnings and receives the advantage of the weighting that is in the benefit formula.
Because CSRS annuitants have worked part of their careers in noncovered employment, when they do quali- fy for retired-worker benefits under Social Security, they tend to have low PIA’s. In June 1979, 60 percent had PIA’s of less than $200. In contrast, only 25 percent of all retired workers on the Social Security benefit rolls had PIA’s of less than $200 (table 15). The proportion of all CSRS annuitants entitled to retired-worker bene-
Social Security Bulletin, February 1983/Vol. 46, No. 2 51
Table 14.-Median years of Federal service and median Table E.-Primary insurance amounts of CSRS annui- CSRS monthly annuity, by beneficiary status and sex of tants and Social Security beneficiaries entitled to re- annuitants aged 62 or older, 1979 tired-worker benefits, 1979
Annuitants aged 62 or older [Number in thousands]
Item
Beneficiaries Nonbenefi-
Primary Secondary ciaries
All annuitants
Median years of Federal service. 23 24 31 Median CSRS monthly annuity. $572 $557 $832
Men
Number . . .
Percent. . .
Median years of Federal service. . 25 31 Median CSRS monthly annuity. . $658 s,,o:: $904
Women
Sl-$199............ $200-$299..........
$370 or more.
Median years of Federal service. Median CSRS monthly annuity. . . . $3:: $4:: $6::
Percent with minimum
Median amount. .
fits who were entitled to a minimum benefit was 28 per- cent, compared with 12 percent among all retired workers receiving Social Security. This proportion is lower than in 1967, when 33 percent of those collecting both Social Security retired-worker benefits and CSRS annuities received the minimum. Before 1982, Social Se- curity provided a statutory minimum PIA for insured workers whose PIA under the weighted benefit formula was less than that minimum, Legislation enacted in 1981 eliminated the minimum PIA guarantee for those be- coming eligible for benefits after December 1981. (Those entitled at the end of 1981 were not affected by the change.) The rationale for eliminating the minimum was, in part, to avoid providing that special guarantee to Social Security retirees, including CSRS annuitants, who had worked primarily in noncovered employment and had earned pensions from other systems.
’ Source: Annual Statistical Supplement to the Social Security Bulletin, 1981, table84.
before age 65. A spouse can receive up to 50 percent of the worker’s PIA and the spouse’s benefit is also re- duced if claimed before age 65.
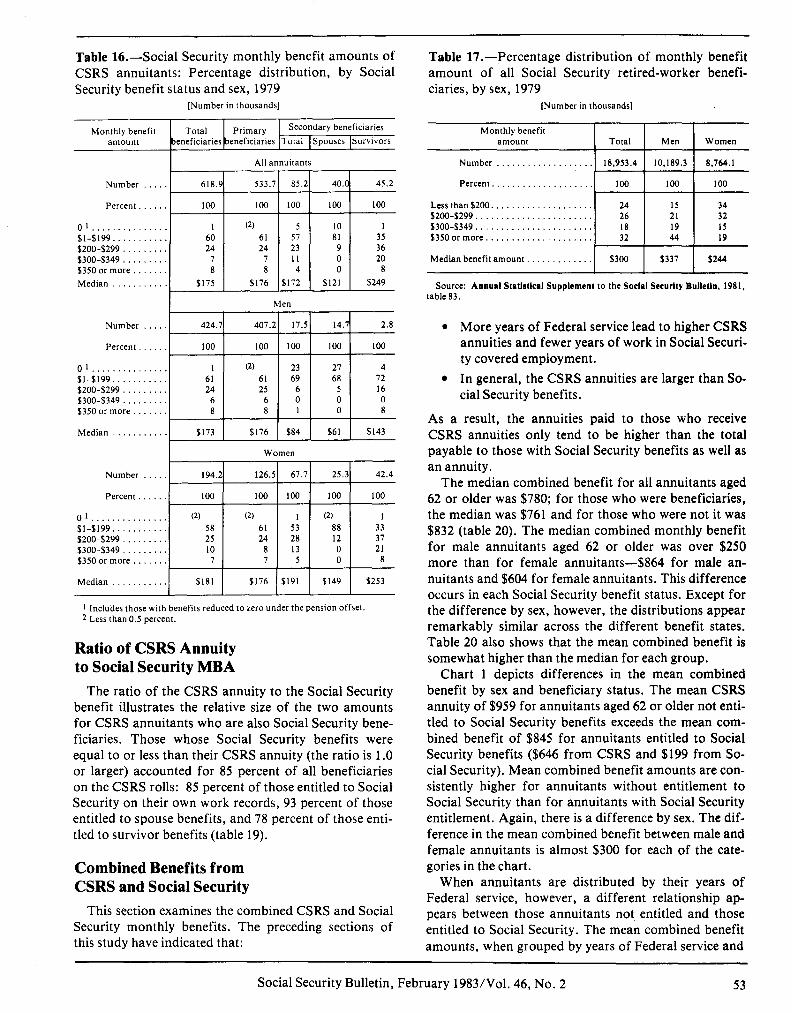
Social Security Monthly Benefit Amount The Social Security monthly benefit amount (MBA) is
For Social Security primary beneficiaries on the CSRS rolls, the median MBA was $176 for both men and women (table 16). Sixty-one percent of these an- nuitants received less than $200 in Social Security bene- fits. Since the MBA is a function of the PIA, it is not surprising that the MBA levels are also far lower than those typically received by all Social Security retired- worker beneficiaries. Of all retired workers on the So- cial Security benefit rolls at the end of 1979, the median monthly benefit amount was $337 for men and $244 for women, Those with benefits of less than $200 a month accounted for 15 percent of all men and 34 percent of all women retired workers on the Social Security rolls, as shown in table 17.
the cash benefit that a beneficiary can receive.19 It is de- rived from the PIA. For retired workers the MBA equals the PIA if the benefit is claimed at age 65. If the benefit is claimed as early as age 62, the MBA is reduced by as much as 20 percent. If a person delays retiring be- yond age 65, the MBA is larger than the PIA by the amount of the delayed retirement credit (3 percent per year for those attaining age 62 in 1979 or later). The MBA of secondary beneficiaries is derived from the PIA of their spouse. An aged widow or widower can receive up to 100 percent of the deceased worker’s PIA at age 65:O but the survivor benefit is reduced if it is claimed
The annuitants entitled to Social Security benefits as spouses or survivors also tended to have small Social Se- curity benefits, although the amounts were higher for survivors than for spouses. This difference reflects the fact that the spouse benefit may be up to 50 percent of the worker’s PIA while the widow’s benefit may be up to 100 percent of the PIA. The median Social Security survivor benefit received by CSRS annuitants was $250; the median Social Security spouse benefit for CSRS an- nuitants was $122.
19 The MBA does not necessarily equal the amount actually paya- ble. As explained in the technical appendix, a variety of deductions may be made from the MBA.
20 In cases where the worker had claimed Social Security benefits before age 65, the survivor benefit is limited to the amount that the de- ceased worker would receive if alive, but to not less than 82.5 percent of the PIA.
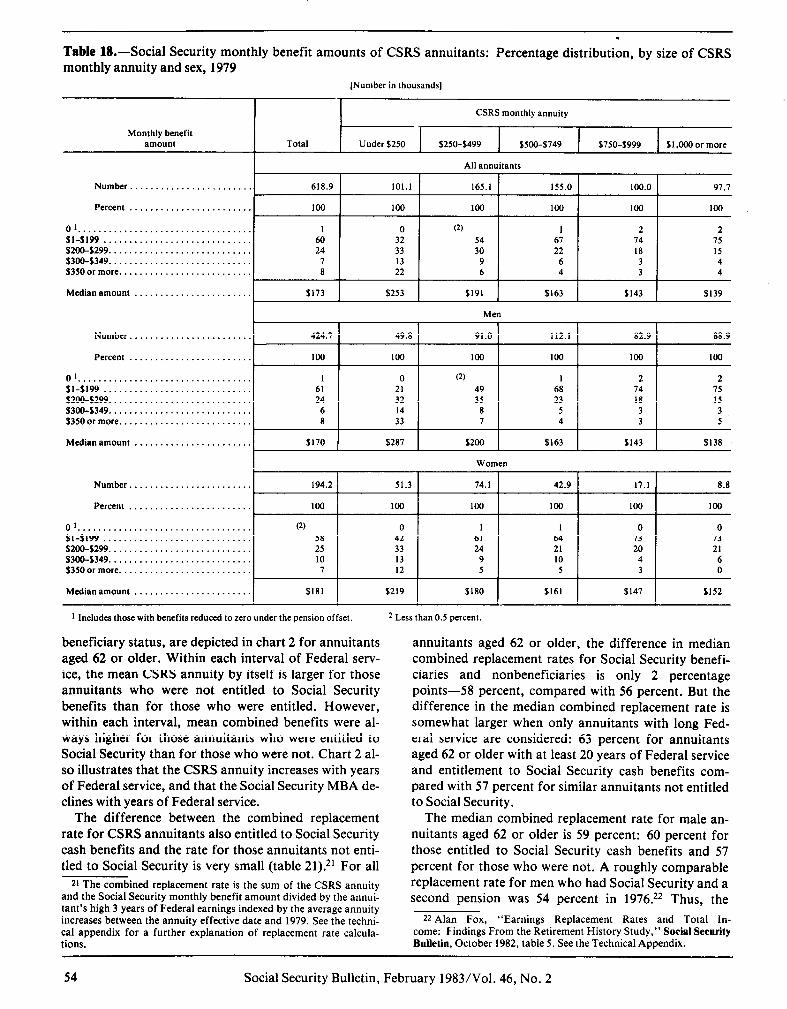
Not surprisingly, the higher the CSRS annuity, the lower the MBA tends to be. The proportion of an- nuitants with an MBA of less than $200 a month in- creases steadily as the CSRS monthly annuity increases from less than $250 to $1,000 or more. For male annui- tants, the proportions range from 21 percent to 77 per- cent, and for female annuitants the range is from 42 percent to 73 percent (table 18).
52 Social Security Bulletin, February 1983/Vol. 46, No. 2
Table 16.-Social Security monthly benefit amounts of Table 17.-Percentage distribution of monthly benefit CSRS annuitants: Percentage distribution, by Social amount of all Social Security retired-worker benefi- Security benefit status and sex, 1979 ciaries, by sex, 1979
[Number in thousands] [Number in thousands]
Number .
Percent. . .
o’............... $I-$199.. . . $200-$299 . $300-$349 . . . $350 or more .
Source: Annual Stntlstlcal Supplement to the Social Security BulletIn, 1981, table 83.
Number
Percent
Ol.......... $1-$199.. . $200-$299 . . $300-$349.. . . $350 or more
01.......... $1-$199...... $200-$299 $300-$349 $350 or more . .
Median . . .I $181 1 $176 I$191 1 $149 1 $253 I I I I I
1 Includes those with benefits reduced to zero under the pension offset. 2 Less than 0.5 percent.
Ratio of CSRS Annuity to Social Security MBA
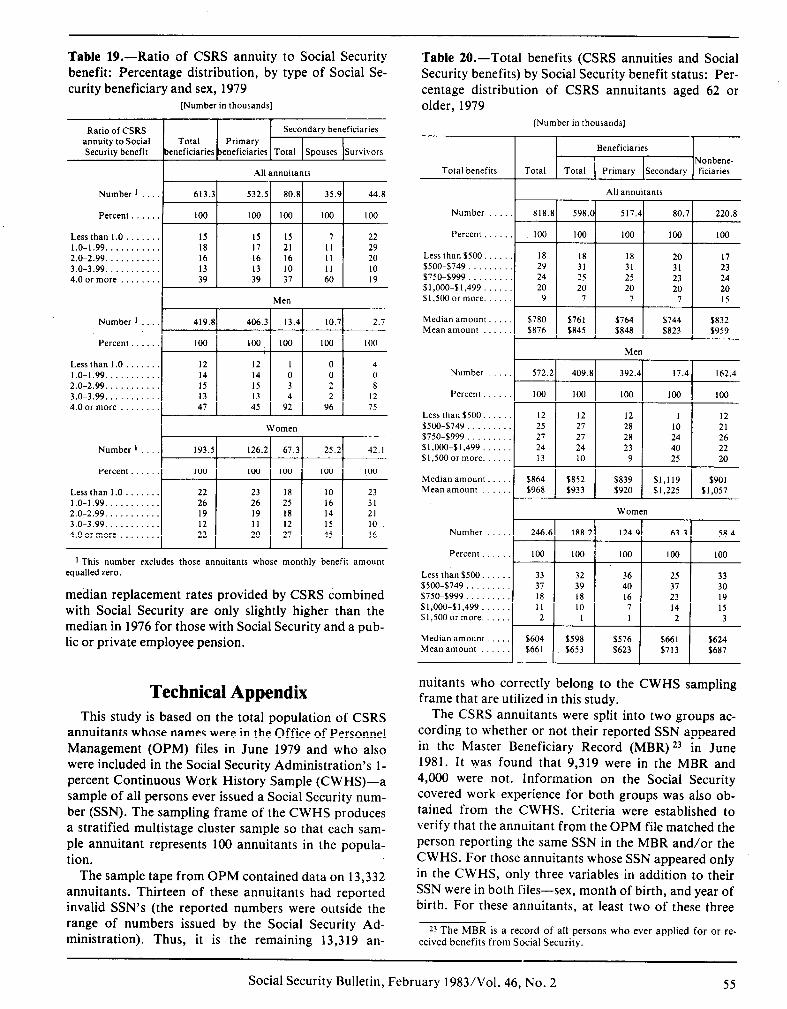
The ratio of the CSRS annuity to the Social Security benefit illustrates the relative size of the two amounts for CSRS annuitants who are also Social Security bene- ficiaries. Those whose Social Security benefits were equal to or less than their CSRS annuity (the ratio is 1 .O or larger) accounted for 85 percent of all beneficiaries on the CSRS rolls: 85 percent of those entitled to Social Security on their own work records, 93 percent of those entitled to spouse benefits, and 78 percent of those enti- tled to survivor benefits (table 19).
Combined Benefits from CSRS and Social Security
This section examines the combined CSRS and Social Security monthly benefits. The preceding sections of this study have indicated that:
l More years of Federal service lead to higher CSRS annuities and fewer years of work in Social Securi- ty covered employment.
l In general, the CSRS annuities are larger than So- cial Security benefits.
As a result, the annuities paid to those who receive CSRS annuities only tend to be higher than the total payable to those with Social Security benefits as well as an annuity.
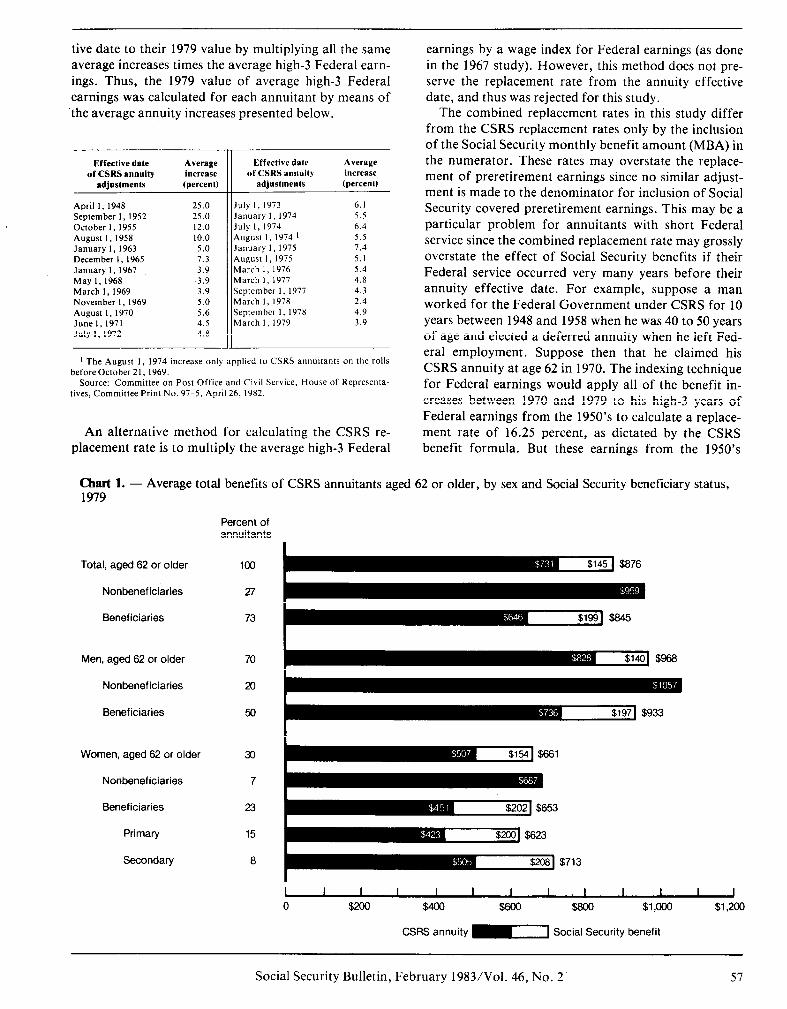
The median combined benefit for all annuitants aged 62 or older was $780; for those who were beneficiaries, the median was $761 and for those who were not it was $832 (table 20). The median combined monthly benefit for male annuitants aged 62 or older was over $250 more than for female annuitants-$864 for male an- nuitants and $604 for female annuitants. This difference occurs in each Social Security benefit status. Except for the difference by sex, however, the distributions appear remarkably similar across the different benefit states. Table 20 also shows that the mean combined benefit is somewhat higher than the median for each group.
Chart 1 depicts differences in the mean combined benefit by sex and beneficiary status. The mean CSRS annuity of $959 for annuitants aged 62 or older not enti- tled to Social Security benefits exceeds the mean com- bined benefit of $845 for annuitants entitled to Social Security benefits ($646 from CSRS and $199 from So- cial Security). Mean combined benefit amounts are con- sistently higher for annuitants without entitlement to Social Security than for annuitants with Social Security entitlement. Again, there is a difference by sex. The dif- ference in the mean combined benefit between male and female annuitants is almost $300 for each of the cate- gories in the chart.
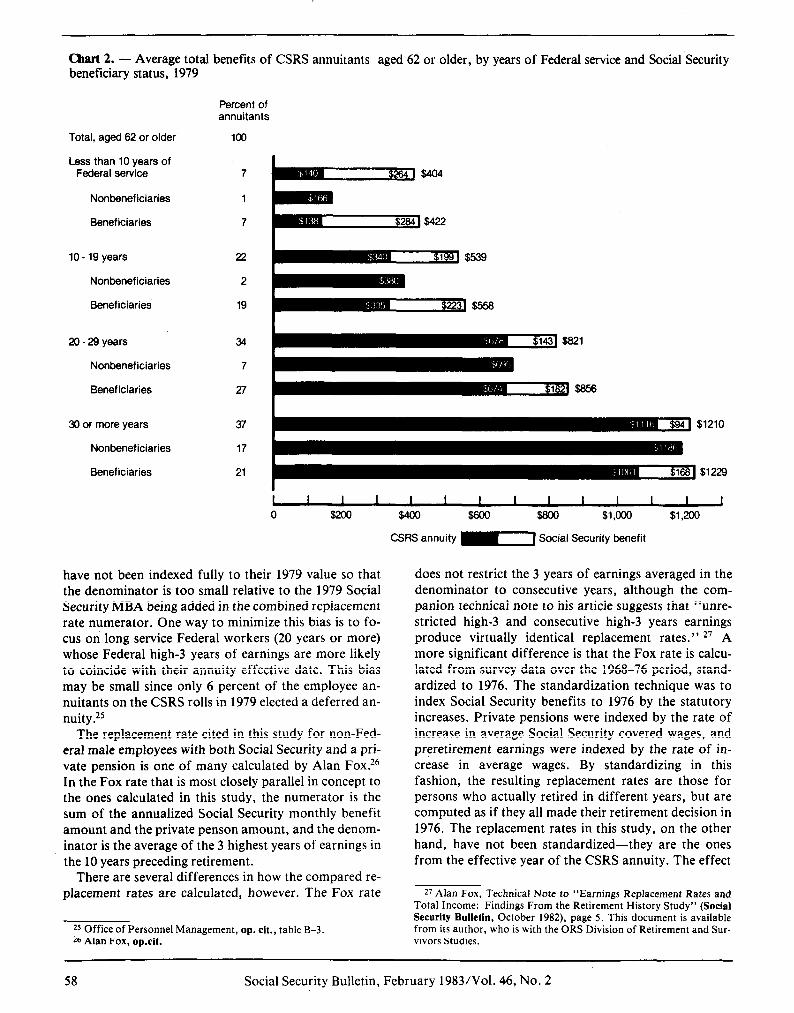
When annuitants are distributed by their years of Federal service, however, a different relationship ap- pears between those annuitants not entitled and those entitled to Social Security. The mean combined benefit amounts, when grouped by years of Federal service and
Social Security Bulletin, February 1983/Vol. 46, No. 2 53
.
Table 18.-Social Security monthly benefit amounts of CSRS annuitants: Percentage distribution, by size of CSRS monthly annuity and sex, 1979
[Number in thousands]
CSRS monthly annuity
Monthly benefit amount Total Under $250 S250-$499 $500-$749
t Includes those with benefits reduced to zero under the pension offset.
$219 5180
2 Less than 0.5 percent.
S161 5147 $152
beneficiary status, are depicted in chart 2 for annuitants annuitants aged 62 or older, the difference in median aged 62 or older. Within each interval of Federal serv- combined replacement rates for Social Security benefi- ice, the mean CSRS annuity by itself is larger for those ciaries and nonbeneficiaries is only 2 percentage annuitants who were not entitled to Social Security points-58 percent, compared with 56 percent. But the benefits than for those who were entitled. However, difference in the median combined replacement rate is within each interval, mean combined benefits were al- somewhat larger when only annuitants with long Fed- ways higher for those annuitants who were entitled to eral service are considered: 63 percent for annuitants Social Security than for those who were not. Chart 2 al- aged 62 or older with at least 20 years of Federal service so illustrates that the CSRS annuity increases with years and entitlement to Social Security cash benefits com- of Federal service, and that the Social Security MBA de- pared with 57 percent for similar annuitants not entitled clines with years of Federal service. to Social Security.
The difference between the combined replacement rate for CSRS annuitants also entitled to Social Security cash benefits and the rate for those annuitants not enti- tled to Social Security is very small (table 21)?l For all
21 The combined replacement rate is the sum of the CSRS annuity and the Social Security monthly benefit amount divided by the annui- tant’s high 3 years of Federal earnings indexed by the average annuity increases between the annuity effective date and 1979. See the techni- cal appendix for a further explanation of replacement rate calcula- tions.
The median combined replacement rate for male an- nuitants aged 62 or older is 59 percent: 60 percent for those entitled to Social Security cash benefits and 57 percent for those who were not. A roughly comparable replacement rate for men who had Social Security and a second pension was 54 percent in 1976F2 Thus, the
22 Alan Fox, “Earnings Replacement Rates and Total In- come: Findings From the Retirement History Study,” Social Security Bulletin, October 1982, table 5. See the Technical Appendix.
54 Social Security Bulletin, February 1983/Vol. 46, No. 2
Table 19.-Ratio of CSRS annuity to Social Security benefit: Percentage distribution, by type of Social Se- curity beneficiary and sex, 1979
1 This number excludes those annuitants whose monthly benefit amount equalled zero.
median replacement rates provided by CSRS combined with Social Security are only slightly higher than the median in 1976 for those with Social Security and a pub- lic or private employee pension.
Technical Appendix This study is based on the total population of CSRS
annuitants whose names were in the Office of Personnel Management (OPM) files in June 1979 and who also were included in the Social Security Administration’s l- percent Continuous Work History Sample (CWHS)-a sample of all persons ever issued a Social Security num- ber (SSN). The sampling frame of the CWHS produces a stratified multistage cluster sample so that each sam- ple annuitant represents 100 annuitants in the popula- tion.
The sample tape from OPM contained data on 13,332 annuitants. Thirteen of these annuitants had reported invalid SSN’s (the reported numbers were outside the range of numbers issued by the Social Security Ad- ministration). Thus, it is the remaining 13,319 an-
Table 20.-Total benefits (CSRS annuities and Social Security benefits) by Social Security benefit status: Per- centage distribution of CSRS annuitants aged 62 or older, 1979
[Number in thousands]
Number
Percent.
LessthanS500...... SSOO-$749 . . . . S750-$999 $l,OOO-$1,499.. $1,500 or more.
Median amount. Mean amount
Number
Percent.
Median amount. Mean amount
Number
Percent
Less than $500.
$1,500 or more.
Median amour.
nuitants who correctly belong to the CWHS sampling frame that are utilized in this study.
The CSRS annuitants were split into two groups ac- cording to whether or not their reported SSN appeared in the Master Beneficiary Record (MBR) 23 in June 1981. It was found that 9,319 were in the MBR and 4,000 were not. Information on the Social Security covered work experience for both groups was also ob- tained from the CWHS. Criteria were established to verify that the annuitant from the OPM file matched the person reporting the same SSN in the MBR and/or the CWHS. For those annuitants whose SSN appeared only in the CWHS, only three variables in addition to their SSN were in both files-sex, month of birth, and year of birth. For these annuitants, at least two of these three
23 The MBR is a record of all persons who ever applied for or re- ceived benefits from Social Security.
Social Security Bulletin, February 19831Vol. 46, No. 2 55
Table 21.-Median CSRS replacement rates l and median total replacement rates2 for all CSRS annui- tants aged 62 or older and for all such annuitants with 20 or more years of Federal service, by Social Security beneficiary status and sex, 1979
[Number in thousands]
Beneficiary status
Median CSRS Median total
Num- replacement replacement ber Percent rate rate
t 1979 CSRS annuity divided by indexed Federal high-3 years of earnings; see theTechnical Appendix for more details.
2 1979 CSRS annuity plus 1979 Social Security monthly benefit amount divided by indexed Federal high-3 years of earnings; see the Technical Ap- pendix for more details.
variables had to match exactly for the two records to be considered a match. The MBR also contained the day of birth and the first name of the Social Security benefi- ciaries so that the criteria for those annuitants whose SSN also appeared in the MBR was an exact match of at least four of the five variables in common between the data files. These criteria indicated that 8,250 of the 9,319 annuitants for whom information was found in the MBR and CWHS were correctly matched, as were 3,901 of the 4,000 who appeared only in the CWHS. So that the correctly matched annuitants in each group rep- resent all the SSN’s in the group, a weight of 1.1296 (9,319 + 8,250) was applied to each annuitant in the group with information in both the MBR and CWHS, and a weight of 1.0254 (4,000 t 3,901) was applied to each annuitant who had only CWHS information. The weighted sample then represented all 13,332 annuitants in the OPM files who were in the CWHS sample.
As a last step, annuitants were excluded who did not fit the active employee annuitant population that the sample was to represent. The excluded annuitants either had died before the June 1979 sampling date or had not
been placed on the OPM annuitant roll since their claim had not been fully adjudicated. The resulting weighted sample totals 11,658 annuitants. The statistics in this re- port are derived from the weighted sample and are sub- ject to sampling variability. Sampling errors, therefore, occur because observations are made only on a sample, not on the entire population.24
The CWHS used in this sample was complete through 1977. To make the Social Security quarters-of-coverage data complete through the sample date of June 1979, the number of quarters of coverage earned by each an- nuitant for 1976 and 1977 was imputed into his or her record for 1978 and 1979. Some biases may have been introduced into the analysis of insured status for Social Security nonbeneficiaries since (1) it may overstate the number of quarters of coverage for CSRS annuitants who worked in Social Security covered employment in 1976 or 1977 and retired from covered employment in 1978 or 1979, or (2) it may understate the quarters of coverage earned by those CSRS annuitants who were not working in Social Security covered employment in 1976 or 1977 and then started such work in 1978 or 1979.
For calculating the CSRS replacement rates, annuity values are in 1979 dollars and earnings are in preretire- ment dollars. Thus, an index adjustment was necessary. A replacement rate determines the extent to which the monthly annuity replaces the monthly preretirement earnings, and is defined as the ratio of those two amounts. The average of earnings for the high-3 con- secutive years is used in the CSRS benefit formula, and thus was chosen as the preretirement earnings level. However, the monthly annuity value from OPM is the value received in June 1979 and reflects all of the cost- of-living increases since the annuity became effective; the average high-3 earnings value still reflects the wage levels in the years they were earned. If these values were unadjusted and used for defining the replacement rate, annuitants who were on the rolls for many years would have unrealistically high replacement rates.
One method for calculating the CSRS replacement rate preserves the replacement rate from the effective year of the annuity-that is, the replacement rate for an annuitant derived by dividing his or her first annualized monthly annuity by his or her average high-3 Federal earnings. This replacement rate can be derived by divid- ing the 1979 monthly annuity by each of the average in- creases in CSRS annuities since its effective date to return the 1979 monthly annuity to its effective date value. Equivalently, the average high-3 Federal earnings can be increased from their value at the annuity effec-
24 For an indication of the extent of sampling variability in the CWHS sampling frame, see Robert H. Finch, Jr., Sampling Variabili- tY in the l-percent Continuous Work History Sample, Office of Re- search and Statistics, Social Security Administration, 1977.
56 Social Security Bulletin, February 1983IVol. 46, No. 2
tive date to their 1979 value by multiplying all the same average increases times the average high-3 Federal earn- ings. Thus, the 1979 value of average high-3 Federal earnings was calculated for each annuitant by means of ‘the average annuity increases presented below.
Effective date of CSRS annuity
adjustments
AtWage
April 1, 1948 25.0 September 1, 1952 25.0 October 1, 1955 12.0 August 1, 1958 10.0 January 1, 1963 5.0 December I, 1965 7.3 January 1, 1967 3.9 May 1, 1968 3.9 March 1,1969 3.9 November 1, 1969 5.0 August 1, 1970 5.6 June I, 1971 4.5 July I, 1972 4.8
July I, 1973 6.1 January I, 1974 5.5 July I, 1974 6.4 August I, 1974 ’ 5.5 January I, 1975 7.4 August I, 1975 5.1 March 1, 1976 5.4 March I, 1977 4.8 September 1, 1977 4.3 March I, 1978 2.4 September 1, 1978 4.9 March I, 1979 3.9
t The August 1, 1974 increase only applied to CSRS annuitants on the rolls before October 21, 1969.
Source: Committee on Post Office and Civil Service, House of Representa- tives, Committee Print No. 97-5, April 26, 1982.
An alternative method for calculating the CSRS re- placement rate is to multiply the average high-3 Federal
earnings by a wage index for Federal earnings (as done in the 1967 study). However, this method does not pre- serve the replacement rate from the annuity effective date, and thus was rejected for this study.
The combined replacement rates in this study differ from the CSRS replacement rates only by the inclusion of the Social Security monthly benefit amount (MBA) in the numerator. These rates may overstate the replace- ment of preretirement earnings since no similar adjust- ment is made to the denominator for inclusion of Social Security covered preretirement earnings. This may be a particular problem for annuitants with short Federal service since the combined replacement rate may grossly overstate the effect of Social Security benefits if their Federal service occurred very many years before their annuity effective date. For example, suppose a man worked for the Federal Government under CSRS for 10 years between 1948 and 1958 when he was 40 to 50 years of age and elected a deferred annuity when he left Fed- eral employment. Suppose then that he claimed his CSRS annuity at age 62 in 1970. The indexing technique for Federal earnings would apply all of the benefit in- creases between 1970 and 1979 to his high-3 years of Federal earnings from the 1950’s to calculate a replace- ment rate of 16.25 percent, as dictated by the CSRS benefit formula. But these earnings from the 1950’s
Chart 1. - Average total benefits of CSRS annuitants aged 62 or older, by sex and Social Security beneficiary status, 1979
Total, aged 62 or older 100
Nonbeneficiaries 27
Beneficiaries 73
Men, aged 62 or older 70
Nonbeneficiaries 20
Beneficiaries 50
Women, aged 62 or older
Nonbeneficiaries
Beneficiaries
Primary
Percent of annuitants
xl
7
23
15
8
I I I I I I I I ,I I I I J 0 $200 woo $600 $800 $l,ooo $1,200
CSRS annuity -1 Social Security benefit
Social Security Bulletin, February 1983/Vol. 46, No. 2 57
Chart 2. - Average total benefits of CSRS annuitants aged 62 or older, by years of Federal service and Social Security beneficiary status, 1979
Total, aged 62 or older
Less than 10 years of Federal service
Nonbeneficiaries
Beneficiaries
Percent of annuitants
100
10 - 19 years 22
Nonbeneficiaries 2
Beneficiaries 19
20 - 29 years 34
Nonbeneficiaries 7
Beneficiaries 27
30 or more years
Nonbeneficiaries
Beneficiaries
37
17
21
I I I I I I I I I I I I I I 0 s204 WM $600 $800 $1,000 $1,200
CSRS annuity =I Social Security benefit
have not been indexed fully to their 1979 value so that the denominator is too small relative to the 1979 Social Security MBA being added in the combined replacement rate numerator. One way to minimize this bias is to fo- cus on long service Federal workers (20 years or more) whose Federal high-3 years of earnings are more likely to coincide with their annuity effective date. This bias may be small since only 6 percent of the employee an- nuitants on the CSRS rolls in 1979 elected a deferred an- nuityF5
The replacement rate cited in this study for non-Fed- eral male employees with both Social Security and a pri- vate pension is one of many calculated by Alan Fox.~~ In the Fox rate that is most closely parallel in concept to the ones calculated in this study, the numerator is the sum of the annualized Social Security monthly benefit amount and the private penson amount, and the denom- inator is the average of the 3 highest years of earnings in the 10 years preceding retirement.
There are several differences in how the compared re- placement rates are calculated, however. The Fox rate
x Office of Personnel Management, op. cit., table B-3. 26 Alan Fox, op.cit.
does not restrict the 3 years of earnings averaged in the denominator to consecutive years, although the com- panion technical note to his article suggests that “unre- stricted high-3 and consecutive high-3 years earnings produce virtually identical replacement rates.” 27 A more significant difference is that the Fox rate is calcu- lated from survey data over the 1968-76 period, stand- ardized to 1976. The standardization technique was to index Social Security benefits to 1976 by the statutory increases. Private pensions were indexed by the rate of increase in average Social Security covered wages, and preretirement earnings were indexed by the rate of in- crease in average wages. By standardizing in this fashion, the resulting replacement rates are those for persons who actually retired in different years, but are computed as if they all made their retirement decision in 1976. The replacement rates in this study, on the other hand, have not been standardized-they are the ones from the effective year of the CSRS annuity. The effect
2’ Alan Fox, Technical Note to “Earnings Replacement Rates and Total Income: Findings From the Retirement History Study” (Social Security Bulletin, October 1982), page 5. This document is available from its author, who is with the ORS Division of Retirement and Sur- vivors Studies.
58 Social Security Bulletin, February 1983/Vol. 46, No. 2
of the Fox standardization should be small, however, since both wages and prices rose at about the same rate during 1968-76 28 and thus the different rates in the nu- merator and denominator should almost cancel one an- other out.
Both the Social Security MBA and the CSRS monthly annuity are referred to in the text as entitlements. Neither represents the actual monthly cash benefit re- ceived by an annuitant. After the Social Security MBA is calculated but before a check is issued, several reduc- tions may be necessary: $1 in benefits is deducted for every $2 earned in excess of the earnings test amount ($4,500 per year in 1979), monthly Medicare premiums may be withheld, and other statutory offsets such as the
28 Ibid., page 4.
public pension offset discussed in the text may applyF9 Similarly, the CSRS monthly annuity is the gross monthly entitlement after possible reductions for early retirement and for electing a survivor option, The addi- tional reductions from the gross monthly annuity in- clude life and health insurance premiums from policies held as employees and continued into retirement, Medi- care premiums, and Federal income taxes that are paya- ble after the CSRS annuity exceeds the amount of the annuitant’s CSRS contribution.
29 An exception to using the unreduced MBA was made for 12 sam- ple annuitants who were Prouty (“special age-72”) primary benefi- ciaries and for 44 sample annuitants who were secondary beneficiaries with benefits that were completely offset. For these individuals, the MBA’s were set at zero.
Social Security Bulletin, February 1983/Vol. 46, No. 2 59