Page 1
Clarendon County
S.C. Department of Employment & Workforce
Business Intelligence Department
www.SCWorkforceInfo.com
803.737.2660
1550 Gadsden Street, PO Box 995
Columbia, SC 29202
Updated: 10/21/2021
Page 2
Table Of Contents
Educational Attainment............................................................................................
Graduate Trends......................................................................................................
Educational Institutions............................................................................................
Projections by Occupation.......................................................................................
Growing Occupations.............................................................................................
Declining Occupations............................................................................................
Employment by Industry..........................................................................................
New Startup Firms..................................................................................................
Top Occupational Openings...................................................................................
New Hires by Industry............................................................................................
Turnover by Industry...........................................................................................
Average Annual Wage by Industry.......................................................................
Age of Workers by Industry....................................................................................
Projections by Industry...........................................................................................
Population.........................................................................................................
Age...............................................................................................................
Race.............................................................................................................
Gender..........................................................................................................
Change..........................................................................................................
Commuting Patterns...............................................................................................
Residents Commuting To..................................................................................
Workers Commuting From................................................................................
Employer Data......................................................................................................
Size of Establishments......................................................................................
Employment by Size of Establishment..............................................................
20 Largest Employers ......................................................................................
Annual Unemployment Rates...............................................................................
Monthly Unemployment Rates..............................................................................
Area Job Openings................................................................................................
Unemployment Insurance.....................................................................................
Demographic Data..........................................................................................
Industry Data...................................................................................................
Occupation Data.............................................................................................
Retail Sales...........................................................................................................
1
2
3
4
4
5
6
7
1. Economic Data
2. Demographic Data
8
8
9
9
10
11
12
12
13
13
13
14
3. Industry Data
15
16
17
18
19
20
21
22
23
24
25
4. Occupation Data
5. Education Data
26
27
28
Page 3
Clarendon CountyCommunity Profile
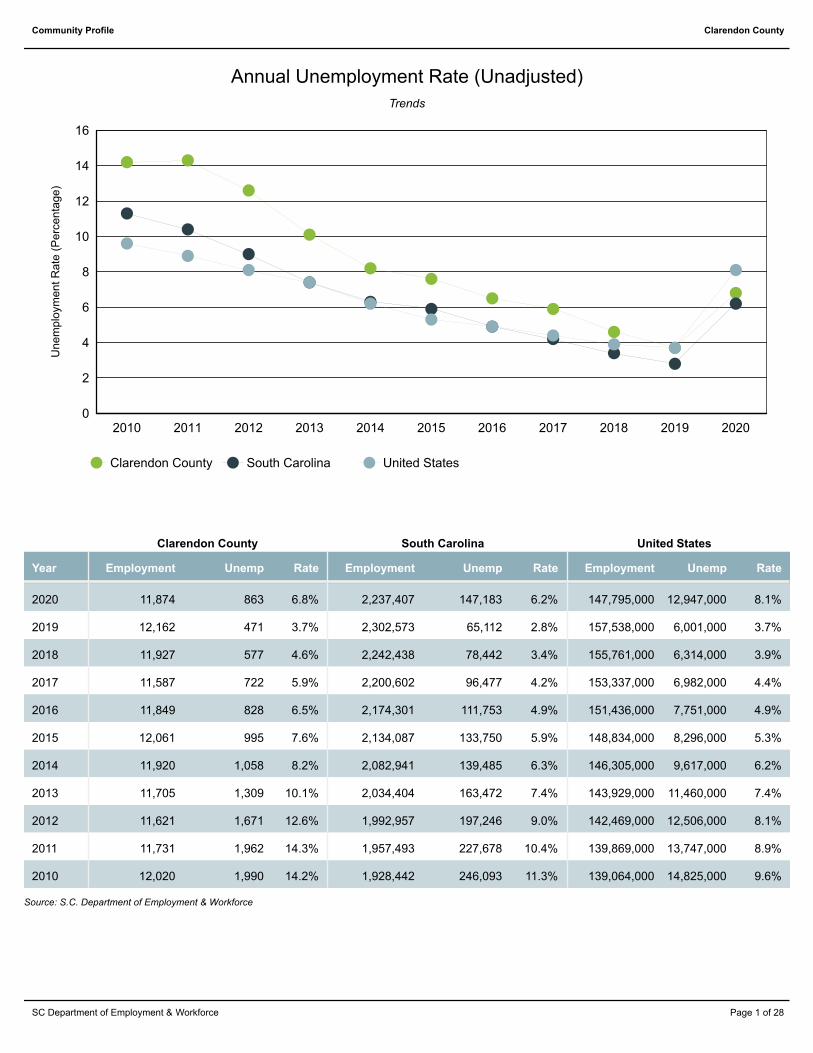
Annual Unemployment Rate (Unadjusted)
Trends
0
2
4
6
8
10
12
14
16
2010 2011 2012 2013 2014 2015 2016 2017 2018 2019 2020
Clarendon County South Carolina United States
Un
em
plo
ym
en
t R
ate
(P
erc
en
tag
e)
United StatesClarendon County South Carolina
Year Employment Unemp Rate Employment Unemp Rate Employment Unemp Rate
2020 11,874 863 6.8% 2,237,407 147,183 6.2% 147,795,000 12,947,000 8.1%
2019 12,162 471 3.7% 2,302,573 65,112 2.8% 157,538,000 6,001,000 3.7%
2018 11,927 577 4.6% 2,242,438 78,442 3.4% 155,761,000 6,314,000 3.9%
2017 11,587 722 5.9% 2,200,602 96,477 4.2% 153,337,000 6,982,000 4.4%
2016 11,849 828 6.5% 2,174,301 111,753 4.9% 151,436,000 7,751,000 4.9%
2015 12,061 995 7.6% 2,134,087 133,750 5.9% 148,834,000 8,296,000 5.3%
2014 11,920 1,058 8.2% 2,082,941 139,485 6.3% 146,305,000 9,617,000 6.2%
2013 11,705 1,309 10.1% 2,034,404 163,472 7.4% 143,929,000 11,460,000 7.4%
2012 11,621 1,671 12.6% 1,992,957 197,246 9.0% 142,469,000 12,506,000 8.1%
2011 11,731 1,962 14.3% 1,957,493 227,678 10.4% 139,869,000 13,747,000 8.9%
2010 12,020 1,990 14.2% 1,928,442 246,093 11.3% 139,064,000 14,825,000 9.6%
Source: S.C. Department of Employment & Workforce
Page 1 of 28SC Department of Employment & Workforce
Page 4
Clarendon CountyCommunity Profile
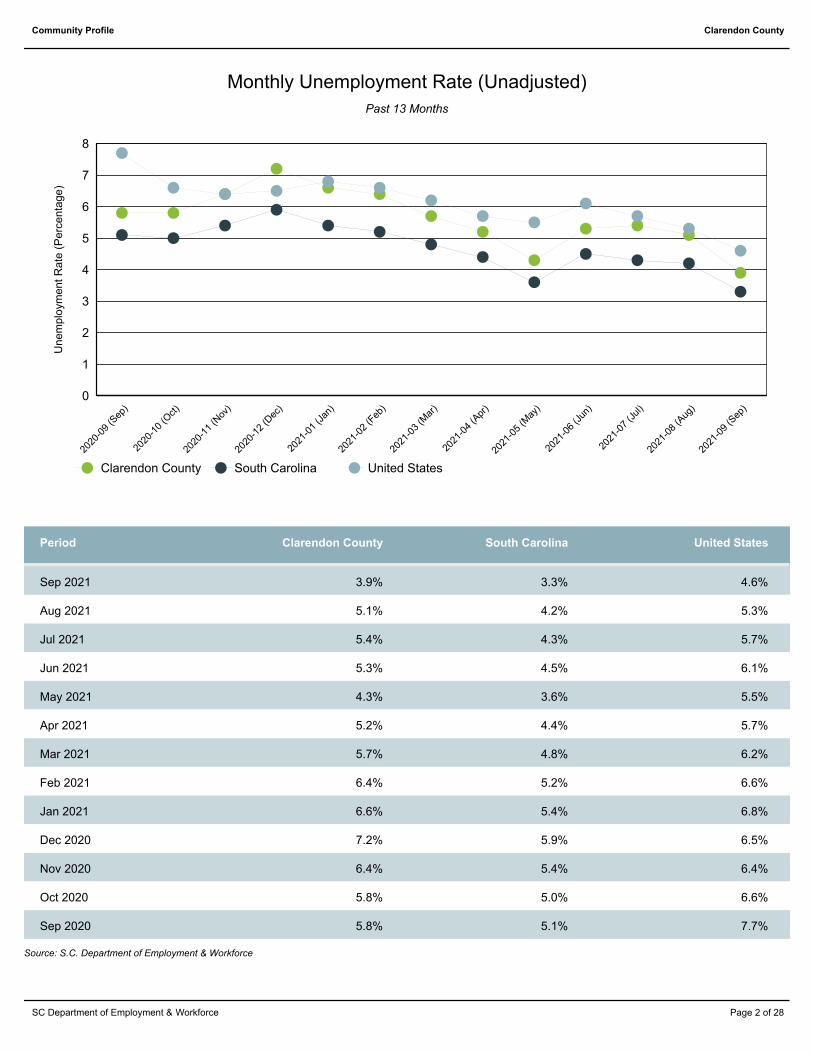
Past 13 Months
Monthly Unemployment Rate (Unadjusted)
0
1
2
3
4
5
6
7
8
2020
-09
(Sep
)
2020
-10
(Oct)
2020
-11
(Nov
)
2020
-12
(Dec
)
2021
-01
(Jan
)
2021
-02
(Feb
)
2021
-03
(Mar
)
2021
-04
(Apr
)
2021
-05
(May
)
2021
-06
(Jun
)
2021
-07
(Jul)
2021
-08
(Aug
)
2021
-09
(Sep
)
Clarendon County South Carolina United States
Un
em
plo
ym
en
t R
ate
(P
erc
en
tag
e)
Clarendon CountyPeriod South Carolina United States
Sep 2021 3.9% 3.3% 4.6%
Aug 2021 5.1% 4.2% 5.3%
Jul 2021 5.4% 4.3% 5.7%
Jun 2021 5.3% 4.5% 6.1%
May 2021 4.3% 3.6% 5.5%
Apr 2021 5.2% 4.4% 5.7%
Mar 2021 5.7% 4.8% 6.2%
Feb 2021 6.4% 5.2% 6.6%
Jan 2021 6.6% 5.4% 6.8%
Dec 2020 7.2% 5.9% 6.5%
Nov 2020 6.4% 5.4% 6.4%
Oct 2020 5.8% 5.0% 6.6%
Sep 2020 5.8% 5.1% 7.7%
Source: S.C. Department of Employment & Workforce
Page 2 of 28SC Department of Employment & Workforce
Page 5
Clarendon CountyCommunity Profile
South CarolinaClarendon County
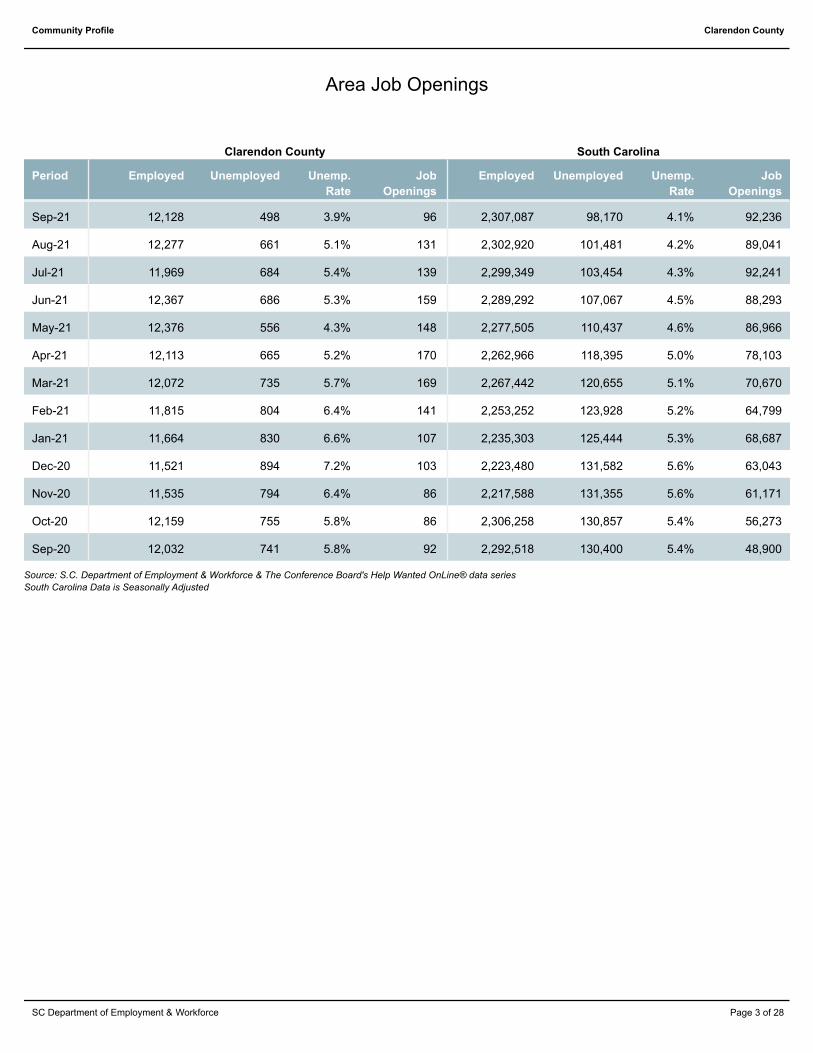
Area Job Openings
Period Employed Unemployed Unemp.
Rate
Job
Openings
Employed Unemployed Unemp.
Rate
Job
Openings
Sep-21 12,128 498 3.9% 96 2,307,087 98,170 4.1% 92,236
Aug-21 12,277 661 5.1% 131 2,302,920 101,481 4.2% 89,041
Jul-21 11,969 684 5.4% 139 2,299,349 103,454 4.3% 92,241
Jun-21 12,367 686 5.3% 159 2,289,292 107,067 4.5% 88,293
May-21 12,376 556 4.3% 148 2,277,505 110,437 4.6% 86,966
Apr-21 12,113 665 5.2% 170 2,262,966 118,395 5.0% 78,103
Mar-21 12,072 735 5.7% 169 2,267,442 120,655 5.1% 70,670
Feb-21 11,815 804 6.4% 141 2,253,252 123,928 5.2% 64,799
Jan-21 11,664 830 6.6% 107 2,235,303 125,444 5.3% 68,687
Dec-20 11,521 894 7.2% 103 2,223,480 131,582 5.6% 63,043
Nov-20 11,535 794 6.4% 86 2,217,588 131,355 5.6% 61,171
Oct-20 12,159 755 5.8% 86 2,306,258 130,857 5.4% 56,273
Sep-20 12,032 741 5.8% 92 2,292,518 130,400 5.4% 48,900
Source: S.C. Department of Employment & Workforce & The Conference Board's Help Wanted OnLine® data series
South Carolina Data is Seasonally Adjusted
Page 3 of 28SC Department of Employment & Workforce
Page 6
Clarendon CountyCommunity Profile
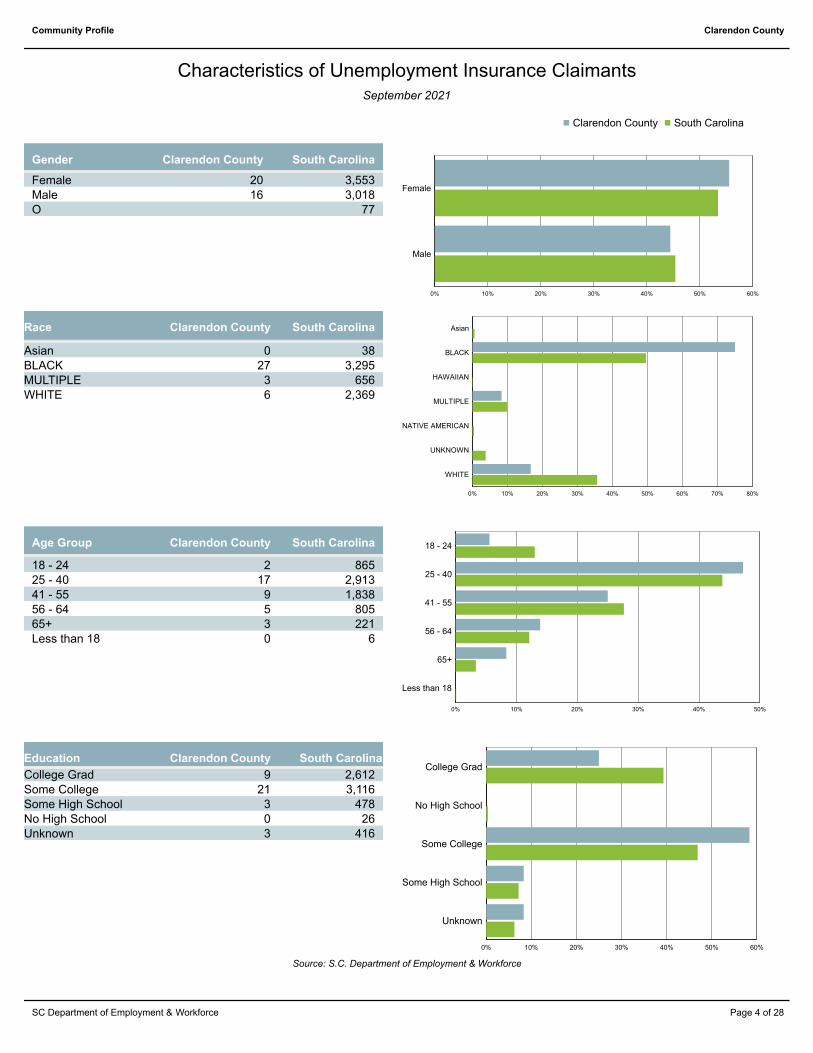
September 2021
Characteristics of Unemployment Insurance Claimants
Clarendon County South CarolinaGender
Female 20 3,553Male 16 3,018O 77
0% 10% 20% 30% 40% 50% 60%
Female
Male
Clarendon County South Carolina
Clarendon CountyRace South Carolina
Asian 0 38BLACK 27 3,295MULTIPLE 3 656WHITE 6 2,369
0% 10% 20% 30% 40% 50% 60% 70% 80%
Asian
BLACK
HAWAIIAN
MULTIPLE
NATIVE AMERICAN
UNKNOWN
WHITE
Clarendon County South CarolinaAge Group
18 - 24 2 86525 - 40 17 2,91341 - 55 9 1,83856 - 64 5 80565+ 3 221Less than 18 0 6
0% 10% 20% 30% 40% 50%
18 - 24
25 - 40
41 - 55
56 - 64
65+
Less than 18
Source: S.C. Department of Employment & Workforce
Clarendon CountyEducation South Carolina
College Grad 9 2,612Some College 21 3,116Some High School 3 478No High School 0 26Unknown 3 416
0% 10% 20% 30% 40% 50% 60%
College Grad
No High School
Some College
Some High School
Unknown
Page 4 of 28SC Department of Employment & Workforce
Page 7
Clarendon CountyCommunity Profile
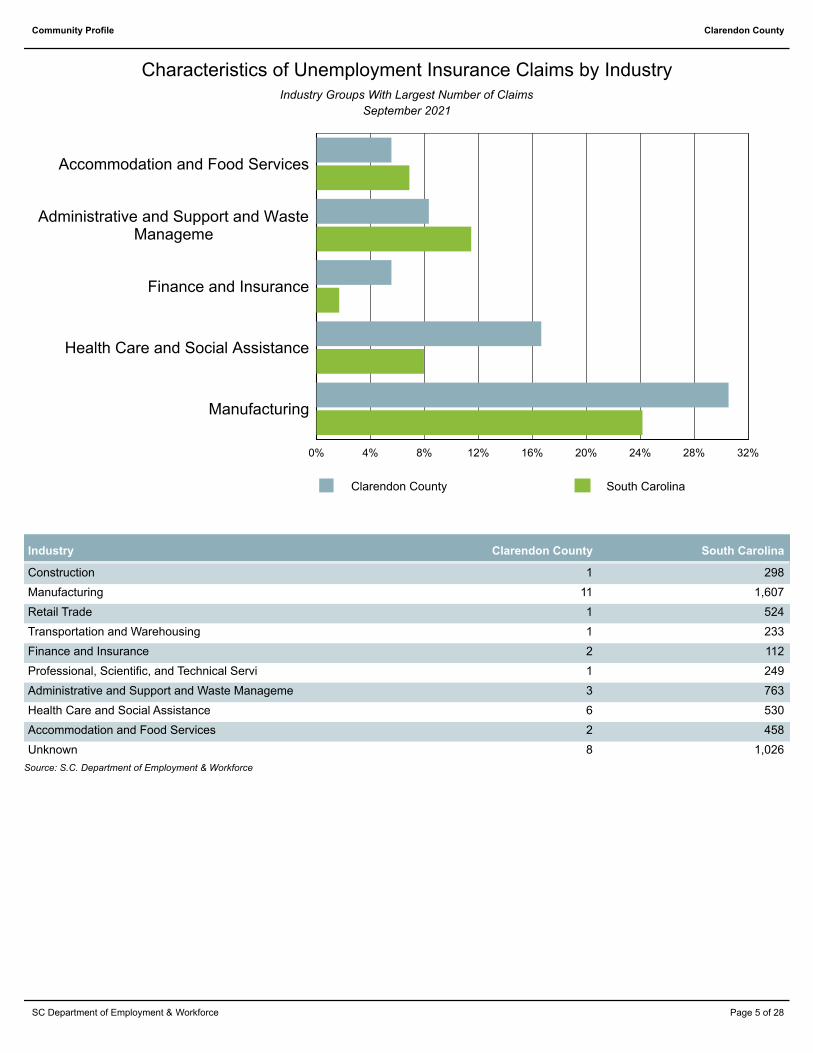
Characteristics of Unemployment Insurance Claims by IndustryIndustry Groups With Largest Number of Claims
September 2021
0% 4% 8% 12% 16% 20% 24% 28% 32%
Accommodation and Food Services
Administrative and Support and WasteManageme
Finance and Insurance
Health Care and Social Assistance
Manufacturing
Clarendon County South Carolina
Clarendon CountyIndustry South Carolina
Construction 1 298
Manufacturing 11 1,607
Retail Trade 1 524
Transportation and Warehousing 1 233
Finance and Insurance 2 112
Professional, Scientific, and Technical Servi 1 249
Administrative and Support and Waste Manageme 3 763
Health Care and Social Assistance 6 530
Accommodation and Food Services 2 458
Unknown 8 1,026
Source: S.C. Department of Employment & Workforce
Page 5 of 28SC Department of Employment & Workforce
Page 8
Clarendon CountyCommunity Profile
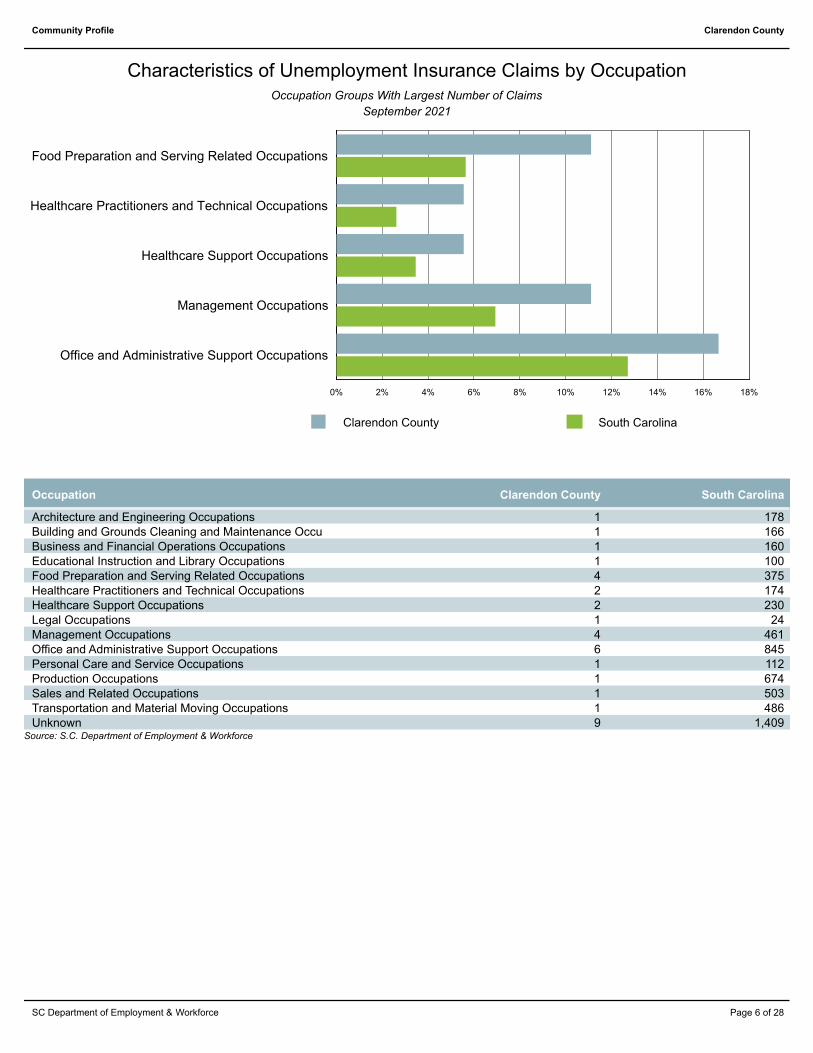
Characteristics of Unemployment Insurance Claims by OccupationOccupation Groups With Largest Number of Claims
September 2021
0% 2% 4% 6% 8% 10% 12% 14% 16% 18%
Food Preparation and Serving Related Occupations
Healthcare Practitioners and Technical Occupations
Healthcare Support Occupations
Management Occupations
Office and Administrative Support Occupations
South CarolinaClarendon County
Clarendon CountyOccupation South Carolina
Architecture and Engineering Occupations 1 178Building and Grounds Cleaning and Maintenance Occu 1 166Business and Financial Operations Occupations 1 160Educational Instruction and Library Occupations 1 100Food Preparation and Serving Related Occupations 4 375Healthcare Practitioners and Technical Occupations 2 174Healthcare Support Occupations 2 230Legal Occupations 1 24Management Occupations 4 461Office and Administrative Support Occupations 6 845Personal Care and Service Occupations 1 112Production Occupations 1 674Sales and Related Occupations 1 503Transportation and Material Moving Occupations 1 486Unknown 9 1,409
Source: S.C. Department of Employment & Workforce
Page 6 of 28SC Department of Employment & Workforce
Page 9
Clarendon CountyCommunity Profile
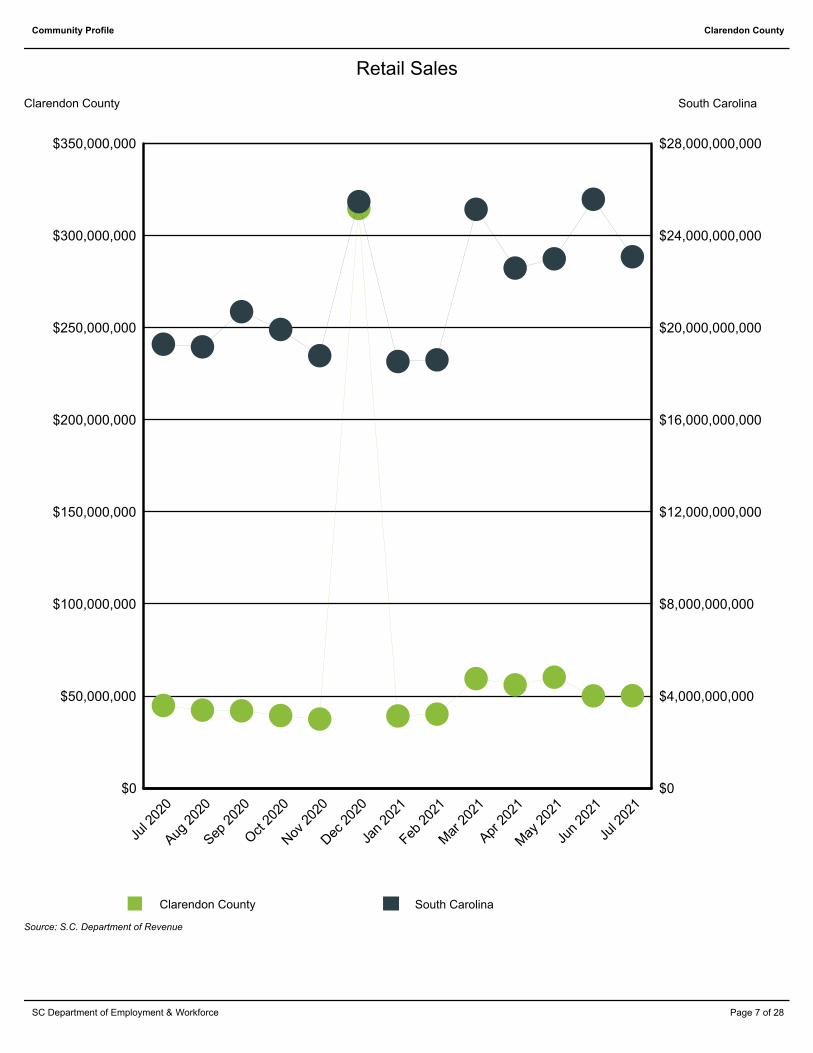
Retail Sales
Clarendon County South Carolina
$0
$50,000,000
$100,000,000
$150,000,000
$200,000,000
$250,000,000
$300,000,000
$350,000,000
$0
$4,000,000,000
$8,000,000,000
$12,000,000,000
$16,000,000,000
$20,000,000,000
$24,000,000,000
$28,000,000,000
Jul 2
020
Aug 2
020
Sep 2
020
Oct 2
020
Nov
202
0
Dec
202
0
Jan
2021
Feb 2
021
Mar
202
1
Apr 2
021
May
202
1
Jun
2021
Jul 2
021
South CarolinaClarendon County
Source: S.C. Department of Revenue
Page 7 of 28SC Department of Employment & Workforce
Page 10
Clarendon CountyCommunity Profile
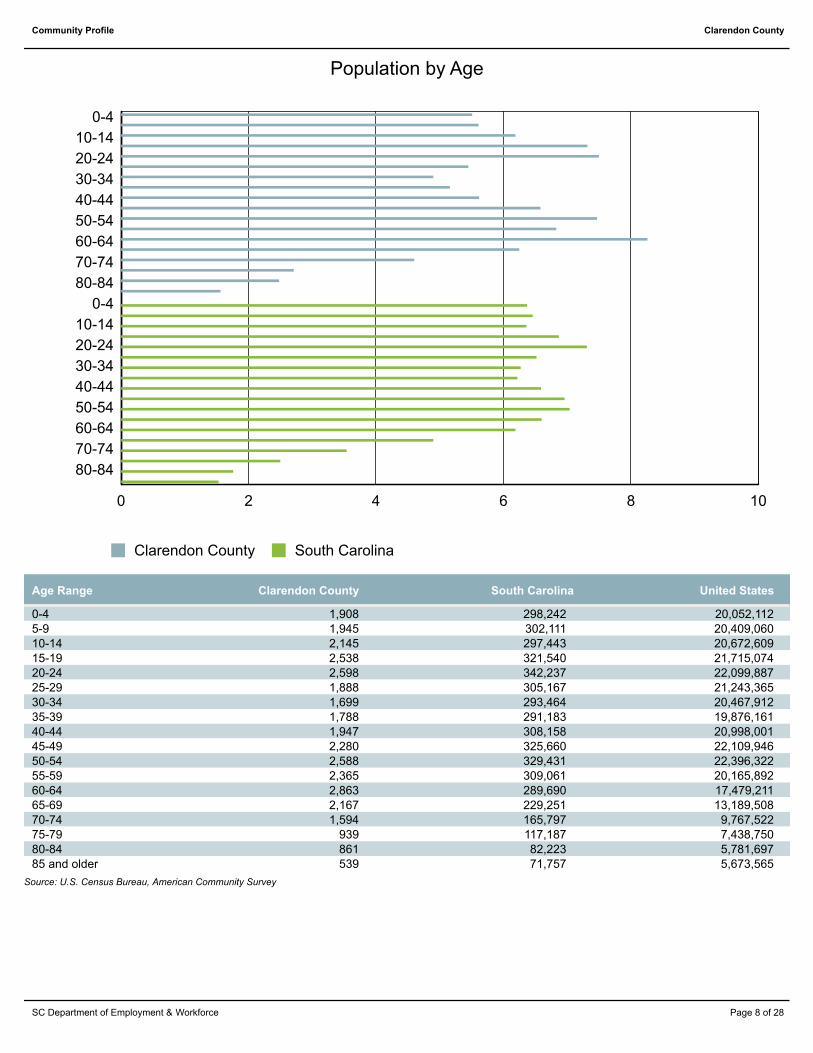
Population by Age
0 2 4 6 8 10
0-4
10-14
20-24
30-34
40-44
50-54
60-64
70-74
80-84
0-4
10-14
20-24
30-34
40-44
50-54
60-64
70-74
80-84
Clarendon County South Carolina
Clarendon CountyAge Range South Carolina United States
0-4 1,908 298,242 20,052,1125-9 1,945 302,111 20,409,06010-14 2,145 297,443 20,672,60915-19 2,538 321,540 21,715,07420-24 2,598 342,237 22,099,88725-29 1,888 305,167 21,243,36530-34 1,699 293,464 20,467,91235-39 1,788 291,183 19,876,16140-44 1,947 308,158 20,998,00145-49 2,280 325,660 22,109,94650-54 2,588 329,431 22,396,32255-59 2,365 309,061 20,165,89260-64 2,863 289,690 17,479,21165-69 2,167 229,251 13,189,50870-74 1,594 165,797 9,767,52275-79 939 117,187 7,438,75080-84 861 82,223 5,781,69785 and older 539 71,757 5,673,565
Source: U.S. Census Bureau, American Community Survey
Page 8 of 28SC Department of Employment & Workforce
Page 11
Clarendon CountyCommunity Profile
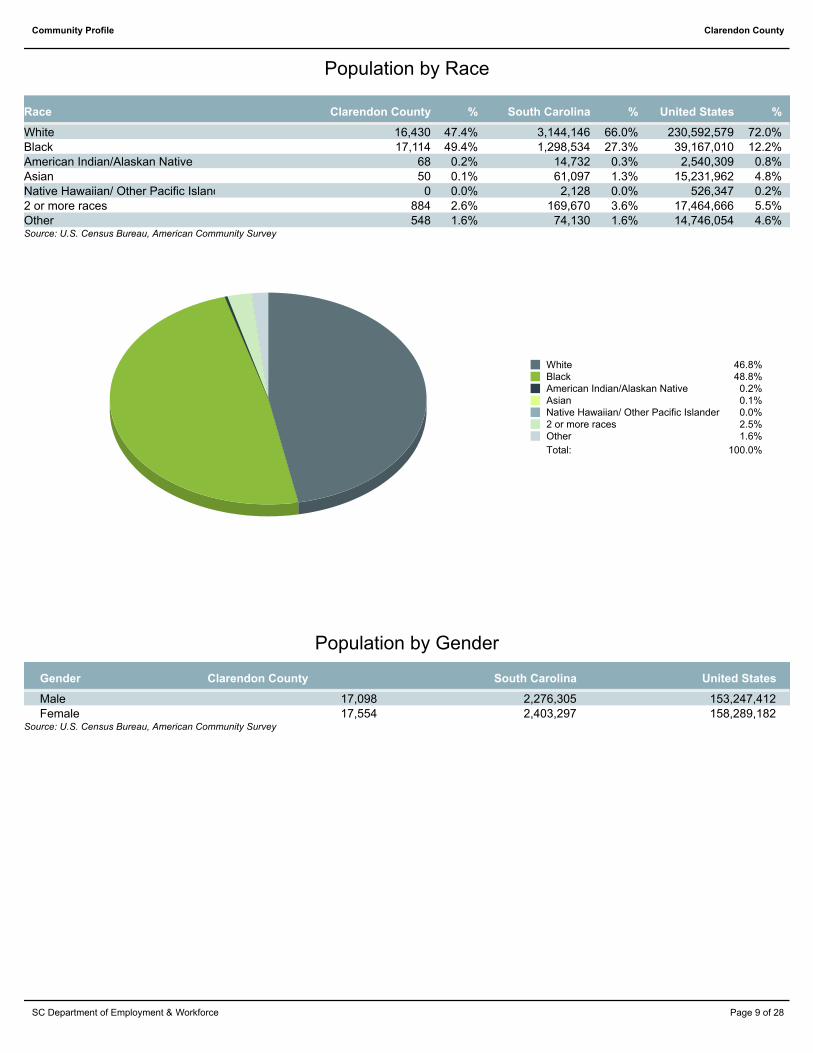
Population by Race
Clarendon CountyRace % South Carolina % United States %
White 16,430 47.4% 3,144,146 66.0% 230,592,579 72.0%Black 17,114 49.4% 1,298,534 27.3% 39,167,010 12.2%American Indian/Alaskan Native 68 0.2% 14,732 0.3% 2,540,309 0.8%Asian 50 0.1% 61,097 1.3% 15,231,962 4.8%Native Hawaiian/ Other Pacific Islander 0 0.0% 2,128 0.0% 526,347 0.2%2 or more races 884 2.6% 169,670 3.6% 17,464,666 5.5%Other 548 1.6% 74,130 1.6% 14,746,054 4.6%Source: U.S. Census Bureau, American Community Survey
White 46.8%Black 48.8%American Indian/Alaskan Native 0.2%Asian 0.1%Native Hawaiian/ Other Pacific Islander 0.0%2 or more races 2.5%Other 1.6%
Total: 100.0%
Population by Gender
Clarendon CountyGender South Carolina United States
Male 17,098 2,276,305 153,247,412Female 17,554 2,403,297 158,289,182
Source: U.S. Census Bureau, American Community Survey
Page 9 of 28SC Department of Employment & Workforce
Page 12
Clarendon CountyCommunity Profile
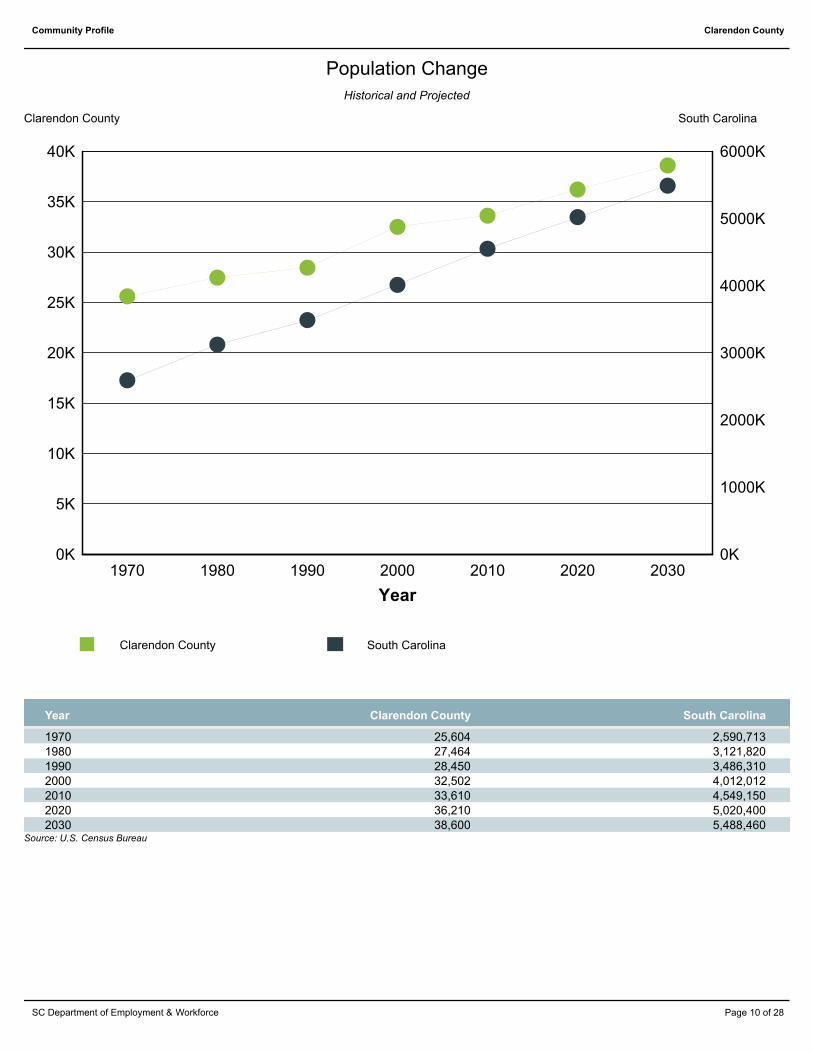
Historical and Projected
Population Change
South CarolinaClarendon County
0K
5K
10K
15K
20K
25K
30K
35K
40K
0K
1000K
2000K
3000K
4000K
5000K
6000K
1970 1980 1990 2000 2010 2020 2030
Year
South CarolinaClarendon County
Clarendon CountyYear South Carolina
1970 25,604 2,590,7131980 27,464 3,121,8201990 28,450 3,486,3102000 32,502 4,012,0122010 33,610 4,549,1502020 36,210 5,020,4002030 38,600 5,488,460
Source: U.S. Census Bureau
Page 10 of 28SC Department of Employment & Workforce
Page 13
Clarendon CountyCommunity Profile
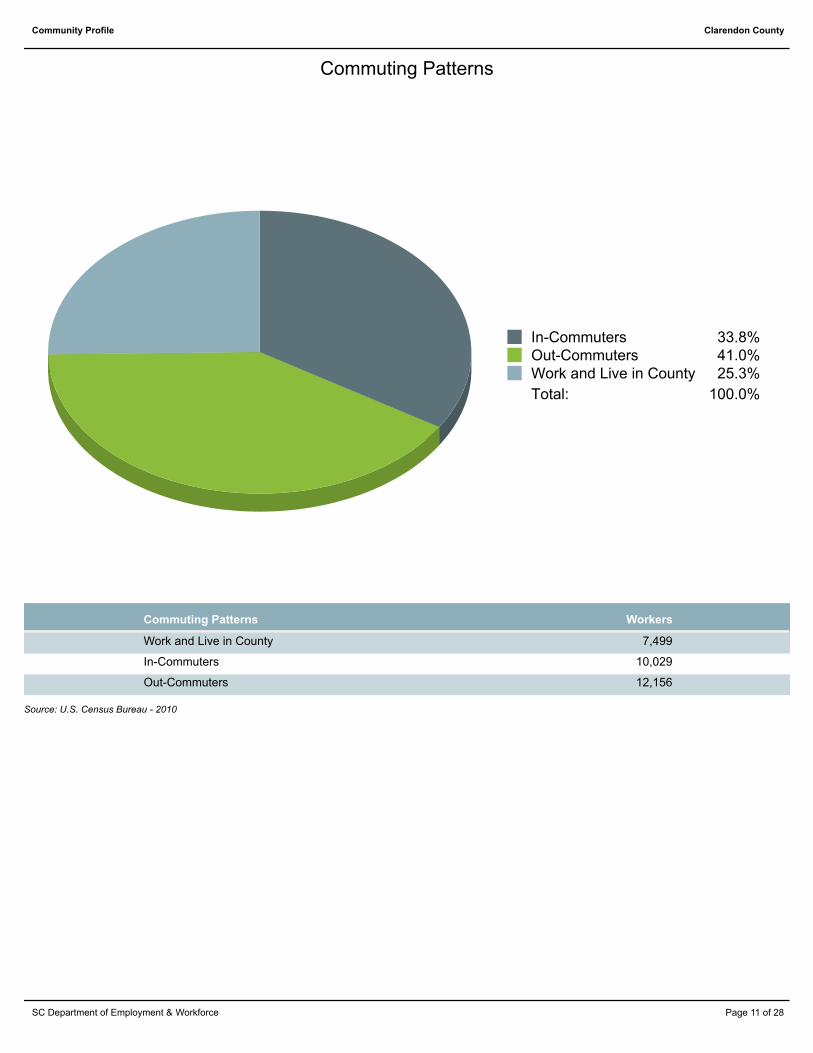
Commuting Patterns
In-Commuters 33.8%Out-Commuters 41.0%Work and Live in County 25.3%
Total: 100.0%
WorkersCommuting Patterns
Work and Live in County 7,499
In-Commuters 10,029
Out-Commuters 12,156
Source: U.S. Census Bureau - 2010
Page 11 of 28SC Department of Employment & Workforce
Page 14
Clarendon CountyCommunity Profile
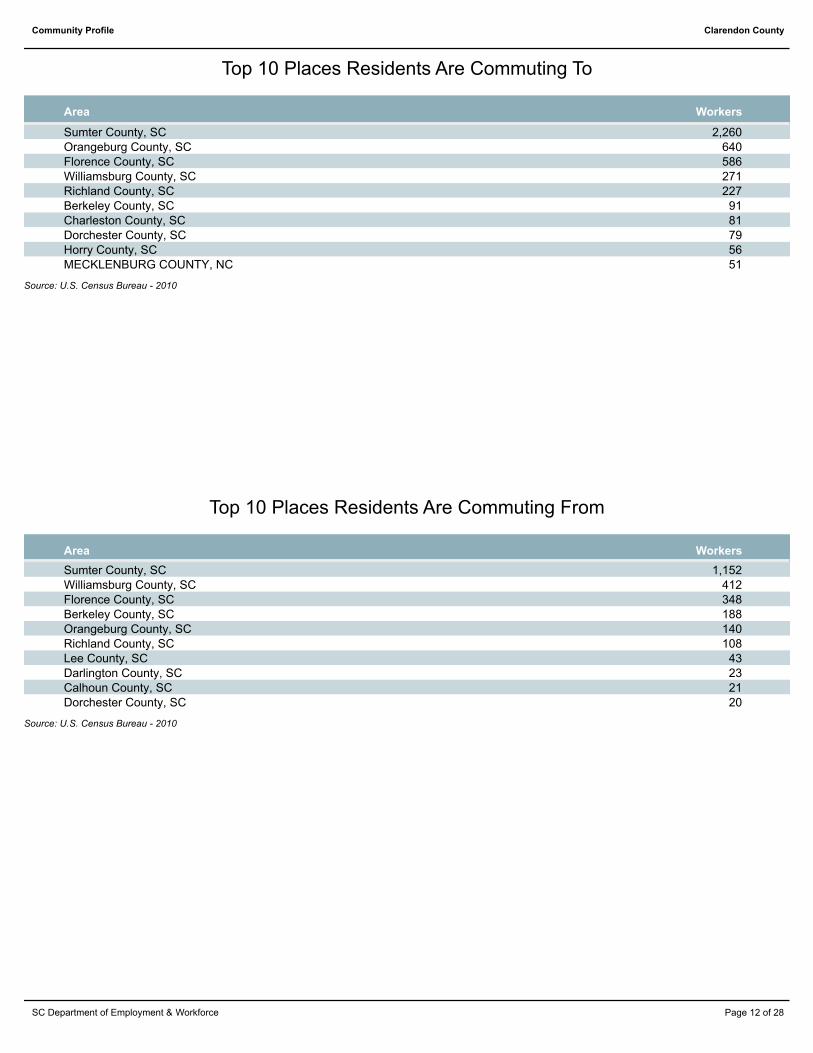
Top 10 Places Residents Are Commuting To
Area Workers
Sumter County, SC 2,260Orangeburg County, SC 640Florence County, SC 586Williamsburg County, SC 271Richland County, SC 227Berkeley County, SC 91Charleston County, SC 81Dorchester County, SC 79Horry County, SC 56MECKLENBURG COUNTY, NC 51
Source: U.S. Census Bureau - 2010
Top 10 Places Residents Are Commuting From
Area Workers
Sumter County, SC 1,152Williamsburg County, SC 412Florence County, SC 348Berkeley County, SC 188Orangeburg County, SC 140Richland County, SC 108Lee County, SC 43Darlington County, SC 23Calhoun County, SC 21Dorchester County, SC 20
Source: U.S. Census Bureau - 2010
Page 12 of 28SC Department of Employment & Workforce
Page 15
Clarendon CountyCommunity Profile
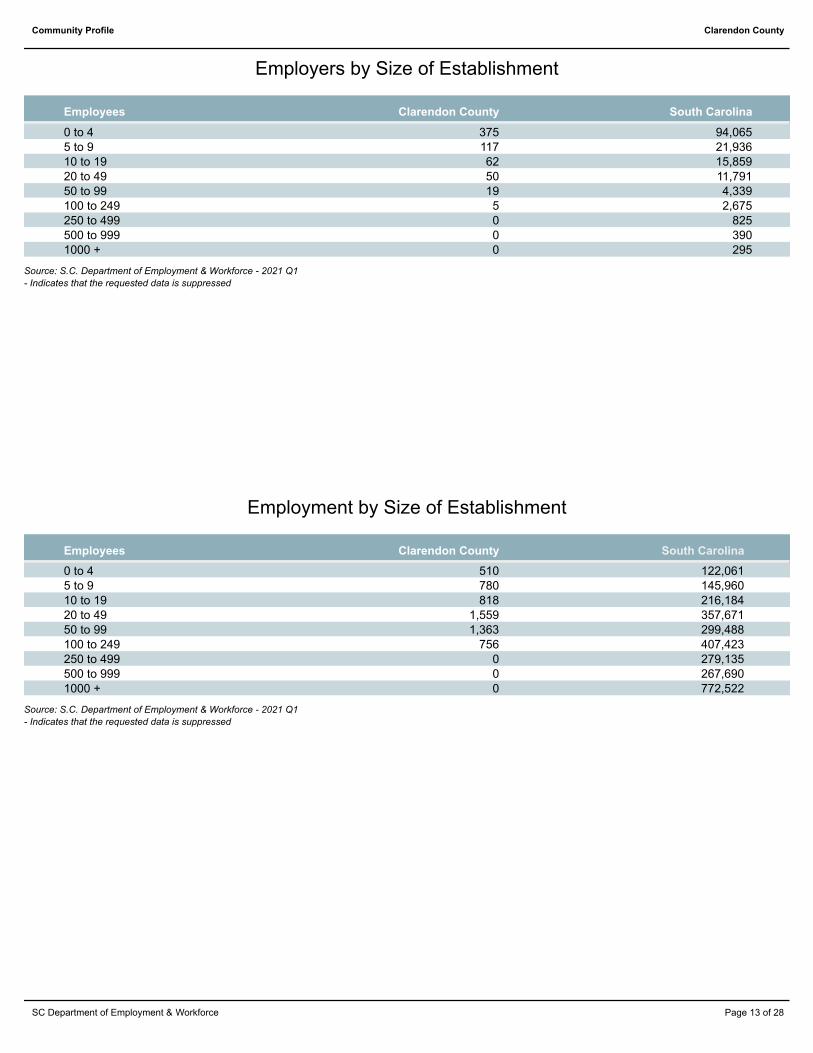
Employers by Size of Establishment
Clarendon CountyEmployees South Carolina
0 to 4 375 94,0655 to 9 117 21,93610 to 19 62 15,85920 to 49 50 11,79150 to 99 19 4,339100 to 249 5 2,675250 to 499 0 825500 to 999 0 3901000 + 0 295
Source: S.C. Department of Employment & Workforce - 2021 Q1
- Indicates that the requested data is suppressed
Employment by Size of Establishment
Clarendon CountyEmployees South Carolina
0 to 4 510 122,0615 to 9 780 145,96010 to 19 818 216,18420 to 49 1,559 357,67150 to 99 1,363 299,488100 to 249 756 407,423250 to 499 0 279,135500 to 999 0 267,6901000 + 0 772,522
Source: S.C. Department of Employment & Workforce - 2021 Q1
- Indicates that the requested data is suppressed
Page 13 of 28SC Department of Employment & Workforce
Page 16
Clarendon CountyCommunity Profile
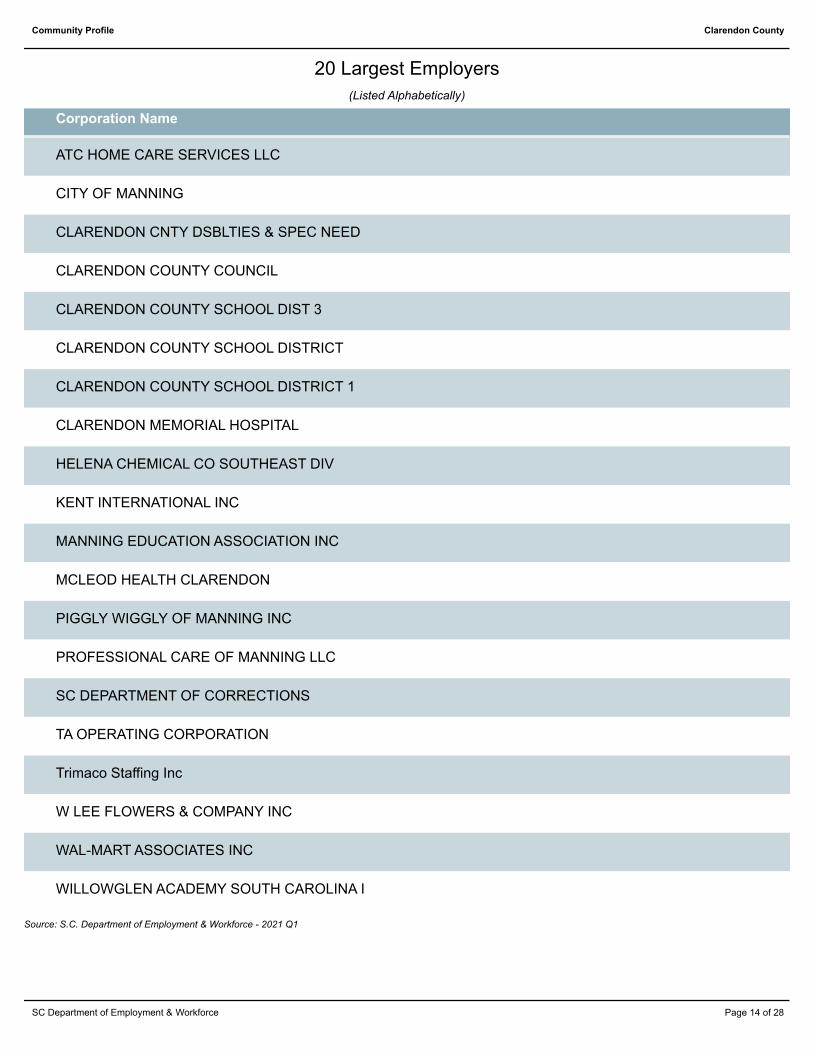
20 Largest Employers
(Listed Alphabetically)
Corporation Name
ATC HOME CARE SERVICES LLC
CITY OF MANNING
CLARENDON CNTY DSBLTIES & SPEC NEED
CLARENDON COUNTY COUNCIL
CLARENDON COUNTY SCHOOL DIST 3
CLARENDON COUNTY SCHOOL DISTRICT
CLARENDON COUNTY SCHOOL DISTRICT 1
CLARENDON MEMORIAL HOSPITAL
HELENA CHEMICAL CO SOUTHEAST DIV
KENT INTERNATIONAL INC
MANNING EDUCATION ASSOCIATION INC
MCLEOD HEALTH CLARENDON
PIGGLY WIGGLY OF MANNING INC
PROFESSIONAL CARE OF MANNING LLC
SC DEPARTMENT OF CORRECTIONS
TA OPERATING CORPORATION
Trimaco Staffing Inc
W LEE FLOWERS & COMPANY INC
WAL-MART ASSOCIATES INC
WILLOWGLEN ACADEMY SOUTH CAROLINA I
Source: S.C. Department of Employment & Workforce - 2021 Q1
Page 14 of 28SC Department of Employment & Workforce
Page 17
Clarendon CountyCommunity Profile
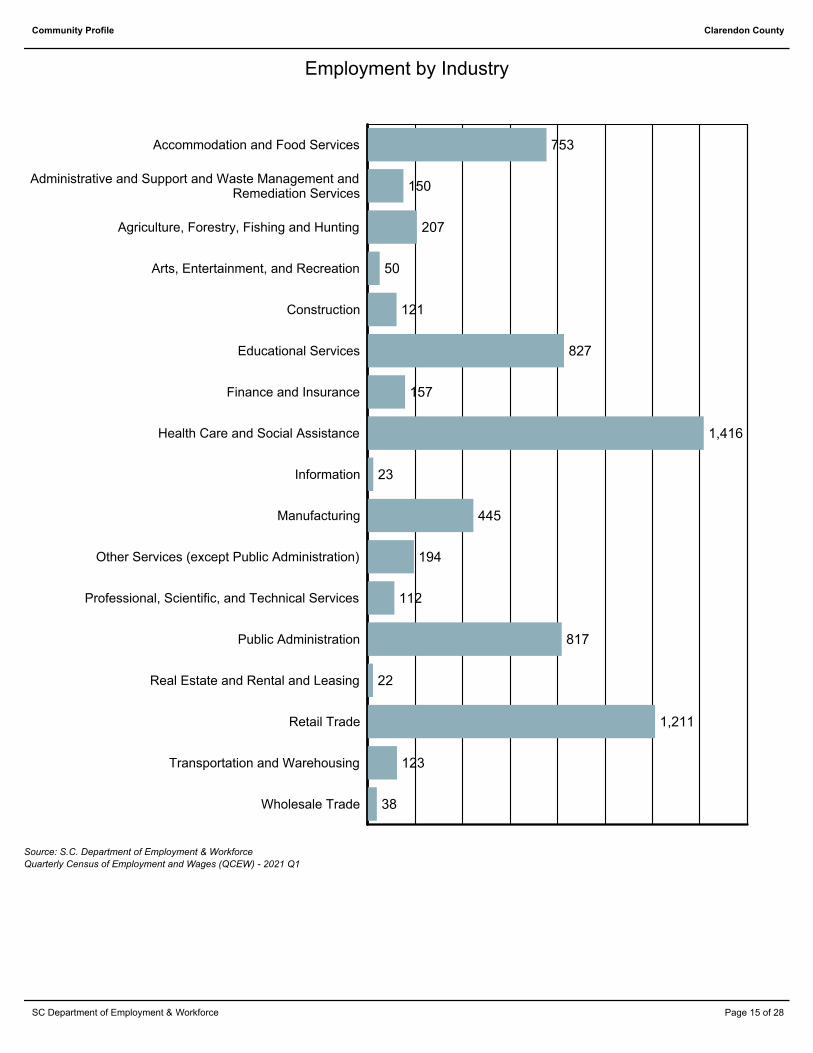
Employment by Industry
753
150
207
50
121
827
157
1,416
23
445
194
112
817
22
1,211
123
38
Accommodation and Food Services
Administrative and Support and Waste Management andRemediation Services
Agriculture, Forestry, Fishing and Hunting
Arts, Entertainment, and Recreation
Construction
Educational Services
Finance and Insurance
Health Care and Social Assistance
Information
Manufacturing
Other Services (except Public Administration)
Professional, Scientific, and Technical Services
Public Administration
Real Estate and Rental and Leasing
Retail Trade
Transportation and Warehousing
Wholesale Trade
Source: S.C. Department of Employment & Workforce
Quarterly Census of Employment and Wages (QCEW) - 2021 Q1
Page 15 of 28SC Department of Employment & Workforce
Page 18
Clarendon CountyCommunity Profile
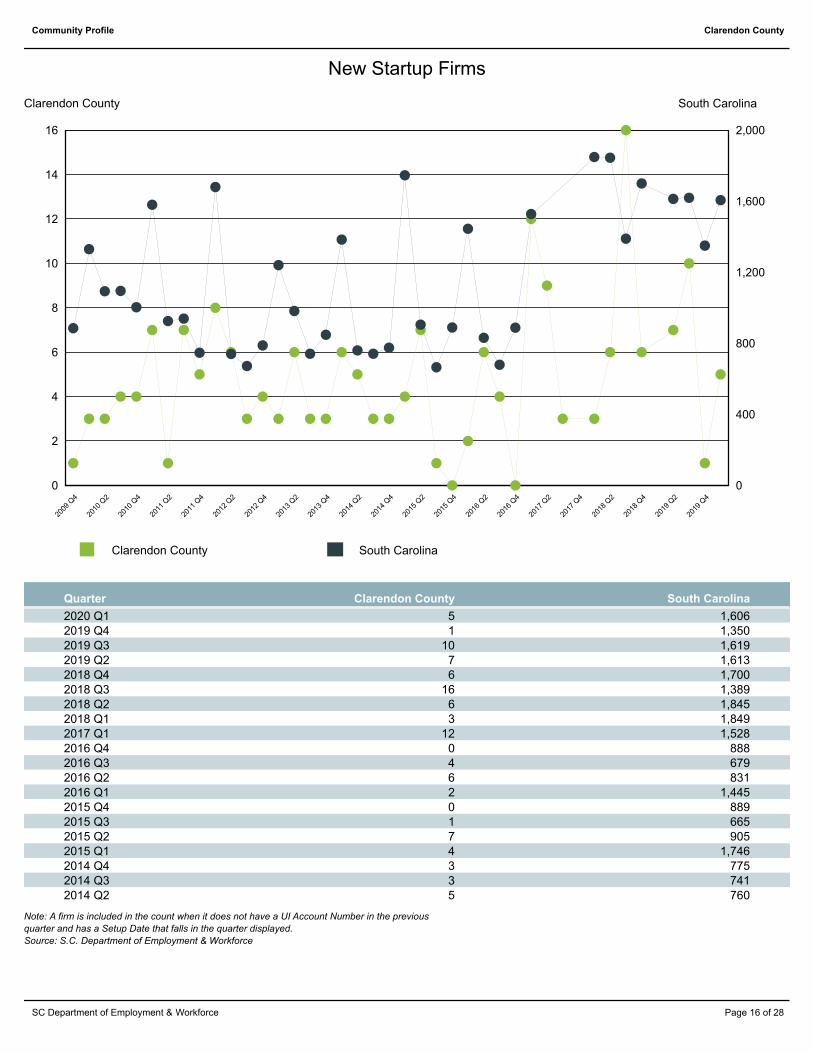
New Startup Firms
South CarolinaClarendon County
0
2
4
6
8
10
12
14
16
0
400
800
1,200
1,600
2,000
2009
Q4
2010
Q2
2010
Q4
2011
Q2
2011
Q4
2012
Q2
2012
Q4
2013
Q2
2013
Q4
2014
Q2
2014
Q4
2015
Q2
2015
Q4
2016
Q2
2016
Q4
2017
Q2
2017
Q4
2018
Q2
2018
Q4
2019
Q2
2019
Q4
South CarolinaClarendon County
Clarendon CountyQuarter South Carolina
2020 Q1 5 1,6062019 Q4 1 1,3502019 Q3 10 1,6192019 Q2 7 1,6132018 Q4 6 1,7002018 Q3 16 1,3892018 Q2 6 1,8452018 Q1 3 1,8492017 Q1 12 1,5282016 Q4 0 8882016 Q3 4 6792016 Q2 6 8312016 Q1 2 1,4452015 Q4 0 8892015 Q3 1 6652015 Q2 7 9052015 Q1 4 1,7462014 Q4 3 7752014 Q3 3 7412014 Q2 5 760
Note: A firm is included in the count when it does not have a UI Account Number in the previous
quarter and has a Setup Date that falls in the quarter displayed.
Source: S.C. Department of Employment & Workforce
Page 16 of 28SC Department of Employment & Workforce
Page 19
Clarendon CountyCommunity Profile
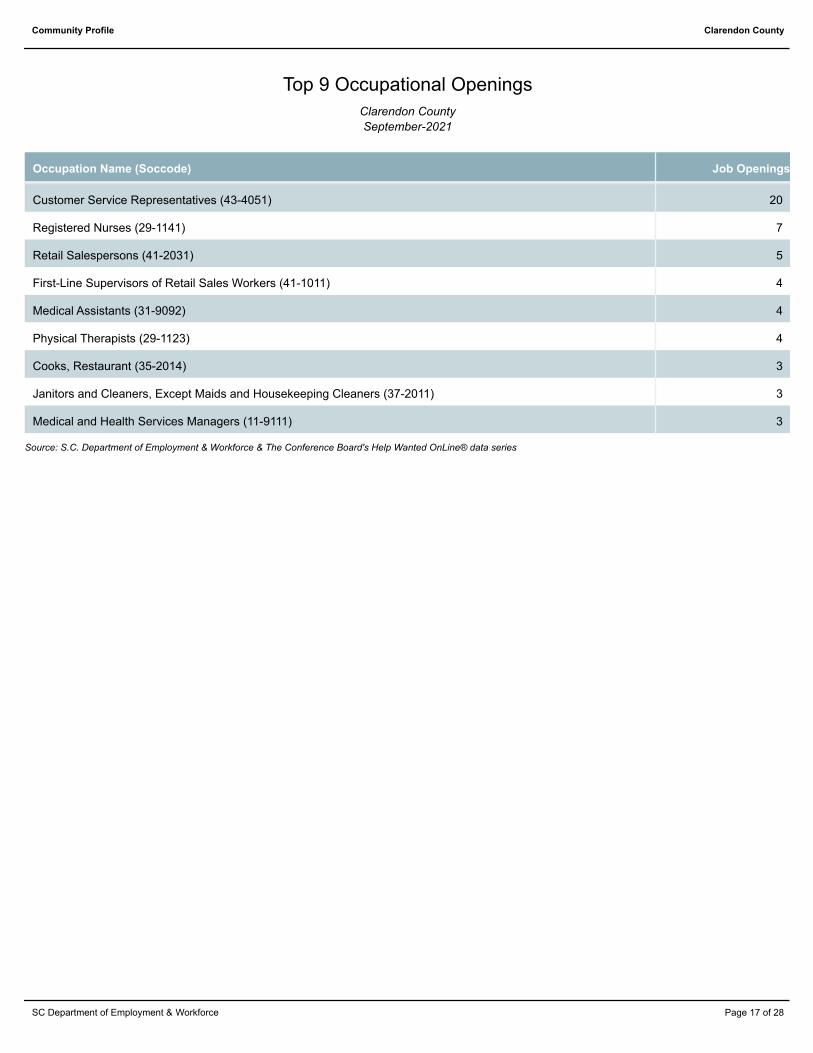
Top 9 Occupational Openings
Clarendon County
September-2021
Occupation Name (Soccode) Job Openings
Customer Service Representatives (43-4051) 20
Registered Nurses (29-1141) 7
Retail Salespersons (41-2031) 5
First-Line Supervisors of Retail Sales Workers (41-1011) 4
Medical Assistants (31-9092) 4
Physical Therapists (29-1123) 4
Cooks, Restaurant (35-2014) 3
Janitors and Cleaners, Except Maids and Housekeeping Cleaners (37-2011) 3
Medical and Health Services Managers (11-9111) 3
Source: S.C. Department of Employment & Workforce & The Conference Board's Help Wanted OnLine® data series
Page 17 of 28SC Department of Employment & Workforce
Page 20
Clarendon CountyCommunity Profile
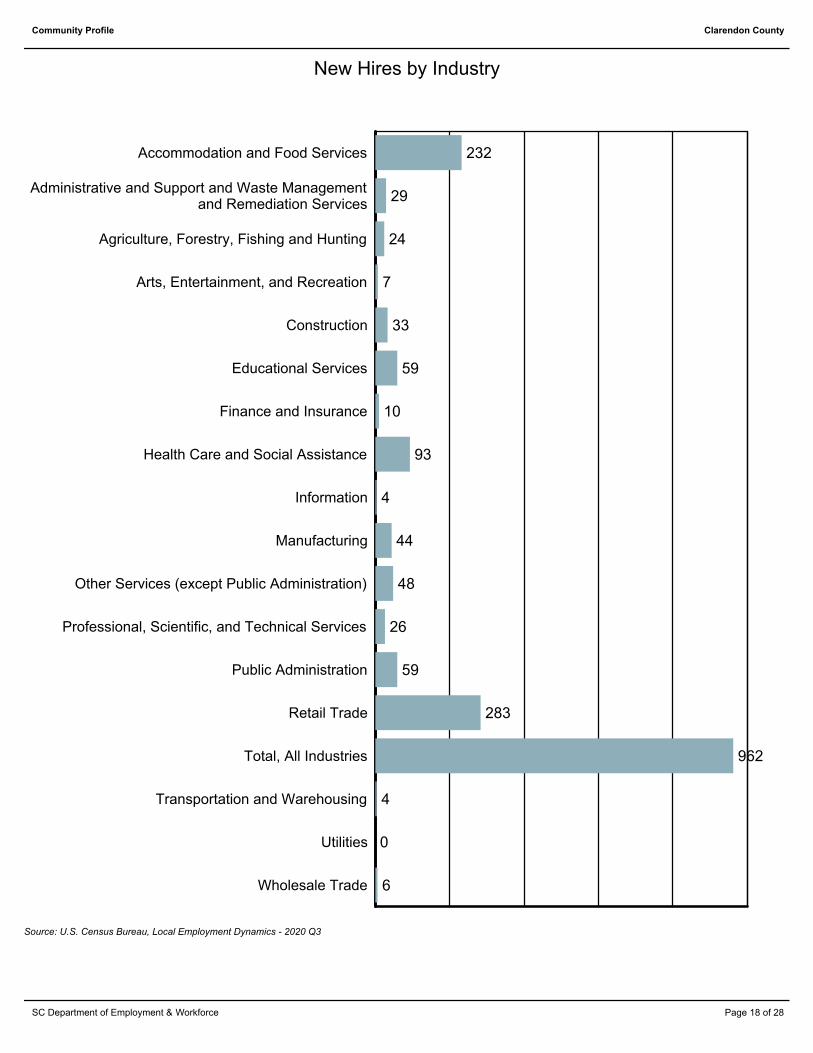
New Hires by Industry
232
29
24
7
33
59
10
93
4
44
48
26
59
283
962
4
0
6
Accommodation and Food Services
Administrative and Support and Waste Managementand Remediation Services
Agriculture, Forestry, Fishing and Hunting
Arts, Entertainment, and Recreation
Construction
Educational Services
Finance and Insurance
Health Care and Social Assistance
Information
Manufacturing
Other Services (except Public Administration)
Professional, Scientific, and Technical Services
Public Administration
Retail Trade
Total, All Industries
Transportation and Warehousing
Utilities
Wholesale Trade
Source: U.S. Census Bureau, Local Employment Dynamics - 2020 Q3
Page 18 of 28SC Department of Employment & Workforce
Page 21
Clarendon CountyCommunity Profile
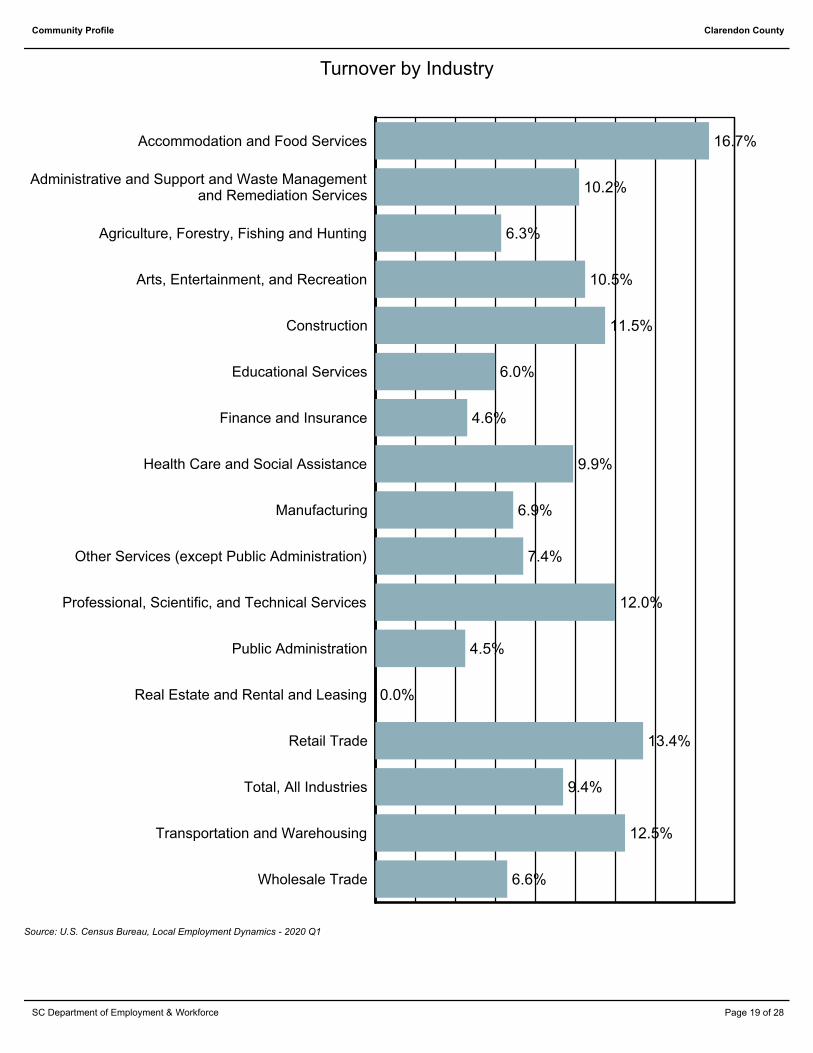
Turnover by Industry
16.7%
10.2%
6.3%
10.5%
11.5%
6.0%
4.6%
9.9%
6.9%
7.4%
12.0%
4.5%
0.0%
13.4%
9.4%
12.5%
6.6%
Accommodation and Food Services
Administrative and Support and Waste Managementand Remediation Services
Agriculture, Forestry, Fishing and Hunting
Arts, Entertainment, and Recreation
Construction
Educational Services
Finance and Insurance
Health Care and Social Assistance
Manufacturing
Other Services (except Public Administration)
Professional, Scientific, and Technical Services
Public Administration
Real Estate and Rental and Leasing
Retail Trade
Total, All Industries
Transportation and Warehousing
Wholesale Trade
Source: U.S. Census Bureau, Local Employment Dynamics - 2020 Q1
Page 19 of 28SC Department of Employment & Workforce
Page 22
Clarendon CountyCommunity Profile
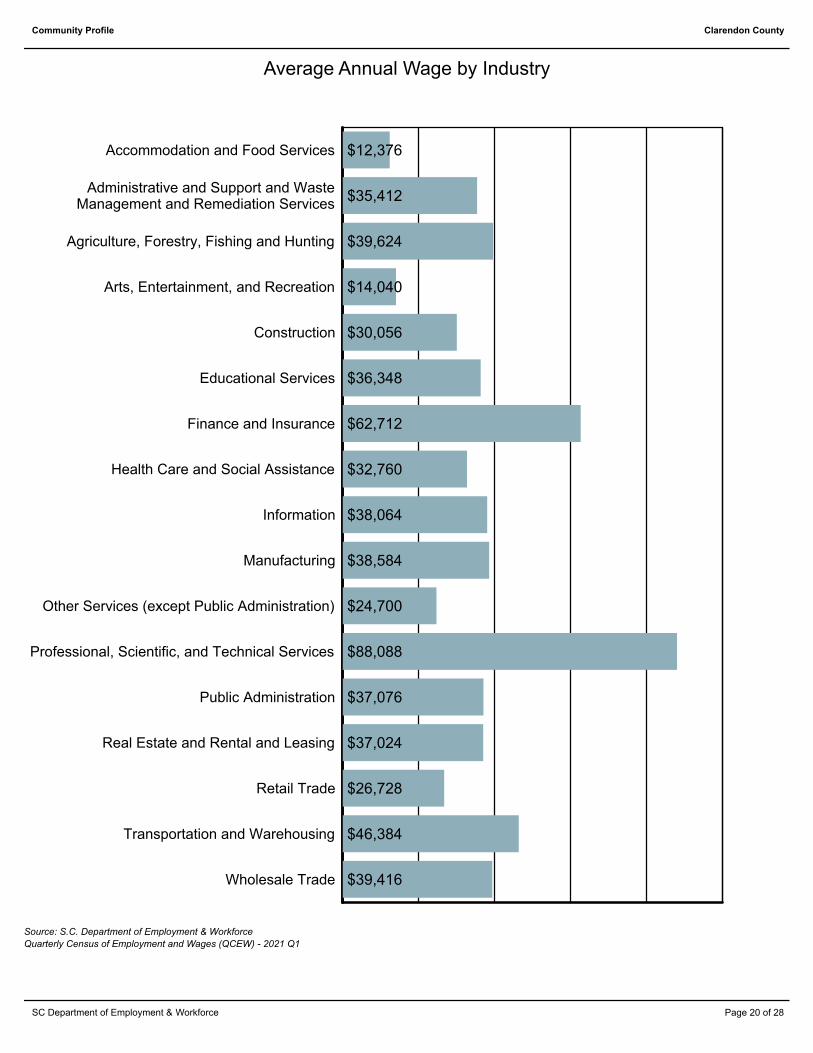
Average Annual Wage by Industry
$12,376
$35,412
$39,624
$14,040
$30,056
$36,348
$62,712
$32,760
$38,064
$38,584
$24,700
$88,088
$37,076
$37,024
$26,728
$46,384
$39,416
Accommodation and Food Services
Administrative and Support and WasteManagement and Remediation Services
Agriculture, Forestry, Fishing and Hunting
Arts, Entertainment, and Recreation
Construction
Educational Services
Finance and Insurance
Health Care and Social Assistance
Information
Manufacturing
Other Services (except Public Administration)
Professional, Scientific, and Technical Services
Public Administration
Real Estate and Rental and Leasing
Retail Trade
Transportation and Warehousing
Wholesale Trade
Source: S.C. Department of Employment & Workforce
Quarterly Census of Employment and Wages (QCEW) - 2021 Q1
Page 20 of 28SC Department of Employment & Workforce
Page 23
Clarendon CountyCommunity Profile
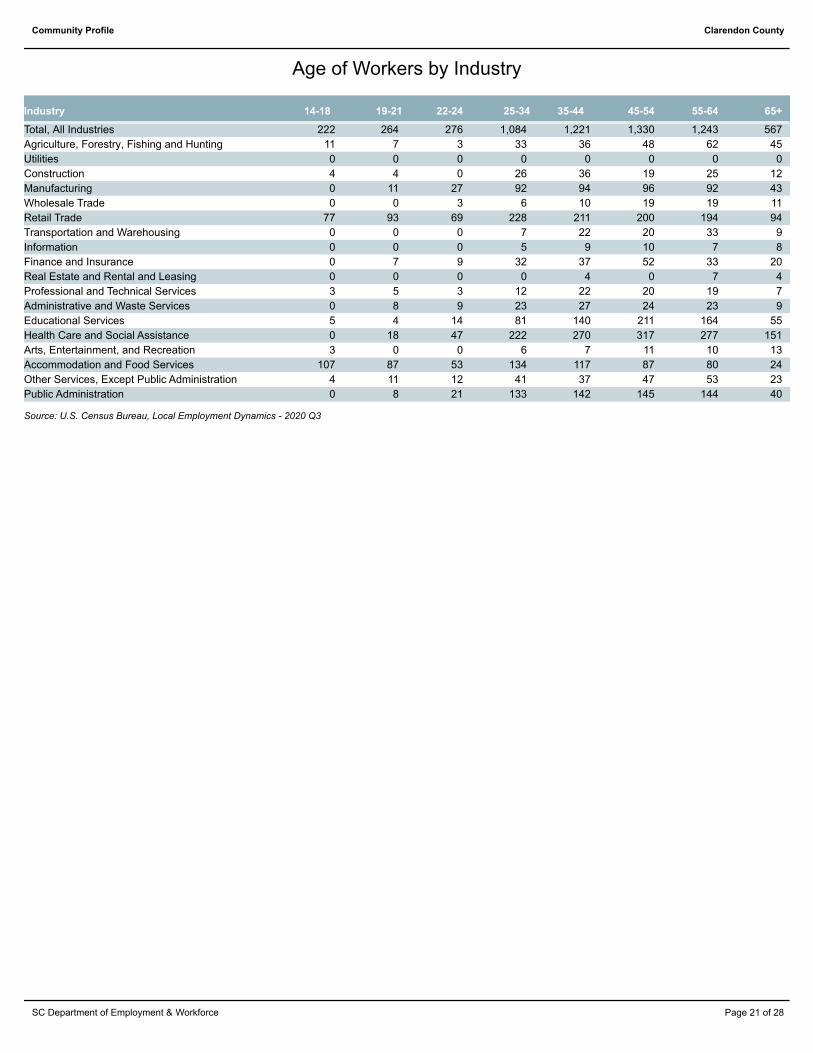
Age of Workers by Industry
65+55-6445-5435-4425-3422-2419-2114-18Industry
Total, All Industries 222 264 276 1,084 1,221 1,330 1,243 567
Agriculture, Forestry, Fishing and Hunting 11 7 3 33 36 48 62 45
Utilities 0 0 0 0 0 0 0 0
Construction 4 4 0 26 36 19 25 12
Manufacturing 0 11 27 92 94 96 92 43
Wholesale Trade 0 0 3 6 10 19 19 11
Retail Trade 77 93 69 228 211 200 194 94
Transportation and Warehousing 0 0 0 7 22 20 33 9
Information 0 0 0 5 9 10 7 8
Finance and Insurance 0 7 9 32 37 52 33 20
Real Estate and Rental and Leasing 0 0 0 0 4 0 7 4
Professional and Technical Services 3 5 3 12 22 20 19 7
Administrative and Waste Services 0 8 9 23 27 24 23 9
Educational Services 5 4 14 81 140 211 164 55
Health Care and Social Assistance 0 18 47 222 270 317 277 151
Arts, Entertainment, and Recreation 3 0 0 6 7 11 10 13
Accommodation and Food Services 107 87 53 134 117 87 80 24
Other Services, Except Public Administration 4 11 12 41 37 47 53 23
Public Administration 0 8 21 133 142 145 144 40
Source: U.S. Census Bureau, Local Employment Dynamics - 2020 Q3
Page 21 of 28SC Department of Employment & Workforce
Page 24
Clarendon CountyCommunity Profile
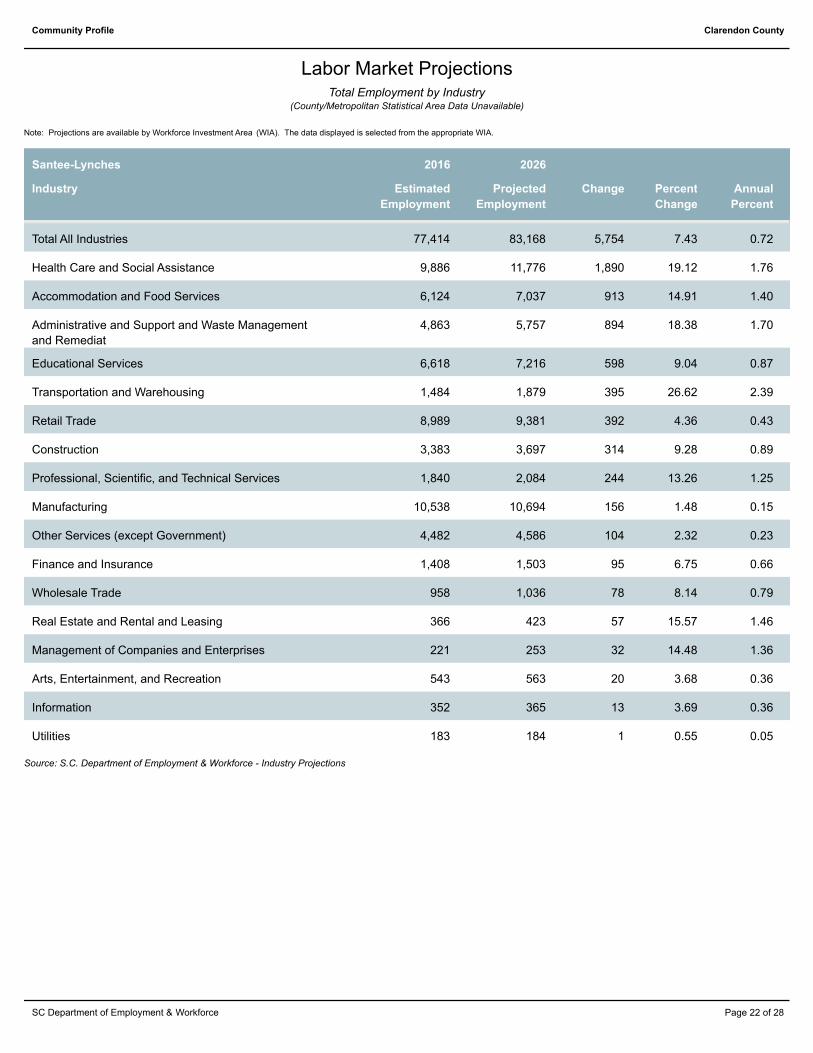
Labor Market ProjectionsTotal Employment by Industry
(County/Metropolitan Statistical Area Data Unavailable)
Note: Projections are available by Workforce Investment Area (WIA). The data displayed is selected from the appropriate WIA.
Santee-Lynches 2016 2026
Industry Estimated
Employment
Projected
Employment
Change Percent
Change
Annual
Percent
Total All Industries 77,414 83,168 5,754 7.43 0.72
Health Care and Social Assistance 9,886 11,776 1,890 19.12 1.76
Accommodation and Food Services 6,124 7,037 913 14.91 1.40
Administrative and Support and Waste Management
and Remediat
4,863 5,757 894 18.38 1.70
Educational Services 6,618 7,216 598 9.04 0.87
Transportation and Warehousing 1,484 1,879 395 26.62 2.39
Retail Trade 8,989 9,381 392 4.36 0.43
Construction 3,383 3,697 314 9.28 0.89
Professional, Scientific, and Technical Services 1,840 2,084 244 13.26 1.25
Manufacturing 10,538 10,694 156 1.48 0.15
Other Services (except Government) 4,482 4,586 104 2.32 0.23
Finance and Insurance 1,408 1,503 95 6.75 0.66
Wholesale Trade 958 1,036 78 8.14 0.79
Real Estate and Rental and Leasing 366 423 57 15.57 1.46
Management of Companies and Enterprises 221 253 32 14.48 1.36
Arts, Entertainment, and Recreation 543 563 20 3.68 0.36
Information 352 365 13 3.69 0.36
Utilities 183 184 1 0.55 0.05
Source: S.C. Department of Employment & Workforce - Industry Projections
Page 22 of 28SC Department of Employment & Workforce
Page 25
Clarendon CountyCommunity Profile
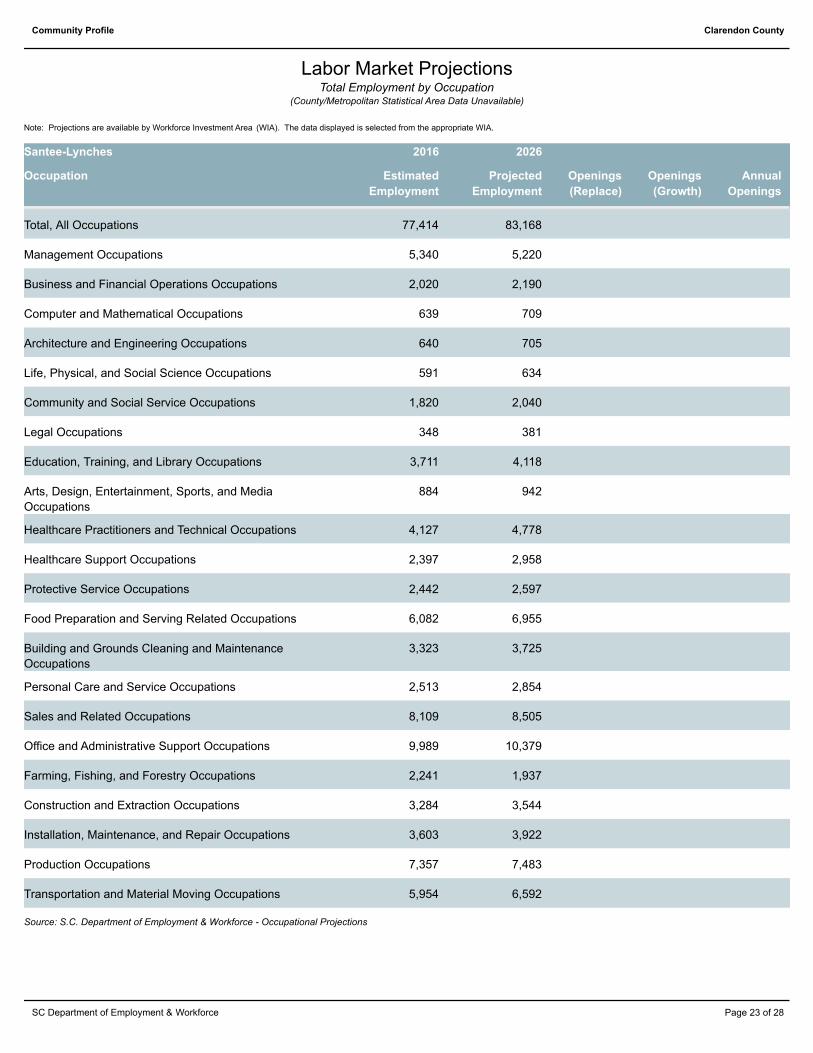
Total Employment by Occupation(County/Metropolitan Statistical Area Data Unavailable)
Note: Projections are available by Workforce Investment Area (WIA). The data displayed is selected from the appropriate WIA.
Labor Market Projections
Santee-Lynches 2016 2026
Occupation Estimated
Employment
Projected
Employment
Annual
Openings
Openings
(Replace)
Openings
(Growth)
Total, All Occupations 83,168 77,414
Management Occupations 5,220 5,340
Business and Financial Operations Occupations 2,190 2,020
Computer and Mathematical Occupations 709 639
Architecture and Engineering Occupations 705 640
Life, Physical, and Social Science Occupations 634 591
Community and Social Service Occupations 2,040 1,820
Legal Occupations 381 348
Education, Training, and Library Occupations 4,118 3,711
Arts, Design, Entertainment, Sports, and Media
Occupations
942 884
Healthcare Practitioners and Technical Occupations 4,778 4,127
Healthcare Support Occupations 2,958 2,397
Protective Service Occupations 2,597 2,442
Food Preparation and Serving Related Occupations 6,955 6,082
Building and Grounds Cleaning and Maintenance
Occupations
3,725 3,323
Personal Care and Service Occupations 2,854 2,513
Sales and Related Occupations 8,505 8,109
Office and Administrative Support Occupations 10,379 9,989
Farming, Fishing, and Forestry Occupations 1,937 2,241
Construction and Extraction Occupations 3,544 3,284
Installation, Maintenance, and Repair Occupations 3,922 3,603
Production Occupations 7,483 7,357
Transportation and Material Moving Occupations 6,592 5,954
Source: S.C. Department of Employment & Workforce - Occupational Projections
Page 23 of 28SC Department of Employment & Workforce
Page 26
Clarendon CountyCommunity Profile
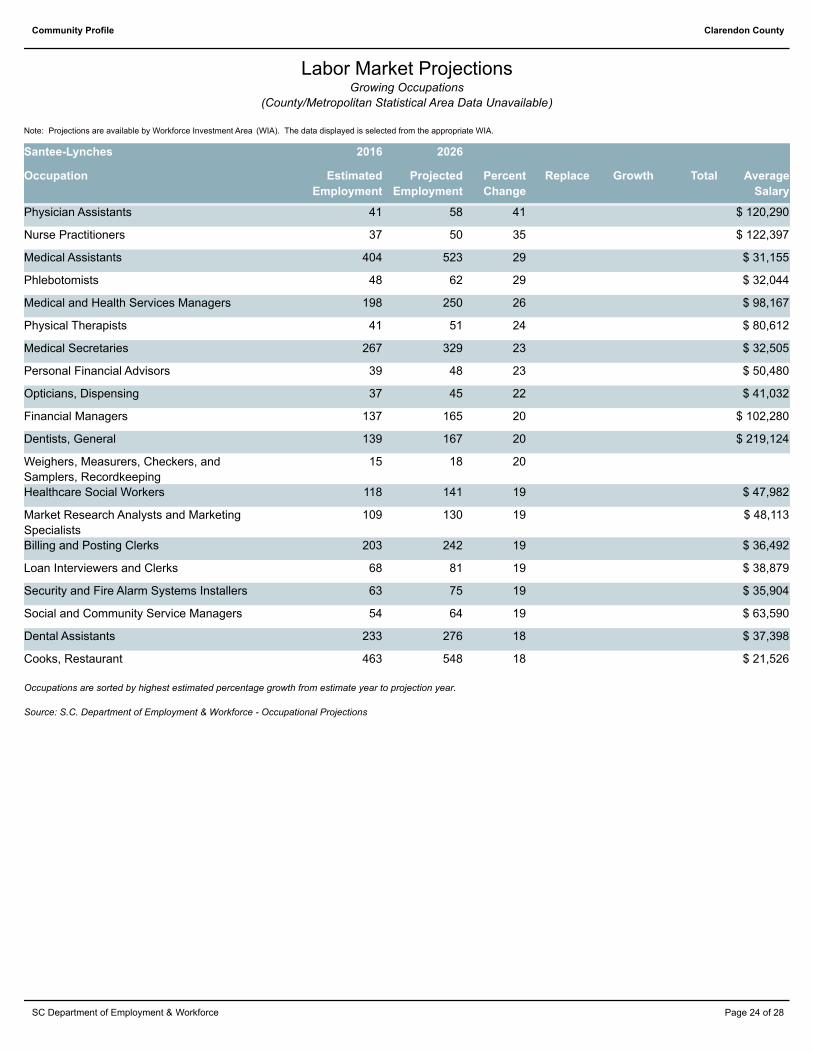
Growing Occupations
(County/Metropolitan Statistical Area Data Unavailable)
Note: Projections are available by Workforce Investment Area (WIA). The data displayed is selected from the appropriate WIA.
Labor Market Projections
Santee-Lynches 2016 2026
Occupation Estimated
Employment
Projected
Employment
Percent
Change
Replace Growth Total Average
Salary
Physician Assistants $ 120,290 41 58 41
Nurse Practitioners $ 122,397 35 50 37
Medical Assistants $ 31,155 29 523 404
Phlebotomists $ 32,044 29 62 48
Medical and Health Services Managers $ 98,167 26 250 198
Physical Therapists $ 80,612 24 51 41
Medical Secretaries $ 32,505 23 329 267
Personal Financial Advisors $ 50,480 23 48 39
Opticians, Dispensing $ 41,032 22 45 37
Financial Managers $ 102,280 20 165 137
Dentists, General $ 219,124 20 167 139
Weighers, Measurers, Checkers, and
Samplers, Recordkeeping
20 18 15
Healthcare Social Workers $ 47,982 19 141 118
Market Research Analysts and Marketing
Specialists
$ 48,113 19 130 109
Billing and Posting Clerks $ 36,492 19 242 203
Loan Interviewers and Clerks $ 38,879 19 81 68
Security and Fire Alarm Systems Installers $ 35,904 19 75 63
Social and Community Service Managers $ 63,590 19 64 54
Dental Assistants $ 37,398 18 276 233
Cooks, Restaurant $ 21,526 18 548 463
Occupations are sorted by highest estimated percentage growth from estimate year to projection year.
Source: S.C. Department of Employment & Workforce - Occupational Projections
Page 24 of 28SC Department of Employment & Workforce
Page 27
Clarendon CountyCommunity Profile
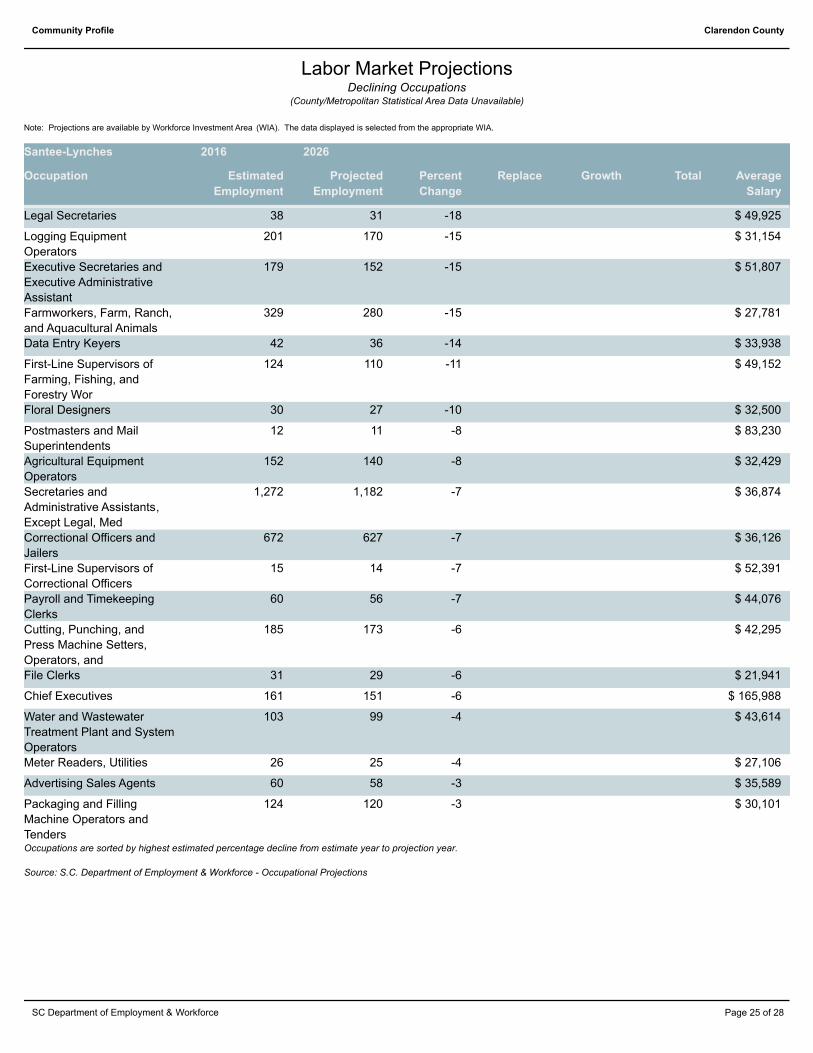
Declining Occupations(County/Metropolitan Statistical Area Data Unavailable)
Note: Projections are available by Workforce Investment Area (WIA). The data displayed is selected from the appropriate WIA.
Labor Market Projections
Santee-Lynches 2016 2026
Occupation Estimated
Employment
Projected
Employment
Percent
Change
Replace Growth Total Average
Salary
Legal Secretaries 38 31 -18 $ 49,925
Logging Equipment
Operators
201 170 -15 $ 31,154
Executive Secretaries and
Executive Administrative
Assistant
179 152 -15 $ 51,807
Farmworkers, Farm, Ranch,
and Aquacultural Animals
329 280 -15 $ 27,781
Data Entry Keyers 42 36 -14 $ 33,938
First-Line Supervisors of
Farming, Fishing, and
Forestry Wor
124 110 -11 $ 49,152
Floral Designers 30 27 -10 $ 32,500
Postmasters and Mail
Superintendents
12 11 -8 $ 83,230
Agricultural Equipment
Operators
152 140 -8 $ 32,429
Secretaries and
Administrative Assistants,
Except Legal, Med
1,272 1,182 -7 $ 36,874
Correctional Officers and
Jailers
672 627 -7 $ 36,126
First-Line Supervisors of
Correctional Officers
15 14 -7 $ 52,391
Payroll and Timekeeping
Clerks
60 56 -7 $ 44,076
Cutting, Punching, and
Press Machine Setters,
Operators, and
185 173 -6 $ 42,295
File Clerks 31 29 -6 $ 21,941
Chief Executives 161 151 -6 $ 165,988
Water and Wastewater
Treatment Plant and System
Operators
103 99 -4 $ 43,614
Meter Readers, Utilities 26 25 -4 $ 27,106
Advertising Sales Agents 60 58 -3 $ 35,589
Packaging and Filling
Machine Operators and
Tenders
124 120 -3 $ 30,101
Occupations are sorted by highest estimated percentage decline from estimate year to projection year.
Source: S.C. Department of Employment & Workforce - Occupational Projections
Page 25 of 28SC Department of Employment & Workforce
Page 28
Clarendon CountyCommunity Profile
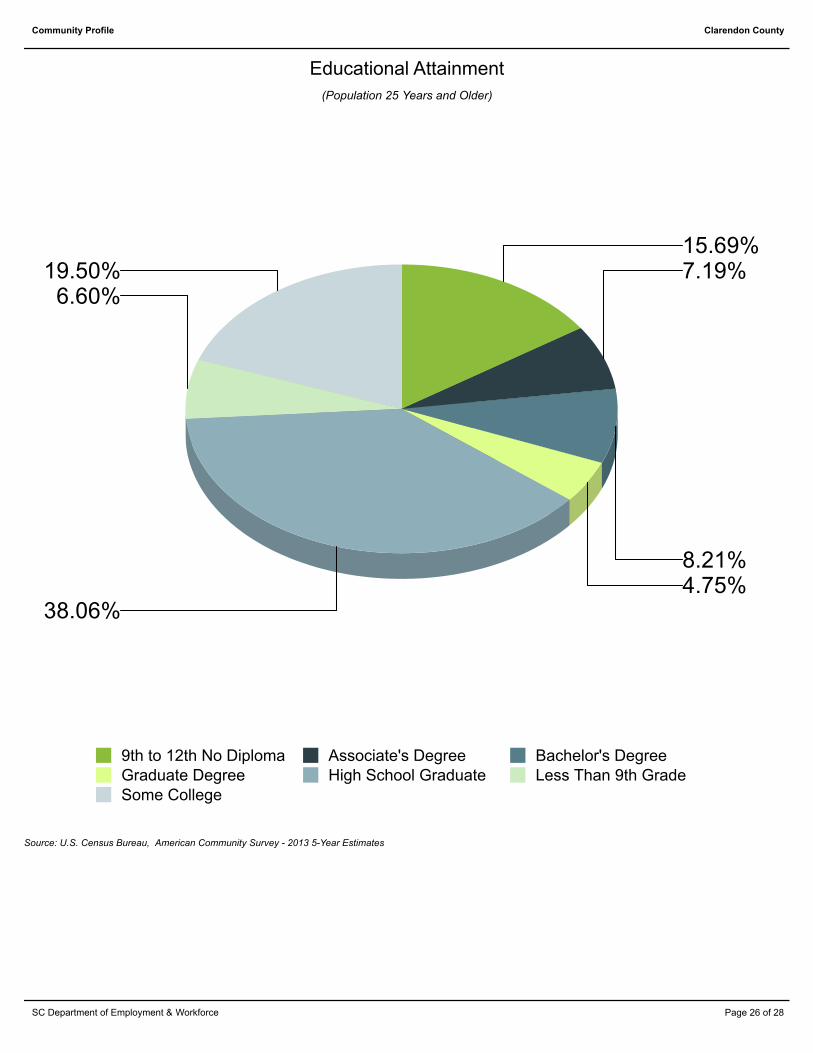
(Population 25 Years and Older)
Educational Attainment
15.69%7.19%
8.21%4.75%
38.06%
6.60%19.50%
9th to 12th No Diploma Associate's Degree Bachelor's DegreeGraduate Degree High School Graduate Less Than 9th GradeSome College
Source: U.S. Census Bureau, American Community Survey - 2013 5-Year Estimates
Page 26 of 28SC Department of Employment & Workforce
Page 29
Clarendon CountyCommunity Profile
(Based On Graduates From Area Schools)
Graduate Trends
Source: Institute of Education Sciences (IES), Integrated Postsecondary Education Data System
Page 27 of 28SC Department of Employment & Workforce
Page 30
Clarendon CountyCommunity Profile
Educational Institutions
Degrees Awarded:
Source: Institute of Education Sciences (IES), Integrated Postsecondary Education Data System
Page 28 of 28SC Department of Employment & Workforce