Clarica MVP Segregated Funds 2007 Semi-Annual Financial Statements | as at June 30, 2007 2007 managed by CI Investments Inc. distributed by Clarica Financial Services Inc. issued by Sun Life Assurance Company of Canada
Transcript
Clarica MVPSegregated Funds
2007 Semi-Annual Financial St atements | as at June 30, 2007
2007
managed by CI Investments Inc.distributed by Clarica Financial Services Inc. issued by Sun Life Assurance Company of Canada
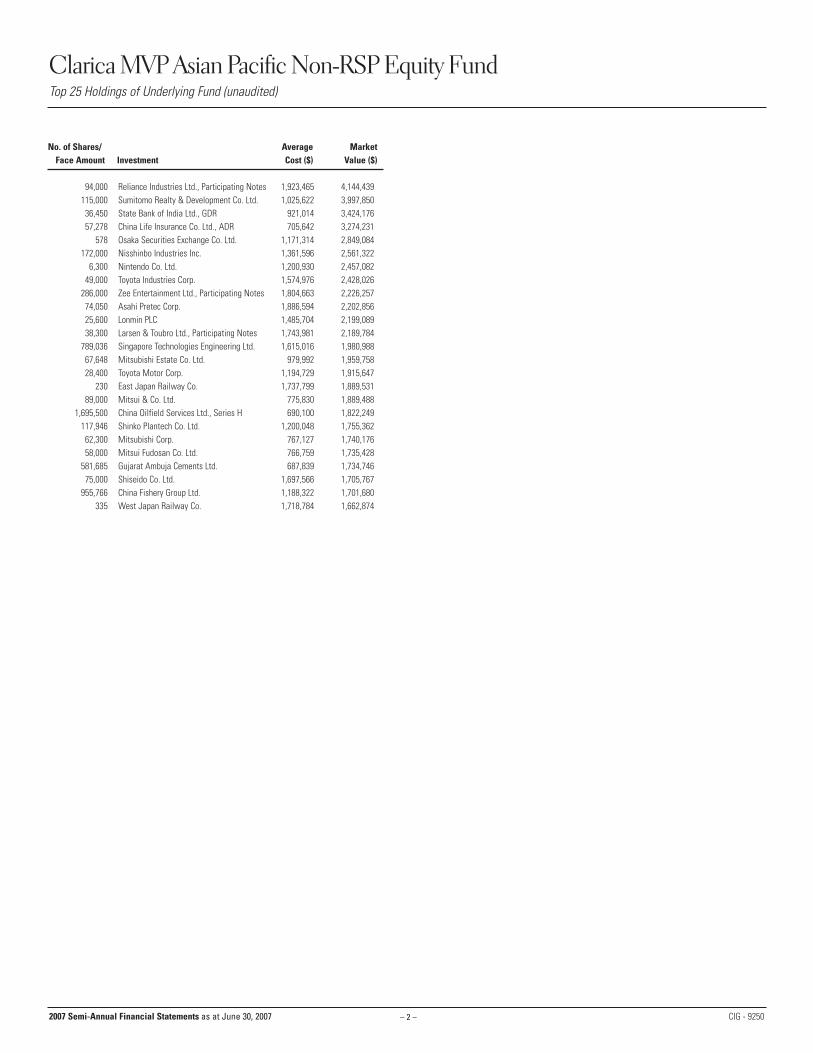
No. of Shares/ Average MarketFace Amount Investment Cost ($) Value ($)
94,000 Reliance Industries Ltd., Participating Notes 1,923,465 4,144,439 115,000 Sumitomo Realty & Development Co. Ltd. 1,025,622 3,997,850 36,450 State Bank of India Ltd., GDR 921,014 3,424,176 57,278 China Life Insurance Co. Ltd., ADR 705,642 3,274,231
955,766 China Fishery Group Ltd. 1,188,322 1,701,680 335 West Japan Railway Co. 1,718,784 1,662,874
2007 Semi-Annual Financial Statements as at June 30, 2007
Clarica MVP Asian Pacific Non-RSP Equity FundTop 25 Holdings of Underlying Fund (unaudited)
– 3 –2007 Semi-Annual Financial Statements as at June 30, 2007
Percentages shown in brackets in the Statement of Investment Portfolio relate investments at market value to total net assets of the Fund.
Statement of Investment Portfolio as at June 30, 2007 (unaudited)
No. of Average MarketUnits/Shares Investment Cost ($) Value ($)
14,599 CI Pacific Fund (Class A) 153,603 220,890
Total Investments (99.1%) 153,603 220,890
Other Assets (net) (0.9%) 1,919
Total Net Assets (100.0%) 222,809
AssetsInvestments at market valueCashReceivable for unit subscriptionsReceivable for securities soldReceivable for income distribution
and interest
LiabilitiesBank overdraftManagement fees payableAdministration fees payableFiling fees payableInsurance fees payablePayable for securities purchased Payable for unit redemptions
Net assets and unitholders’ equity
Net asset value per unit – Schedule 1
Number of units outstanding (Unit transactions – Schedule 2)
Statements of Operations for the periods ended June 30 ($000’s) (unaudited)
2007 2006
221 2182 2- -- -
- -223 220
- -- -- -- -- 1- -- -- 1
223 219
14.49 14.48
15,378 15,133
Statements of Net Assets as at June 30, 2007(unaudited) and December 31, 2006 (audited) (in $000’sexcept for per unit amounts and units outstanding)
Statements of Changes in Net Assets for the periods ended June 30 ($000’s) (unaudited)
IncomeIncome distribution from investmentsInterest
Expenses(Management expense ratios – Schedule 3)
Management feesAdministrative feesInsurance feesCustody feesLegal feesAudit feesGoods and services tax
Net income (loss) for the period
Realized and unrealized gain (loss) on investmentsRealized gain (loss) on investments (a)Capital gain distribution
from investmentsChange in unrealized appreciation (depreciation)
of investmentsNet gain (loss) on investmentsIncrease (decrease) in net assets
from operations(Increase (decrease) in net assets from operations per unit – Schedule 4)
(a) Realized gain (loss) on investmentsProceeds from sale of investmentsInvestments at cost, beginning of periodInvestments purchased
Investments at cost, end of periodCost of investments soldRealized gain (loss) on investments
2007 2006
- -- -- -
- -- -- -- -- -- -- -- -- -
3 9
- -
(2) (8)1 1
1 1
8 38148 17511 16
159 191154 162
5 293 9
Net assets, beginning of period
Capital transactionsProceeds from units issued Payments for units redeemed
Increase (decrease) in net assetsfrom operations
Net assets, end of period
2007 2006
219 228
11 15(8) (38)3 (23)
1 1223 206
Clarica MVP Asian Pacific Non-RSP Equity FundFinancial Statements
– 4 –
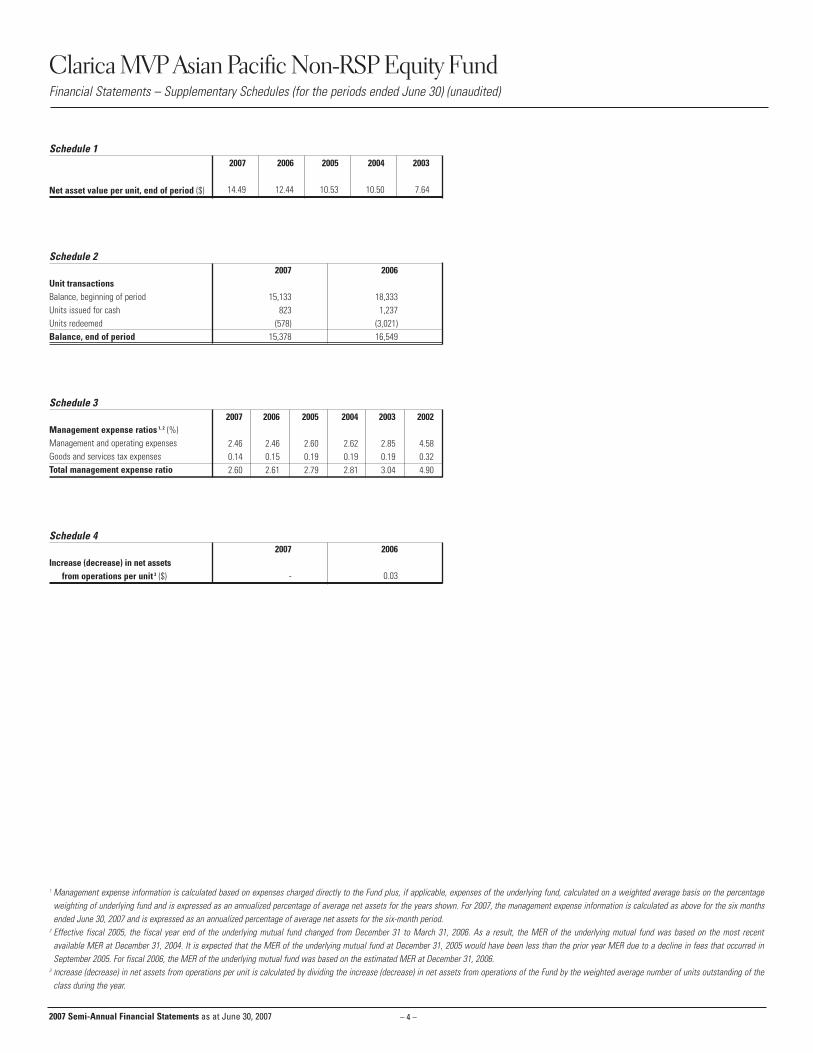
1 Management expense information is calculated based on expenses charged directly to the Fund plus, if applicable, expenses of the underlying fund, calculated on a weighted average basis on the percentageweighting of underlying fund and is expressed as an annualized percentage of average net assets for the years shown. For 2007, the management expense information is calculated as above for the six monthsended June 30, 2007 and is expressed as an annualized percentage of average net assets for the six-month period.
2 Effective fiscal 2005, the fiscal year end of the underlying mutual fund changed from December 31 to March 31, 2006. As a result, the MER of the underlying mutual fund was based on the most recent available MER at December 31, 2004. It is expected that the MER of the underlying mutual fund at December 31, 2005 would have been less than the prior year MER due to a decline in fees that occurred inSeptember 2005. For fiscal 2006, the MER of the underlying mutual fund was based on the estimated MER at December 31, 2006.
3 Increase (decrease) in net assets from operations per unit is calculated by dividing the increase (decrease) in net assets from operations of the Fund by the weighted average number of units outstanding of theclass during the year.
Clarica MVP Asian Pacific Non-RSP Equity FundFinancial Statements – Supplementary Schedules (for the periods ended June 30) (unaudited)
2007 Semi-Annual Financial Statements as at June 30, 2007
Schedule 1
Net asset value per unit, end of period ($)
Schedule 2
Unit transactions Balance, beginning of periodUnits issued for cash Units redeemedBalance, end of period
Schedule 3
Management expense ratios 1, 2 (%)Management and operating expensesGoods and services tax expensesTotal management expense ratio
Schedule 4
Increase (decrease) in net assetsfrom operations per unit 3 ($)
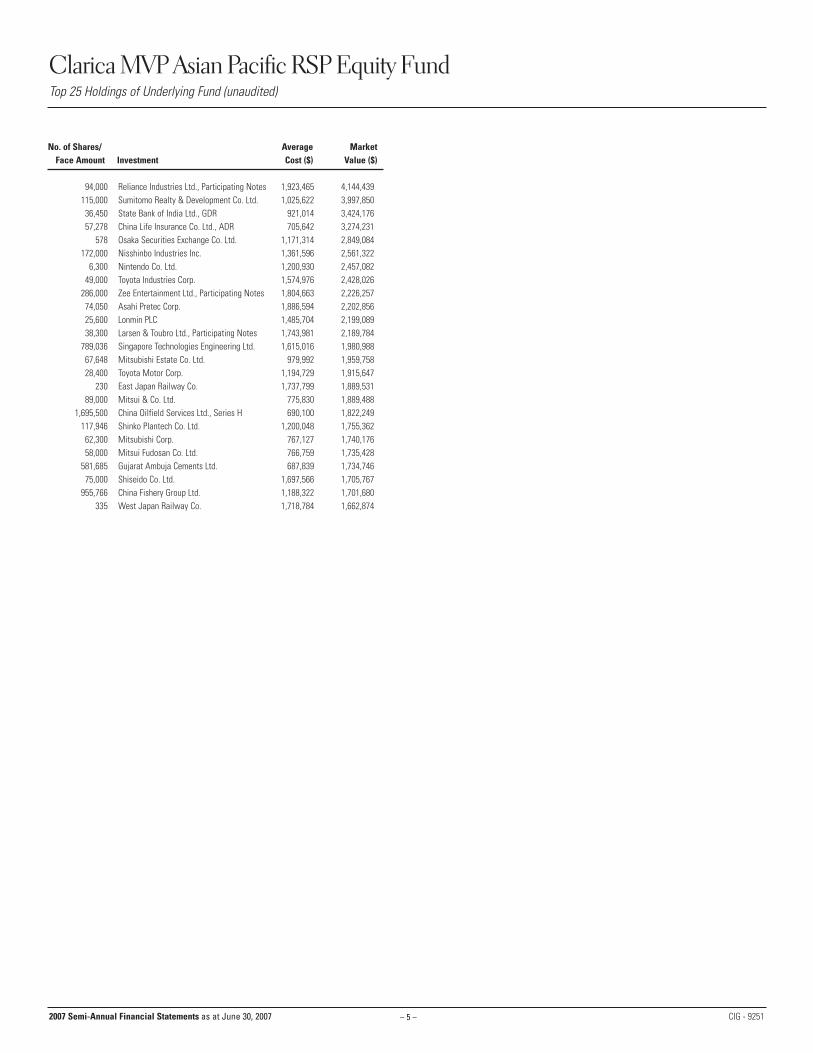
No. of Shares/ Average MarketFace Amount Investment Cost ($) Value ($)
94,000 Reliance Industries Ltd., Participating Notes 1,923,465 4,144,439 115,000 Sumitomo Realty & Development Co. Ltd. 1,025,622 3,997,850 36,450 State Bank of India Ltd., GDR 921,014 3,424,176 57,278 China Life Insurance Co. Ltd., ADR 705,642 3,274,231
955,766 China Fishery Group Ltd. 1,188,322 1,701,680 335 West Japan Railway Co. 1,718,784 1,662,874
2007 Semi-Annual Financial Statements as at June 30, 2007
Clarica MVP Asian Pacific RSP Equity FundTop 25 Holdings of Underlying Fund (unaudited)
– 6 –2007 Semi-Annual Financial Statements as at June 30, 2007
Percentages shown in brackets in the Statement of Investment Portfolio relate investments at market value to total net assets of the Fund.
Statement of Investment Portfolio as at June 30, 2007 (unaudited)
No. of Average MarketUnits/Shares Investment Cost ($) Value ($)
197,446 CI Pacific Fund (Class A) 1,906,794 2,987,363
Total Investments (99.8%) 1,906,794 2,987,363
Other Assets (net) (0.2%) 6,352
Total Net Assets (100.0%) 2,993,715
AssetsInvestments at market valueCashReceivable for unit subscriptionsReceivable for securities soldReceivable for income distribution
and interest
LiabilitiesBank overdraftManagement fees payableAdministration fees payableFiling fees payableInsurance fees payablePayable for securities purchased Payable for unit redemptions
Net assets and unitholders’ equity
Net asset value per unit – Schedule 1
Number of units outstanding (Unit transactions – Schedule 2)
Statements of Operations for the periods ended June 30 ($000’s) (unaudited)
2007 2006
2,987 3,1868 4- -- 4
- -2,995 3,194
- -- -- -- -- 1- -1 -1 1
2,994 3,193
15.55 15.54
192,508 205,555
Statements of Net Assets as at June 30, 2007(unaudited) and December 31, 2006 (audited) (in $000’sexcept for per unit amounts and units outstanding)
Statements of Changes in Net Assets for the periods ended June 30 ($000’s) (unaudited)
IncomeIncome distribution from investmentsInterest
Expenses(Management expense ratios – Schedule 3)
Management feesAdministrative feesInsurance feesCustody feesLegal feesAudit feesGoods and services tax
Net income (loss) for the period
Realized and unrealized gain (loss) on investmentsRealized gain (loss) on investments (a)Capital gain distribution
from investmentsChange in unrealized appreciation (depreciation)
of investmentsNet gain (loss) on investmentsIncrease (decrease) in net assets
from operations(Increase (decrease) in net assets from operations per unit – Schedule 4)
(a) Realized gain (loss) on investmentsProceeds from sale of investmentsInvestments at cost, beginning of periodInvestments purchased
Investments at cost, end of periodCost of investments soldRealized gain (loss) on investments
2007 2006
- -- -- -
- -1 13 3- -- -- -- -4 4(4) (4)
160 108
- -
(149) (98)11 10
7 6
420 3261,957 2,049
210 2452,167 2,2941,907 2,076
260 218160 108
Net assets, beginning of period
Capital transactionsProceeds from units issued Payments for units redeemed
Increase (decrease) in net assetsfrom operations
Net assets, end of period
2007 2006
3,193 3,007
246 303(452) (380)(206) (77)
7 62,994 2,936
Clarica MVP Asian Pacific RSP Equity FundFinancial Statements
– 7 –
1 Management expense information is calculated based on expenses charged directly to the Fund plus, if applicable, expenses of the underlying fund, calculated on a weighted average basis on the percentageweighting of underlying fund and is expressed as an annualized percentage of average net assets for the years shown. For 2007, the management expense information is calculated as above for the six monthsended June 30, 2007 and is expressed as an annualized percentage of average net assets for the six-month period.
2 Effective fiscal 2005, the fiscal year end of the underlying mutual fund changed from December 31 to March 31, 2006. As a result, the MER of the underlying mutual fund was based on the most recent available MER at December 31, 2004. It is expected that the MER of the underlying mutual fund at December 31, 2005 would have been less than the prior year MER due to a decline in fees that occurred inSeptember 2005. For fiscal 2006, the MER of the underlying mutual fund was based on the estimated MER at December 31, 2006.
3 Increase (decrease) in net assets from operations per unit is calculated by dividing the increase (decrease) in net assets from operations of the Fund by the weighted average number of units outstanding of theclass during the year.
Clarica MVP Asian Pacific RSP Equity FundFinancial Statements – Supplementary Schedules (for the periods ended June 30) (unaudited)
2007 Semi-Annual Financial Statements as at June 30, 2007
Schedule 1
Net asset value per unit, end of period ($)
Schedule 2
Unit transactions Balance, beginning of periodUnits issued for cash Units redeemedBalance, end of period
Schedule 3
Management expense ratios 1, 2 (%)Management and operating expensesGoods and services tax expensesTotal management expense ratio
Schedule 4
Increase (decrease) in net assetsfrom operations per unit 3 ($)
No. of Shares/ Average MarketFace Amount Investment Cost ($) Value ($)
1,266,100 Royal Bank of Canada 58,258,722 71,686,582 671,800 Toronto-Dominion Bank 42,508,865 48,947,348 697,100 EnCana Corp. 39,862,595 45,673,992
1,061,100 Manulife Financial Corp. 36,496,396 42,274,224 685,800 Petro-Canada 33,223,550 38,919,150 832,250 Rogers Communications Inc., Class B 19,665,474 37,800,795 638,900 Bank of Nova Scotia 30,704,337 33,152,521 326,800 Suncor Energy Inc. 26,903,455 31,359,728 578,200 Canadian National Railway Co. 28,284,629 31,338,440 564,700 Teck Cominco Ltd., Class B 18,259,896 25,524,440 380,400 TELUS Corp. 18,821,203 24,258,108 562,900 Addax Petroleum Corp. 14,745,338 22,425,936 740,600 Finning International Inc. 15,009,057 22,425,368 210,200 Canadian Imperial Bank of Commerce 18,307,342 20,177,098 93,100 Research In Motion Ltd. 8,185,409 19,960,640
530,100 Gildan Activewear Inc. 12,151,475 19,279,737 567,500 Nexen Inc. 17,657,016 18,727,500 375,500 Shoppers Drug Mart Corp. 15,834,875 18,527,170 219,400 Canadian Tire Corp. Ltd., Class A,
Non-Voting Shares 14,871,004 18,440,570 211,600 Alcan Inc. 12,888,709 18,388,040 286,900 Imperial Oil Ltd. 12,255,394 14,227,371 168,500 Inmet Mining Corp. 9,781,295 13,884,400 670,500 Talisman Energy Inc. 13,707,104 13,812,300 341,000 BCE Inc. 13,447,471 13,755,940 140,100 Niko Resources Ltd. 7,896,258 13,589,700
2007 Semi-Annual Financial Statements as at June 30, 2007
Clarica MVP Equity FundTop 25 Holdings of Underlying Fund (unaudited)
– 9 –2007 Semi-Annual Financial Statements as at June 30, 2007
Percentages shown in brackets in the Statement of Investment Portfolio relate investments at market value to total net assets of the Fund.
Statement of Investment Portfolio as at June 30, 2007 (unaudited)
No. of Average MarketUnits/Shares Investment Cost ($) Value ($)
3,916,843 Synergy Canadian Corporate Class (Series A) 38,096,428 61,611,945
Total Investments (99.6%) 38,096,428 61,611,945
Other Assets (net) (0.4%) 278,364
Total Net Assets (100.0%) 61,890,309
AssetsInvestments at market valueCashReceivable for unit subscriptionsReceivable for securities soldReceivable for income distribution
and interest
LiabilitiesBank overdraftManagement fees payableAdministration fees payableFiling fees payableInsurance fees payablePayable for securities purchased Payable for unit redemptions
Net assets and unitholders’ equity
Net asset value per unit – Schedule 1
Number of units outstanding (Unit transactions – Schedule 2)
Statements of Operations for the periods ended June 30 ($000’s) (unaudited)
2007 2006
61,612 62,337294 288
- 110 26
- -61,916 62,652
- -- -2 2- -
11 10- -
13 2126 33
61,890 62,619
42.50 40.02
1,456,274 1,564,742
Statements of Net Assets as at June 30, 2007(unaudited) and December 31, 2006 (audited) (in $000’sexcept for per unit amounts and units outstanding)
Statements of Changes in Net Assets for the periods ended June 30 ($000’s) (unaudited)
IncomeIncome distribution from investmentsInterest
Expenses(Management expense ratios – Schedule 3)
Management feesAdministrative feesInsurance feesCustody feesLegal feesAudit feesGoods and services tax
Net income (loss) for the period
Realized and unrealized gain (loss) on investmentsRealized gain (loss) on investments (a)Capital gain distribution
from investmentsChange in unrealized appreciation (depreciation)
of investmentsNet gain (loss) on investmentsIncrease (decrease) in net assets
from operations(Increase (decrease) in net assets from operations per unit – Schedule 4)
(a) Realized gain (loss) on investmentsProceeds from sale of investmentsInvestments at cost, beginning of periodInvestments purchased
Investments at cost, end of periodCost of investments soldRealized gain (loss) on investments
Capital transactionsProceeds from units issued Payments for units redeemed
Increase (decrease) in net assetsfrom operations
Net assets, end of period
2007 2006
62,619 61,338
957 1,293(5,456) (7,155)(4,499) (5,862)
3,770 2,85261,890 58,328
Clarica MVP Equity FundFinancial Statements
– 10 –
1 Management expense information is calculated based on expenses charged directly to the Fund plus, if applicable, expenses of the underlying fund, calculated on a weighted average basis on the percentageweighting of underlying fund and is expressed as an annualized percentage of average net assets for the years shown. For 2007, the management expense information is calculated as above for the six monthsended June 30, 2007 and is expressed as an annualized percentage of average net assets for the six-month period.
2 Effective fiscal 2005, the fiscal year end of the underlying mutual fund changed from December 31 to March 31, 2006. As a result, the MER of the underlying mutual fund was based on the most recent available MER at December 31, 2004. It is expected that the MER of the underlying mutual fund at December 31, 2005 would have been less than the prior year MER due to a decline in fees that occurred inSeptember 2005. For fiscal 2006, the MER of the underlying mutual fund was based on the estimated MER at December 31, 2006.
3 Increase (decrease) in net assets from operations per unit is calculated by dividing the increase (decrease) in net assets from operations of the Fund by the weighted average number of units outstanding of theclass during the year.
Clarica MVP Equity FundFinancial Statements – Supplementary Schedules (for the periods ended June 30) (unaudited)
2007 Semi-Annual Financial Statements as at June 30, 2007
Schedule 1
Net asset value per unit, end of period ($)
Schedule 2
Unit transactions Balance, beginning of periodUnits issued for cash Units redeemedBalance, end of period
Schedule 3
Management expense ratios 1, 2 (%)Management and operating expensesGoods and services tax expensesTotal management expense ratio
Schedule 4
Increase (decrease) in net assetsfrom operations per unit 3 ($)
No. of Shares/ Average MarketFace Amount Investment Cost ($) Value ($)
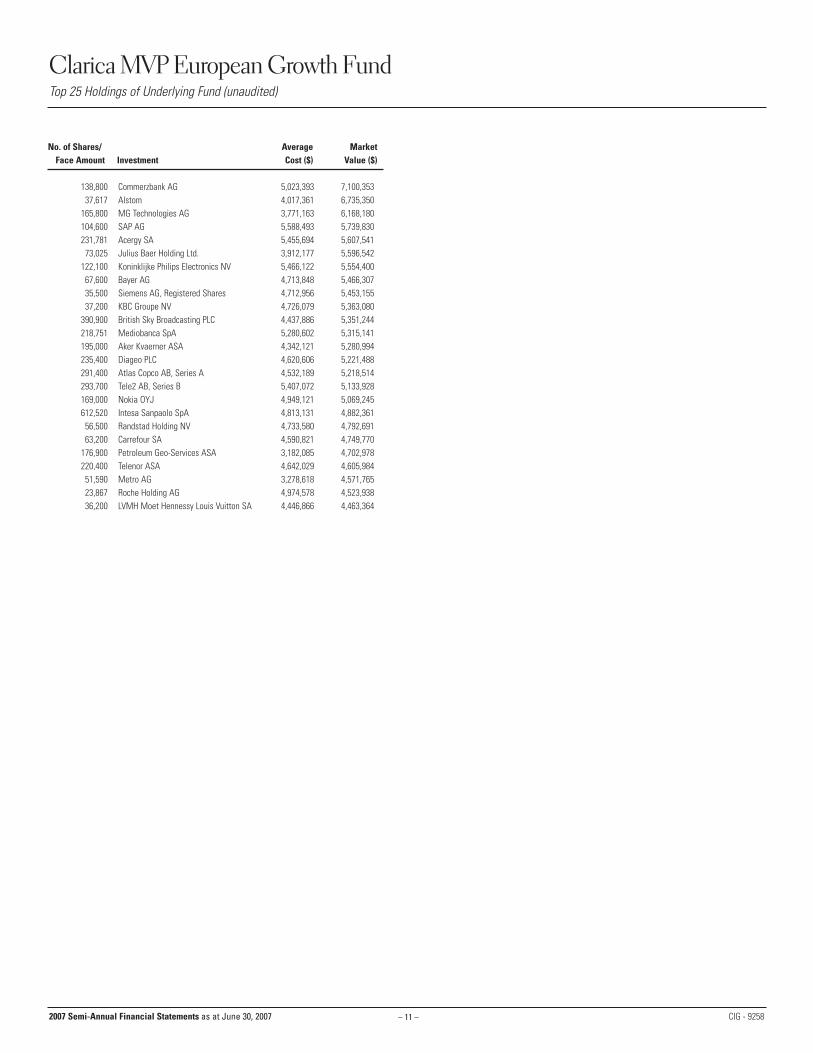
138,800 Commerzbank AG 5,023,393 7,100,353 37,617 Alstom 4,017,361 6,735,350
165,800 MG Technologies AG 3,771,163 6,168,180 104,600 SAP AG 5,588,493 5,739,830 231,781 Acergy SA 5,455,694 5,607,541 73,025 Julius Baer Holding Ltd. 3,912,177 5,596,542
390,900 British Sky Broadcasting PLC 4,437,886 5,351,244 218,751 Mediobanca SpA 5,280,602 5,315,141 195,000 Aker Kvaerner ASA 4,342,121 5,280,994 235,400 Diageo PLC 4,620,606 5,221,488 291,400 Atlas Copco AB, Series A 4,532,189 5,218,514 293,700 Tele2 AB, Series B 5,407,072 5,133,928 169,000 Nokia OYJ 4,949,121 5,069,245 612,520 Intesa Sanpaolo SpA 4,813,131 4,882,361 56,500 Randstad Holding NV 4,733,580 4,792,691 63,200 Carrefour SA 4,590,821 4,749,770
176,900 Petroleum Geo-Services ASA 3,182,085 4,702,978 220,400 Telenor ASA 4,642,029 4,605,984 51,590 Metro AG 3,278,618 4,571,765 23,867 Roche Holding AG 4,974,578 4,523,938 36,200 LVMH Moet Hennessy Louis Vuitton SA 4,446,866 4,463,364
2007 Semi-Annual Financial Statements as at June 30, 2007
Clarica MVP European Growth FundTop 25 Holdings of Underlying Fund (unaudited)
– 12 –2007 Semi-Annual Financial Statements as at June 30, 2007
Percentages shown in brackets in the Statement of Investment Portfolio relate investments at market value to total net assets of the Fund.
Statement of Investment Portfolio as at June 30, 2007 (unaudited)
No. of Average MarketUnits/Shares Investment Cost ($) Value ($)
362,141 CI European Fund (Class A) 3,114,802 4,200,832
Total Investments (99.8%) 3,114,802 4,200,832
Other Assets (net) (0.2%) 9,058
Total Net Assets (100.0%) 4,209,890
AssetsInvestments at market valueCashReceivable for unit subscriptionsReceivable for securities soldReceivable for income distribution
and interest
LiabilitiesBank overdraftManagement fees payableAdministration fees payableFiling fees payableInsurance fees payablePayable for securities purchased Payable for unit redemptions
Net assets and unitholders’ equity
Net asset value per unit – Schedule 1
Number of units outstanding (Unit transactions – Schedule 2)
Statements of Operations for the periods ended June 30 ($000’s) (unaudited)
2007 2006
4,201 3,60814 15
- 74 2
- -4,219 3,632
- -2 1- -- -1 1- -6 -9 2
4,210 3,630
14.93 14.50
282,067 250,304
Statements of Net Assets as at June 30, 2007(unaudited) and December 31, 2006 (audited) (in $000’sexcept for per unit amounts and units outstanding)
Statements of Changes in Net Assets for the periods ended June 30 ($000’s) (unaudited)
IncomeIncome distribution from investmentsInterest
Expenses(Management expense ratios – Schedule 3)
Management feesAdministrative feesInsurance feesCustody feesLegal feesAudit feesGoods and services tax
Net income (loss) for the period
Realized and unrealized gain (loss) on investmentsRealized gain (loss) on investments (a)Capital gain distribution
from investmentsChange in unrealized appreciation (depreciation)
of investmentsNet gain (loss) on investmentsIncrease (decrease) in net assets
from operations(Increase (decrease) in net assets from operations per unit – Schedule 4)
(a) Realized gain (loss) on investmentsProceeds from sale of investmentsInvestments at cost, beginning of periodInvestments purchased
Investments at cost, end of periodCost of investments soldRealized gain (loss) on investments
2007 2006
- -1 -1 -
10 71 14 3- -- -- -1 1
16 12(15) (12)
99 59
- -
23 139122 198
107 186
353 2472,545 2,190
824 1783,369 2,3683,115 2,180
254 18899 59
Net assets, beginning of period
Capital transactionsProceeds from units issued Payments for units redeemed
Increase (decrease) in net assetsfrom operations
Net assets, end of period
2007 2006
3,630 2,727
848 226(375) (285)473 (59)
107 1864,210 2,854
Clarica MVP European Growth FundFinancial Statements
– 13 –
1 Management expense information is calculated based on expenses charged directly to the Fund plus, if applicable, expenses of the underlying fund, calculated on a weighted average basis on the percentageweighting of underlying fund and is expressed as an annualized percentage of average net assets for the years shown. For 2007, the management expense information is calculated as above for the six monthsended June 30, 2007 and is expressed as an annualized percentage of average net assets for the six-month period.
2 Effective fiscal 2005, the fiscal year end of the underlying mutual fund changed from December 31 to March 31, 2006. As a result, the MER of the underlying mutual fund was based on the most recent available MER at December 31, 2004. It is expected that the MER of the underlying mutual fund at December 31, 2005 would have been less than the prior year MER due to a decline in fees that occurred inSeptember 2005. For fiscal 2006, the MER of the underlying mutual fund was based on the estimated MER at December 31, 2006.
3 Increase (decrease) in net assets from operations per unit is calculated by dividing the increase (decrease) in net assets from operations of the Fund by the weighted average number of units outstanding of theclass during the year.
Clarica MVP European Growth FundFinancial Statements – Supplementary Schedules (for the periods ended June 30) (unaudited)
2007 Semi-Annual Financial Statements as at June 30, 2007
Schedule 1
Net asset value per unit, end of period ($)
Schedule 2
Unit transactions Balance, beginning of periodUnits issued for cash Units redeemedBalance, end of period
Schedule 3
Management expense ratios 1, 2 (%)Management and operating expensesGoods and services tax expensesTotal management expense ratio
Schedule 4
Increase (decrease) in net assetsfrom operations per unit 3 ($)
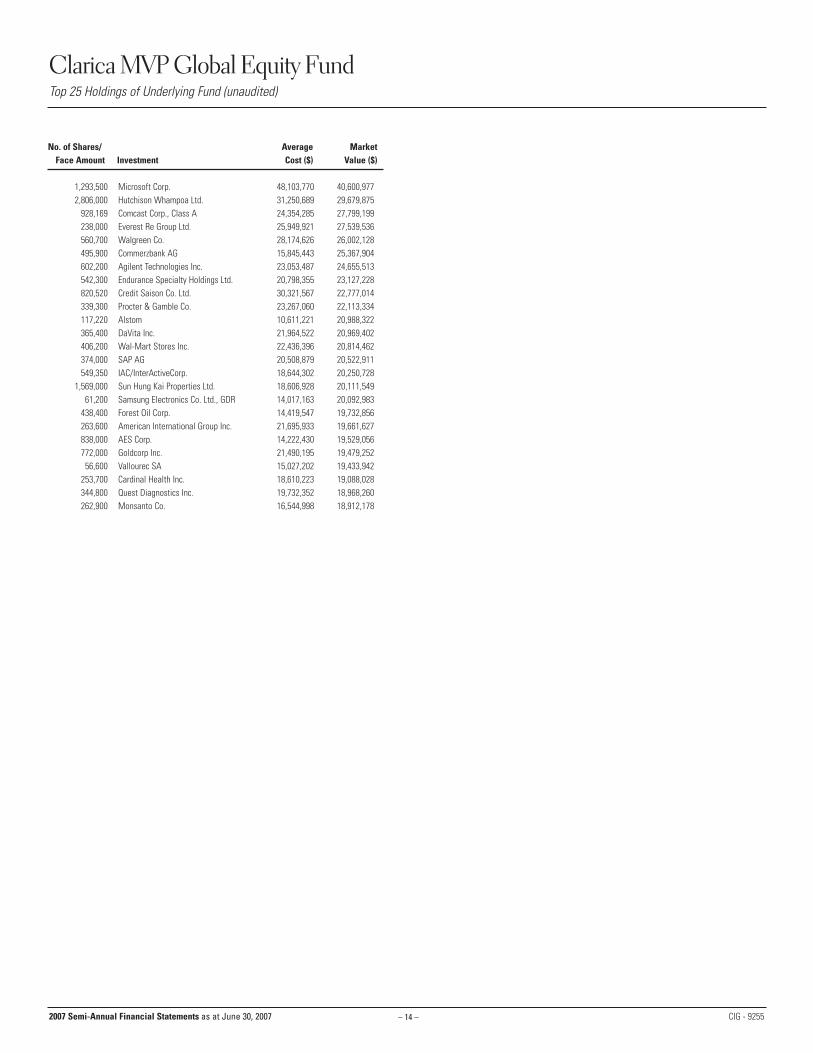
928,169 Comcast Corp., Class A 24,354,285 27,799,199 238,000 Everest Re Group Ltd. 25,949,921 27,539,536 560,700 Walgreen Co. 28,174,626 26,002,128 495,900 Commerzbank AG 15,845,443 25,367,904 602,200 Agilent Technologies Inc. 23,053,487 24,655,513 542,300 Endurance Specialty Holdings Ltd. 20,798,355 23,127,228 820,520 Credit Saison Co. Ltd. 30,321,567 22,777,014 339,300 Procter & Gamble Co. 23,267,060 22,113,334 117,220 Alstom 10,611,221 20,988,322 365,400 DaVita Inc. 21,964,522 20,969,402 406,200 Wal-Mart Stores Inc. 22,436,396 20,814,462 374,000 SAP AG 20,508,879 20,522,911 549,350 IAC/InterActiveCorp. 18,644,302 20,250,728
1,569,000 Sun Hung Kai Properties Ltd. 18,606,928 20,111,549 61,200 Samsung Electronics Co. Ltd., GDR 14,017,163 20,092,983
438,400 Forest Oil Corp. 14,419,547 19,732,856 263,600 American International Group Inc. 21,695,933 19,661,627 838,000 AES Corp. 14,222,430 19,529,056 772,000 Goldcorp Inc. 21,490,195 19,479,252 56,600 Vallourec SA 15,027,202 19,433,942
253,700 Cardinal Health Inc. 18,610,223 19,088,028 344,800 Quest Diagnostics Inc. 19,732,352 18,968,260 262,900 Monsanto Co. 16,544,998 18,912,178
2007 Semi-Annual Financial Statements as at June 30, 2007
Clarica MVP Global Equity Fund Top 25 Holdings of Underlying Fund (unaudited)
– 15 –2007 Semi-Annual Financial Statements as at June 30, 2007
Percentages shown in brackets in the Statement of Investment Portfolio relate investments at market value to total net assets of the Fund.
Statement of Investment Portfolio as at June 30, 2007 (unaudited)
No. of Average MarketUnits/Shares Investment Cost ($) Value ($)
311,774 CI Global Fund (Class A) 3,380,618 4,551,897
Total Investments (99.7%) 3,380,618 4,551,897
Other Assets (net) (0.3%) 12,799
Total Net Assets (100.0%) 4,564,696
AssetsInvestments at market valueCashReceivable for unit subscriptionsReceivable for securities soldReceivable for income distribution
and interest
LiabilitiesBank overdraftManagement fees payableAdministration fees payableFiling fees payableInsurance fees payablePayable for securities purchased Payable for unit redemptions
Net assets and unitholders’ equity
Net asset value per unit – Schedule 1
Number of units outstanding (Unit transactions – Schedule 2)
Statements of Operations for the periods ended June 30 ($000’s) (unaudited)
2007 2006
4,552 4,77912 11
- 12 7
- -4,566 4,798
- -- -- -- -1 1- -- 51 6
4,565 4,792
15.60 15.86
292,702 302,120
Statements of Net Assets as at June 30, 2007(unaudited) and December 31, 2006 (audited) (in $000’sexcept for per unit amounts and units outstanding)
Statements of Changes in Net Assets for the periods ended June 30 ($000’s) (unaudited)
IncomeIncome distribution from investmentsInterest
Expenses(Management expense ratios – Schedule 3)
Management feesAdministrative feesInsurance feesCustody feesLegal feesAudit feesGoods and services tax
Net income (loss) for the period
Realized and unrealized gain (loss) on investmentsRealized gain (loss) on investments (a)Capital gain distribution
from investmentsChange in unrealized appreciation (depreciation)
of investmentsNet gain (loss) on investmentsIncrease (decrease) in net assets
from operations(Increase (decrease) in net assets from operations per unit – Schedule 4)
(a) Realized gain (loss) on investmentsProceeds from sale of investmentsInvestments at cost, beginning of periodInvestments purchased
Investments at cost, end of periodCost of investments soldRealized gain (loss) on investments
2007 2006
- -- -- -
- -1 15 5- -- -- -- -6 6(6) (6)
112 75
- -
(183) (78)(71) (3)
(77) (9)
397 3833,425 3,706
241 1513,666 3,8573,381 3,549
285 308112 75
Net assets, beginning of period
Capital transactionsProceeds from units issued Payments for units redeemed
Increase (decrease) in net assetsfrom operations
Net assets, end of period
2007 2006
4,792 4,508
400 280(550) (512)(150) (232)
(77) (9)4,565 4,267
Clarica MVP Global Equity Fund Financial Statements
– 16 –
1 Management expense information is calculated based on expenses charged directly to the Fund plus, if applicable, expenses of the underlying fund, calculated on a weighted average basis on the percentageweighting of underlying fund and is expressed as an annualized percentage of average net assets for the years shown. For 2007, the management expense information is calculated as above for the six monthsended June 30, 2007 and is expressed as an annualized percentage of average net assets for the six-month period.
2 Effective fiscal 2005, the fiscal year end of the underlying mutual fund changed from December 31 to March 31, 2006. As a result, the MER of the underlying mutual fund was based on the most recent available MER at December 31, 2004. It is expected that the MER of the underlying mutual fund at December 31, 2005 would have been less than the prior year MER due to a decline in fees that occurred inSeptember 2005. For fiscal 2006, the MER of the underlying mutual fund was based on the estimated MER at December 31, 2006.
3 Increase (decrease) in net assets from operations per unit is calculated by dividing the increase (decrease) in net assets from operations of the Fund by the weighted average number of units outstanding of theclass during the year.
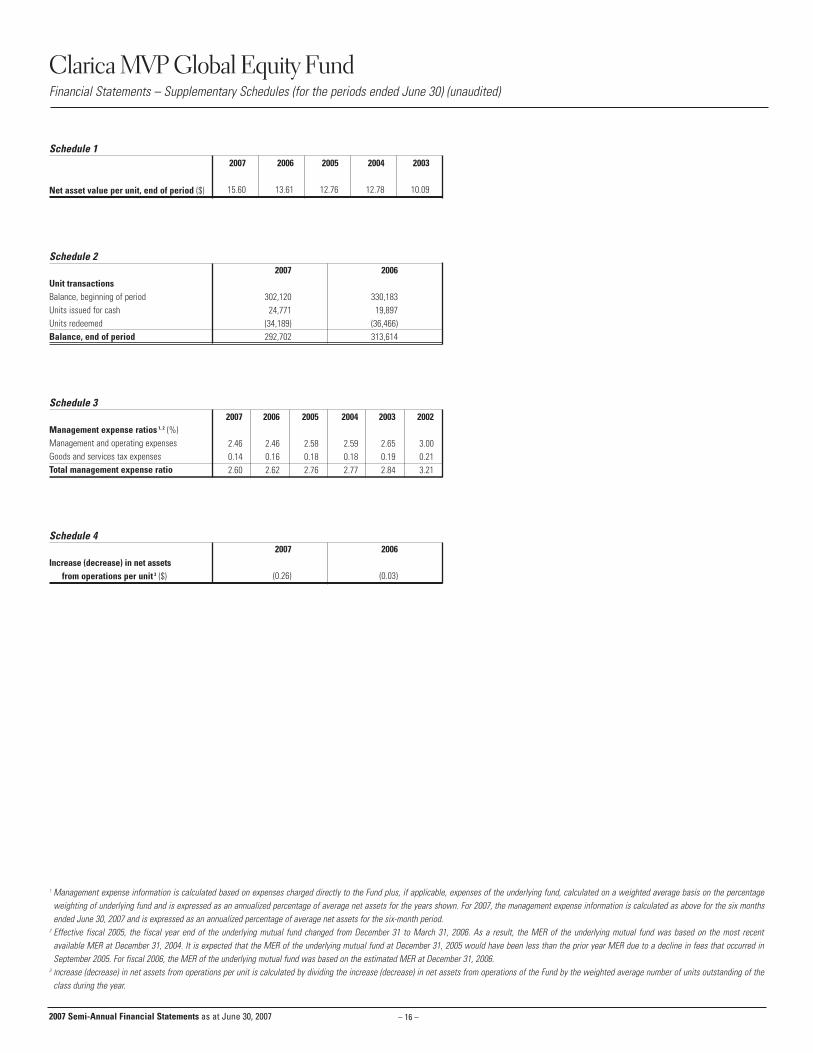
Clarica MVP Global Equity Fund Financial Statements – Supplementary Schedules (for the periods ended June 30) (unaudited)
2007 Semi-Annual Financial Statements as at June 30, 2007
Schedule 1
Net asset value per unit, end of period ($)
Schedule 2
Unit transactions Balance, beginning of periodUnits issued for cash Units redeemedBalance, end of period
Schedule 3
Management expense ratios 1, 2 (%)Management and operating expensesGoods and services tax expensesTotal management expense ratio
Schedule 4
Increase (decrease) in net assetsfrom operations per unit 3 ($)
No. of Shares/ Average MarketFace Amount Investment Cost ($) Value ($)
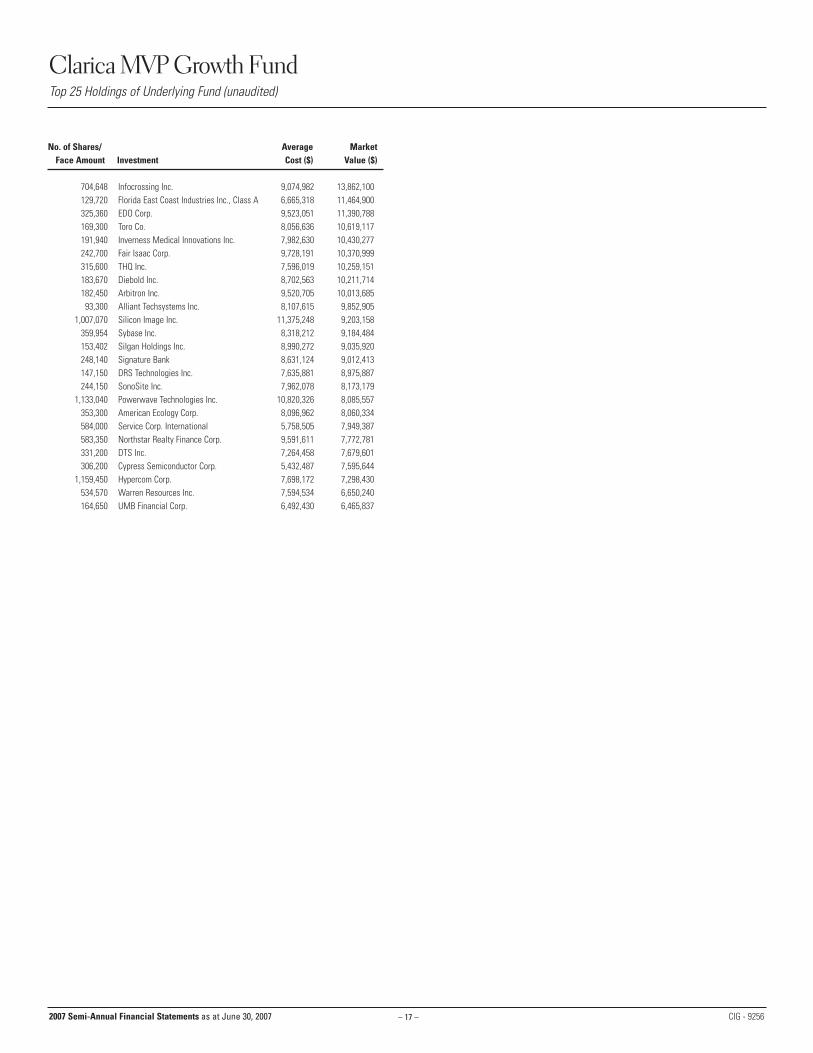
704,648 Infocrossing Inc. 9,074,982 13,862,100 129,720 Florida East Coast Industries Inc., Class A 6,665,318 11,464,900 325,360 EDO Corp. 9,523,051 11,390,788 169,300 Toro Co. 8,056,636 10,619,117 191,940 Inverness Medical Innovations Inc. 7,982,630 10,430,277 242,700 Fair Isaac Corp. 9,728,191 10,370,999 315,600 THQ Inc. 7,596,019 10,259,151 183,670 Diebold Inc. 8,702,563 10,211,714 182,450 Arbitron Inc. 9,520,705 10,013,685 93,300 Alliant Techsystems Inc. 8,107,615 9,852,905
1,007,070 Silicon Image Inc. 11,375,248 9,203,158 359,954 Sybase Inc. 8,318,212 9,184,484 153,402 Silgan Holdings Inc. 8,990,272 9,035,920 248,140 Signature Bank 8,631,124 9,012,413 147,150 DRS Technologies Inc. 7,635,881 8,975,887 244,150 SonoSite Inc. 7,962,078 8,173,179
1,133,040 Powerwave Technologies Inc. 10,820,326 8,085,557 353,300 American Ecology Corp. 8,096,962 8,060,334 584,000 Service Corp. International 5,758,505 7,949,387 583,350 Northstar Realty Finance Corp. 9,591,611 7,772,781 331,200 DTS Inc. 7,264,458 7,679,601 306,200 Cypress Semiconductor Corp. 5,432,487 7,595,644
Capital transactionsProceeds from units issued Payments for units redeemed
Increase (decrease) in net assetsfrom operations
Net assets, end of period
2007 2006
106,390 114,112
1,010 1,440(9,871) (14,177)(8,861) (12,737)
1,265 53498,794 101,909
Clarica MVP Growth FundFinancial Statements
– 19 –
1 Management expense information is calculated based on expenses charged directly to the Fund plus, if applicable, expenses of the underlying fund, calculated on a weighted average basis on the percentageweighting of underlying fund and is expressed as an annualized percentage of average net assets for the years shown. For 2007, the management expense information is calculated as above for the six monthsended June 30, 2007 and is expressed as an annualized percentage of average net assets for the six-month period.
2 Effective fiscal 2005, the fiscal year end of the underlying mutual fund changed from December 31 to March 31, 2006. As a result, the MER of the underlying mutual fund was based on the most recent available MER at December 31, 2004. It is expected that the MER of the underlying mutual fund at December 31, 2005 would have been less than the prior year MER due to a decline in fees that occurred inSeptember 2005. For fiscal 2006, the MER of the underlying mutual fund was based on the estimated MER at December 31, 2006.
3 Increase (decrease) in net assets from operations per unit is calculated by dividing the increase (decrease) in net assets from operations of the Fund by the weighted average number of units outstanding of theclass during the year.
Clarica MVP Growth FundFinancial Statements – Supplementary Schedules (for the periods ended June 30) (unaudited)
2007 Semi-Annual Financial Statements as at June 30, 2007
Schedule 1
Net asset value per unit, end of period ($)
Schedule 2
Unit transactions Balance, beginning of periodUnits issued for cash Units redeemedBalance, end of period
Schedule 3
Management expense ratios 1, 2 (%)Management and operating expensesGoods and services tax expensesTotal management expense ratio
Schedule 4
Increase (decrease) in net assetsfrom operations per unit 3 ($)
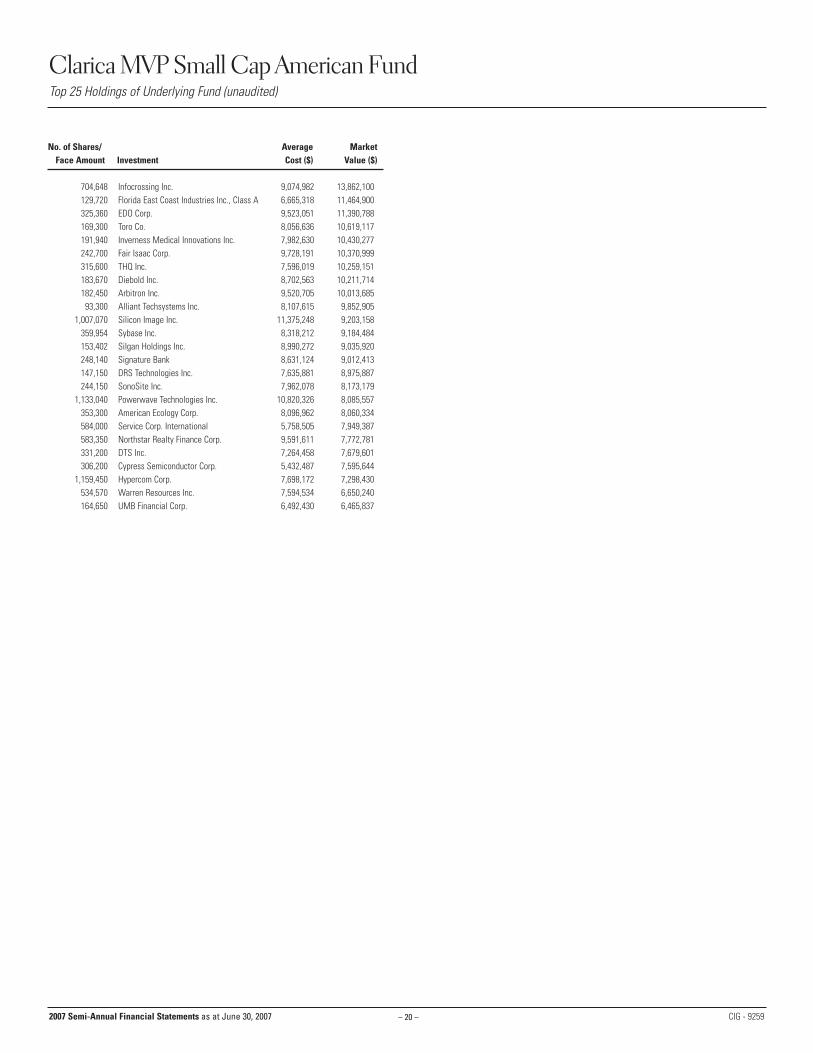
No. of Shares/ Average MarketFace Amount Investment Cost ($) Value ($)
704,648 Infocrossing Inc. 9,074,982 13,862,100 129,720 Florida East Coast Industries Inc., Class A 6,665,318 11,464,900 325,360 EDO Corp. 9,523,051 11,390,788 169,300 Toro Co. 8,056,636 10,619,117 191,940 Inverness Medical Innovations Inc. 7,982,630 10,430,277 242,700 Fair Isaac Corp. 9,728,191 10,370,999 315,600 THQ Inc. 7,596,019 10,259,151 183,670 Diebold Inc. 8,702,563 10,211,714 182,450 Arbitron Inc. 9,520,705 10,013,685 93,300 Alliant Techsystems Inc. 8,107,615 9,852,905
1,007,070 Silicon Image Inc. 11,375,248 9,203,158 359,954 Sybase Inc. 8,318,212 9,184,484 153,402 Silgan Holdings Inc. 8,990,272 9,035,920 248,140 Signature Bank 8,631,124 9,012,413 147,150 DRS Technologies Inc. 7,635,881 8,975,887 244,150 SonoSite Inc. 7,962,078 8,173,179
1,133,040 Powerwave Technologies Inc. 10,820,326 8,085,557 353,300 American Ecology Corp. 8,096,962 8,060,334 584,000 Service Corp. International 5,758,505 7,949,387 583,350 Northstar Realty Finance Corp. 9,591,611 7,772,781 331,200 DTS Inc. 7,264,458 7,679,601 306,200 Cypress Semiconductor Corp. 5,432,487 7,595,644
2007 Semi-Annual Financial Statements as at June 30, 2007
Clarica MVP Small Cap American FundTop 25 Holdings of Underlying Fund (unaudited)
– 21 –2007 Semi-Annual Financial Statements as at June 30, 2007
Percentages shown in brackets in the Statement of Investment Portfolio relate investments at market value to total net assets of the Fund.
Statement of Investment Portfolio as at June 30, 2007 (unaudited)
No. of Average MarketUnits/Shares Investment Cost ($) Value ($)
113,529 CI American Small Companies Fund (Class A) 2,909,823 3,745,306
Total Investments (99.5%) 2,909,823 3,745,306
Other Assets (net) (0.5%) 20,121
Total Net Assets (100.0%) 3,765,427
AssetsInvestments at market valueCashReceivable for unit subscriptionsReceivable for securities soldReceivable for income distribution
and interest
LiabilitiesBank overdraftManagement fees payableAdministration fees payableFiling fees payableInsurance fees payablePayable for securities purchased Payable for unit redemptions
Net assets and unitholders’ equity
Net asset value per unit – Schedule 1
Number of units outstanding (Unit transactions – Schedule 2)
Statements of Operations for the periods ended June 30 ($000’s) (unaudited)
2007 2006
3,745 4,25923 23
- -- -
- -3,768 4,282
- -2 1- -- -1 1- -- -3 2
3,765 4,280
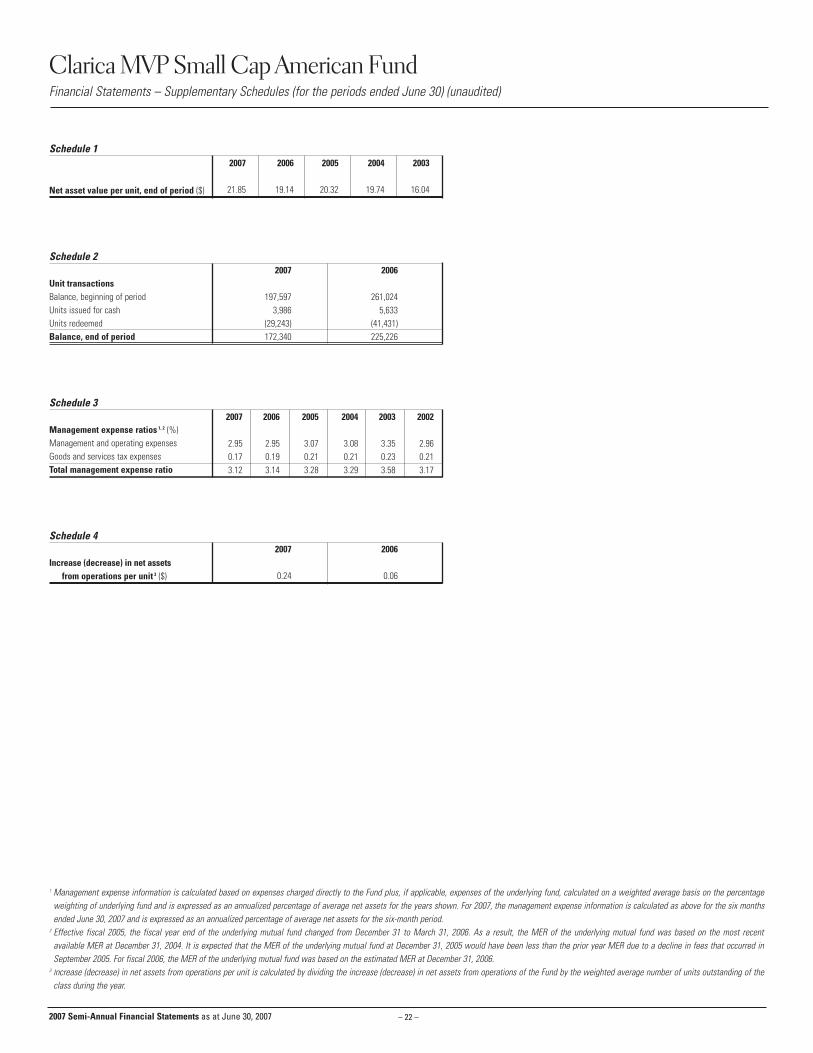
21.85 21.66
172,340 197,597
Statements of Net Assets as at June 30, 2007(unaudited) and December 31, 2006 (audited) (in $000’sexcept for per unit amounts and units outstanding)
Statements of Changes in Net Assets for the periods ended June 30 ($000’s) (unaudited)
IncomeIncome distribution from investmentsInterest
Expenses(Management expense ratios – Schedule 3)
Management feesAdministrative feesInsurance feesCustody feesLegal feesAudit feesGoods and services tax
Net income (loss) for the period
Realized and unrealized gain (loss) on investmentsRealized gain (loss) on investments (a)Capital gain distribution
from investmentsChange in unrealized appreciation (depreciation)
of investmentsNet gain (loss) on investmentsIncrease (decrease) in net assets
from operations(Increase (decrease) in net assets from operations per unit – Schedule 4)
(a) Realized gain (loss) on investmentsProceeds from sale of investmentsInvestments at cost, beginning of periodInvestments purchased
Investments at cost, end of periodCost of investments soldRealized gain (loss) on investments
2007 2006
- -- -- -
10 121 14 5- -- -- -1 1
16 19(16) (19)
137 112
- -
(78) (79)59 33
43 14
592 7763,346 4,448
19 463,365 4,4942,910 3,830
455 664137 112
Net assets, beginning of period
Capital transactionsProceeds from units issued Payments for units redeemed
Increase (decrease) in net assetsfrom operations
Net assets, end of period
2007 2006
4,280 5,013
88 112(646) (827)(558) (715)
43 143,765 4,312
Clarica MVP Small Cap American FundFinancial Statements
– 22 –
1 Management expense information is calculated based on expenses charged directly to the Fund plus, if applicable, expenses of the underlying fund, calculated on a weighted average basis on the percentageweighting of underlying fund and is expressed as an annualized percentage of average net assets for the years shown. For 2007, the management expense information is calculated as above for the six monthsended June 30, 2007 and is expressed as an annualized percentage of average net assets for the six-month period.
2 Effective fiscal 2005, the fiscal year end of the underlying mutual fund changed from December 31 to March 31, 2006. As a result, the MER of the underlying mutual fund was based on the most recent available MER at December 31, 2004. It is expected that the MER of the underlying mutual fund at December 31, 2005 would have been less than the prior year MER due to a decline in fees that occurred inSeptember 2005. For fiscal 2006, the MER of the underlying mutual fund was based on the estimated MER at December 31, 2006.
3 Increase (decrease) in net assets from operations per unit is calculated by dividing the increase (decrease) in net assets from operations of the Fund by the weighted average number of units outstanding of theclass during the year.
Clarica MVP Small Cap American FundFinancial Statements – Supplementary Schedules (for the periods ended June 30) (unaudited)
2007 Semi-Annual Financial Statements as at June 30, 2007
Schedule 1
Net asset value per unit, end of period ($)
Schedule 2
Unit transactions Balance, beginning of periodUnits issued for cash Units redeemedBalance, end of period
Schedule 3
Management expense ratios 1, 2 (%)Management and operating expensesGoods and services tax expensesTotal management expense ratio
Schedule 4
Increase (decrease) in net assetsfrom operations per unit 3 ($)
1,020,600 Expedia Inc. 34,825,335 31,839,398 552,700 Citigroup Inc. 32,962,625 30,193,404
1,264,800 Time Warner Inc. 27,610,014 28,343,763 376,750 American International Group Inc. 27,099,787 28,101,357 638,200 Home Depot Inc. 28,293,789 26,748,008 585,400 General Electric Co. 22,755,617 23,867,919 920,650 DIRECTV Group Inc. 19,296,814 22,661,279 386,400 Health Net Inc. 14,146,491 21,730,061 456,300 Hewlett-Packard Co. 16,067,531 21,685,525 236,400 Capital One Financial Corp. 18,872,574 19,750,358
2007 Semi-Annual Financial Statements as at June 30, 2007
Clarica MVP U.S. Equity FundTop 25 Holdings of Underlying Fund (unaudited)
– 24 –2007 Semi-Annual Financial Statements as at June 30, 2007
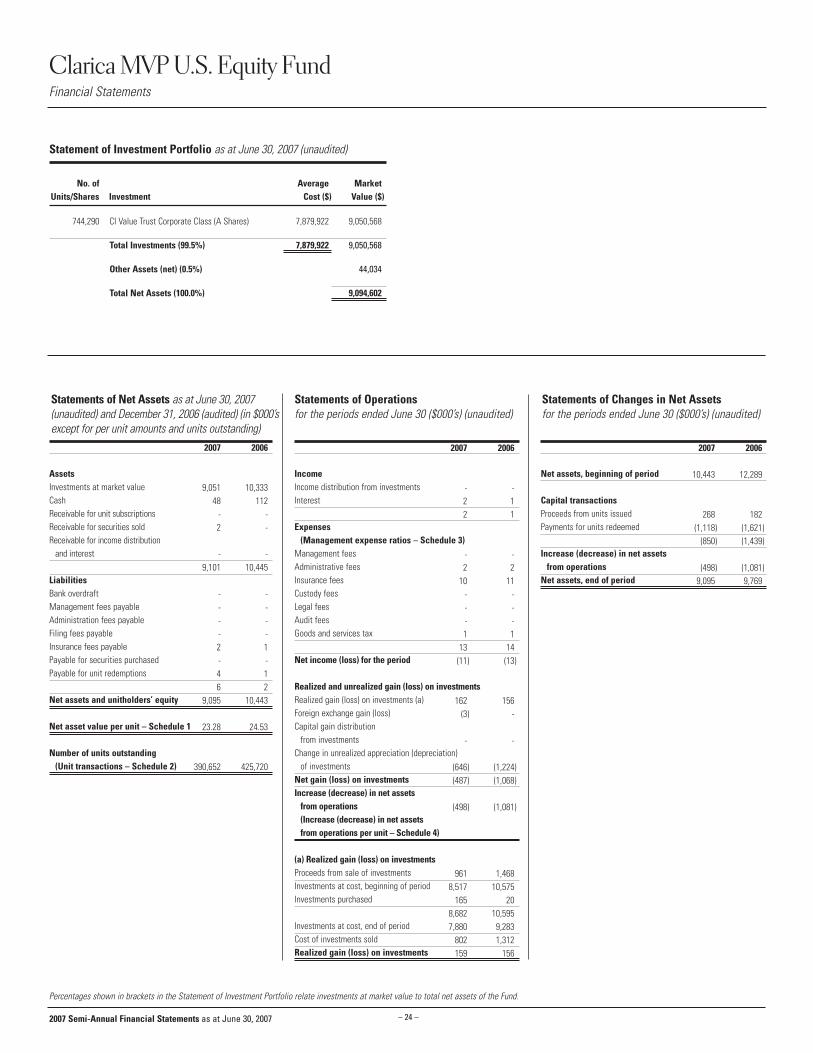
Percentages shown in brackets in the Statement of Investment Portfolio relate investments at market value to total net assets of the Fund.
Statement of Investment Portfolio as at June 30, 2007 (unaudited)
No. of Average MarketUnits/Shares Investment Cost ($) Value ($)
744,290 CI Value Trust Corporate Class (A Shares) 7,879,922 9,050,568
Total Investments (99.5%) 7,879,922 9,050,568
Other Assets (net) (0.5%) 44,034
Total Net Assets (100.0%) 9,094,602
AssetsInvestments at market valueCashReceivable for unit subscriptionsReceivable for securities soldReceivable for income distribution
and interest
LiabilitiesBank overdraftManagement fees payableAdministration fees payableFiling fees payableInsurance fees payablePayable for securities purchased Payable for unit redemptions
Net assets and unitholders’ equity
Net asset value per unit – Schedule 1
Number of units outstanding (Unit transactions – Schedule 2)
Statements of Operations for the periods ended June 30 ($000’s) (unaudited)
2007 2006
9,051 10,33348 112
- -2 -
- -9,101 10,445
- -- -- -- -2 1- -4 16 2
9,095 10,443
23.28 24.53
390,652 425,720
Statements of Net Assets as at June 30, 2007(unaudited) and December 31, 2006 (audited) (in $000’sexcept for per unit amounts and units outstanding)
Statements of Changes in Net Assets for the periods ended June 30 ($000’s) (unaudited)
IncomeIncome distribution from investmentsInterest
Expenses(Management expense ratios – Schedule 3)
Management feesAdministrative feesInsurance feesCustody feesLegal feesAudit feesGoods and services tax
Net income (loss) for the period
Realized and unrealized gain (loss) on investmentsRealized gain (loss) on investments (a)Foreign exchange gain (loss)Capital gain distribution
from investmentsChange in unrealized appreciation (depreciation)
of investmentsNet gain (loss) on investmentsIncrease (decrease) in net assets
from operations(Increase (decrease) in net assets from operations per unit – Schedule 4)
(a) Realized gain (loss) on investmentsProceeds from sale of investmentsInvestments at cost, beginning of periodInvestments purchased
Investments at cost, end of periodCost of investments soldRealized gain (loss) on investments
2007 2006
- -2 12 1
- -2 2
10 11- -- -- -1 1
13 14(11) (13)
162 156(3) -
- -
(646) (1,224)(487) (1,068)
(498) (1,081)
961 1,4688,517 10,575
165 208,682 10,5957,880 9,283
802 1,312159 156
Net assets, beginning of period
Capital transactionsProceeds from units issued Payments for units redeemed
Increase (decrease) in net assetsfrom operations
Net assets, end of period
2007 2006
10,443 12,289
268 182(1,118) (1,621)
(850) (1,439)
(498) (1,081)9,095 9,769
Clarica MVP U.S. Equity FundFinancial Statements
– 25 –
1 Management expense information is calculated based on expenses charged directly to the Fund plus, if applicable, expenses of the underlying fund, calculated on a weighted average basis on the percentageweighting of underlying fund and is expressed as an annualized percentage of average net assets for the years shown. For 2007, the management expense information is calculated as above for the six monthsended June 30, 2007 and is expressed as an annualized percentage of average net assets for the six-month period.
2 Effective fiscal 2005, the fiscal year end of the underlying mutual fund changed from December 31 to March 31, 2006. As a result, the MER of the underlying mutual fund was based on the most recent available MER at December 31, 2004. It is expected that the MER of the underlying mutual fund at December 31, 2005 would have been less than the prior year MER due to a decline in fees that occurred inSeptember 2005. For fiscal 2006, the MER of the underlying mutual fund was based on the estimated MER at December 31, 2006.
3 Increase (decrease) in net assets from operations per unit is calculated by dividing the increase (decrease) in net assets from operations of the Fund by the weighted average number of units outstanding of theclass during the year.
Clarica MVP U.S. Equity FundFinancial Statements – Supplementary Schedules (for the periods ended June 30) (unaudited)
2007 Semi-Annual Financial Statements as at June 30, 2007
Schedule 1
Net asset value per unit, end of period ($)
Schedule 2
Unit transactions Balance, beginning of periodUnits issued for cash Units redeemedBalance, end of period
Schedule 3
Management expense ratios 1, 2 (%)Management and operating expensesGoods and services tax expensesTotal management expense ratio
Schedule 4
Increase (decrease) in net assetsfrom operations per unit 3 ($)
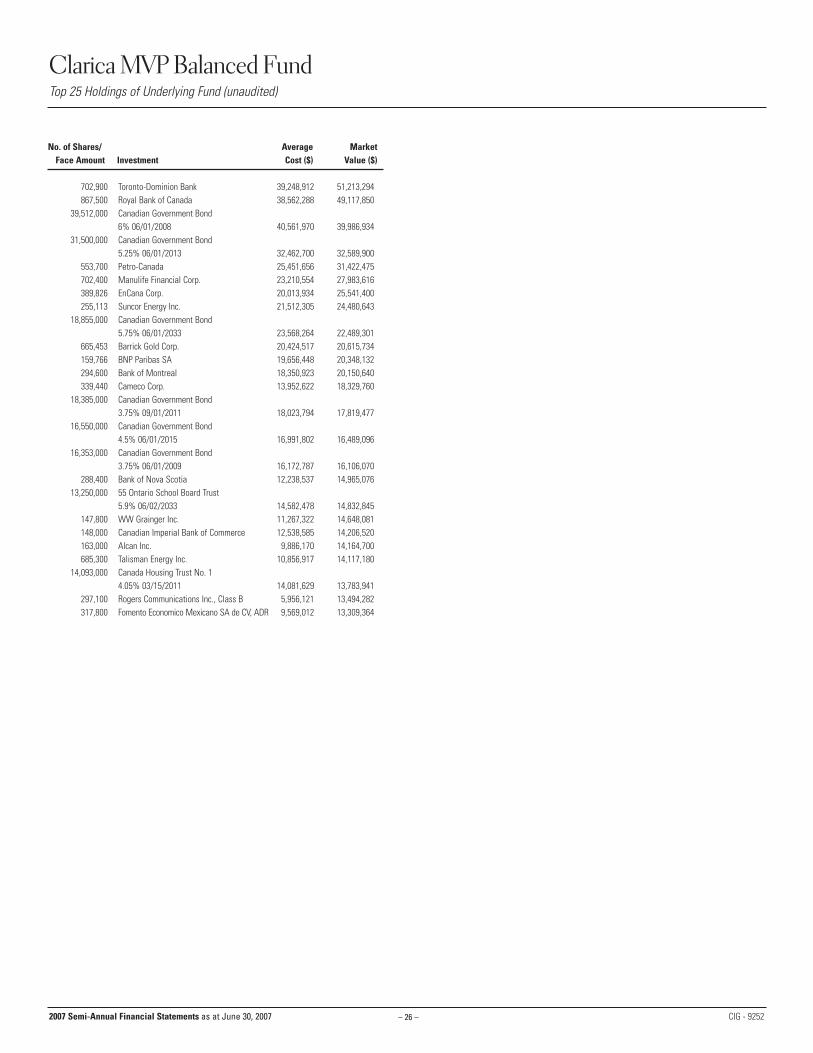
18,855,000 Canadian Government Bond5.75% 06/01/2033 23,568,264 22,489,301
665,453 Barrick Gold Corp. 20,424,517 20,615,734 159,766 BNP Paribas SA 19,656,448 20,348,132 294,600 Bank of Montreal 18,350,923 20,150,640 339,440 Cameco Corp. 13,952,622 18,329,760
18,385,000 Canadian Government Bond3.75% 09/01/2011 18,023,794 17,819,477
16,550,000 Canadian Government Bond4.5% 06/01/2015 16,991,802 16,489,096
16,353,000 Canadian Government Bond3.75% 06/01/2009 16,172,787 16,106,070
288,400 Bank of Nova Scotia 12,238,537 14,965,076 13,250,000 55 Ontario School Board Trust
5.9% 06/02/2033 14,582,478 14,832,845 147,800 WW Grainger Inc. 11,267,322 14,648,081 148,000 Canadian Imperial Bank of Commerce 12,538,585 14,206,520 163,000 Alcan Inc. 9,886,170 14,164,700 685,300 Talisman Energy Inc. 10,856,917 14,117,180
297,100 Rogers Communications Inc., Class B 5,956,121 13,494,282 317,800 Fomento Economico Mexicano SA de CV, ADR 9,569,012 13,309,364
2007 Semi-Annual Financial Statements as at June 30, 2007
Clarica MVP Balanced FundTop 25 Holdings of Underlying Fund (unaudited)
– 27 –2007 Semi-Annual Financial Statements as at June 30, 2007
Percentages shown in brackets in the Statement of Investment Portfolio relate investments at market value to total net assets of the Fund.
Statement of Investment Portfolio as at June 30, 2007 (unaudited)
No. of Average MarketUnits/Shares Investment Cost ($) Value ($)
4,944,596 Signature Canadian Balanced Fund (Class A) 61,757,572 81,882,508
Total Investments (98.9%) 61,757,572 81,882,508
Other Assets (net) (1.1%) 916,829
Total Net Assets (100.0%) 82,799,337
AssetsInvestments at market valueCashReceivable for unit subscriptionsReceivable for securities soldReceivable for income distribution
and interest
LiabilitiesBank overdraftManagement fees payableAdministration fees payableFiling fees payableInsurance fees payablePayable for securities purchased Payable for unit redemptions
Net assets and unitholders’ equity
Net asset value per unit – Schedule 1
Number of units outstanding (Unit transactions – Schedule 2)
Statements of Operations for the periods ended June 30 ($000’s) (unaudited)
2007 2006
81,883 82,612654 627
- 366 7
372 182,915 83,283
- -- -3 3- -
14 14- -
99 3116 20
82,799 83,263
41.67 40.17
1,987,250 2,072,690
Statements of Net Assets as at June 30, 2007(unaudited) and December 31, 2006 (audited) (in $000’sexcept for per unit amounts and units outstanding)
Statements of Changes in Net Assets for the periods ended June 30 ($000’s) (unaudited)
IncomeIncome distribution from investmentsInterest
Expenses(Management expense ratios – Schedule 3)
Management feesAdministrative feesInsurance feesCustody feesLegal feesAudit feesGoods and services tax
Net income (loss) for the period
Realized and unrealized gain (loss) on investmentsRealized gain (loss) on investments (a)Capital gain distribution
from investmentsChange in unrealized appreciation (depreciation)
of investmentsNet gain (loss) on investmentsIncrease (decrease) in net assets
from operations(Increase (decrease) in net assets from operations per unit – Schedule 4)
(a) Realized gain (loss) on investmentsProceeds from sale of investmentsInvestments at cost, beginning of periodInvestments purchased
Investments at cost, end of periodCost of investments soldRealized gain (loss) on investments
2007 2006
- 24414 1014 254
- -14 1684 80
- -1 -1 -6 7
106 103(92) 151
1,012 1,240
749 498
1,381 1353,142 1,873
3,050 2,024
4,208 4,88463,868 60,9171,085 1,569
64,953 62,48661,758 58,8423,195 3,6441,013 1,240
Net assets, beginning of period
Capital transactionsProceeds from units issued Payments for units redeemed
Increase (decrease) in net assetsfrom operations
Net assets, end of period
2007 2006
83,263 79,927
2,513 3,784(6,027) (7,663)(3,514) (3,879)
3,050 2,02482,799 78,072
Clarica MVP Balanced FundFinancial Statements
– 28 –
1 Management expense information is calculated based on expenses charged directly to the Fund plus, if applicable, expenses of the underlying fund, calculated on a weighted average basis on the percentageweighting of underlying fund and is expressed as an annualized percentage of average net assets for the years shown. For 2007, the management expense information is calculated as above for the six monthsended June 30, 2007 and is expressed as an annualized percentage of average net assets for the six-month period.
2 Effective fiscal 2005, the fiscal year end of the underlying mutual fund changed from December 31 to March 31, 2006. As a result, the MER of the underlying mutual fund was based on the most recent available MER at December 31, 2004. It is expected that the MER of the underlying mutual fund at December 31, 2005 would have been less than the prior year MER due to a decline in fees that occurred inSeptember 2005. For fiscal 2006, the MER of the underlying mutual fund was based on the estimated MER at December 31, 2006.
3 Increase (decrease) in net assets from operations per unit is calculated by dividing the increase (decrease) in net assets from operations of the Fund by the weighted average number of units outstanding of theclass during the year.
Clarica MVP Balanced FundFinancial Statements – Supplementary Schedules (for the periods ended June 30) (unaudited)
2007 Semi-Annual Financial Statements as at June 30, 2007
Schedule 1
Net asset value per unit, end of period ($)
Schedule 2
Unit transactions Balance, beginning of periodUnits issued for cash Units redeemedBalance, end of period
Schedule 3
Management expense ratios 1, 2 (%)Management and operating expensesGoods and services tax expensesTotal management expense ratio
Schedule 4
Increase (decrease) in net assetsfrom operations per unit 3 ($)
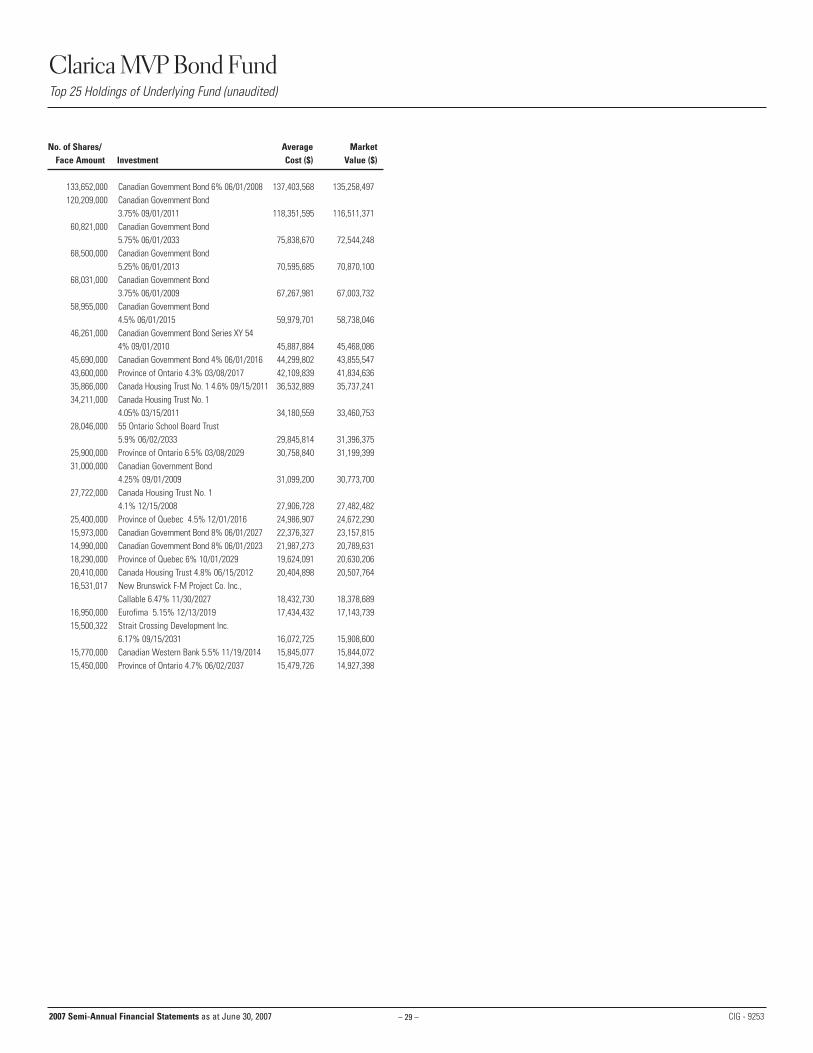
4.1% 12/15/2008 27,906,728 27,482,482 25,400,000 Province of Quebec 4.5% 12/01/2016 24,986,907 24,672,290 15,973,000 Canadian Government Bond 8% 06/01/2027 22,376,327 23,157,815 14,990,000 Canadian Government Bond 8% 06/01/2023 21,987,273 20,789,631 18,290,000 Province of Quebec 6% 10/01/2029 19,624,091 20,630,206 20,410,000 Canada Housing Trust 4.8% 06/15/2012 20,404,898 20,507,764 16,531,017 New Brunswick F-M Project Co. Inc.,
Callable 6.47% 11/30/2027 18,432,730 18,378,689 16,950,000 Eurofima 5.15% 12/13/2019 17,434,432 17,143,739 15,500,322 Strait Crossing Development Inc.
6.17% 09/15/2031 16,072,725 15,908,600 15,770,000 Canadian Western Bank 5.5% 11/19/2014 15,845,077 15,844,072 15,450,000 Province of Ontario 4.7% 06/02/2037 15,479,726 14,927,398
2007 Semi-Annual Financial Statements as at June 30, 2007
Clarica MVP Bond FundTop 25 Holdings of Underlying Fund (unaudited)
– 30 –2007 Semi-Annual Financial Statements as at June 30, 2007
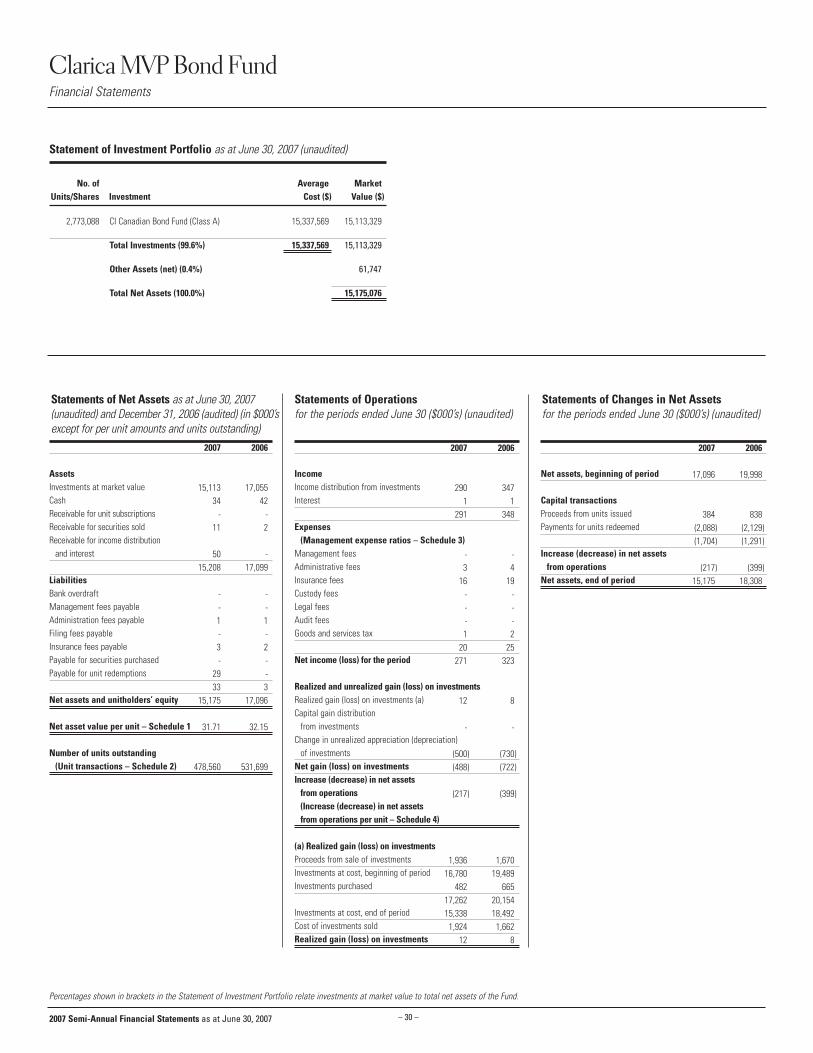
Percentages shown in brackets in the Statement of Investment Portfolio relate investments at market value to total net assets of the Fund.
Statement of Investment Portfolio as at June 30, 2007 (unaudited)
No. of Average MarketUnits/Shares Investment Cost ($) Value ($)
2,773,088 CI Canadian Bond Fund (Class A) 15,337,569 15,113,329
Total Investments (99.6%) 15,337,569 15,113,329
Other Assets (net) (0.4%) 61,747
Total Net Assets (100.0%) 15,175,076
AssetsInvestments at market valueCashReceivable for unit subscriptionsReceivable for securities soldReceivable for income distribution
and interest
LiabilitiesBank overdraftManagement fees payableAdministration fees payableFiling fees payableInsurance fees payablePayable for securities purchased Payable for unit redemptions
Net assets and unitholders’ equity
Net asset value per unit – Schedule 1
Number of units outstanding (Unit transactions – Schedule 2)
Statements of Operations for the periods ended June 30 ($000’s) (unaudited)
2007 2006
15,113 17,05534 42
- -11 2
50 -15,208 17,099
- -- -1 1- -3 2- -
29 -33 3
15,175 17,096
31.71 32.15
478,560 531,699
Statements of Net Assets as at June 30, 2007(unaudited) and December 31, 2006 (audited) (in $000’sexcept for per unit amounts and units outstanding)
Statements of Changes in Net Assets for the periods ended June 30 ($000’s) (unaudited)
IncomeIncome distribution from investmentsInterest
Expenses(Management expense ratios – Schedule 3)
Management feesAdministrative feesInsurance feesCustody feesLegal feesAudit feesGoods and services tax
Net income (loss) for the period
Realized and unrealized gain (loss) on investmentsRealized gain (loss) on investments (a)Capital gain distribution
from investmentsChange in unrealized appreciation (depreciation)
of investmentsNet gain (loss) on investmentsIncrease (decrease) in net assets
from operations(Increase (decrease) in net assets from operations per unit – Schedule 4)
(a) Realized gain (loss) on investmentsProceeds from sale of investmentsInvestments at cost, beginning of periodInvestments purchased
Investments at cost, end of periodCost of investments soldRealized gain (loss) on investments
2007 2006
290 3471 1
291 348
- -3 4
16 19- -- -- -1 2
20 25271 323
12 8
- -
(500) (730)(488) (722)
(217) (399)
1,936 1,67016,780 19,489
482 66517,262 20,15415,338 18,4921,924 1,662
12 8
Net assets, beginning of period
Capital transactionsProceeds from units issued Payments for units redeemed
Increase (decrease) in net assetsfrom operations
Net assets, end of period
2007 2006
17,096 19,998
384 838(2,088) (2,129)(1,704) (1,291)
(217) (399)15,175 18,308
Clarica MVP Bond FundFinancial Statements
– 31 –
1 Management expense information is calculated based on expenses charged directly to the Fund plus, if applicable, expenses of the underlying fund, calculated on a weighted average basis on the percentageweighting of underlying fund and is expressed as an annualized percentage of average net assets for the years shown. For 2007, the management expense information is calculated as above for the six monthsended June 30, 2007 and is expressed as an annualized percentage of average net assets for the six-month period.
2 Effective fiscal 2005, the fiscal year end of the underlying mutual fund changed from December 31 to March 31, 2006. As a result, the MER of the underlying mutual fund was based on the most recent available MER at December 31, 2004. It is expected that the MER of the underlying mutual fund at December 31, 2005 would have been less than the prior year MER due to a decline in fees that occurred inSeptember 2005. For fiscal 2006, the MER of the underlying mutual fund was based on the estimated MER at December 31, 2006.
3 Increase (decrease) in net assets from operations per unit is calculated by dividing the increase (decrease) in net assets from operations of the Fund by the weighted average number of units outstanding of theclass during the year.
Clarica MVP Bond FundFinancial Statements – Supplementary Schedules (for the periods ended June 30) (unaudited)
2007 Semi-Annual Financial Statements as at June 30, 2007
Schedule 1
Net asset value per unit, end of period ($)
Schedule 2
Unit transactions Balance, beginning of periodUnits issued for cash Units redeemedBalance, end of period
Schedule 3
Management expense ratios 1, 2 (%)Management and operating expensesGoods and services tax expensesTotal management expense ratio
Schedule 4
Increase (decrease) in net assetsfrom operations per unit 3 ($)
No. of Shares/ Average MarketFace Amount Investment Cost ($) Value ($)
916,500 Toronto-Dominion Bank 51,549,747 66,776,190 1,084,900 Royal Bank of Canada 50,279,987 61,427,038
377,050 BNP Paribas SA 47,567,331 48,021,878 580,300 Bank of Montreal 35,299,490 39,692,520
1,064,900 Enbridge Inc. 36,487,004 38,229,910 376,000 Suncor Energy Inc. 31,935,785 36,080,960 367,100 Canadian Imperial Bank of Commerce 30,376,254 35,237,929 857,200 Manulife Financial Corp. 24,773,372 34,150,848 621,800 ING Groep NV 30,788,053 29,388,446 643,740 St. Lawrence Cement Group Inc., Class A 15,900,441 26,502,776 719,500 TransCanada Corp. 24,011,478 26,362,480 652,257 BCE Inc. 19,425,634 26,312,047 462,500 Bank of Nova Scotia 20,176,948 23,999,125 917,900 George Weston Ltd., 5.15% Preferred,
Series 2 24,538,180 23,176,975 926,200 Brookfield Asset Management Inc.,
Preferred, Series 2 18,894,480 23,108,690 1,038,400 BCE Inc., 5.45% Preferred, Series AA 27,206,979 22,844,800
Series 2, Class A 23,953,265 22,483,185 1,079,000 BCE Inc., 4.4% Preferred, Series AF 16 27,223,170 22,335,300
550,300 Power Financial Corp. 15,674,034 22,259,635 894,300 Toronto-Dominion Bank, 4.85% Preferred,
Series O 22,467,169 21,910,350 1,883,300 Enel SpA 19,146,726 21,648,843
330,200 TELUS Corp. 12,745,178 21,056,854 897,000 Bank of Montreal 4.5% Preferred, Series 13 22,425,000 20,272,200 908,321 Diageo PLC 20,733,663 20,147,780
2007 Semi-Annual Financial Statements as at June 30, 2007
Clarica MVP Dividend FundTop 25 Holdings of Underlying Fund (unaudited)
– 33 –2007 Semi-Annual Financial Statements as at June 30, 2007
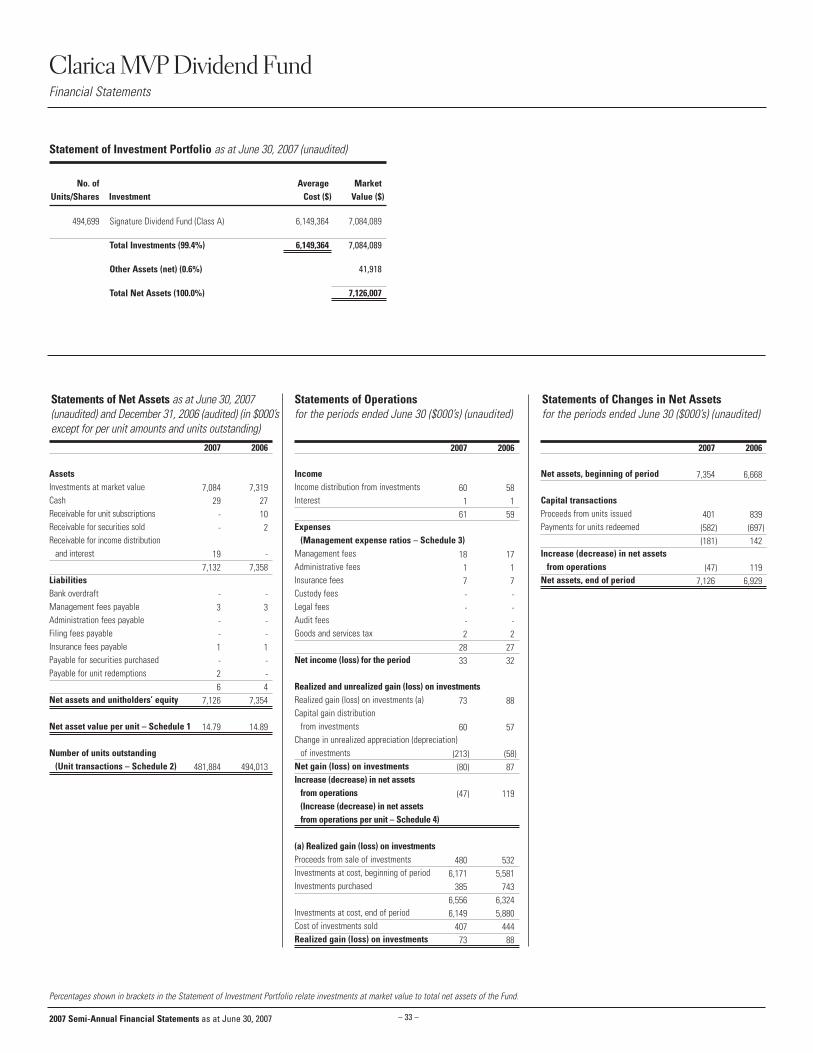
Percentages shown in brackets in the Statement of Investment Portfolio relate investments at market value to total net assets of the Fund.
Statement of Investment Portfolio as at June 30, 2007 (unaudited)
No. of Average MarketUnits/Shares Investment Cost ($) Value ($)
494,699 Signature Dividend Fund (Class A) 6,149,364 7,084,089
Total Investments (99.4%) 6,149,364 7,084,089
Other Assets (net) (0.6%) 41,918
Total Net Assets (100.0%) 7,126,007
AssetsInvestments at market valueCashReceivable for unit subscriptionsReceivable for securities soldReceivable for income distribution
and interest
LiabilitiesBank overdraftManagement fees payableAdministration fees payableFiling fees payableInsurance fees payablePayable for securities purchased Payable for unit redemptions
Net assets and unitholders’ equity
Net asset value per unit – Schedule 1
Number of units outstanding (Unit transactions – Schedule 2)
Statements of Operations for the periods ended June 30 ($000’s) (unaudited)
2007 2006
7,084 7,31929 27
- 10- 2
19 -7,132 7,358
- -3 3- -- -1 1- -2 -6 4
7,126 7,354
14.79 14.89
481,884 494,013
Statements of Net Assets as at June 30, 2007(unaudited) and December 31, 2006 (audited) (in $000’sexcept for per unit amounts and units outstanding)
Statements of Changes in Net Assets for the periods ended June 30 ($000’s) (unaudited)
IncomeIncome distribution from investmentsInterest
Expenses(Management expense ratios – Schedule 3)
Management feesAdministrative feesInsurance feesCustody feesLegal feesAudit feesGoods and services tax
Net income (loss) for the period
Realized and unrealized gain (loss) on investmentsRealized gain (loss) on investments (a)Capital gain distribution
from investmentsChange in unrealized appreciation (depreciation)
of investmentsNet gain (loss) on investmentsIncrease (decrease) in net assets
from operations(Increase (decrease) in net assets from operations per unit – Schedule 4)
(a) Realized gain (loss) on investmentsProceeds from sale of investmentsInvestments at cost, beginning of periodInvestments purchased
Investments at cost, end of periodCost of investments soldRealized gain (loss) on investments
2007 2006
60 581 1
61 59
18 171 17 7- -- -- -2 2
28 2733 32
73 88
60 57
(213) (58)(80) 87
(47) 119
480 5326,171 5,581
385 7436,556 6,3246,149 5,880
407 44473 88
Net assets, beginning of period
Capital transactionsProceeds from units issued Payments for units redeemed
Increase (decrease) in net assetsfrom operations
Net assets, end of period
2007 2006
7,354 6,668
401 839(582) (697)(181) 142
(47) 1197,126 6,929
Clarica MVP Dividend FundFinancial Statements
– 34 –
1 Management expense information is calculated based on expenses charged directly to the Fund plus, if applicable, expenses of the underlying fund, calculated on a weighted average basis on the percentageweighting of underlying fund and is expressed as an annualized percentage of average net assets for the years shown. For 2007, the management expense information is calculated as above for the six monthsended June 30, 2007 and is expressed as an annualized percentage of average net assets for the six-month period.
2 Effective fiscal 2005, the fiscal year end of the underlying mutual fund changed from December 31 to March 31, 2006. As a result, the MER of the underlying mutual fund was based on the most recent available MER at December 31, 2004. It is expected that the MER of the underlying mutual fund at December 31, 2005 would have been less than the prior year MER due to a decline in fees that occurred inSeptember 2005. For fiscal 2006, the MER of the underlying mutual fund was based on the estimated MER at December 31, 2006.
3 Increase (decrease) in net assets from operations per unit is calculated by dividing the increase (decrease) in net assets from operations of the Fund by the weighted average number of units outstanding of theclass during the year.
Clarica MVP Dividend FundFinancial Statements – Supplementary Schedules (for the periods ended June 30) (unaudited)
2007 Semi-Annual Financial Statements as at June 30, 2007
Schedule 1
Net asset value per unit, end of period ($)
Schedule 2
Unit transactions Balance, beginning of periodUnits issued for cash Units redeemedBalance, end of period
Schedule 3
Management expense ratios 1, 2 (%)Management and operating expensesGoods and services tax expensesTotal management expense ratio
Schedule 4
Increase (decrease) in net assetsfrom operations per unit 3 ($)
No. of Shares/ Average MarketFace Amount Investment Cost ($) Value ($)
63,000,000 Government of Canada T-Bill4.23% 07/06/2007 62,956,260 62,956,260
38,100,000 Depfa PLC 4.64% 09/28/2007 37,668,926 37,668,926 37,800,000 Royal Bank of Canada BA 4.52% 09/20/2007 37,420,636 37,420,636 36,000,000 ABN Amro Canada TD 4.27% 07/06/2007 36,004,212 36,004,212 36,000,000 Royal Bank of Canada TD 4.26% 07/09/2007 36,004,201 36,004,201 36,000,000 Deutschebank Canada TD 4.25% 07/04/2007 36,004,192 36,004,192 30,600,000 Government of Canada T-Bill
4.56% 12/13/2007 29,977,776 29,977,776 25,600,000 Canadian Imperial Bank of Commerce FRN
4.45857% 07/14/2008 25,605,120 25,600,000 25,400,000 General Electric Capital Corp.
4.595% 08/27/2008 25,448,489 25,400,000 22,800,000 Bank of Montreal BA 4.41% 07/20/2007 22,745,063 22,745,063 22,700,000 Citibank N.A. 4.34% 07/06/2007 22,683,851 22,683,851 22,400,000 Bear Stearns Co. Inc. 4.46857% 10/02/2009 22,400,000 22,400,000 22,900,000 Toronto Dominion Bank BDN
4.53% 05/16/2008 22,027,156 22,027,156 20,800,000 CIBC BA 4.48% 09/11/2007 20,615,623 20,615,623 19,000,000 Province of Quebec Promissory Note
4.24% 07/06/2007 18,986,840 18,986,840 18,800,000 HSBC Bank Canada FRN
4.41714% 02/11/2008 18,800,000 18,800,000 18,700,000 Honda Canada Finance Inc.
4.47714% 08/25/2008 18,700,000 18,700,000 17,400,000 Bank of Montreal FRN 4.46% 09/14/2007 17,400,000 17,400,000 16,500,000 Greater Toronto Airports Authority
Capital transactionsProceeds from units issued Payments for units redeemed
Increase (decrease) in net assetsfrom operations
Net assets, end of period
2007 2006
4,489 5,095
3,338 10,048(3,555) (10,476)
(217) (428)
68 604,340 4,727
Clarica MVP Money Market FundFinancial Statements
– 37 –
1 Management expense information is calculated based on expenses charged directly to the Fund plus, if applicable, expenses of the underlying fund, calculated on a weighted average basis on the percentageweighting of underlying fund and is expressed as an annualized percentage of average net assets for the years shown. For 2007, the management expense information is calculated as above for the six monthsended June 30, 2007 and is expressed as an annualized percentage of average net assets for the six-month period.
2 Effective fiscal 2005, the fiscal year end of the underlying mutual fund changed from December 31 to March 31, 2006. As a result, the MER of the underlying mutual fund was based on the most recent available MER at December 31, 2004. It is expected that the MER of the underlying mutual fund at December 31, 2005 would have been less than the prior year MER due to a decline in fees that occurred inSeptember 2005. For fiscal 2006, the MER of the underlying mutual fund was based on the estimated MER at December 31, 2006.
3 Increase (decrease) in net assets from operations per unit is calculated by dividing the increase (decrease) in net assets from operations of the Fund by the weighted average number of units outstanding of theclass during the year.
Clarica MVP Money Market FundFinancial Statements – Supplementary Schedules (for the periods ended June 30) (unaudited)
2007 Semi-Annual Financial Statements as at June 30, 2007
Schedule 1
Net asset value per unit, end of period ($)
Schedule 2
Unit transactions Balance, beginning of periodUnits issued for cash Units redeemedBalance, end of period
Schedule 3
Management expense ratios 1, 2 (%)Management and operating expensesGoods and services tax expensesTotal management expense ratio
Schedule 4
Increase (decrease) in net assetsfrom operations per unit 3 ($)
Notes to the Financial Statements As at June 30, 2007 (unaudited)
2007 Semi-Annual Financial Statements as at June 30, 2007
SUMMARY OF SIGNIFICANT ACCOUNTING POLICIESSignificant accounting policies used in preparing the semi-annual financial statements areconsistent with those used in preparing the annual financial statements except for the adoptionof new accounting standards as described below. The semi-annual financial statements shouldbe read in conjunction with the Funds’ December 31, 2006 annual financial statements.
(a) New Accounting Standards
The Canadian Institute of Chartered Accountants (“CICA”) issued Section 3855,Financial Instruments: Recognition and Measurement, effective for interim andannual financial statements relating to fiscal years beginning on or after October1, 2006. This section establishes standards for the fair valuation of investmentsand the way transaction costs are recorded for financial reporting purposes.
On January 1, 2007, the Funds adopted Section 3855 on a prospective basis forfinancial statement reporting purposes. The Funds were not impacted by thesenew standards.
The Funds invest in units of underlying investment funds. As a result, the newstandards do not impact the Funds’ valuation policies. The underlying funds willcontinue to be valued at their net asset value as reported by the fund manager onthe valuation date. Additionally, the Funds’ investment transactions are not subjectto transaction costs.
The Statement of Investment Portfolios are as at June 30, 2007 and the Statements of Net Assetsare as at June 30, 2007 and December 31, 2006. The Statements of Operations and Changes inNet Assets are for the periods ended June 30, 2007 and 2006.
Legal Notice
Notice: Should you require additional copies of this Semi-annual Report or have received morethan one copy, please contact CI Investments Inc. (the “Manager”) or your financial advisor.
Commissions, trailing commissions, management fees and expenses all maybe associated withmutual fund investments. Please read the prospectus before investing. Unless otherwise indicatedand except for returns for periods less than one year, the indicated rates of return are the historicalannual compounded total returns including changes in security value. All performance dataassume reinvestment of all distributions or dividends and do not take into account sales, redemption,distribution or optional charges or income taxes payable by any securityholder that would havereduced returns. Mutual funds are not guaranteed, their values change frequently and pastperformance may not be repeated. Mutual fund securities are not covered by the Canada DepositInsurance Corporation or by any other government deposit insurer.
The commentaries contained herein are provided as a general source of information and should notbe considered personal investment advice or an offer or solicitation to buy or sell securities. Everyeffort has been made to ensure that the material contained in these commentaries is accurate atthe time of publication. However, the Manager cannot guarantee its accuracy or completenessand accepts no responsibility for any loss arising from any use of or reliance on the informationcontained herein.
®CI Funds, CI Investments, CI Investments design, Harbour Funds, Global Managers and AmericanManagers are registered trademarks of CI Investments Inc.
™The Portfolio Select Series and Signature Funds are trademarks of CI Investments Inc.