J. Great Lakes Res. 32:63–76 Internat. Assoc. Great Lakes Res., 2006 63 Classifying and Forecasting Coastal Upwellings in Lake Michigan Using Satellite Derived Temperature Images and Buoy Data Stefan Plattner 1,† , Doran M. Mason 1,* , George A. Leshkevich 1 , David J. Schwab 1 , and Edward S. Rutherford 2 1 NOAA Great Lakes Environmental Research Laboratory 2205 Commonwealth Boulevard Ann Arbor, Michigan 48105 2 University of Michigan School of Natural Resources and Environment Institute for Fisheries Research 212 Museum Annex Bldg. 1109 N. University Ann Arbor, Michigan 48109 ABSTRACT. Coastal upwellings are common in the Great Lakes but have lacked enumeration and sys- tematic classification of spatial extent, frequency, duration, and magnitude. Near real-time sea surface temperature (SST) images derived from the Advanced Very High Resolution Radiometer (AVHRR) pro- vide indices of upwelling events, but visual inspection of daily images can be tedious. Moreover, the defi- nition of what constitutes an upwelling from AVHRR data is subjective. We developed a semi-automated method to classify upwellings during the period of thermal stratification using daily, cloud-free surface temperature charts from AVHRR SST data. Then we statistically evaluated the location, frequency, mag- nitude, extent, and duration of upwelling events in Lake Michigan from 1992–2000. Further, we analyzed meteorological data from the National Data Buoy Center buoys in an attempt to improve the reliability of the classification and to provide a means for future forecast of coastal upwelling. Although variable, upwelling events along the western shoreline were preceded by 4 days of southerly and west-to-north- westerly winds, while upwelling events occurring along the eastern shore were preceded by 4 days of northerly winds. Probability of an upwelling event occurring was a function of the direction-weighted wind speed, reaching a 100% probability at direction weighted wind speeds of 11 m s –1 for the western shore. Probability of an upwelling occurrence along the east coast reached 73% at 11 m s –1 and 100% at 13 m s –1 . Continuous measurements of wind data with a sufficient temporal resolution are required dur- ing the entire upwelling season to improve the predictability of upwellings. INDEX WORDS: Upwelling, Lake Michigan, AVHRR, Great Lakes. * Corresponding author. E-mail: [email protected]Current address: NOAA Atlantic Oceanographic Meteorological Labora- tory, 4301 Rickenbacker Causeway, Miami, FL 33149. † Current address: German Aerospace Center DLR, German Remote Sensing Data Center DFD, D-82234 Oberpfaffenhofen, Germany. INTRODUCTION Coastal upwelling, a phenomenon found in large stratified lakes, estuaries, and oceans, occurs when the continued forcing of offshore winds moves warm epilimnetic water away from the coast, trans- porting cold water from the hypolimnion to the sur- face. In the Laurentian Great Lakes, this exchange of water masses results in the short-term nutrient enrichment of surface waters (Haffner et al. 1984, Dunstall et al. 1990) and the redistribution or change in the nearshore plankton communities (Heufelder et al. 1982, Haffner et al. 1984, Dunstall et al. 1990, Megard et al. 1997). Moreover, up- wellings may be responsible for reduction in species richness in benthic communities (Barton 1986, Kilgour et al. 2000), higher biomass and pro- duction of some benthic invertebrates (Nalepa et al. 2000), and changes in fish distributions through be- havioral thermal regulation or passive advection (Heufelder et al. 1982, Fitzsimons et al. 2002). Up- wellings may also cause mortality in adult fish due
Transcript
J. Great Lakes Res. 32:63–76Internat. Assoc. Great Lakes Res., 2006
63
Classifying and Forecasting Coastal Upwellings in Lake MichiganUsing Satellite Derived Temperature Images and Buoy Data
Stefan Plattner1,†, Doran M. Mason1,*, George A. Leshkevich1, David J. Schwab1,and Edward S. Rutherford2
1NOAA Great Lakes Environmental Research Laboratory2205 Commonwealth Boulevard
Ann Arbor, Michigan 48105
2University of Michigan School of Natural Resources and EnvironmentInstitute for Fisheries Research
212 Museum Annex Bldg.1109 N. University
Ann Arbor, Michigan 48109
ABSTRACT. Coastal upwellings are common in the Great Lakes but have lacked enumeration and sys-tematic classification of spatial extent, frequency, duration, and magnitude. Near real-time sea surfacetemperature (SST) images derived from the Advanced Very High Resolution Radiometer (AVHRR) pro-vide indices of upwelling events, but visual inspection of daily images can be tedious. Moreover, the defi-nition of what constitutes an upwelling from AVHRR data is subjective. We developed a semi-automatedmethod to classify upwellings during the period of thermal stratification using daily, cloud-free surfacetemperature charts from AVHRR SST data. Then we statistically evaluated the location, frequency, mag-nitude, extent, and duration of upwelling events in Lake Michigan from 1992–2000. Further, we analyzedmeteorological data from the National Data Buoy Center buoys in an attempt to improve the reliability ofthe classification and to provide a means for future forecast of coastal upwelling. Although variable,upwelling events along the western shoreline were preceded by 4 days of southerly and west-to-north-westerly winds, while upwelling events occurring along the eastern shore were preceded by 4 days ofnortherly winds. Probability of an upwelling event occurring was a function of the direction-weightedwind speed, reaching a 100% probability at direction weighted wind speeds of 11 m s–1 for the westernshore. Probability of an upwelling occurrence along the east coast reached 73% at 11 m s–1 and 100% at13 m s–1. Continuous measurements of wind data with a sufficient temporal resolution are required dur-ing the entire upwelling season to improve the predictability of upwellings.
INDEX WORDS: Upwelling, Lake Michigan, AVHRR, Great Lakes.
*Corresponding author. E-mail: [email protected] address: NOAA Atlantic Oceanographic Meteorological Labora-tory, 4301 Rickenbacker Causeway, Miami, FL 33149. †Current address: German Aerospace Center DLR, German RemoteSensing Data Center DFD, D-82234 Oberpfaffenhofen, Germany.
INTRODUCTION
Coastal upwelling, a phenomenon found in largestratified lakes, estuaries, and oceans, occurs whenthe continued forcing of offshore winds moveswarm epilimnetic water away from the coast, trans-porting cold water from the hypolimnion to the sur-face. In the Laurentian Great Lakes, this exchangeof water masses results in the short-term nutrient
enrichment of surface waters (Haffner et al. 1984,Dunstall et al. 1990) and the redistribution orchange in the nearshore plankton communities(Heufelder et al. 1982, Haffner et al. 1984, Dunstallet al. 1990, Megard et al. 1997). Moreover, up-wellings may be responsible for reduction inspecies richness in benthic communities (Barton1986, Kilgour et al. 2000), higher biomass and pro-duction of some benthic invertebrates (Nalepa et al.2000), and changes in fish distributions through be-havioral thermal regulation or passive advection(Heufelder et al. 1982, Fitzsimons et al. 2002). Up-wellings may also cause mortality in adult fish due
64 Plattner et al.
to rapid decrease in water temperatures (Heufelderet al. 1982).
Significance of upwelling is clear, however, toquantify this physical forcing on ecologicalprocesses, one is faced with how to classify andquantify upwelling events on a lake-wide basis. Forexample, Mortimer (1971) used temperature datafrom municipal water intakes around the lake andbathythermograph casts from trans-lake car ferries.But, due to the high variation of water temperaturesin the nearshore zone, and the lack of sufficient spa-tial coverage, these data are not adequate for resolv-ing the spatial distribution of lake temperatures(Schwab et al. 1999). Moreover, Bolgrien andBrooks (1992) visually identified upwelling eventsoccurring in Lake Michigan using Advanced VeryHigh Resolution Radiometer (AVHRR) data of seasurface temperature (SST); however, their mainfocus was identifying and tracking the developmentof thermal bars. Thus, the question remains- how toclassify and quantify upwelling events across spaceand time while trying to minimize biases associatedwith subjective classification, and to eliminate thetedium of visually inspecting the SST maps.
In this study, we developed a semi-automatedclassification algorithm to identify, classify, andquantify (location, frequency, magnitude, extent,and duration) upwelling events in Lake Michiganwhen the lake is thermally stratified using AVHRRSST data. We then used this information to evaluatethe history of upwelling in Lake Michigan from1992–2000. Lastly, we used wind data from the Na-tional Data Buoy Center (NDBC) buoys and up-welling data to forecast when an upwelling mayoccur.
METHODS
We used Great Lakes Surface EnvironmentalAnalysis (GLSEA) composite surface temperaturecharts produced by the CoastWatch program at theNational Oceanic and Atmospheric Administra-tion’s Great Lakes Environmental Research Labora-tory (NOAA/GLERL) (Leshkevich et al. 1992,Schwab et al. 1999) to develop our semi-automatedupwelling classification algorithm and to assess thehistory of upwelling events in Lake Michigan. TheGLSEA charts are daily composites of temperatureimages produced from the thermal AVHRR chan-nels of NOAA’s polar orbiting weather satellites(see example in Fig. 1). Data are geo-corrected,cloud-masked, and edge-enhanced before the dailycomposite chart is computed. Temperature values of
cloud-covered areas are derived from the previous-day composite image. For longer periods of cloudcover, a 5-day average is used to estimate surfacewater temperature in the cloud covered region. Asthe GLSEA composite charts are daily, geometri-cally corrected, cloud-free surface temperaturefields, the GLSEA composite charts are a bettertool for this study than the original satellite im-agery, which may lack one or more of these quali-ties. A detailed description of the methodology canbe found in Schwab et al. (1999). GLSEA tempera-ture composite charts are available for the GreatLakes beginning in 1992 at a spatial resolution of2.6 km2. We confined our study to Lake Michiganfor the years 1992–2000 and only for the period oftime in which Lake Michigan was thermally strati-fied.
Identification of an Upwelling Event
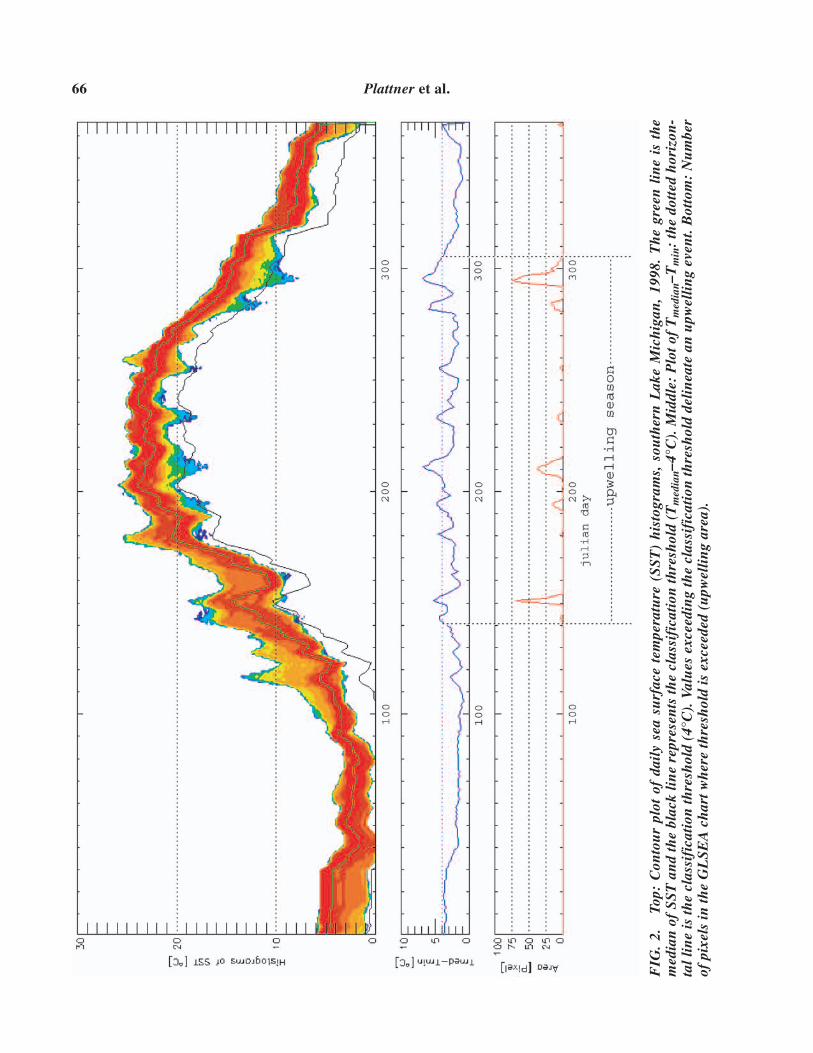
To detect upwelling events during the 9-year pe-riod (1992–2000) from the available 3,069 dailyGLSEA charts, a histogram of the surface tempera-ture by day was created for each year and plotted asa time series-contour graph (see example in Fig. 2).We identified upwelling events by evaluating thedaily histogram on the time-series contour plot.Given that an upwelling event causes a substantialdrop in the minimum temperature, an upwellingmay be identified by a broadening of the daily his-togram, which may also be characterized by askewed distribution at the low temperatures in SSThistogram (Fig. 3). In the time series histogram,these significant decreases in temperature can beidentified by dips in the minimum temperature (Fig.2).
Significant deviations from the overall mean sur-face temperature may occur for reasons other thanfrom upwelling events, particularly during springwhen the lake warms from south to north. To pre-vent these situations from being interpreted as anupwelling in our analysis, Lake Michigan was di-vided into three regions- North (N), Central (C),and South (S), prior to creating the time series his-tograms (Fig. 4b). Then, for each regional time se-ries histogram, a temperature threshold (t) wasestablished,
ti,j = Tmedian,i,j – 4°C,
where Tmedian is the median temperature for region ion day j. Pixels with temperatures at or below thethreshold were classified as upwelling areas. This
Coastal Upwelling Events in Lake Michigan 65
index was chosen because it makes upwelling suffi-ciently distinguishable from most other local varia-tions of the water surface temperature. The medianvalue of SST was preferred rather than the mean,since the median is less sensitive to changes in tem-perature at the tail of the distribution, where an up-welling will be detected (Fig. 3). Four degrees Cwas selected as the constant as a result of empiricaltesting; it was found that a difference of 4°C pro-vided a reasonable temperature threshold for up-welling classification. We tested other definitionsand threshold values, but by careful analysis of sev-eral different types of upwelling events, we foundthis algorithm to be the most robust. The definition
was then applied to the time series histogram; anupwelling event was identified where the thresholdintersected the yearly contour plot of temperaturehistograms (Fig. 2). Note, however, that our methodclassified upwelling events where there was a sur-face thermal gradient, i.e., during the stratified sea-son. The beginning and the end of the upwellingseason (detectable by our method) is marked by thedate when median sea surface temperature risesabove or falls below a value less than 4°C abovethe temperature of the hypolimnion.
After the classification, a visual examination ofthe pre-classified situations was made in order toeliminate unclear situations, errors due to cloud
FIG. 1. GLSEA SST map of 2 August 1993, showing upwelling events along the western shore of LakeMichigan, and northern Lake Huron. GLSEA SST charts are produced by the Great Lakes CoastWatchProgram at the NOAA, Great Lakes Environmental Research Laboratory.
66 Plattner et al.
FIG
.2.
Top:
Con
tou
rpl
otof
dail
yse
asu
rfac
ete
mpe
ratu
re(S
ST
)h
isto
gram
s,so
uth
ern
Lak
eM
ich
igan
,19
98.
Th
egr
een
lin
eis
the
med
ian
ofS
ST
and
the
blac
kli
ne
repr
esen
tsth
ecl
assi
fica
tion
thre
shol
d(T
med
ian–4
°C).
Mid
dle:
Plo
tof
Tm
edia
n–T
min
:th
edo
tted
hor
izon
-ta
llin
eis
the
clas
sifi
cati
onth
resh
old
(4°C
).V
alu
esex
ceed
ing
the
clas
sifi
cati
onth
resh
old
deli
nea
tean
upw
elli
ng
even
t.B
otto
m:
Nu
mbe
rof
pixe
lsin
the
GL
SE
Ach
artw
her
eth
resh
old
isex
ceed
ed(u
pwel
lin
gar
ea).
Coastal Upwelling Events in Lake Michigan 67
masking problems, and erroneously classified areaswhich occurred in some rare cases. Figure 4c–d isan example of the three regions in Lake Michiganand a classified upwelling area.
Upwelling Statistics
Using our classification scheme, we determinedthe location, frequency, duration, extent, and mag-nitude of upwelling events in any given year. Fre-quency is simply the number of upwelling eventsoccurring in each of the regions per year. Durationof the upwelling event is the number of days theupwelling event was detectable. Extent is the maxi-mum area occupied by the upwelling. Magnitude isdefined as the difference between the median watersurface temperature of the region and the minimumwater surface temperature within the upwelling
area. Since a threshold of Tmedian – 4°C was used toclassify the areas of upwelling events, the magni-tude of an event had to be at least 4°C in order to bedetected.
Relationship between Wind Properties and Upwelling
We used wind data with our classified upwellingevents to identify meteorological conditions thatwould likely create an upwelling event. Wind data(hourly speed and direction) were available fromNDBC buoys 45007 (southern Lake Michigan,42.67N, 87.02W) and 45002 (northern Lake Michi-gan, 45.31N, 86.42W). These buoys have providedhourly meteorological data since 1979 and 1981, re-spectively. We selected these two buoys becausethey are located in the middle of the southern and
FIG. 3. Histogram of GLSEA SST map, central Lake Michigan, of 2 August 1993. The shape of this his-togram is typical of upwelling events during the stratified period of the lake. The upwelling leads to a sig-nificant drop of the minimum temperature as well as to a broadening of the histogram.
68 Plattner et al.
northern regions, and because other meteorologicalstations (airports or Coast Guard stations) werefound to provide less representative data, and at ir-regular intervals, which made them unsuitable for along-term comparison between 1992 and 2000.These wind data were then classified into two cate-gories:
Class A: 5 days prior to an upwelling event, withthe fifth day consisting of the first dayof the classified upwelling.
Class B: All other days during the detectable up-welling season that showed no up-welling event, and days not within the5-day window prior to an upwelling.
To determine the probability that an upwellingevent will occur, we first weighted wind velocity bydirection for both categories of wind. Differentialdirection polar histograms (polar plots) of each re-gion were normalized by their maximum:
where np is the number of hours at a certain direc-tion-weighted wind speed during all pre-upwellingperiods (class A), and ntotal is the total number ofhours at the same direction-weighted wind speedduring all non-upwelling periods of the season,including all pre-upwelling periods (class A + classB).
RESULTS
Upwelling Season
The first detectable upwelling event of the ther-mally stratified season generally occurred betweenthe end of June and the end of July, but was as lateas the beginning of August (Table 1). The de-tectable upwelling season usually ended during No-vember; but in some cases, upwelling events couldbe observed in early December. The average dura-tion of the upwelling season (i.e., duration of thethermal stratification) was about 132 days (~4.5months), but ranged from 109 days (~3.5 months)to 171 days (~5.5 months) (Table 1).
Frequency and Location
Frequency of upwelling events ranged from twoto eight per year and averaged about five per year
FIG. 4. a) SST of Lake Michigan on 2 August 1993. b) Mask for southern, central and north-ern Lake Michigan. c) Mask applied to SST map. d) Upwelling areas (white), classified foreach section independently.
dirfactor dirf dir
f( )
( )
max
=
where f(dir) is the frequency of each wind direction(1-degree steps), and fmax is the highest frequencyof a wind direction. The probability that an up-welling event would occur based on the wind datawas then determined by
Pn
np
total
=
Coastal Upwelling Events in Lake Michigan 69
TABLE 1. Upwelling season, i.e., period when the lake is completely stratified [beginning and endingdates (month/day), duration (days)], total number of days of upwelling by region, and percent of theupwelling season with upwelling events in Lake Michigan from 1992–2000.
% of seasonYear Begin End Days South Central North East West Lake Wide w/ upwelling
for the 9-year period (Table 2). Regionally, up-welling events occurred in each of our predefinedregions (southern, central, and northern) and on thewestern and the eastern shorelines of the lake.Greatest percentage (57%) of upwelling events oc-curred on the western shoreline of Lake Michigan,with 92% of all of these events partly or entirelywithin the central region. In contrast, 89% of alleast coast upwelling were found partly or entirelyin the southern region. For the northern region, onlyone upwelling event was classified on the easternshoreline for the entire 9-year period. Regions mostlikely to show an upwelling were Milwaukee toDoor Peninsula on the western shore, andMuskegon to Frankfort on the eastern shore. Re-gardless of the coast (west or east), the southernpart of Lake Michigan showed the highest percent-
age of upwelling events with 80% of all upwellingsaffecting this region, followed by the central (78%)and then northern areas (34%) (Table 2).
Duration
Total number of upwelling days ranged from 40to 102 and averaged about 77 days per year (Table3), representing 31%–71% (mean = 59%) of the up-welling season (Table 1). The western shorelinetended to have a greater number of days per year,averaging about 59 days (range: 21–95 days), com-pared to the eastern shoreline, which averagedabout 18 days per year (range: 5–34 days). Durationof a single upwelling event also varied among yearsand regions, averaging about 16 days per event(range: 2–78 days) (Table 3). Upwelling events oc-
70 Plattner et al.
curred for a greater duration on the western shore-line, averaging about 21 days per event (range:3–78 days), compared to the eastern shorelinewhich averaged about 9 days per event (range: 2–24days). Duration of a single event was similar acrossthe south, central, and northern zones (mean range14–18 days).
Extent
The extent (maximum area) of the classified up-welling events varied among regions and years(Table 4). The range of maximum annual extentalong the western coast (33–5,095 km2) was similarto that of the eastern shore (27–5,671 km2), but thegreatest mean extent was almost three times higher
TABLE 3. Mean duration of upwelling events (minimum, maximum) by region for Lake Michigan from1992–2000 where duration is number of days an upwelling event is observed.
TABLE 4. Mean extent (km2) of an upwelling event (minimum, maximum) by region for Lake Michiganfrom 1992–2000 where extent is measured at the greatest area (km2) of an upwelling event. Italic num-bers: percent of region area (south, central, north) or entire lake area (east, west, lake wide).
along the western coast (1,456 km2) compared tothe eastern coast (580 km2). Mean maximum extentof upwelling events for the 9-year period was simi-lar in the southern (618 km2) and central (619 km2)basins, with the extent of upwelling in the northernbasin being slightly greater (660 km2). The meanextent of all upwelling events in Lake Michiganfrom 1992 to 2000 was 1,078 km2.
Magnitude
Magnitude (maximum difference of temperatureto the median) of upwelling events varied from aminimum of 4°C (by definition) to a maximum of12.4°C, with the greatest mean magnitude (7.1°C)occurring along the western shoreline, and the high-est peak magnitude (12.4°C) occurring along theeastern shoreline (Table 5). Maximum mean magni-tude of upwelling events was greatest in the south-ern basin relative to the central and northern basin.The mean magnitude of all upwelling events inLake Michigan for the whole period was 6.6°C.
Wind Conditions
For the western shore, upwelling events werepreceded by 4 days of southerly and west-to-north-westerly winds (Fig. 5), while upwelling events oc-curring along the eastern shore were preceded byfour days of northerly winds (Fig. 6). The probabil-ity of an upwelling event occurring was a functionof the direction-weighted wind speed (Fig. 7). Thesouthern buoy (45007) shows better results, reach-ing a 100% upwelling probability at directionweighted wind speeds of 11 m s–1 for the westernshore. Probability for the east coast reaches 73% at11 m s–1 and 100% at 13 m s–1.
DISCUSSION
Thermal satellite imagery products of the Coast-Watch program offer the opportunity for a synopticview of the lake surface at a high resolution on adaily basis. In contrast to thermal in situ data, itrepresents the only means to measure the extent ofshort-term, local features of water surface tempera-ture (e.g., upwelling events) in the Great Lakes.However, there are limitations. A spatial resolutionof 2.6 km2 is sufficient to detect medium to largesized upwelling events, but smaller events, occur-ring as a narrow strip of cold water close to theshore, will likely be missed.
Temporal resolution is another limitation. In prin-ciple, the daily resolution of the GLSEA charts issufficient for detecting upwelling events with dura-tion of at least 1 day. However, in the compositingprocess, which combines satellite image data for 5days in order to smooth transitions from cloudy toclear conditions (Schwab et al. 1999), the temporalresolution can deteriorate. During long periods ofcloud cover over the lake, temporal resolution de-creases, so that even events with duration of severaldays can be missed. However, this is more likely tooccur in the spring and fall, outside the upwellingseason. For example, at the end of the year 2000,two of these situations, with duration of more than20 days, occurred. There, according to the GLSEAcharts, water surface temperature maintained a levelof 11–14°C until the beginning of December, erro-neously prolonging the season of potentially de-tectable upwelling. The supposed end of the seasonwas empirically corrected to Julian day 310 (5 No-vember).
The upwelling season was limited and variableamong years. The beginning of this period is deter-mined by the progression rate of the thermal bar,
TABLE 5. Mean magnitude (°C) of upwelling events (maximum) by region forLake Michigan 1992–2000. Only maximum magnitude is shown in the parenthesisas the minimum is always 4°C, see text for details.
when the lake warms from the coast toward thecenter during spring. Steep temperature gradientsand smaller areas of remaining cold water in thecenter of the lake would lead to a false classifica-tion if the temperature index alone is used and novisual examination of the automatically classified
areas is made. However, a certain state of stratifica-tion, with an already developed thermocline andwarmer surface temperatures, is needed to meet therequirements for the emergence of upwelling. Typi-cally, the upwelling season ends in November,which is the typical time for the fall turnover. Dur-
FIG. 5. Polar diagrams of wind directions during upwelling seasons for years 1992–2000. Class A, 0–4days before upwelling; Class B, days with no upwelling and at least 5 days prior to an upwelling. Unit:directional hours per day (hd/d). For class definitions see text.
Coastal Upwelling Events in Lake Michigan 73
ing many years, fall turnover is driven by an ex-tended upwelling at the western shore of LakeMichigan. As a result, the decline of the surfacetemperature progresses from west to east in theseyears. The end of the upwelling season is definedwhen the median temperature difference betweensurface waters and hypolimnetic waters falls below4°C.
The majority of coastal upwellings in LakeMichigan during the study period occurred on thewestern coast. The average duration and mean ex-tent of upwellings were almost three times higheron the west coast than the east coast. The differencein average durations between the western and east-ern coast would have been even higher if not for asingle extended upwelling event that occurred in
1996 on the northeastern shore, where this phenom-enon seems to be unusual.
Care must be exercised when interpreting the up-welling statistics. For example, there was an appar-ent long duration upwelling event of 78 days in1992. Note that the 78-day upwelling event did notoccur at the same position for the entire 78 days.Rather, it first developed in the northern part of thelake (Door Peninsula) and slowly migrated south-ward. The process then spread from west to eastand was classified as an upelling given that thewarmer surface water at the eastern part of the lakekept the median temperature of the entire lake suffi-ciently high. A clear delineation of the initial up-welling and the breakdown of the stratification isnot possible. This leads to the classification of thisvery long upwelling event (see 1992 GLSEA
FIG. 6. Polar diagrams of wind directions during upwelling seasons for years 1992–2000. Class A, 0–4days before upwelling; Class B, days with no upwelling and at least 5 days prior to an upwelling. Unit:directional hours per day (hd/d). For class definitions see text
Another uncommon event was observed in Au-gust 1994 at the northernmost tip of Lake Michi-gan. This upwelling extended from the mouth ofGreen Bay along the shoreline of Michigan’s UpperPeninsula and continued at the northern coast ofLake Huron, where it reached its maximum extent.The upwelling was likely caused by continuouswinds from the west and northwest directions. Pre-dominant winds in that area during August werewesterly with several north westerly events duringthe month. In spite of the fact that upwellings at theeastern and western coast are caused by winds fromopposite directions, upwellings in the GLSEA im-agery may appear on the same day at both the east-ern and western shores. This is the case if winddirection changes by 180° degrees and a new up-welling occurs at the opposite coast before the pre-ceding upwelling has entirely disappeared.
The magnitude of upwelling events observed inthe southern basin tended to be greater than in thenorthern basin because the lake surface in southernLake Michigan is typically warmer than in thenorth, while the temperature of the hypolimnium is
more balanced over the extent of the lake. For thesame reason, upwellings during periods with highersurface temperatures (late July, August, early Sep-tember) had higher magnitudes than those in earlysummer and fall. Finally, the longer upwellingevents tended to show higher magnitudes, althoughthe larger areas of cold water in these situations ledto a lower median surface temperature and thus, toa potentially lower magnitude, as it is defined asTmedian–Tmin . Therefore a positive correlation be-tween duration, extent, and magnitude usually ex-ists.
Years with a lower upwelling frequency gener-ally tended to show higher mean durations of singleevents. During the period from 1992 to 2000, 1992was the year with the lowest frequency but with thehighest average duration. Attempts to use wind datafrom NDBC buoys 45007 and 45002 to forecast up-wellings or to infer possible missed upwellings inthe GLSEA classification for the years 1992 to2000 turned out to be very difficult. Although highwind speeds of more than 10 m s-1 may increase theupwelling probability to values near 100%, this re-sult has to be regarded critically and carefully. Sta-tistically, these high probabilities are based on 10 or
FIG. 7. Probability of coastal upwelling event occurring as a function of direction-weighted wind speed(solid lines), for western and eastern coast of Lake Michigan. Dotted lines show the cumulative distribu-tion of percentage of upwelling events that are preceded by winds of that speed. Data from Buoys 45007and 45002 are compared.
Coastal Upwelling Events in Lake Michigan 75
fewer wind events at that speed during the 9-yearperiod. As a result, the probabilities in Figure 7start to swing heavily at their upper end, as thenumber of available samples decreases.
Reliable forecast of upwellings using wind datawas impeded by the high variability in wind veloc-ity, direction, and duration. Situations with rela-tively stable wind speeds from constant directionswere found in pre-upwelling periods, but were rare.Instead, highly variable velocities combined withunsteady directions were found in these periods aswell. An attempt to lower the adverse effect of thishigh variability on the predictability of upwellingevents was made by averaging wind speeds overdifferent time intervals from 6 to 72 hours, but didnot lead to better results. For averaging, mean, me-dian, and maximum values of velocity were usedalternatively. In addition, the distribution of vari-ance of wind directions in pre-upwelling and non-upwelling periods was examined, showing nosufficient correlation with pre-upwelling situationsto improve the predictability.
Our inability to determine the exact time of an up-welling from daily GLSEA charts may have affectedour ability to forecast upwelling from wind data.Since upwellings and their causal meteorologicalconditions may operate over the time scale of hours,and the GLSEA charts depict conditions of the lakesurface integrated over 24 hours, our attempts tocondense these charts with wind data to forecast up-wellings may have been adversely affected. How-ever, defining the pre-upwelling class (class A) as a5-day period prior to the GLSEA-derived startingdays (4 days prior to and the first day when the up-welling can be seen in the GLSEA charts) turned outto give the highest correlation. Presumably, a moreaccurate determination of the start time of eachevent might make upwellings more predictable.Using the near real-time AVHRR satellite imagery,available four to six times daily, could help deter-mine a more accurate start time for each event if thecoastal areas of interest are cloud free.
Since wind conditions are highly variable both inspeed and direction, it is still unclear how durationof winds with a certain speed and direction affectupwellings. High wind speeds of more than 10 m s–1, prevailing for a few hours can cause up-wellings, as can winds of a lower velocity butlonger duration—as long as they continue to blowfrom directions likely to cause coastal upwelling.Reasonable explanations of the cause of an up-welling are possible in many cases by interpretingthe time series of wind speed and direction. But in
most situations, the high variability in wind speed,direction, and duration makes it difficult to use astatistical approach to determine which wind condi-tions reliably cause upwellings. As mentioned ear-lier, our attempts to use averaged wind speeds todecrease the influence of variability did not in-crease the predictability of upwelling. However, theresults confirm the dependence of upwelling eventson higher wind speeds (Fig. 7) and certain wind di-rections (Figs. 6 and 7), which correspond withthose mentioned by Mortimer (1971). Upwellingson the western shore seem not only to be caused bysoutherly winds, but also by winds from westerly tonorthwesterly directions. In eastern Lake Michigan,the relation between northerly winds and up-wellings is very distinct.
Due to the derived results, it is assumed that asufficient temporal resolution and accuracy of inputdata are indispensable for improving the pre-dictability of upwelling events, since the high vari-ability in wind speed and direction makes itdifficult to predict upwellings using a statistical ap-proach. To more accurately determine the start ofthe GLSEA-derived upwellings, it would be usefulto use near real-time AVHRR data, routinely avail-able from two NOAA weather satellites (four or-bits) or in situ measurements of water temperatures.Hourly data, or at least four measurements per day, are recommended to achieve the necessaryaccuracy.
The use of wind data from meteorological sta-tions located on the shore of Lake Michigan mayraise the predictability of upwellings on a morelocal scale. Using wind data from NDBC buoys45007 and 45002 led to a more accurate predictionof upwellings on the entire western or eastern shoreof Lake Michigan, but performed worse in zonal(north, central, and south) correlations. Since windspeed and direction at the coast may show high de-viations from those measured by the buoys, but aresupposed to be responsible for local upwellingevents at the adjacent section of the shore, thiscould improve predictability on a more local scale.Again, continuous measurements of wind with suf-ficient spatial and temporal resolution are neededduring the entire upwelling season. Satellite scat-terometer derived winds (measured twice daily)(Nghiem et al. 2004) and modeled winds could pro-vide the wind data to help improve the forecast ofupwelling events by improving the accuracy andfrequency of over water wind data.
The ultimate predictive tool for forecasting ther-mal structure in the lake is a three dimensional nu-
76 Plattner et al.
merical hydrodynamic model, such as the PrincetonOcean Model which is used in the Great LakesCoastal Forecasting System (Schwab and Bedford1999). In this type of model, numerical weatherforecasts are used to drive a lake circulation modelto predict currents and three dimensional tempera-ture structures up to three days in advance. Thistype of system is still in development, but holdsconsiderable promise for operational forecasting ofupwelling events.
ACKNOWLEDGMENTS
We thank two anonymous reviewers for helpfulcomments and suggestions on the manuscript. Thiswork was funded by the National Oceanic and At-mospheric Administration (NOAA) Great LakesEnvironmental Research Laboratory (GLERL) andthe Cooperative Institute for Limnology andEcosystems Research (CILER) at the University ofMichigan as part of the Summer Student Fellow-ship Program. Daily GLSEA composite tempera-ture charts as well as the near real-time AVHRRsatellite images of the Great Lakes are available onthe CoastWatch Great Lakes web site athttp://coastwatch.glerl.noaa.gov. This is contribu-tion number 1374 of the NOAA Great Lakes Envi-ronmental Research Laboratory.
REFERENCESBarton, D.R. 1986. Nearshore benthic invertebrates of
the Ontario waters of Lake Ontario. J. Great LakesRes. 12:270–280.
Bolgrien, D.W., and Brooks, A.S. 1992. Analysis ofthermal features of Lake Michigan from AVHRRsatellite images. J. Great Lakes Res. 18:259–266.
Dunstall, T.G., Carter, J.C.H., Monroe, G.T., Weiler,R.R., and Hopkins, G.J. 1990. Influence ofupwellings, storms, and generation station operationon water chemistry and plankton in the Nanticokeregion of Long Point Bay, Lake Erie. Can. J. Fish.Aquat. Sci. 47:1434–1445.
Fitzsimons, J.D., Perkins, D.L., and Kruger, C.C. 2002.Sculpins and crayfish in lake trout spawning areas inLake Ontario: estimates of abundance and egg preda-
tion on lake trout eggs. J. Great Lakes. Res .28:421–436.
Haffner, G.D., Yallop, M.L., Hebert, D.N., and Griffiths,M. 1984. Ecological significance of upwelling eventsin Lake Ontario. J. Great Lakes. Res. 10:28–37.
Heufelder, G.R., Jude, D.J., and Tesar, F.J. 1982. Effectsof upwelling on local abundance and distribution oflarval alewife (Alosa pseudoharengus) in eastern LakeMichigan. Can. J. Fish. Aquat. Sci. 39:1531–1537.
Kilgour, B.W., Baily, R.C., and Howell, E.T. 2000. Fac-tors influencing changes in the nearshore benthiccommunity on the Canadian side of Lake Ontario. J.Great Lakes. Res. 26:272–286.
Leshkevich, G.A., Schwab, D.J., and Muhr, G.C. 1992.Satellite environmental monitoring of the GreatLakes: A review of NOAA’s Great Lakes CoastWatchprogram. Photogrammetric Eng. and Remote Sensing59:371–379.
Megard, R.O., Kuns, M.M., Whiteside, M.C., and Down-ing, J.A. 1997. Spatial distributions of zooplanktonduring a coastal upwelling in western Lake Superior.Limnol. Oceanogr. 42:827–840.
Mortimer, C.H. 1971. Large-scale oscillatory motionsand seasonal temperature changes in Lake Michiganand Lake Ontario, Parts I and II. Special report No.12, University of Wisconsin-Milwaukee, Center forGreat Lakes Studies.
Nalepa, T.F., Hartson, D.J., Buchanan, J., Caveletto, J.F.,Lang, G.A., and Lozano, S.J. 2000. Spatial variationin density, mean size and physiological condition ofthe holarctic amphipod Diporeia spp. in Lake Michi-gan. Freshwater Biol. 43:107–119.
Nghiem, S.V., Leshkevich, G.A., and Stiles, B.W. 2004.Wind fields over the Great Lakes measured by theSeaWinds scatterometer on the QuikSCAT satellite. J.Great Lakes Res. 30(1):148–165.
Schwab, D.J., and Bedford, K.W. 1999. The Great LakesForecasting System. In Coastal Ocean Prediction,Coastal and Estuarine Studies 56, eds. C.N.K. Moo-ers, pp. 157–173. American Geophysical Union,Washington DC.
Schwab, D.J., Leshkevich, G.A., and Muhr, G.C. 1999.Automated mapping of surface water temperature inthe Great Lakes. J. Great Lakes Res. 25:468–481.
Submitted: 22 August 2004Accepted: 11 November 2005Editorial handling: Joseph V. DePinto