Chapter 4 Ozone Concentrations............................................................................................................... 26 National Ambient Air Quality Standards for Ozone ................................................................... 27 Eight-Hour Ozone Concentrations .............................................................................................. 28 Sixteen-Year Trends ................................................................................................................... 30 Nitrogen Oxides and Ozone........................................................................................................ 32 Trends in Ozone Concentrations along the Washington, D.C. to Coastal Maine Corridor......... 36
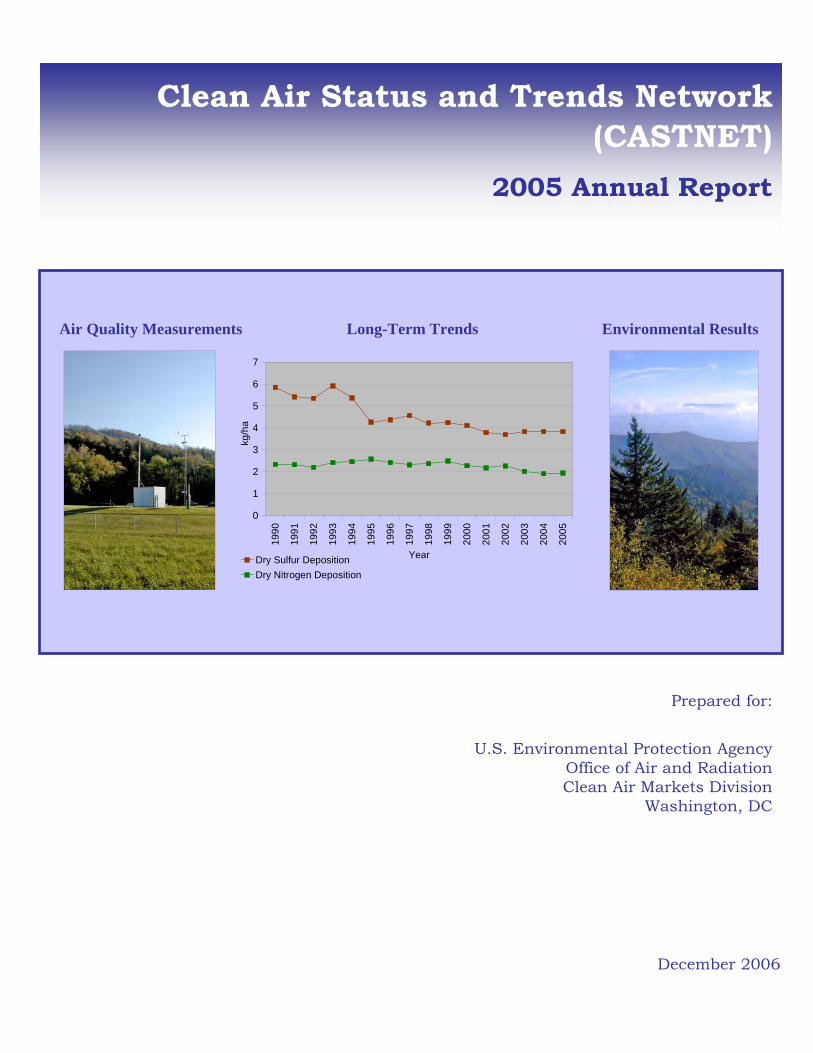
References .................................................................................................................................................. R-1 Appendix A Significant Events During 2005 Appendix B Locational and Operational Characteristics of CASTNET Sites Appendix C Acronyms and Abbreviations On the cover: The site pictured is Parsons, WV (PAR107). The graph depicts mean dry deposition values from the 34 CASTNET reference sites (see page 7).
CASTNET Annual Report – 2005 - ii - Executive Summary
Executive Summary Created by the Environmental Protection Agency (EPA) to establish long-term monitoring of air quality and meteorological conditions in rural areas, the Clean Air Status and Trends Network (CASTNET) began operation in 1991. CASTNET measures rural, regionally representative concentrations of sulfur and nitrogen species and ozone in order to evaluate the effectiveness of national and regional air pollution control programs.
Key Results through 2005 ♦ Mean annual sulfur dioxide (SO
2) and particulate sulfate (SO2-4) concentrations aggregated
over the 34 eastern reference sites have declined significantly over the 16-year period 1990 through 2005.
♦ Over the 16-year period, wet, dry, and total deposition of atmospheric sulfur have declined.
♦ Mean annual concentrations of total nitrate (nitric acid plus particulate nitrate) showed almost no change from 1990 through 2000. Since then, total nitrate has declined approximately 10 percent.
♦ Estimates of wet, dry, and total nitrogen deposition show no significant trend over the 16 years. However, the data suggest a slight decline in dry nitrogen deposition and in mean nitrogen concentrations in precipitation since 1999.
♦ The median fourth highest daily maximum 8-hour ozone concentration for 2005 was the second lowest in the history of the network despite the return to normal weather conditions during the ozone season. The recent decline in rural ozone and nitrate levels has been attributed to the documented decline in nitrogen oxides (NOx) emissions as well as weather conditions. Nitrogen oxides emissions in the eastern United States have declined over the last several years because of the Acid Rain Program, EPA’s NOx State Implementation Plan (SIP) Call, and several other NOx control programs.
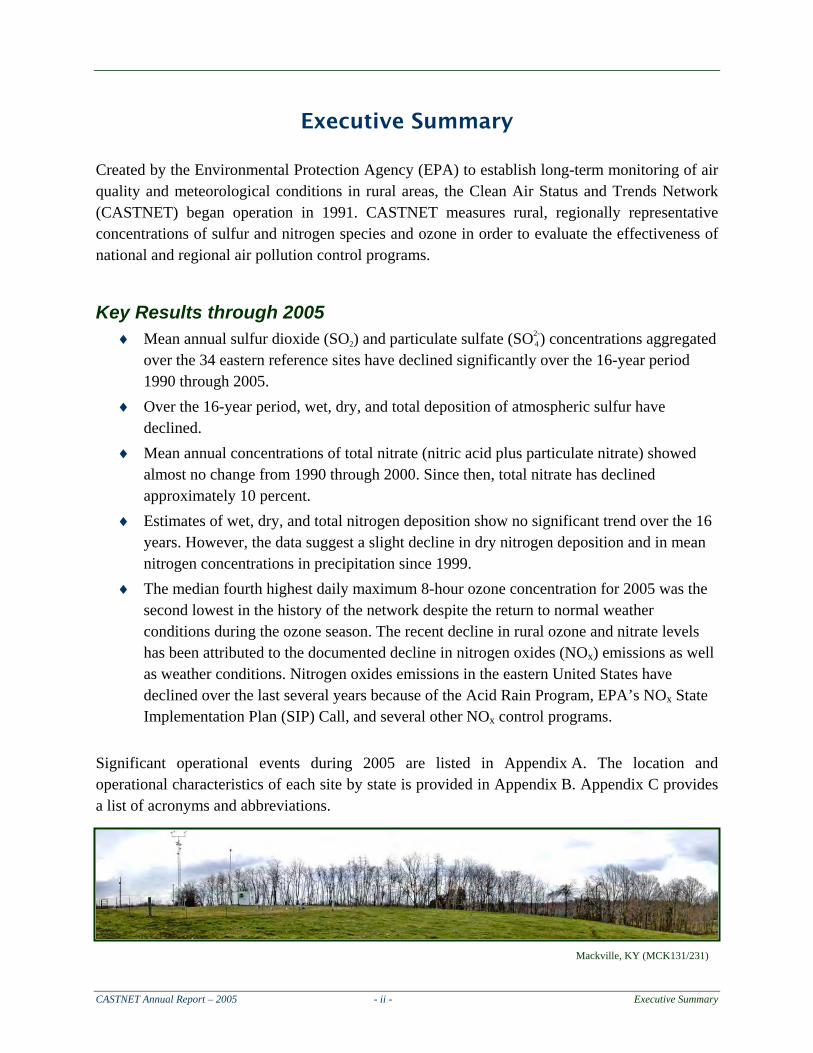
Significant operational events during 2005 are listed in Appendix A. The location and operational characteristics of each site by state is provided in Appendix B. Appendix C provides a list of acronyms and abbreviations.
Mackville, KY (MCK131/231)
CASTNET Annual Report – 2005 - iii - Executive Summary
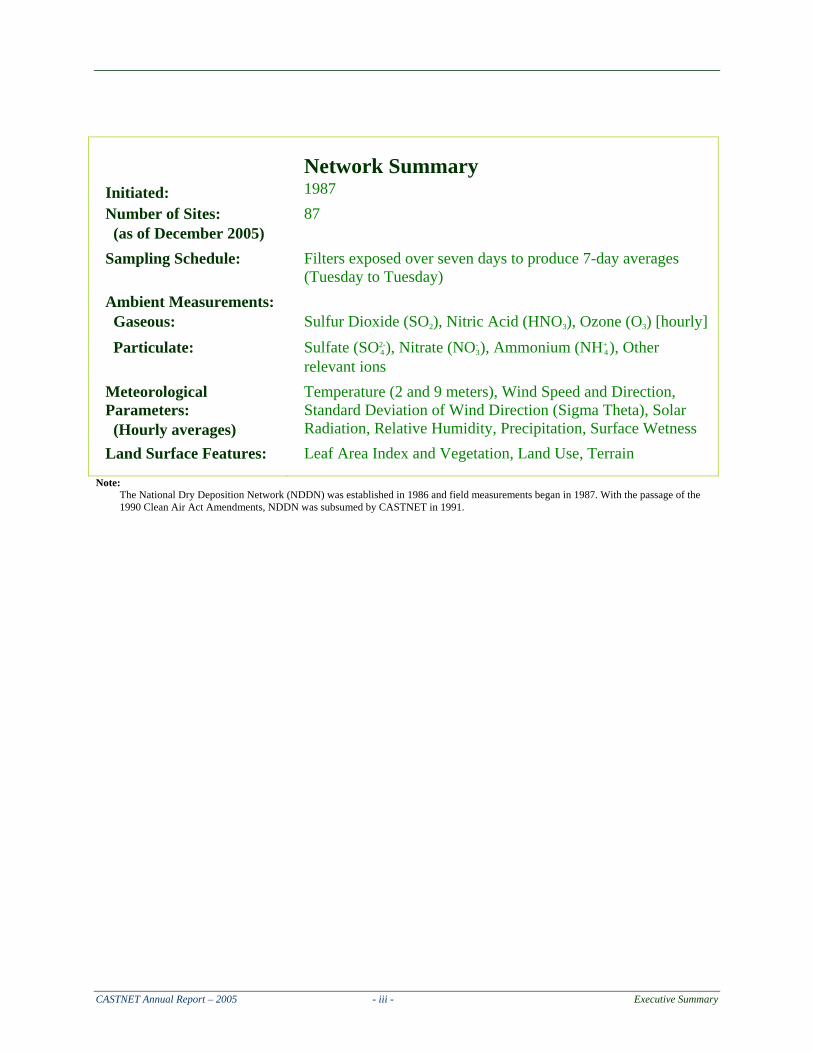
Initiated:
Network Summary 1987
Number of Sites: (as of December 2005)
87
Sampling Schedule: Filters exposed over seven days to produce 7-day averages (Tuesday to Tuesday)
Ambient Measurements: Gaseous:
Sulfur Dioxide (SO
2), Nitric Acid (HNO 3), Ozone (O
3) [hourly] Particulate: Sulfate (SO2-
4), Nitrate (NO- 3), Ammonium (NH+
4), Other relevant ions
Meteorological Parameters: (Hourly averages)
Temperature (2 and 9 meters), Wind Speed and Direction, Standard Deviation of Wind Direction (Sigma Theta), Solar Radiation, Relative Humidity, Precipitation, Surface Wetness
Land Surface Features: Leaf Area Index and Vegetation, Land Use, Terrain
Note: The National Dry Deposition Network (NDDN) was established in 1986 and field measurements began in 1987. With the passage of the
1990 Clean Air Act Amendments, NDDN was subsumed by CASTNET in 1991.
The CASTNET database is available to the public via EPA’s CASTNET data web page: www.epa.gov/castnet/data.
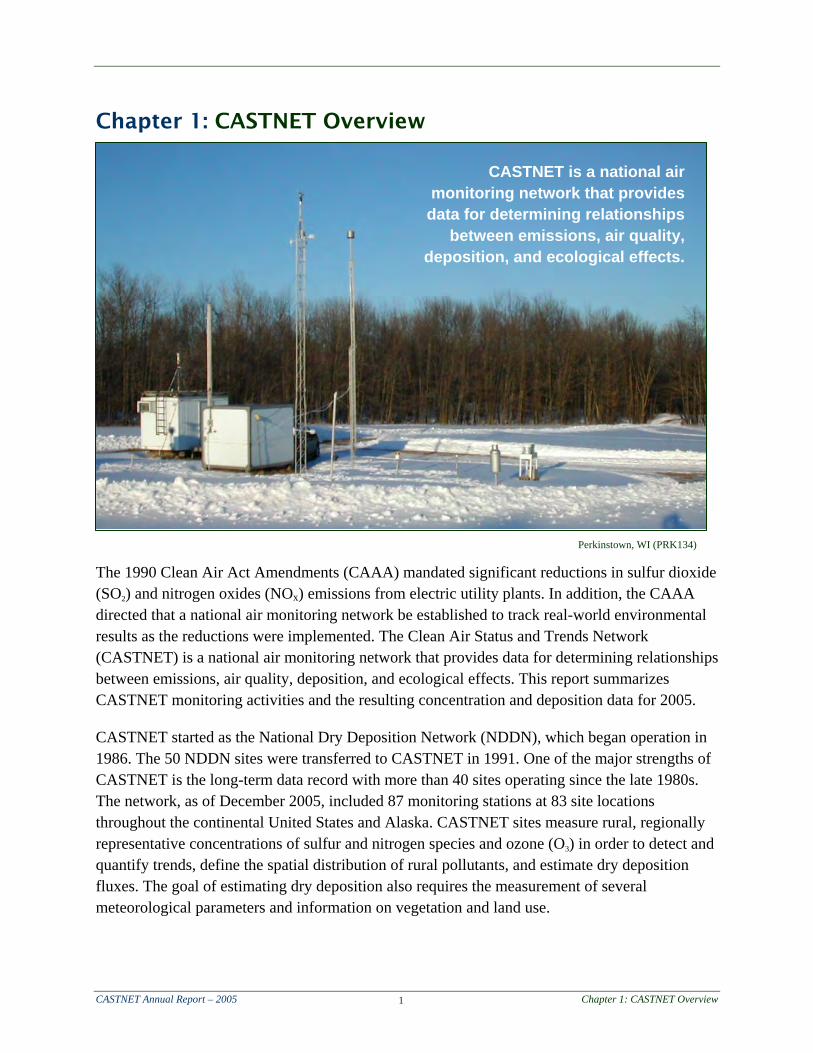
The 1990 Clean Air Act Amendments (CAAA) mandated significant reductions in sulfur dioxide (SO
2) and nitrogen oxides (NOx) emissions from electric utility plants. In addition, the CAAA directed that a national air monitoring network be established to track real-world environmental results as the reductions were implemented. The Clean Air Status and Trends Network (CASTNET) is a national air monitoring network that provides data for determining relationships between emissions, air quality, deposition, and ecological effects. This report summarizes CASTNET monitoring activities and the resulting concentration and deposition data for 2005.
CASTNET started as the National Dry Deposition Network (NDDN), which began operation in 1986. The 50 NDDN sites were transferred to CASTNET in 1991. One of the major strengths of CASTNET is the long-term data record with more than 40 sites operating since the late 1980s. The network, as of December 2005, included 87 monitoring stations at 83 site locations throughout the continental United States and Alaska. CASTNET sites measure rural, regionally representative concentrations of sulfur and nitrogen species and ozone (O
3) in order to detect and quantify trends, define the spatial distribution of rural pollutants, and estimate dry deposition fluxes. The goal of estimating dry deposition also requires the measurement of several meteorological parameters and information on vegetation and land use.
CASTNET is a national air monitoring network that provides
data for determining relationships between emissions, air quality,
To satisfy the CASTNET objectives and to support the investigation of the relationships between emissions and concentrations/depositions, efforts were made to select regionally representative sites, especially in the eastern United States. "Regionally representative" refers to the overall similarity – in terms of air pollutant concentrations and land use – of the site to a characteristic area, typically 100 kilometers (km) by 100 km, surrounding the site. For the western United States, the limited number of sites and higher geographic diversity preclude rigorous determination of spatial patterns. Therefore, site selection focused on locations where specific research issues could be addressed and where natural resources were at risk (e.g., national parks).
CASTNET is sponsored by the Environmental Protection Agency (EPA) and the National Park Service (NPS). NPS began its participation in CASTNET in 1994 under an agreement with EPA. NPS is responsible for the protection and enhancement of air quality and related values in national parks and wilderness areas. The number of NPS-sponsored CASTNET sites was 27 as of the end of 2005. In addition to EPA and NPS, the principal sponsors, CASTNET operates in partnership with other rural long-term monitoring networks:
♦ National Atmospheric Deposition Program/National Trends Network (NADP/NTN) operates monitoring stations with wet deposition samplers to measure the concentrations and deposition rates of air pollutants that are removed from the atmosphere by precipitation. NADP/NTN operates wet deposition samplers at or near virtually every CASTNET site.
♦ The Canadian Air and Precipitation Monitoring Network (CAPMoN) operates 28 measurement sites throughout Canada and one in the United States. CASTNET and CAPMoN both operate samplers at monitoring stations in Ontario, Canada and also at Pennsylvania State University.
♦ The Interagency Monitoring of Protected Visual Environments (IMPROVE) measures aerosol pollutants near more than 30 CASTNET sites. IMPROVE measures particulate air pollutants that affect visibility and visual air quality.
♦ Mercury Deposition Network (MDN) samplers are operated at multiple CASTNET sites. MDN samplers measure mercury in precipitation.
State agencies also operate special purpose air pollutant measurement devices at some CASTNET sites. EPA uses CASTNET in conjunction with these other long-term monitoring networks to assess the effectiveness of national and regional air pollution control programs. Additional information, previous annual reports, and other CASTNET documents can be found on the EPA Web site, www.epa.gov/castnet. The CASTNET database is also available to the public by accessing the "Data" link on EPA's CASTNET Web page. The Web site provides archives of the concentration and deposition data. Fully validated data are generally available approximately ten months following collection.
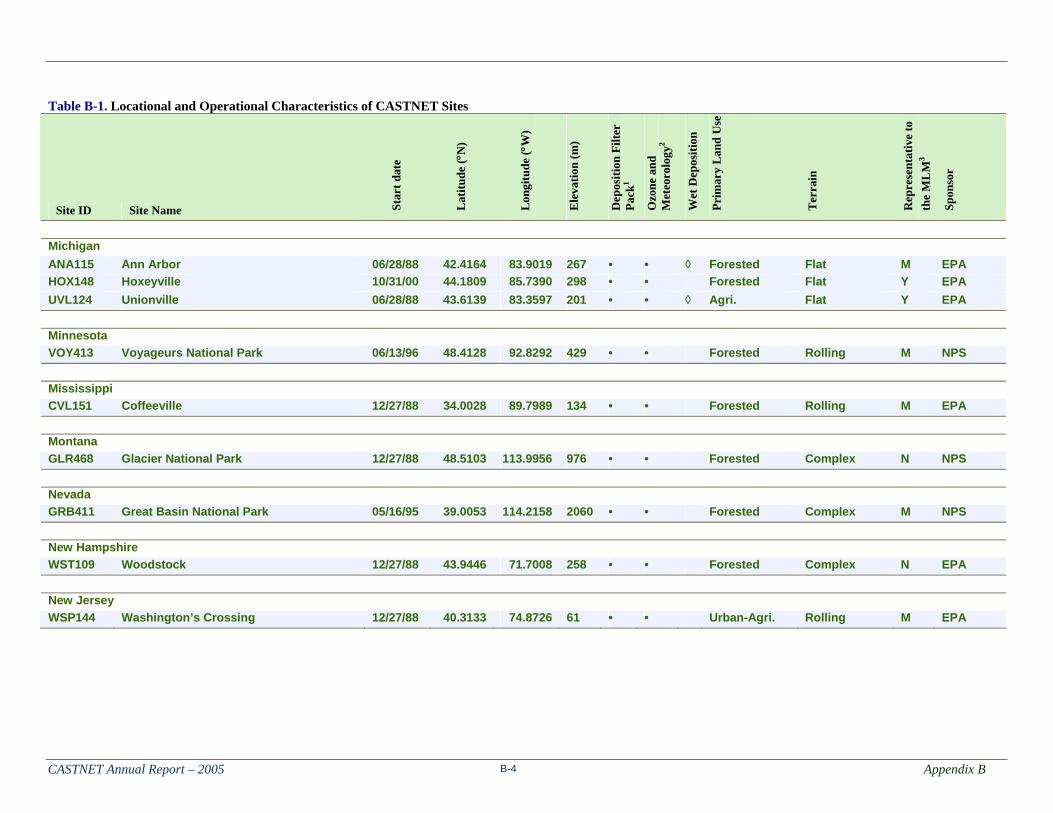
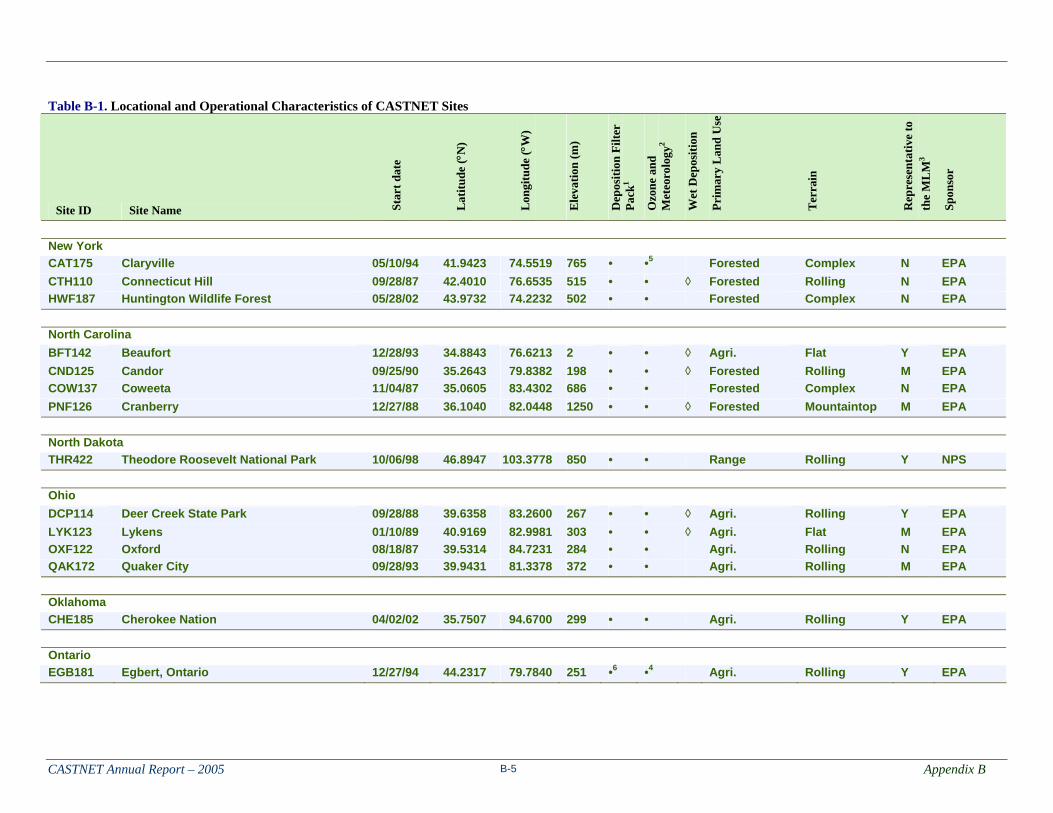
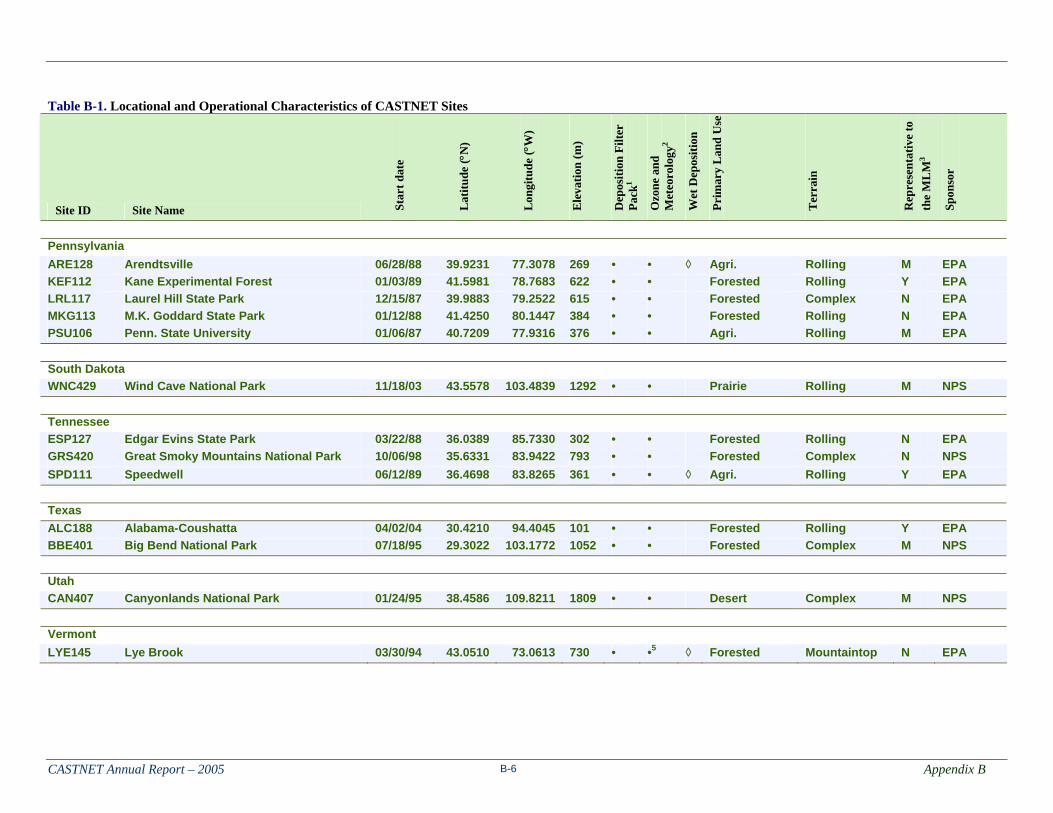
Figure 1-1 shows the locations of CASTNET monitoring sites as of December 2005. Eighty-seven sites were operational at 83 distinct locations. Most CASTNET sites are located in rural or remote locations away from pollution emission sources and heavily populated areas. Appendix B provides the location and operational characteristics of each site by state, including information on start date, latitude, longitude, elevation, and the types of measurements taken at each site. For the purposes of this report, CASTNET sites are called “western” or “eastern” depending on whether they are west or east of 100 degrees west longitude. The line runs north to south dividing the states of North and South Dakota, Nebraska, Kansas, Oklahoma, and Texas.
CASTNET Monitoring Sites on Tribal Lands Three CASTNET monitoring sites are located on tribal lands as a result of a unique cooperative effort among EPA Headquarters (HQ), EPA Regions, tribal governments, and the Inter-Tribal Environmental Council (ITEC), a non-profit agency which provides member tribes with technical support and training in environmental fields. This collaborative effort has resulted in monitoring sites operating on the tribal lands of the Cherokee Nation in eastern Oklahoma (CHE185), the Alabama-Coushatta in eastern Texas (ALC188), and the Santee Sioux in northern Nebraska (SAN189).
All three tribes initially received grants from EPA Regions 6 and 7 to establish sites and purchase monitoring equipment. EPA Regional staff and ITEC then worked with the local tribal environmental staff to help with the installation of the site, operation of instruments, and the interpretation of results. EPA HQ and Regions continue to support the tribes in the operation, instrument calibration, and maintenance of each site as part of CASTNET.
Having CASTNET monitoring sites on tribal lands provides benefits to both tribes and EPA. For the tribes involved, it enhances their ability to develop and run their own environmental programs that help to protect their communities and environment. Locating these sites on tribal lands also helps EPA (both HQ and Regions) obtain regional data that are used to monitor long-term trends in air pollution and understand the behavior of atmospheric pollutants.
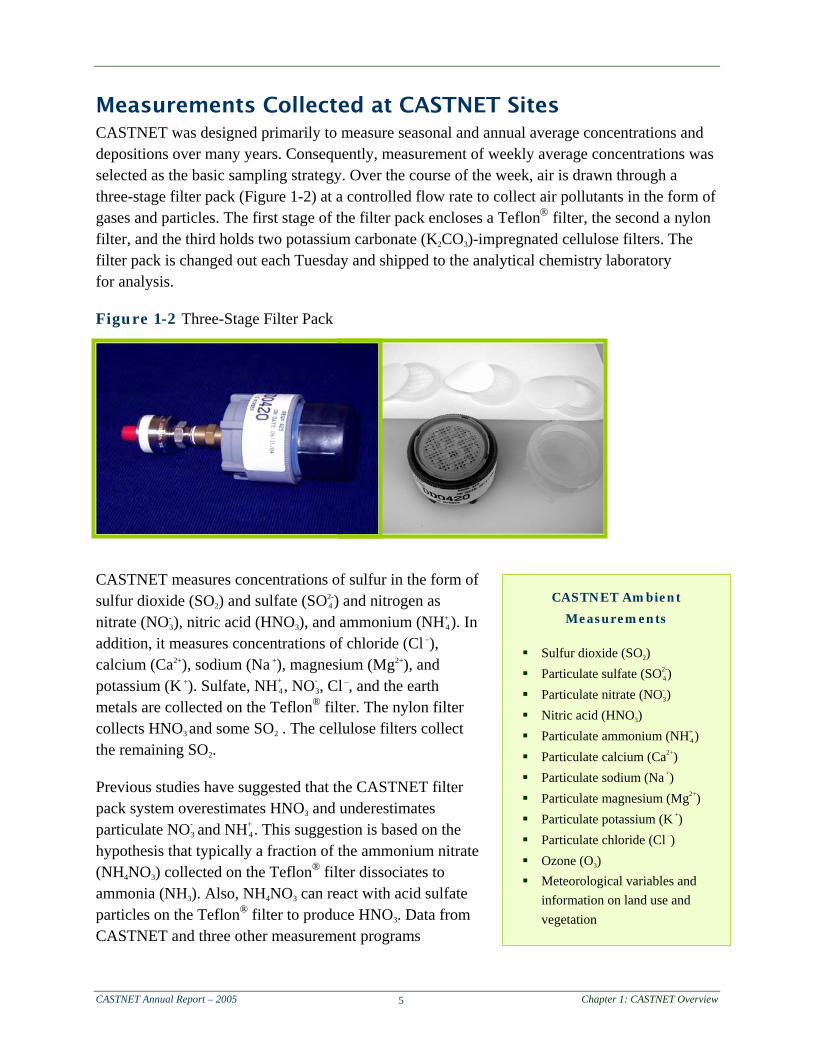
Measurements Collected at CASTNET Sites CASTNET was designed primarily to measure seasonal and annual average concentrations and depositions over many years. Consequently, measurement of weekly average concentrations was selected as the basic sampling strategy. Over the course of the week, air is drawn through a three-stage filter pack (Figure 1-2) at a controlled flow rate to collect air pollutants in the form of gases and particles. The first stage of the filter pack encloses a Teflon® filter, the second a nylon filter, and the third holds two potassium carbonate (K
2CO 3)-impregnated cellulose filters. The
filter pack is changed out each Tuesday and shipped to the analytical chemistry laboratory for analysis.
Figure 1-2 Three-Stage Filter Pack
CASTNET measures concentrations of sulfur in the form of sulfur dioxide (SO
2) and sulfate (SO2-4) and nitrogen as
nitrate (NO- 3), nitric acid (HNO
3), and ammonium (NH+ 4). In
addition, it measures concentrations of chloride (Cl – ),
calcium (Ca2+ ), sodium (Na +
), magnesium (Mg2+ ), and
potassium (K + ). Sulfate, NH+
4 , NO- 3, Cl –
, and the earth metals are collected on the Teflon® filter. The nylon filter collects HNO
3 and some SO 2 . The cellulose filters collect
the remaining SO 2.
Previous studies have suggested that the CASTNET filter pack system overestimates HNO
3 and underestimates particulate NO-
3 and NH+ 4 . This suggestion is based on the
hypothesis that typically a fraction of the ammonium nitrate (NH
4NO 3) collected on the Teflon® filter dissociates to
ammonia (NH 3). Also, NH
4NO 3 can react with acid sulfate
particles on the Teflon® filter to produce HNO 3. Data from
CASTNET and three other measurement programs
CASTNET Ambient
Measurements
Sulfur dioxide (SO 2)
Particulate sulfate (SO2-4)
Particulate nitrate (NO- 3)
Nitric acid (HNO 3)
Particulate ammonium (NH+ 4)
Particulate calcium (Ca2+ )
Particulate sodium (Na + )
Particulate magnesium (Mg2+ )
Particulate potassium (K + )
Particulate chloride (Cl – )
Ozone (O 3)
Meteorological variables and information on land use and vegetation
(e.g., Ames, et al., 2001) are being used to address this hypothesis and to estimate uncertainties in CASTNET filter pack measurements of HNO
3, NO- 3, and NH+
4 on a seasonal, annual, and geographic basis. Information from these analyses will be available in late 2006. Preliminary results (Rogers, et al., 2006b) indicate that total nitrogen measurements are comparable among different monitoring programs but that differences exist among measurements of individual species (e.g., NO-
3).
CASTNET also measures ozone, one of the major components of smog. In addition to the air pollutants, CASTNET sites record meteorological measurements of temperature, solar radiation, relative humidity, precipitation, wind speed and direction, and surface wetness. These meteorological measurements are used to gauge the transport of air pollutants and as input to the mathematical model (the Multi-Layer Model or MLM) used for estimating dry deposition to ecosystems in the atmospheric boundary layer. The ozone and meteorological measurements are recorded continuously and archived as hourly averages.
Calculating Dry Deposition The original network design was based on the assumption that dry deposition or flux could be estimated as the linear product of measured pollutant concentration (C) and modeled deposition velocity (Vd):
Flux = C x Vd
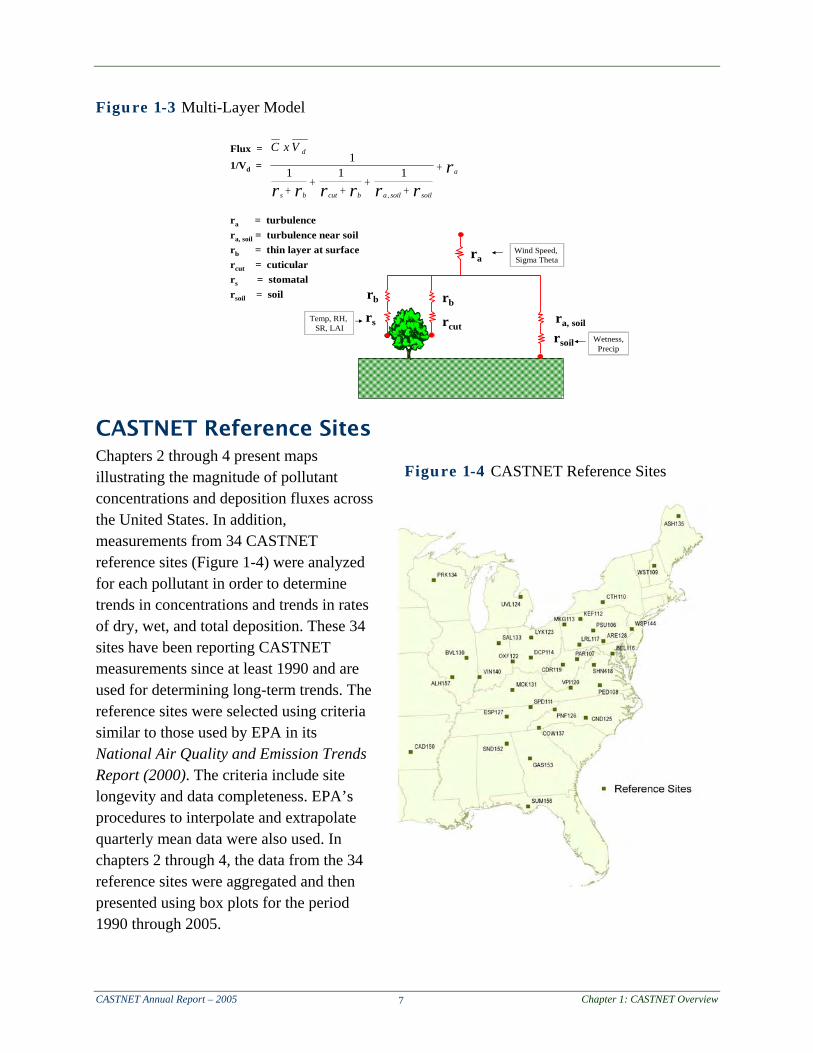
Measured atmospheric concentrations are calculated based on the mass of each analyte in each filter extract and the volume of air sampled. The rate of deposition of a pollutant, also known as deposition velocity, is influenced by meteorological conditions, vegetation, and chemistry. Dry deposition processes are modeled as resistances to deposition. The deposition velocity values are calculated for each hour of each year using the mathematical computer model, the Multi-Layer Model (MLM). The MLM was described by Meyers et al. (1998) and Finkelstein et al. (2000). An improved version of the MLM (Schwede, 2006) will be delivered to MACTEC during 2006. This version includes changes to the soil moisture factor, which affects the stomatal and soil resistances (see Figure 1-3), and to the radiation algorithm, which also affects the stomatal resistance. The data used in the MLM to estimate dry deposition are derived from meteorological measurements and pollutant concentrations taken at the site together with an estimation of the vegetation leaf-out and leaf area index (LAI). The schematic of the MLM in Figure 1-3 shows the relationships among the various resistances and illustrates the meteorological and other data that are required as model input.
CASTNET Reference Sites Chapters 2 through 4 present maps illustrating the magnitude of pollutant concentrations and deposition fluxes across the United States. In addition, measurements from 34 CASTNET reference sites (Figure 1-4) were analyzed for each pollutant in order to determine trends in concentrations and trends in rates of dry, wet, and total deposition. These 34 sites have been reporting CASTNET measurements since at least 1990 and are used for determining long-term trends. The reference sites were selected using criteria similar to those used by EPA in its National Air Quality and Emission Trends Report (2000). The criteria include site longevity and data completeness. EPA’s procedures to interpolate and extrapolate quarterly mean data were also used. In chapters 2 through 4, the data from the 34 reference sites were aggregated and then presented using box plots for the period 1990 through 2005.
Figure 1-4 CASTNET Reference Sites
Multi-Layer Model (MLM)Flux =1/Vd =
ra = turbulencera, soil = turbulence near soilrb = thin layer at surfacercut = cuticularrs = stomatalrsoil = soil
x Emissions The Acid Rain program (ARP), established under Title IV of the 1990 Clean Air Act Amendments, requires major reductions of sulfur dioxide (SO
2) and nitrogen oxides (NOx) emissions from the electric power industry. The SO
2 program sets a permanent cap on the total amount of SO
2 that may be emitted by electric generating units in the contiguous United States. The program began in 1995 and is being phased in, with the final 2010 SO
2 cap set at 8.95 million tons, a level equal to about one-half of the emissions from the power sector in 1980.
Using a market-based cap and trade mechanism to reduce SO 2 emissions allows flexibility for
individual combustion units to select their own methods of compliance. Currently, one allowance provides a regulated unit limited authorization to emit one ton of SO
2. The Clean Air Act allocates allowances to regulated units based on historic fuel consumption and specific emission rates prior to the start of the program. The total allowances allocated for each year equal the SO
2 emission cap. The program encourages early reductions by allowing sources to bank unused allowances in one year and use them in a later year.
The ARP has closer to a traditional approach to achieve NOx emission reductions. Rate-based limits apply to most of the coal-fired electric utility boilers subject to the ARP. No nationwide cap has been placed on NOx emissions. Other NOx emissions control programs have resulted in significant reductions in NOx emissions during the ozone season (see Chapter 4). Two prominent control programs are the Ozone Transport Commission (OTC) NOx Budget (1999-2002), and the NOx State Implementation Plan (SIP) Call, which began in 2003 and will continue through 2007.
The ARP is composed of two phases for SO 2 and NOx. Phase I applied primarily to the largest
coal-fired electric generation sources from 1995 through 1999 for SO 2 and from 1996 through
1999 for NOx. Phase II for both pollutants began in 2000. In 2005, the SO 2 Phase II requirements
applied to 3,456 operating units; the Phase II NOx requirements applied to 982 of those operating units that are ≥ 25 megawatts and burned coal between 1990 and 1995 (EPA, 2005a).
Figure 1-5 presents state-by-state total annual SO 2 and NOx emissions for Phase I and Phase II
electric utility plants for 2005. The heaviest emissions occurred in the eastern United States with major SO
This chapter presents maps illustrating the geographic distribution and magnitude of annual mean concentrations across the United States. Maps are provided for sulfur dioxide (SO
2), sulfate (SO2-
4), total nitrate (NO- 3), and ammonium (NH+
4) concentrations. Maps of other filter pack measurements are provided in CASTNET quarterly reports (MACTEC, 2005b; 2005c; 2006a; 2006c). In addition, concentration data from the 34 CASTNET reference sites (Figure 1-4) were analyzed to determine any trends in concentrations over the period 1990–2005. The data from the 34 reference sites are presented using box plots for each year of the 16-year period.
Sulfur Dioxide Figure 2-1 presents annual mean sulfur dioxide (SO
2) concentrations for 2005. The map shows a large region in the eastern United States with concentrations greater than or equal to 5.0 micrograms per cubic meter (μg/m3). The region extends from southwestern Illinois and western Kentucky to eastern Michigan to New Jersey, Maryland, and Virginia. Concentrations above 5.0 μg/m3 were also observed at Sand Mountain, AL (SND152) and Georgia Station, GA (GAS153). Several sites along and downwind of the Ohio River Valley recorded SO
2 concentrations in excess of 10.0 μg/m3. The Ohio River Valley is the major SO
2 emission source region (see Figure 1-5) in the United States. The single highest SO
2 concentration (16.2 μg/m3) was measured in eastern Ohio at Quaker City (QAK172). Only three western sites (i.e., sites west of 100 degrees west longitude) measured an annual mean SO
2 concentration greater than
CASTNET uses filter pack technology to measure concentrations of sulfur dioxide (SO
2), sulfate (SO2-
4), nitric acid (HNO 3), nitrate (NO-
3), ammonium (NH+ 4), chloride (Cl –
), and several earth metals. Since 1990, measured concentrations of sulfur species have generally decreased. However, annual mean SO
2 and SO2-4 concentrations increased in 2005 relative
to 2004. There were no concurrent increases in electric utility emissions in the eastern United States. Concentrations of nitrogen species remained relatively steady from 1990 until 2000 when they began a slow decline. However, mean annual total nitrate and NH+
1.0 μg/m3. These sites include Theodore Roosevelt National Park, ND (THR422), Petrified Forest National Park, AZ (PET427), and Sequoia National Park, CA (SEK430). Figure 2-2 provides box plots that show the 1990–2005 trend in annual mean SO
2 concentrations aggregated over the 34 reference sites. The diagram shows an overall downward trend with some interannual changes. The 2005 mean concentration was slightly higher than the 2004 level. Three-year means for 1990-1992 and 2003–2005 were 9.0 μg/m3 and 5.9 μg/m3, respectively. This change demonstrates a significant reduction of 34 percent in annual mean SO
2 concentrations.
Figure 2-1 Annual Mean SO 2 Concentrations (μg/m3) for 2005
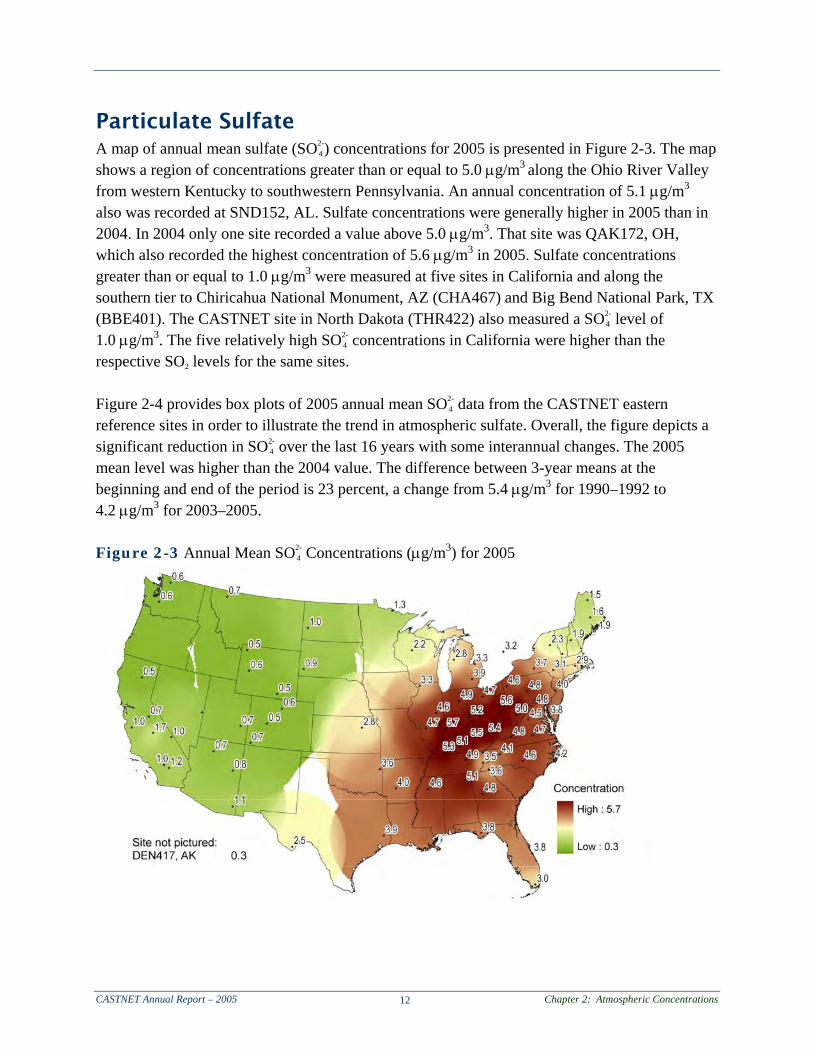
Particulate Sulfate A map of annual mean sulfate (SO2-
4) concentrations for 2005 is presented in Figure 2-3. The map shows a region of concentrations greater than or equal to 5.0 μg/m3 along the Ohio River Valley from western Kentucky to southwestern Pennsylvania. An annual concentration of 5.1 μg/m3 also was recorded at SND152, AL. Sulfate concentrations were generally higher in 2005 than in 2004. In 2004 only one site recorded a value above 5.0 μg/m3. That site was QAK172, OH, which also recorded the highest concentration of 5.6 μg/m3 in 2005. Sulfate concentrations greater than or equal to 1.0 μg/m3 were measured at five sites in California and along the southern tier to Chiricahua National Monument, AZ (CHA467) and Big Bend National Park, TX (BBE401). The CASTNET site in North Dakota (THR422) also measured a SO2-
4 level of 1.0 μg/m3. The five relatively high SO2-
4 concentrations in California were higher than the respective SO
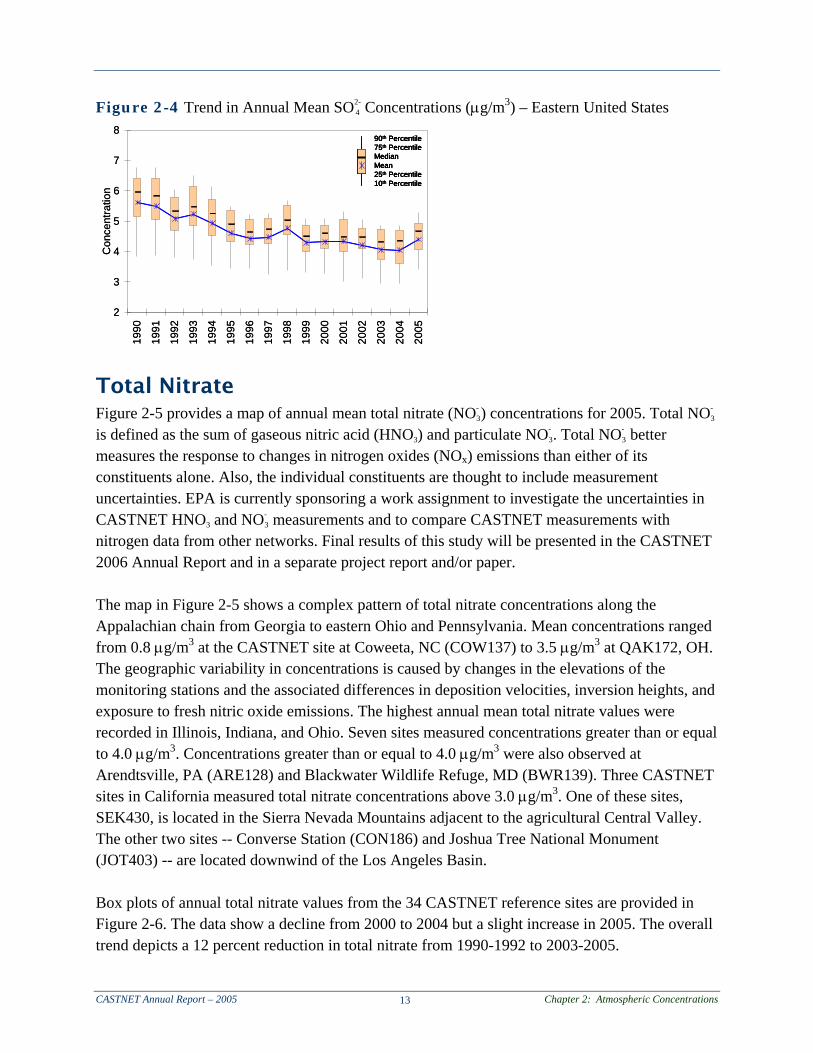
2 levels for the same sites. Figure 2-4 provides box plots of 2005 annual mean SO2-
4 data from the CASTNET eastern reference sites in order to illustrate the trend in atmospheric sulfate. Overall, the figure depicts a significant reduction in SO2-
4 over the last 16 years with some interannual changes. The 2005 mean level was higher than the 2004 value. The difference between 3-year means at the beginning and end of the period is 23 percent, a change from 5.4 μg/m3 for 1990–1992 to 4.2 μg/m3 for 2003–2005. Figure 2-3 Annual Mean SO2-
Figure 2-4 Trend in Annual Mean SO2-4 Concentrations (μg/m3) – Eastern United States
Total Nitrate Figure 2-5 provides a map of annual mean total nitrate (NO-
3) concentrations for 2005. Total NO- 3
is defined as the sum of gaseous nitric acid (HNO 3) and particulate NO-
3. Total NO- 3 better
measures the response to changes in nitrogen oxides (NOx) emissions than either of its constituents alone. Also, the individual constituents are thought to include measurement uncertainties. EPA is currently sponsoring a work assignment to investigate the uncertainties in CASTNET HNO
3 and NO- 3 measurements and to compare CASTNET measurements with
nitrogen data from other networks. Final results of this study will be presented in the CASTNET 2006 Annual Report and in a separate project report and/or paper. The map in Figure 2-5 shows a complex pattern of total nitrate concentrations along the Appalachian chain from Georgia to eastern Ohio and Pennsylvania. Mean concentrations ranged from 0.8 μg/m3 at the CASTNET site at Coweeta, NC (COW137) to 3.5 μg/m3 at QAK172, OH. The geographic variability in concentrations is caused by changes in the elevations of the monitoring stations and the associated differences in deposition velocities, inversion heights, and exposure to fresh nitric oxide emissions. The highest annual mean total nitrate values were recorded in Illinois, Indiana, and Ohio. Seven sites measured concentrations greater than or equal to 4.0 μg/m3. Concentrations greater than or equal to 4.0 μg/m3 were also observed at Arendtsville, PA (ARE128) and Blackwater Wildlife Refuge, MD (BWR139). Three CASTNET sites in California measured total nitrate concentrations above 3.0 μg/m3. One of these sites, SEK430, is located in the Sierra Nevada Mountains adjacent to the agricultural Central Valley. The other two sites -- Converse Station (CON186) and Joshua Tree National Monument (JOT403) -- are located downwind of the Los Angeles Basin. Box plots of annual total nitrate values from the 34 CASTNET reference sites are provided in Figure 2-6. The data show a decline from 2000 to 2004 but a slight increase in 2005. The overall trend depicts a 12 percent reduction in total nitrate from 1990-1992 to 2003-2005.
Particulate Ammonium A map of annual mean ammonium (NH+
4) concentrations is presented in Figure 2-7. The map shows annual levels greater than or equal to 2.0 μg/m3 in the agricultural states of Illinois, Indiana, and Ohio and also at three sites representative of agricultural areas in Pennsylvania, Kentucky, and Alabama – Penn State University, PA (PSU106); Mackville, KY (MCK131); and SND152, AL. The NH+
4 concentrations measured at western sites were relatively low with all sites measuring concentrations below 1.0 μg/m3. The trend diagram for annual mean NH+
4 values is provided in Figure 2-8. The box plots show a 16 percent decline in NH+
4 concentrations from the 3-year period 1990-1992 to the three years at the end of the period (1.79 μg/m3 to 1.49 μg/m3). However, the 2005 mean was higher than the 2004 value. This increase might be related to relatively higher SO2-
4 and NO- 3 concentrations in
2005 and the resulting higher ammonium sulfate [(NH 4)
Figure 2-8 Trend in Annual Mean NH+ 4 Concentrations (μg/m3) – Eastern United States
Continuous Measurements of Trace Concentrations of
CO, NOy, and SO 2
In addition to filter pack measurements, continuous measurements of low-concentration (i.e., trace) carbon monoxide (CO), total reactive oxides of nitrogen (NOy), and sulfur dioxide (SO
2) are collected at the CASTNET Beltsville, MD (BEL116) site. Data from these continuous gas analyzers were extracted from the entire 7-month database and plotted. The data show some interesting results. The following figure is a plot of hourly CO, NOy, and SO
2 data from the low-concentration analyzers for the first two weeks of November 2005. Separate scales are provided for each pollutant. The CO and NOy measurements are correlated, suggesting an urban source of these two pollutants. The SO
2 measurements are unrelated to the CO and NOy data. This result suggests that the SO
2 sources are not collocated with the urban sources of the CO and NOy. These simple interpretations suggest that the low-concentration measurements could be utilized for other types of analyses and also for the evaluation of filter pack measurements.
CASTNET was designed to estimate dry deposition as the product of measured pollutant concentrations and modeled deposition velocities. The Multi-Layer Model (MLM) is the computer model used to calculate hourly deposition velocities based on meteorological measurements and information on vegetation and its annual evolution. Total deposition is the sum of estimated dry deposition and measured wet deposition. Since 1990, total sulfur deposition has declined significantly. The data show a 27 percent reduction in 3-year mean sulfur fluxes over the period from 1990-1992 to 2003-2005. Total nitrate deposition declined by 9 percent over the same period. Dry deposition is responsible from approximately 20 to 80 percent of total deposition depending on location and climate. The percentage is higher in major source regions. Typical percentages are 40 percent for dry sulfur and 30 percent for dry nitrogen deposition.
Gaseous and aerosol sulfur and nitrogen pollutants are deposited into ecosystems through dry and wet atmospheric processes. One of the most critical and unique components of CASTNET involves estimation of the rate, or flux, of dry deposition from measured environmental conditions. Measured concentration data are combined with modeled dry deposition velocities to develop the flux estimates. For this report, wet deposition measurements were obtained from NADP/NTN and combined with CASTNET’s dry deposition data to estimate total deposition. Total sulfur and nitrogen deposition rates decreased during 2005. Precipitation-weighted mean concentrations in precipitation of total atmospheric sulfur remained about the same in 2005 as 2004, while nitrogen concentrations in precipitation continued the slow decline that began in 1998. Dry deposition processes were simulated using the MLM (Figure 1-3) as described by Meyers et al. (1998) and Finkelstein et al. (2000). An improved version of the MLM (Schwede, 2006) will be provided to MACTEC in 2006. For this report, the MLM was run using CASTNET meteorological measurements and information on land use, vegetation, and surface conditions to calculate deposition velocities for sulfur dioxide (SO
2), nitric acid (HNO 3), ozone (O
3), and the particles, sulfate (SO2-
4), nitrate (NO- 3), and ammonium (NH+
4). The deposition velocities were assumed to be identical for all particle species. Deposition velocity values were calculated for
each hour with valid meteorological data for each CASTNET site for the entire period 1990 through 2005. For a deposition velocity to be estimated, temperature, solar radiation, relative humidity, wind speed, and standard deviation of the wind direction (sigma theta) must all be valid for the hour. Aggregation rules for CASTNET require three valid quarters for the calculation of an annual value. If an annual value is not available for a specific site, results are not included on maps presented in this chapter. For trends analyses, missing values are replaced by interpolation or extrapolation using valid annual estimates. The MLM has been evaluated for a limited number of vegetation types, terrain settings, and time periods (summarized by Baumgardner et al., 2002).
Sulfur Deposition MLM simulations were done separately for sulfur dioxide (SO
2) and sulfate (SO2-4). The model
calculations were summed to obtain estimates of dry sulfur deposition [as sulfur (S)] for 2005, which are shown in Figure 3-1. The magnitude of a deposition rate is illustrated by the size of the circle. The map shows a narrow region with fluxes greater than 5.0 kilograms per hectare per year (kg/ha/yr) centered around and downwind of the Ohio River Valley from southern Indiana to New Jersey. The highest deposition rate was estimated for Quaker City, OH (QAK172) with a flux of 13.3 kg/ha/yr. The highest dry sulfur deposition rates were coincidental to the major SO
2 source region (Figure 1-5) and declined sharply with distance. Figure 3-1 Dry Sulfur (SO
2 + SO2-4) Deposition (as S) (kg/ha/yr) for 2005
The dry deposition rates for the western sites were all less than 1.0 kg/ha/yr with the majority of sites less than 0.5 kg/ha/yr. The MLM was not run for those sites in Figure 3-1 having no numerical value adjacent to the site location because of incomplete data.
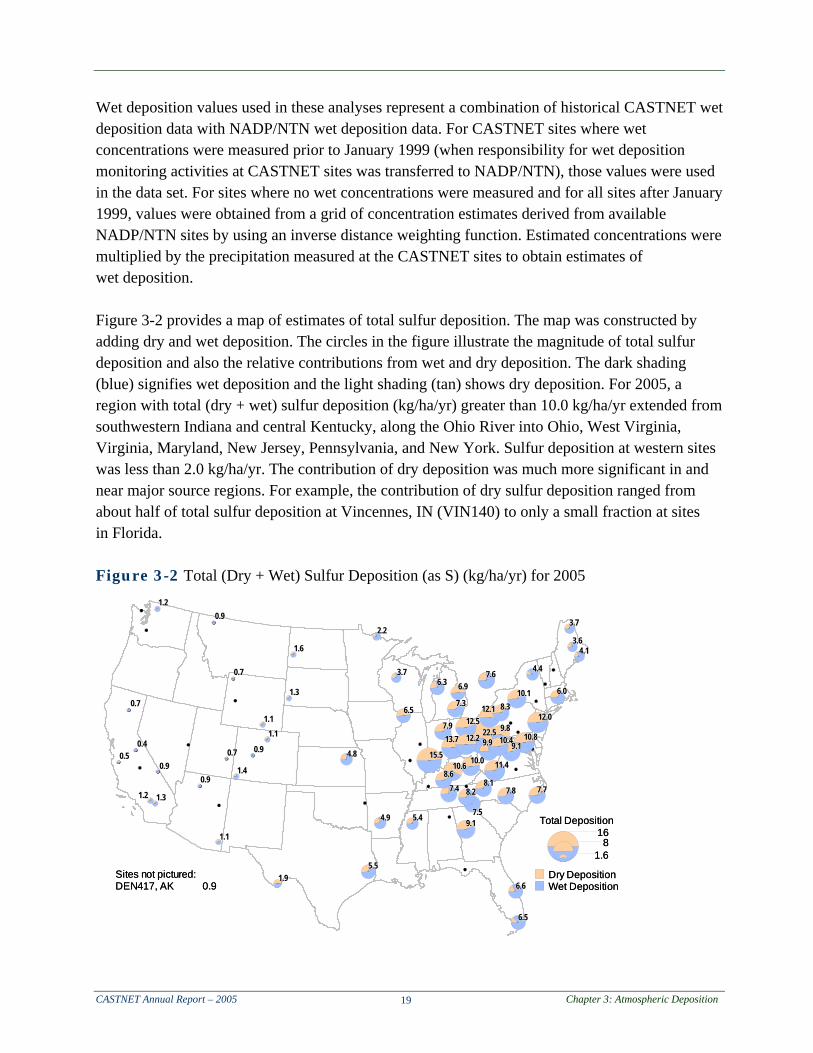
Wet deposition values used in these analyses represent a combination of historical CASTNET wet deposition data with NADP/NTN wet deposition data. For CASTNET sites where wet concentrations were measured prior to January 1999 (when responsibility for wet deposition monitoring activities at CASTNET sites was transferred to NADP/NTN), those values were used in the data set. For sites where no wet concentrations were measured and for all sites after January 1999, values were obtained from a grid of concentration estimates derived from available NADP/NTN sites by using an inverse distance weighting function. Estimated concentrations were multiplied by the precipitation measured at the CASTNET sites to obtain estimates of wet deposition. Figure 3-2 provides a map of estimates of total sulfur deposition. The map was constructed by adding dry and wet deposition. The circles in the figure illustrate the magnitude of total sulfur deposition and also the relative contributions from wet and dry deposition. The dark shading (blue) signifies wet deposition and the light shading (tan) shows dry deposition. For 2005, a region with total (dry + wet) sulfur deposition (kg/ha/yr) greater than 10.0 kg/ha/yr extended from southwestern Indiana and central Kentucky, along the Ohio River into Ohio, West Virginia, Virginia, Maryland, New Jersey, Pennsylvania, and New York. Sulfur deposition at western sites was less than 2.0 kg/ha/yr. The contribution of dry deposition was much more significant in and near major source regions. For example, the contribution of dry sulfur deposition ranged from about half of total sulfur deposition at Vincennes, IN (VIN140) to only a small fraction at sites in Florida. Figure 3-2 Total (Dry + Wet) Sulfur Deposition (as S) (kg/ha/yr) for 2005
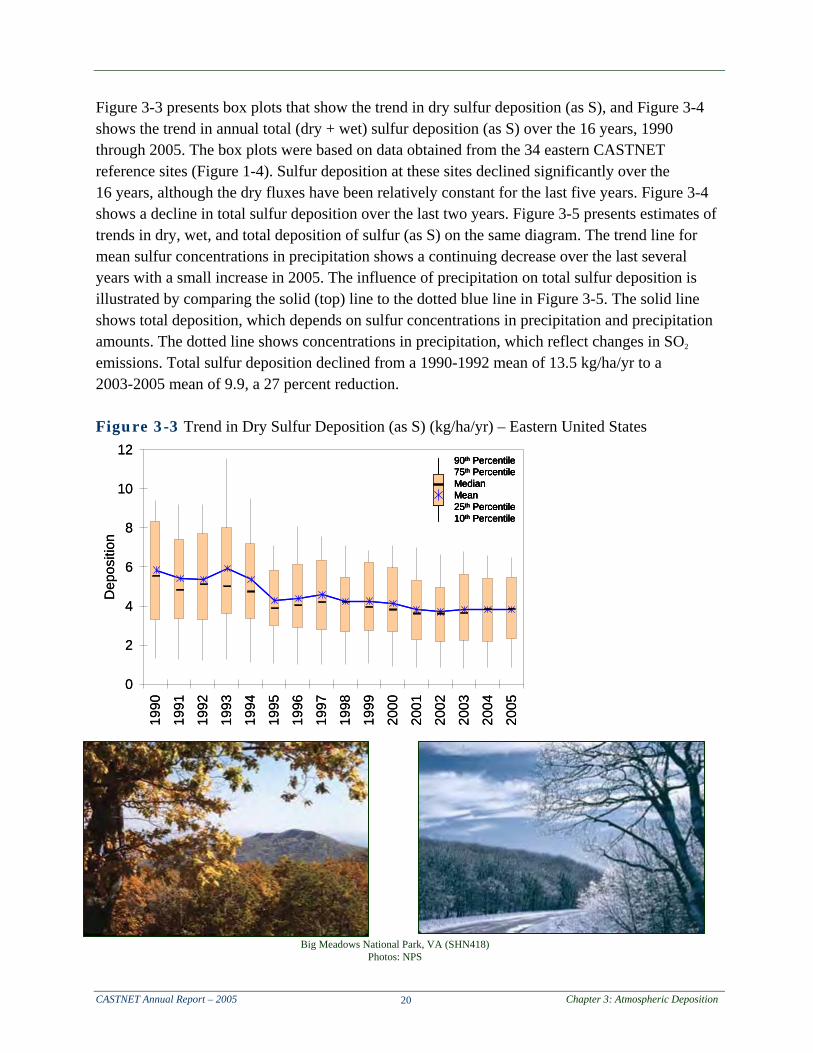
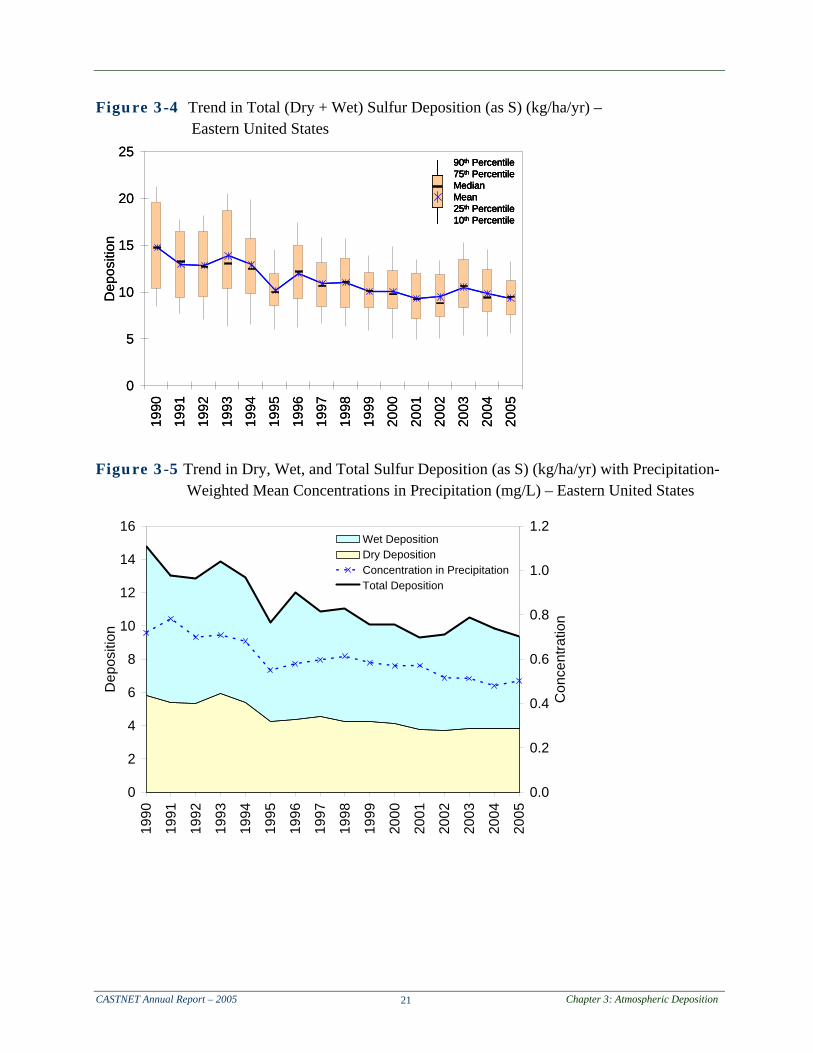
Figure 3-3 presents box plots that show the trend in dry sulfur deposition (as S), and Figure 3-4 shows the trend in annual total (dry + wet) sulfur deposition (as S) over the 16 years, 1990 through 2005. The box plots were based on data obtained from the 34 eastern CASTNET reference sites (Figure 1-4). Sulfur deposition at these sites declined significantly over the 16 years, although the dry fluxes have been relatively constant for the last five years. Figure 3-4 shows a decline in total sulfur deposition over the last two years. Figure 3-5 presents estimates of trends in dry, wet, and total deposition of sulfur (as S) on the same diagram. The trend line for mean sulfur concentrations in precipitation shows a continuing decrease over the last several years with a small increase in 2005. The influence of precipitation on total sulfur deposition is illustrated by comparing the solid (top) line to the dotted blue line in Figure 3-5. The solid line shows total deposition, which depends on sulfur concentrations in precipitation and precipitation amounts. The dotted line shows concentrations in precipitation, which reflect changes in SO
2 emissions. Total sulfur deposition declined from a 1990-1992 mean of 13.5 kg/ha/yr to a 2003-2005 mean of 9.9, a 27 percent reduction. Figure 3-3 Trend in Dry Sulfur Deposition (as S) (kg/ha/yr) – Eastern United States
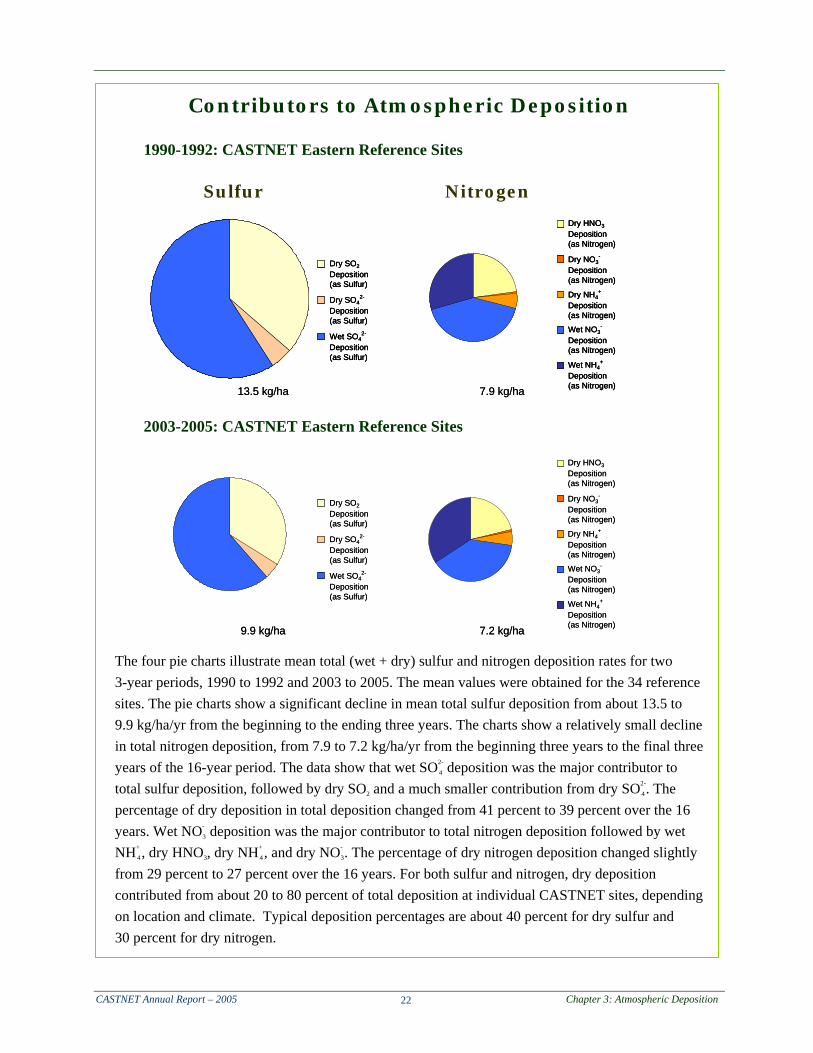
The four pie charts illustrate mean total (wet + dry) sulfur and nitrogen deposition rates for two 3-year periods, 1990 to 1992 and 2003 to 2005. The mean values were obtained for the 34 reference sites. The pie charts show a significant decline in mean total sulfur deposition from about 13.5 to 9.9 kg/ha/yr from the beginning to the ending three years. The charts show a relatively small decline in total nitrogen deposition, from 7.9 to 7.2 kg/ha/yr from the beginning three years to the final three years of the 16-year period. The data show that wet SO2-
4 deposition was the major contributor to total sulfur deposition, followed by dry SO
2 and a much smaller contribution from dry SO2-4. The
percentage of dry deposition in total deposition changed from 41 percent to 39 percent over the 16 years. Wet NO-
3 deposition was the major contributor to total nitrogen deposition followed by wet NH+
4, dry HNO 3, dry NH+
4, and dry NO- 3. The percentage of dry nitrogen deposition changed slightly
from 29 percent to 27 percent over the 16 years. For both sulfur and nitrogen, dry deposition contributed from about 20 to 80 percent of total deposition at individual CASTNET sites, depending on location and climate. Typical deposition percentages are about 40 percent for dry sulfur and 30 percent for dry nitrogen.
Nitrogen Deposition Figure 3-6 presents a map of dry fluxes of nitrogen [as nitrogen (N)] for 2005. Nitrogen fluxes are comprised of nitric acid (HNO
3) + nitrate (NO- 3) + ammonium (NH+
4 ). This map was constructed by summing the individual MLM simulations for the three species. Almost all of the CASTNET sites in the eastern United States had estimated dry nitrogen deposition rates greater than 1.0 kg/ha/yr. The nitrogen fluxes were more uniform than the sulfur fluxes, reflecting a wider distribution of NOx sources. The flux values ranged from 0.5 kg/ha/yr in New Hampshire and Maine to 3.6 kg/ha/yr in eastern Ohio. The values at the western sites ranged from 0.2 kg/ha/yr at North Cascades National Park, WA (NCS415) to 3.0 kg/ha/yr at Converse Station, CA (CON186). Figure 3-6 Dry Nitrogen (HNO
3 + NO- 3 + NH+
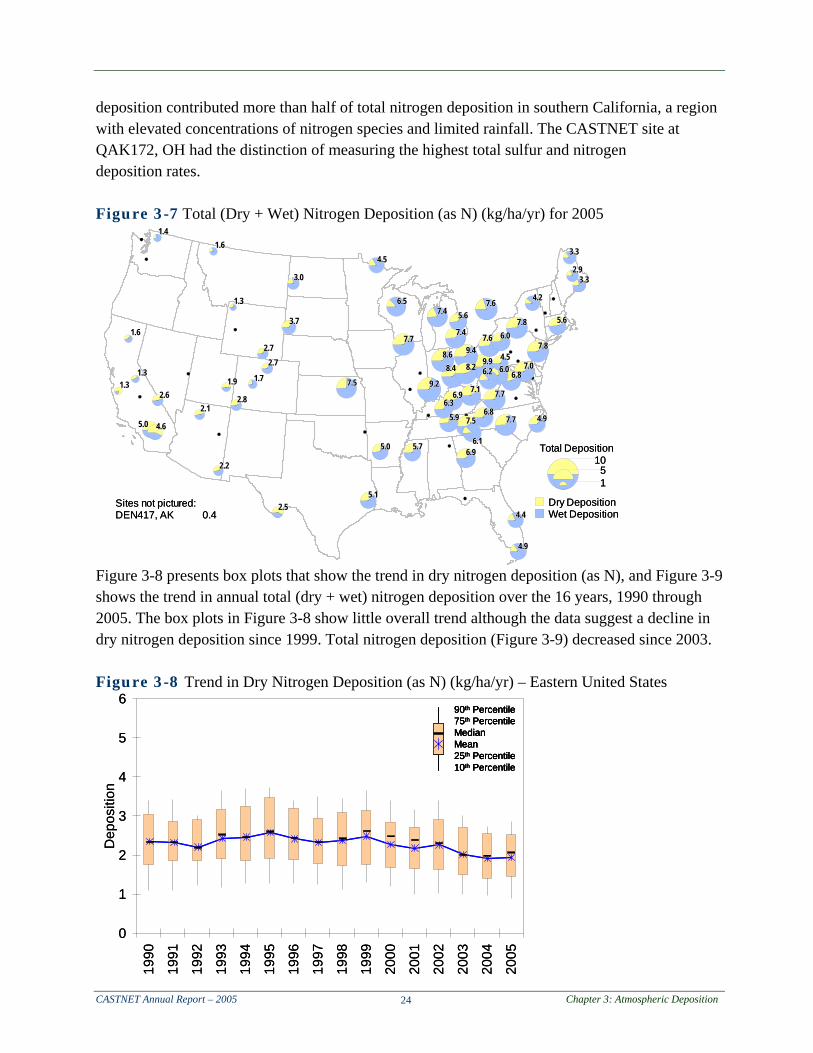
4) Deposition (as N) (kg/ha/yr) for 2005 A map (Figure 3-7) of total nitrogen deposition (as N) for 2005 was constructed by summing the estimates of dry (light shading) and wet (dark shading) deposition. The figure shows that a large majority of the eastern sites recorded deposition rates greater than 5.0 kg/ha/yr. No values above 10.0 kg/ha/yr were observed in 2005. Lower fluxes were recorded along the periphery of the network (e.g., in New England and Florida and throughout the West). The values at the western sites ranged from 1.3 kg/ha/yr in central California at Yosemite National Park (YOS430) and in Wyoming at Yellowstone National Park (YEL408) to 5.0 kg/ha/yr in southern California at CON186. The contributions of dry nitrogen deposition to total nitrogen were lower than the corresponding contributions of dry sulfur deposition. Dry nitrogen deposition typically contributed less than 50 percent of total deposition in the East. Interestingly, dry nitrogen
deposition contributed more than half of total nitrogen deposition in southern California, a region with elevated concentrations of nitrogen species and limited rainfall. The CASTNET site at QAK172, OH had the distinction of measuring the highest total sulfur and nitrogen deposition rates. Figure 3-7 Total (Dry + Wet) Nitrogen Deposition (as N) (kg/ha/yr) for 2005 Figure 3-8 presents box plots that show the trend in dry nitrogen deposition (as N), and Figure 3-9 shows the trend in annual total (dry + wet) nitrogen deposition over the 16 years, 1990 through 2005. The box plots in Figure 3-8 show little overall trend although the data suggest a decline in dry nitrogen deposition since 1999. Total nitrogen deposition (Figure 3-9) decreased since 2003. Figure 3-8 Trend in Dry Nitrogen Deposition (as N) (kg/ha/yr) – Eastern United States
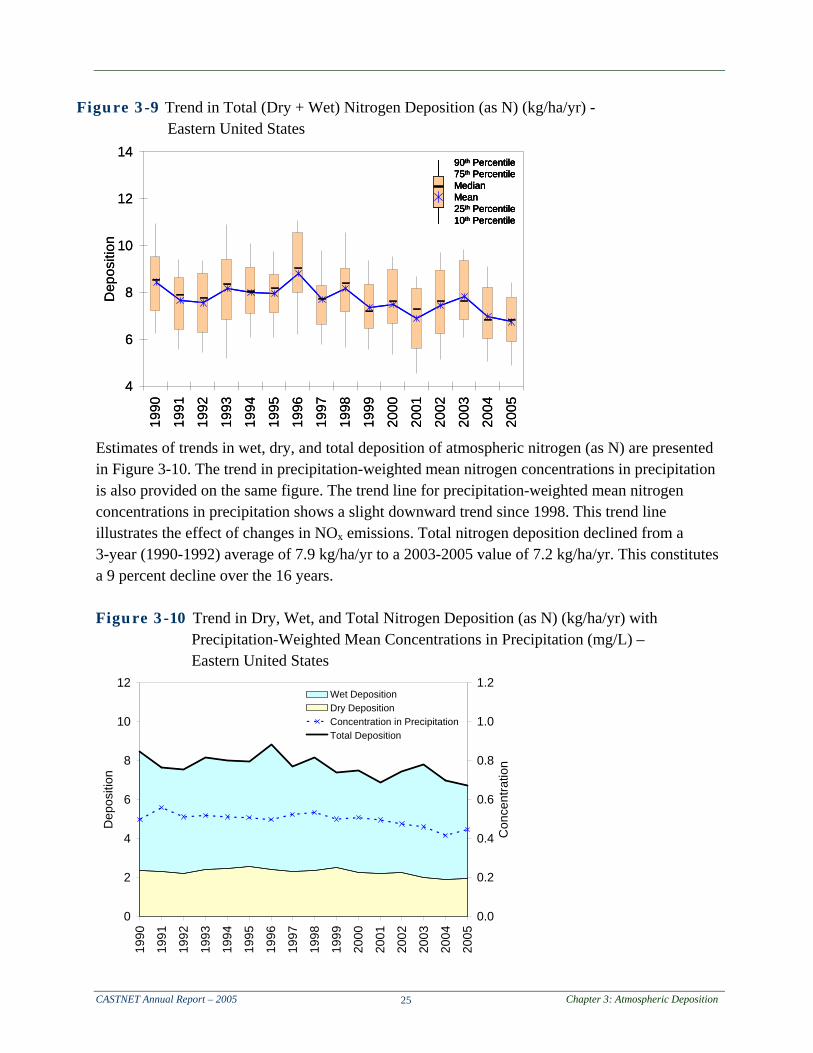
Figure 3-9 Trend in Total (Dry + Wet) Nitrogen Deposition (as N) (kg/ha/yr) - Eastern United States
Estimates of trends in wet, dry, and total deposition of atmospheric nitrogen (as N) are presented in Figure 3-10. The trend in precipitation-weighted mean nitrogen concentrations in precipitation is also provided on the same figure. The trend line for precipitation-weighted mean nitrogen concentrations in precipitation shows a slight downward trend since 1998. This trend line illustrates the effect of changes in NOx emissions. Total nitrogen deposition declined from a 3-year (1990-1992) average of 7.9 kg/ha/yr to a 2003-2005 value of 7.2 kg/ha/yr. This constitutes a 9 percent decline over the 16 years. Figure 3-10 Trend in Dry, Wet, and Total Nitrogen Deposition (as N) (kg/ha/yr) with
Precipitation-Weighted Mean Concentrations in Precipitation (mg/L) – Eastern United States
CASTNET ozone (O 3) measurements provide information on geographic patterns in regional O
3. Each monitoring site operates an ozone analyzer to measure O
3 concentrations continuously. Ozone data are recorded and archived as hourly averages. The CASTNET O
3 database constitutes a long-term record of O
3 levels in rural areas with more than 40 sites operating since the late 1980s. While CASTNET is not a compliance network, the 8-hour O
3 standard is a useful metric in assessing status and trends in rural O
3. The analyses presented in this section examine trends in the fourth highest daily maximum 8-hour average O
3 concentrations, consistent with the metric used in the 8-hour standard (see call out box on following page).
During the period 2003-2005, 3-year averages of the fourth highest daily maximum 8-hour O
3 concentrations were greater than or equal to 85 parts per billion (ppb) at seven sites in California, Maryland, New Jersey, and Tennessee. Measurements of 8-hour concentrations during 2005 were somewhat higher than 2003 and 2004
but were considerably lower than concentrations measured over the period 1990-2002. Ozone levels measured in 2005 continue to show a downward trend that began in 2002.
Death Valley National Park, CA (DEV412)
CASTNET provides the primary means for monitoring rural ozone (O 3) concentrations
in the United States. The median fourth highest daily maximum 8-hour O 3 concentration
for 2005 was the second lowest in the history of the network despite the return to normal weather conditions during the ozone season (May through September). The decline in rural ozone levels over the last few years has been attributed to the documented decline in NOx emissions, as well as weather conditions not conducive to ozone formation during some of those years.
To better protect public health, EPA (1997) revised its national air quality standards for ozone in 1997, establishing an 8-hour standard. The 8-hour standard is 0.08 parts per million (ppm). An area meets the standard if the 3-year average of the annual fourth highest daily maximum 8-hour average concentration is less than or equal to 0.08 ppm. For more information on the 8-hour ozone standard and ozone nonattainment areas in the United States, visit www.epa.gov/air/oaqups/glo/designations/index.htm.
What Does It Mean?
EPA collects ozone data on an hourly basis. Essentially, 8-hour average ozone concentrations at a monitor cannot exceed 0.08 ppm more than three days per year. For compliance purposes:
♦ Hourly ozone measurements are used to compute 8-hour average concentrations.
♦ The daily maximum 8-hour average is recorded for each day.
♦ For each year, the fourth highest daily maximum concentration is calculated.
♦ These annual fourth highest daily maximum concentrations are averaged over three-year periods.
♦ If the average exceeds 0.084 ppm (0.085 rounds up to 0.09 thus exceeding the standard criteria) or 85 ppb in practice, the area is designated as a “nonattainment area.”
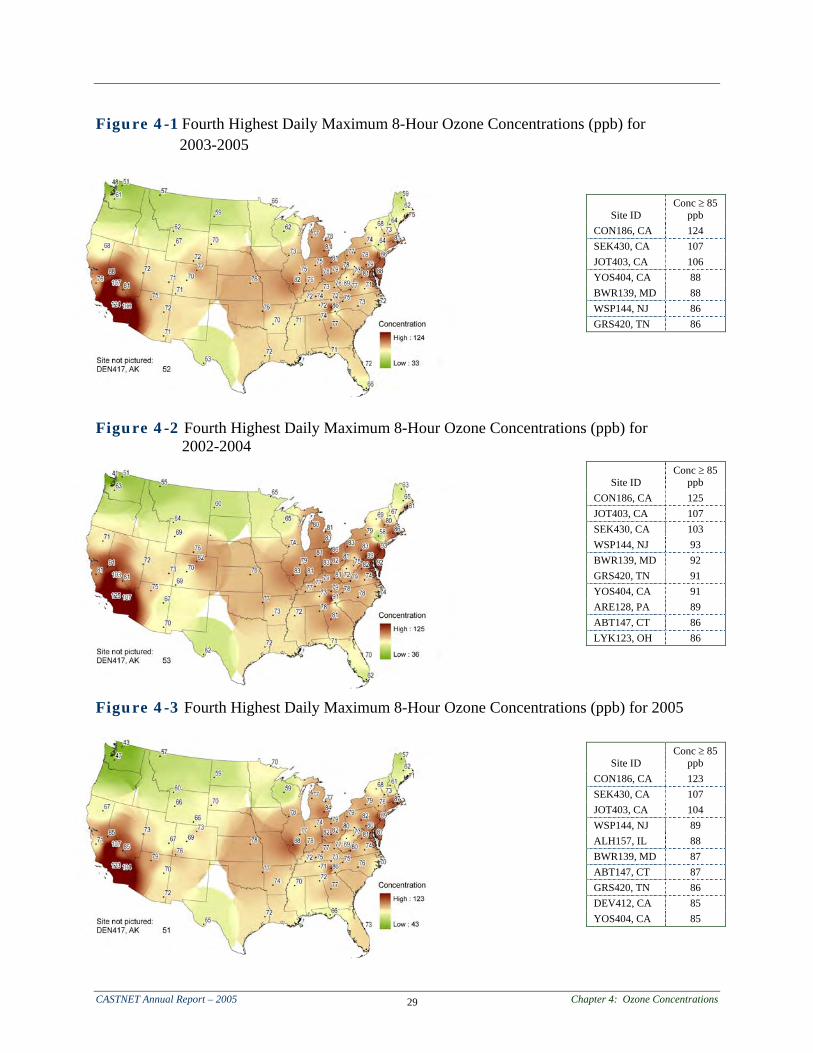
Eight-Hour Ozone Concentrations Figure 4-1 presents 3-year averages of the fourth highest daily maximum 8-hour O
3
concentrations for 2003-2005. The sites with concentration levels greater than or equal to 85 ppb are listed in a table next to the map in Figure 4-1. Three eastern and four sites in California measured 3-year average concentrations greater than or equal to 85 ppb. These 3-year average concentrations constitute current design values for achieving the 8-hour National Ambient Air Quality Standard (NAAQS) for O
3. For example, the estimated value of 124 ppb at CON186 would have to be reduced to 84 ppb to achieve the standard. Design values change as a new 3-year database becomes available.
For comparison, 3-year averages of the fourth highest daily maximum 8-hour O 3 concentrations
for the previous 3-year period, 2002-2004 are presented in Figure 4-2. The area with standard exceedances was larger during this earlier period. Six eastern and the same four California sites recorded 3-year averages greater than or equal to 85 ppb. The period 2003-2005 represents an improvement in air quality.
Fourth highest daily maximum 8-hour O 3 concentrations for 2005 are shown in Figure 4-3.
Concentrations greater than or equal to 85 ppb were recorded along the East Coast in the Washington, D.C. to Boston corridor; Great Smoky Mountains National Park, TN (GRS420); and Alhambra, IL (ALH157). In addition, five California CASTNET sites monitored exceedances of the 8-hour ozone NAAQS. The California sites include Converse Station (CON186), Sequoia National Park (SEK430), Joshua Tree National Monument (JOT403), Death Valley National Monument (DEV412), and Yosemite National Park (YOS404). The 8-hour level of 123 ppb at CON186 was the highest value that was measured in the network during 2005.
Sixteen-Year Trends Since 2002, CASTNET ozone measurements have shown a significant decline in annual fourth highest daily maximum 8-hour concentrations throughout the 34 eastern reference sites (Figure 1-4) used to track trends in concentrations. During 2002, 24 of the reference sites measured fourth highest daily maximum 8-hour O
3 concentrations greater than or equal to 85 ppb. The number of reference sites with exceedances was reduced to six in 2003, followed by further reduction to none in 2004. As shown in Figure 4-3, five eastern reference sites recorded elevated 8-hour concentrations in 2005.
Figure 4-4 shows the 16-year trend in 8-hour O 3 concentrations aggregated over the 34 reference
stations. The box plots show a significant decline from 2002 to 2003 and a further decline in 2004. The 2005 data show a small increase. Median values for the aggregated measurements for the four years 2002 through 2005 were 88 ppb, 79 ppb, 70 ppb, and 76 ppb, respectively. Trends in temperature, solar radiation, and precipitation for the reference sites are shown in Figures 4-5 though 4-7. These box plots were produced for the ozone season, May through September, when sunlight and warm weather promote the chemical reactions that form ozone. The meteorological influence on O
3 concentrations is evident from the three figures. The 2003 and 2004 ozone seasons, which measured significantly lower concentrations of ozone than the preceding years (1990-2002), were unusually cool, cloudy, and wet. For example, total precipitation measured in 2003 and 2004 was well above the amounts recorded during the previous 13 years. Interestingly, ozone season weather returned to normal in 2005. Yet the median 8-hour O
3 concentration was the second lowest in the 16-year period.
Figure 4-4 Trend in Fourth Highest Daily Maximum 8-Hour Ozone Concentrations (ppb) – Eastern United States
Figure 4-7 Trend in Total Precipitation (mm) (May through September) – Eastern United States
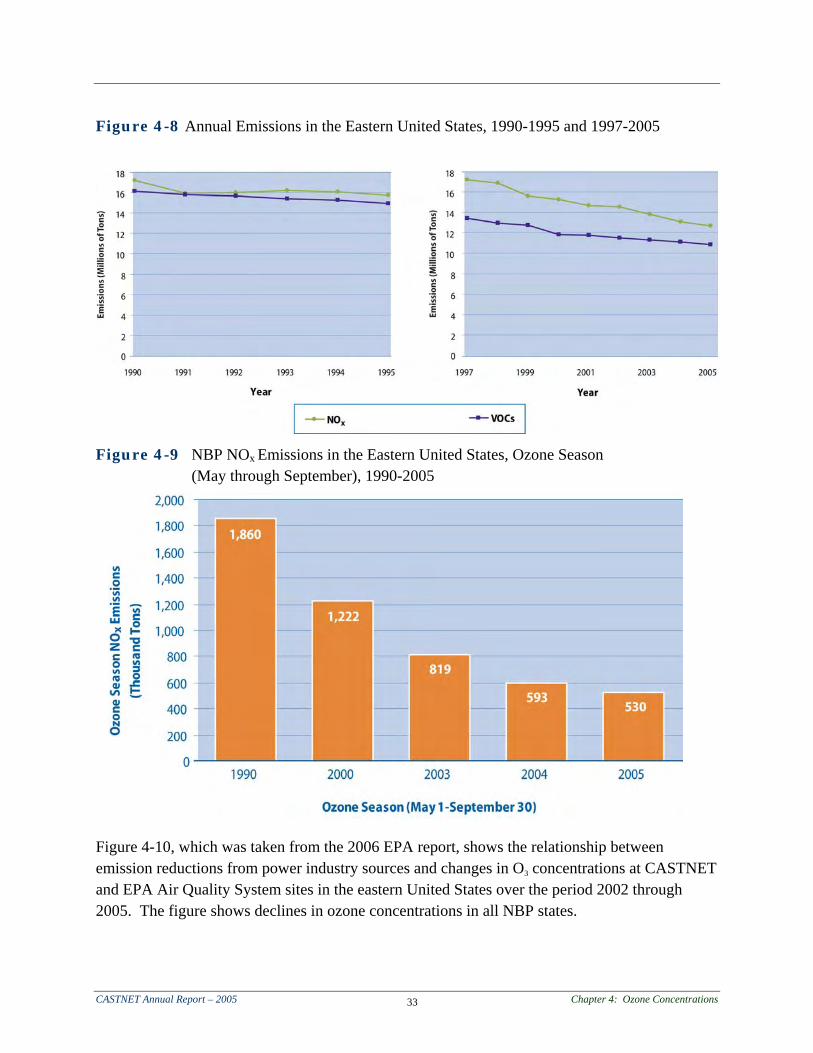
Nitrogen Oxides and Ozone EPA recently analyzed changes in NOx emissions and O
3 concentrations. The findings were published in two excellent reports (EPA, 2005b and 2006), which evaluated the effectiveness of NOx and volatile organic compound (VOC) emission control programs in the eastern United States and reported subsequent changes in ozone levels. Figure 4-8, which was taken from the 2006 EPA report, depicts annual NOx and VOC emissions in the eastern United States from 1990 through 2005. Figure 4-9 shows ozone season NOx emissions for five baseline years during this time period. The figure illustrates emissions from large electric generating and industrial sources in the NOx Budget Trading Program (NBP) region, which is illustrated in light green in Figure 4-10. The region includes 19 eastern states and the District of Columbia. The emissions were totaled for 2,570 units in the region. The decline in NOx emissions over the last several years is evident in the figures. In the report, EPA attributed the decline in emissions to several effective control programs:
Mobile source controls,
VOC Reasonably Available Control Technology (RACT) and Maximum Available Control Technology (MACT),
New Source Review,
Acid Rain Program,
Ozone Transport Commission (OTC) NO x Budget (1999-2002), and
NO x State Implementation Plan (SIP) Call (2003 - current).
Figure 4-8 Annual Emissions in the Eastern United States, 1990-1995 and 1997-2005
Figure 4-9 NBP NOx Emissions in the Eastern United States, Ozone Season (May through September), 1990-2005
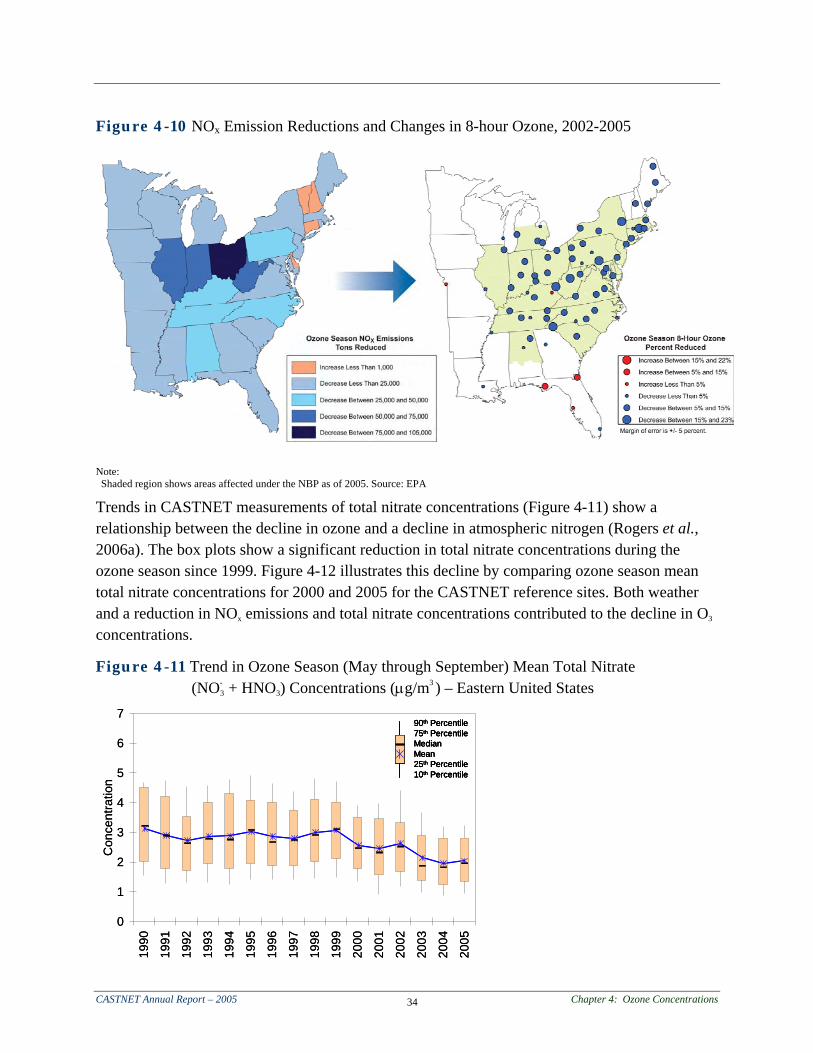
Figure 4-10, which was taken from the 2006 EPA report, shows the relationship between emission reductions from power industry sources and changes in O
3 concentrations at CASTNET and EPA Air Quality System sites in the eastern United States over the period 2002 through 2005. The figure shows declines in ozone concentrations in all NBP states.
Figure 4-10 NOx Emission Reductions and Changes in 8-hour Ozone, 2002-2005
Note: Shaded region shows areas affected under the NBP as of 2005. Source: EPA
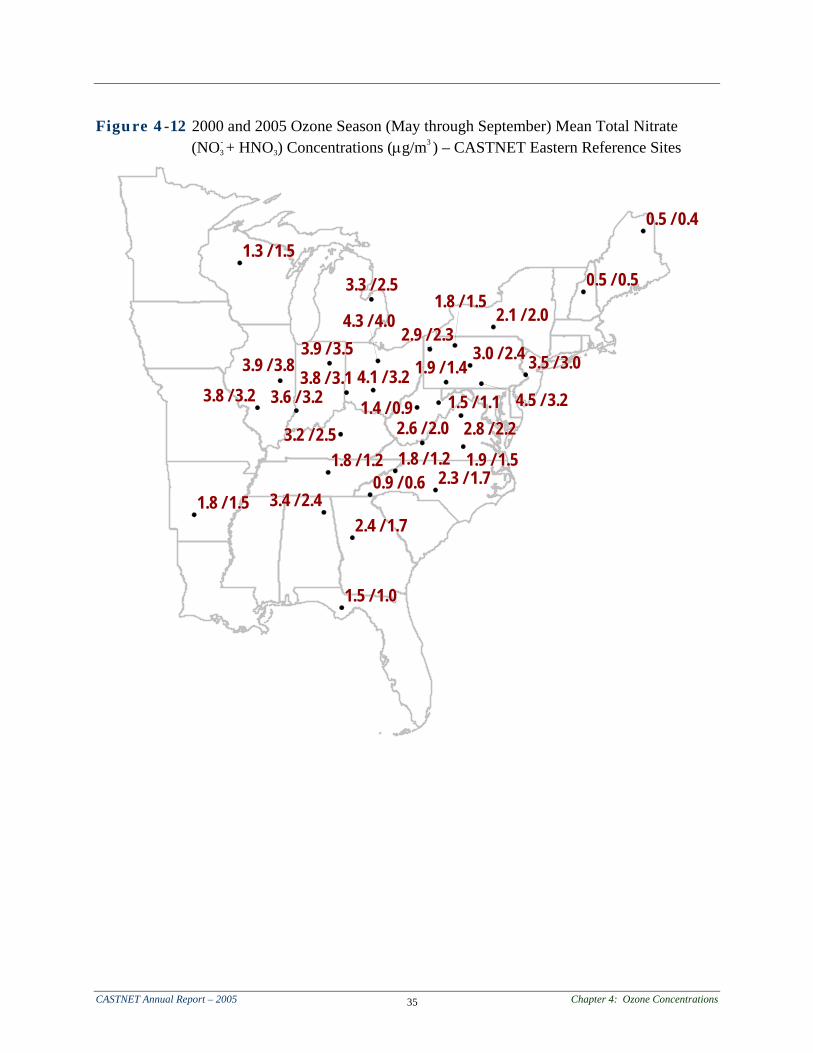
Trends in CASTNET measurements of total nitrate concentrations (Figure 4-11) show a relationship between the decline in ozone and a decline in atmospheric nitrogen (Rogers et al., 2006a). The box plots show a significant reduction in total nitrate concentrations during the ozone season since 1999. Figure 4-12 illustrates this decline by comparing ozone season mean total nitrate concentrations for 2000 and 2005 for the CASTNET reference sites. Both weather and a reduction in NO
x emissions and total nitrate concentrations contributed to the decline in O 3
concentrations.
Figure 4-11 Trend in Ozone Season (May through September) Mean Total Nitrate (NO-
Trends in Ozone Concentrations along the Washington, D.C. to Coastal Maine Corridor
Historically, elevated ozone concentrations have been recorded along the East Coast from metropolitan Washington, D.C. to Acadia National Park in Maine. Within the last five years, 3-year averages of the fourth highest daily maximum O
3 concentrations have been more than 90 ppb at the CASTNET sites in Maryland, eastern Pennsylvania, New Jersey, and Connecticut and as high as 87 ppb in Maine. Recent studies by EPA (2005b) demonstrated a decline in O
3 concentrations in the eastern United States that is related to the decline in NOx emissions, which resulted from a number of NOx emission control programs. The analyses discussed by Rogers et al. (2006a) together with the analyses in this chapter demonstrate a significant reduction in O
3 levels at the 34 eastern CASTNET reference sites. This reduction is attributed to the significant decline in NOx emissions, as manifested by the decline in total nitrate concentrations, and cool, cloudy, and wet weather conditions during the “ozone season” (i.e., May through September) of 2003 and 2004. More typical ozone season weather was observed in 2005.
Fourth highest daily maximum O 3 concentrations measured at six CASTNET sites indicate
that ozone peaked in 2002, and the lowest concentrations occurred during the last three years. The trend was calculated from 1990-2005 measurements from Beltsville, MD (BEL116); Blackwater Wildlife Refuge, MD (BWR139); Arendtsville, PA (ARE128); Washington’s Crossing State Park, NJ (WSP144); Abington, CT (ABT147); and Acadia National Park, ME (ACA416). The data were aggregated over the six sites. Ozone season temperature, solar radiation, and precipitation data show that the 2002 O
3 peak was observed during an exceptionally warm, sunny, and dry summer. Much lower O
3 concentrations were recorded in 2003 and 2004. The weather conditions during these two ozone seasons were cool, cloudy, and wet. Weather conditions returned to normal during the 2005 O
3 season. Yet O 3 concentrations remained low.
Ozone season mean nitrate concentrations have shown a significant decline in atmospheric nitrogen along the East Coast since 1999. The trend in total nitrate concentrations along the East Coast is comparable to the trend in total nitrate levels for the 34 reference sites (Figure 4-11), but the decline in concentrations along the East Coast is more significant. The 3-year mean total NO-
3 level for 1990-1992 of 4.4 µg/m3 declined to 3.2 µg/m3
in 2002-2005, a 27 percent reduction. The 1999 peak in mean nitrate was 4.5 µg/m3
. EPA has estimated about a 25 percent reduction in annual NOx emissions in the eastern United States over the period 1997-2004 (see Figure 4-9) and an approximate 50 percent decline in power industry NOx emissions during the ozone season for the same period. The relationship between low ozone along the East Coast and weather is clear from the trends. The decline in ozone, especially in 2005, is also related to the decline in NOx emissions and the corresponding decline in nitrate concentrations.
CASTNET Annual Report – 2005 Chapter 5: Data Quality 38
Chapter 5:
Data Quality The CASTNET Quality Assurance (QA) program was designed to ensure that all reported data are of known and documented quality in order to meet CASTNET objectives and to be reproducible and comparable with data from other monitoring networks and laboratories. The QA program elements are documented in the Quality Assurance Project Plan (QAPP), Revision 2.1, (MACTEC, 2003b). The QAPP is comprehensive and includes standards and policies for all components of project operation from site selection through final data reporting. Estimating dry deposition requires the measurement of several meteorological parameters and information on vegetation and land use. The CASTNET data collection process and QA efforts were designed to ensure that the data collected meet program objectives. Data quality indicators (DQI) are quantitative statistics and qualitative descriptors used in interpreting the degree of acceptability and utility of the data collected. The DQI for CASTNET are precision, accuracy, completeness, bias, representativeness, and comparability. Precision, accuracy, and completeness for CASTNET 2005 data were analyzed and compared with historical data collected during the period 1990–2004. The information in this report is supplemented by analyses that are discussed in quarterly CASTNET Quality Assurance Reports (e.g., MACTEC, 2006b). These QA reports are produced four times per year with the fourth quarter report including an annual summary. Both historical and current data can be used with confidence since CASTNET data are always verified and validated through the use of the DQI and associated measurement criteria. CASTNET has produced and continues to produce data of the highest quality.
Joshua Trees in Nevada
The CASTNET quality assurance program is based on specified data quality objectives, which are evaluated using data quality indicators (DQI). Historical data and measurements for 2005 can be used with confidence since CASTNET measurements are continually evaluated through the use of DQI and their associated measurement criteria. CASTNET has produced and continues to produce data of the highest quality.
CASTNET Annual Report – 2005 Chapter 5: Data Quality 39
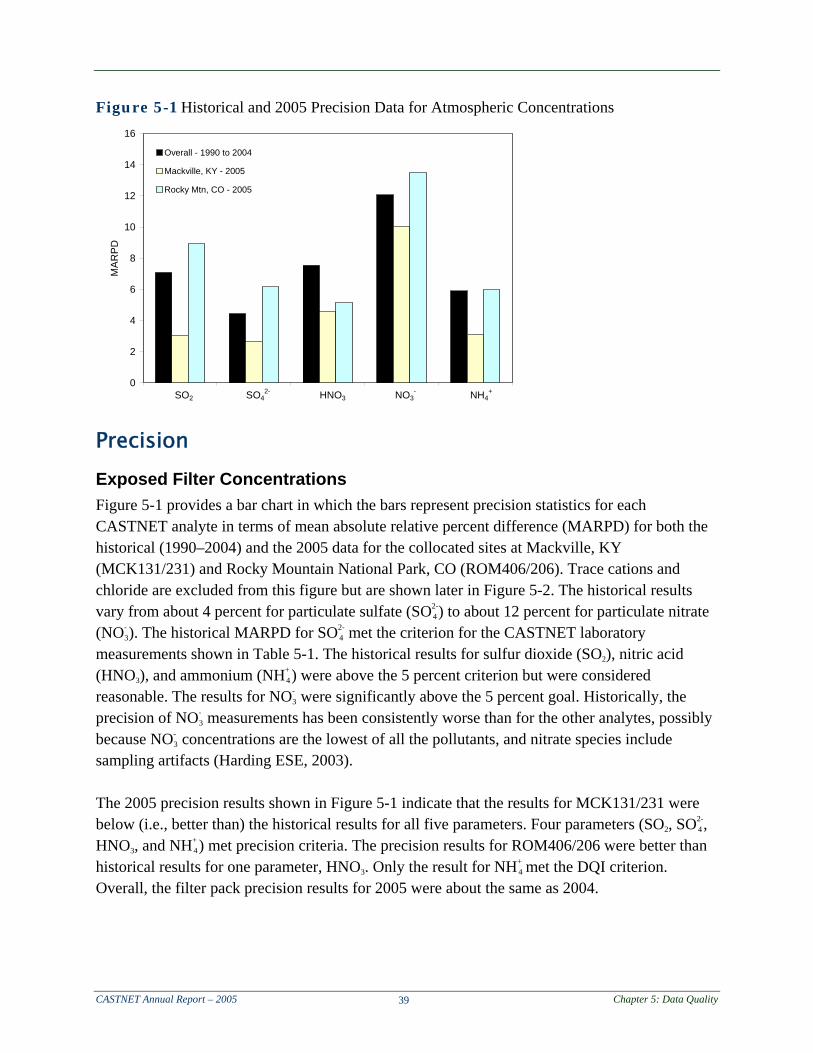
Figure 5-1 Historical and 2005 Precision Data for Atmospheric Concentrations
Precision Exposed Filter Concentrations Figure 5-1 provides a bar chart in which the bars represent precision statistics for each CASTNET analyte in terms of mean absolute relative percent difference (MARPD) for both the historical (1990–2004) and the 2005 data for the collocated sites at Mackville, KY (MCK131/231) and Rocky Mountain National Park, CO (ROM406/206). Trace cations and chloride are excluded from this figure but are shown later in Figure 5-2. The historical results vary from about 4 percent for particulate sulfate (SO2-
4) to about 12 percent for particulate nitrate (NO-
3). The historical MARPD for SO2-4 met the criterion for the CASTNET laboratory
measurements shown in Table 5-1. The historical results for sulfur dioxide (SO 2), nitric acid
(HNO 3), and ammonium (NH+
4) were above the 5 percent criterion but were considered reasonable. The results for NO-
3 were significantly above the 5 percent goal. Historically, the precision of NO-
3 measurements has been consistently worse than for the other analytes, possibly because NO-
3 concentrations are the lowest of all the pollutants, and nitrate species include sampling artifacts (Harding ESE, 2003). The 2005 precision results shown in Figure 5-1 indicate that the results for MCK131/231 were below (i.e., better than) the historical results for all five parameters. Four parameters (SO
2, SO2-4 ,
HNO 3, and NH+
4) met precision criteria. The precision results for ROM406/206 were better than historical results for one parameter, HNO
3. Only the result for NH+ 4 met the DQI criterion.
Overall, the filter pack precision results for 2005 were about the same as 2004.
0
2
4
6
8
10
12
14
16
SO2 SO4 HNO3 NO3 NH4
MA
RP
D
Overall - 1990 to 2004
Mackville, KY - 2005
Rocky Mtn, CO - 2005
SO2 SO42-
HNO3 NO3- NH4
+
CASTNET Annual Report – 2005 Chapter 5: Data Quality 40
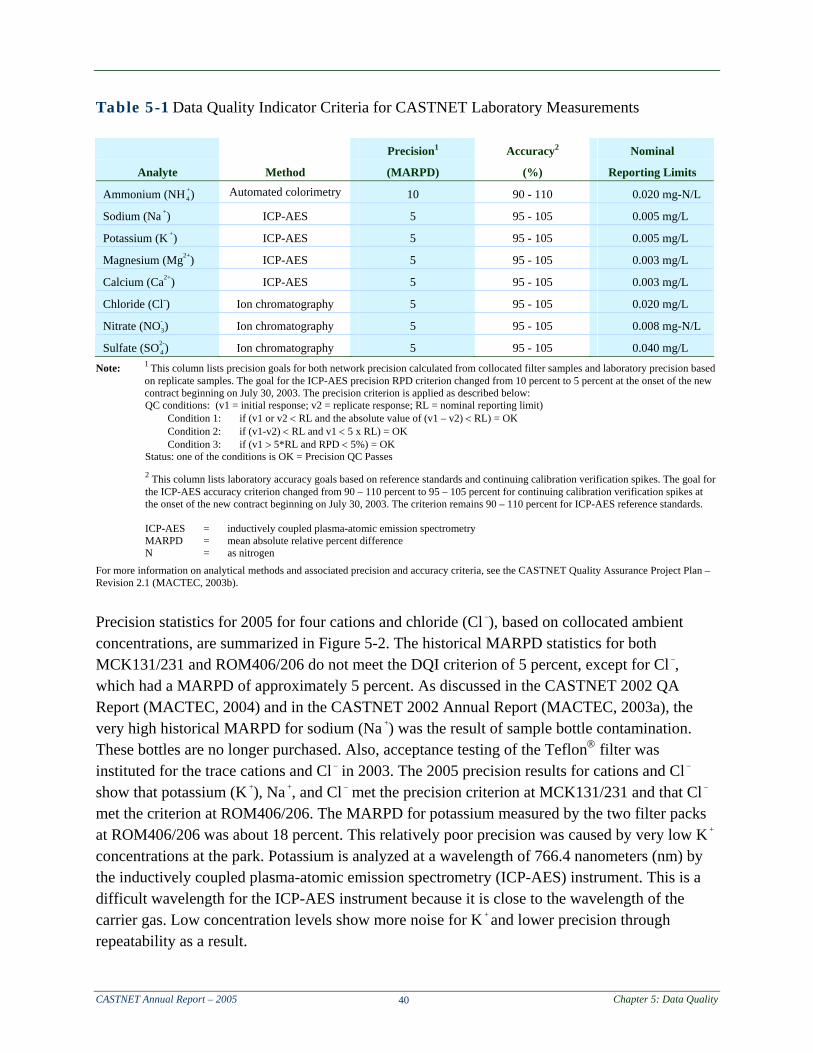
Table 5-1 Data Quality Indicator Criteria for CASTNET Laboratory Measurements
Note: 1 This column lists precision goals for both network precision calculated from collocated filter samples and laboratory precision based on replicate samples. The goal for the ICP-AES precision RPD criterion changed from 10 percent to 5 percent at the onset of the new contract beginning on July 30, 2003. The precision criterion is applied as described below:
QC conditions: (v1 = initial response; v2 = replicate response; RL = nominal reporting limit) Condition 1: if (v1 or v2 < RL and the absolute value of (v1 – v2) < RL) = OK Condition 2: if (v1-v2) < RL and v1 < 5 x RL) = OK Condition 3: if (v1 > 5*RL and RPD < 5%) = OK Status: one of the conditions is OK = Precision QC Passes 2 This column lists laboratory accuracy goals based on reference standards and continuing calibration verification spikes. The goal for
the ICP-AES accuracy criterion changed from 90 – 110 percent to 95 – 105 percent for continuing calibration verification spikes at the onset of the new contract beginning on July 30, 2003. The criterion remains 90 – 110 percent for ICP-AES reference standards.
ICP-AES = inductively coupled plasma-atomic emission spectrometry MARPD = mean absolute relative percent difference N = as nitrogen
For more information on analytical methods and associated precision and accuracy criteria, see the CASTNET Quality Assurance Project Plan – Revision 2.1 (MACTEC, 2003b).
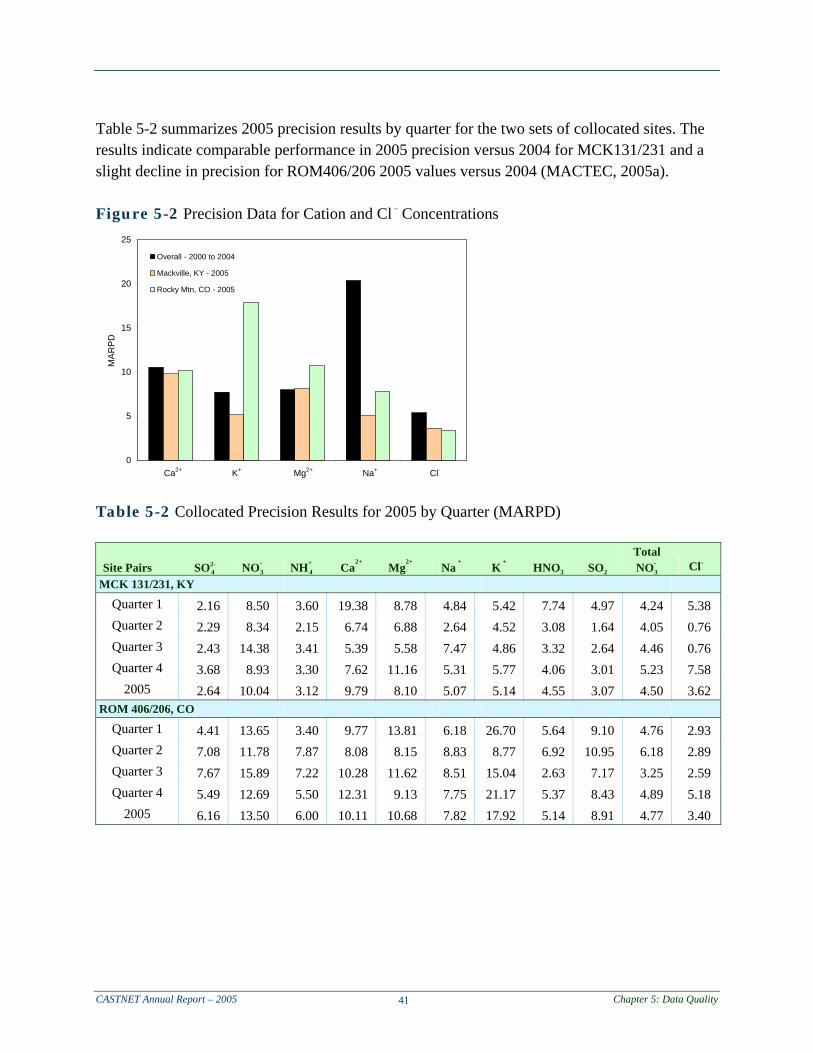
Precision statistics for 2005 for four cations and chloride (Cl –
), based on collocated ambient concentrations, are summarized in Figure 5-2. The historical MARPD statistics for both MCK131/231 and ROM406/206 do not meet the DQI criterion of 5 percent, except for Cl –
, which had a MARPD of approximately 5 percent. As discussed in the CASTNET 2002 QA Report (MACTEC, 2004) and in the CASTNET 2002 Annual Report (MACTEC, 2003a), the very high historical MARPD for sodium (Na +
) was the result of sample bottle contamination. These bottles are no longer purchased. Also, acceptance testing of the Teflon® filter was instituted for the trace cations and Cl –
in 2003. The 2005 precision results for cations and Cl –
show that potassium (K + ), Na +
, and Cl – met the precision criterion at MCK131/231 and that Cl –
met the criterion at ROM406/206. The MARPD for potassium measured by the two filter packs at ROM406/206 was about 18 percent. This relatively poor precision was caused by very low K +
concentrations at the park. Potassium is analyzed at a wavelength of 766.4 nanometers (nm) by the inductively coupled plasma-atomic emission spectrometry (ICP-AES) instrument. This is a difficult wavelength for the ICP-AES instrument because it is close to the wavelength of the carrier gas. Low concentration levels show more noise for K +
and lower precision through repeatability as a result.
CASTNET Annual Report – 2005 Chapter 5: Data Quality 41
Table 5-2 summarizes 2005 precision results by quarter for the two sets of collocated sites. The results indicate comparable performance in 2005 precision versus 2004 for MCK131/231 and a slight decline in precision for ROM406/206 2005 values versus 2004 (MACTEC, 2005a). Figure 5-2 Precision Data for Cation and Cl –
Concentrations Table 5-2 Collocated Precision Results for 2005 by Quarter (MARPD)
CASTNET Annual Report – 2005 Chapter 5: Data Quality 42
The 2005 analytical precision results for five analytes and the three filter types are presented in Figure 5-3. The results were based on analysis of five percent of the samples that were randomly selected for replication in each batch. The results of in-run replicate analyses were compared to the results of the original concentrations. The laboratory precision data met the 5 percent measurement criterion listed in Table 5-1. Figure 5-3 Precision Results for Laboratory Replicate Samples (2005)
Ozone Concentrations CASTNET QA procedures for the EPA-sponsored ozone (O
3) analyzers are different from the EPA QA requirements for State and Local Monitoring Stations (SLAMS) monitoring (EPA, 1998). The QA procedures for the O
3 analyzers at the NPS-sponsored sites also do not meet the SLAMS requirements. While NPS utilizes the appropriate procedures and equipment, the NPS sites are calibrated twice per year versus the SLAMS requirements of four times per year. In any event, the operation of the collocated O
3 analyzers at ROM406/206, CO provides an opportunity to evaluate the precision of the independent systems. Table 5-3 provides the DQI criteria for the CASTNET continuous measurements including O
3. The precision criterion for the collocated O
3 data is 10 percent.
0
1
2
3
4
5
Nylon S
O4
Cellulo
se S
O4
Teflon
SO4
Nylon N
O3
Teflon
NO3
Teflon
NH4
Sodium
Potass
ium
Magne
sium
Calcium
Chlorid
e
Mea
n A
bsol
ute
Rel
ativ
e P
erce
ntD
iffer
ence
for I
n-R
un R
eplic
ates
TeflonSO4
2-
contribute to SO 2
NylonSO4
2-NylonNO3
-TeflonNH4
+Cellulose
SO42-
TeflonNO3
-Teflon
Na+Teflon
K+TeflonMg2+
TeflonCa2+
TeflonCl-
CASTNET Annual Report – 2005 Chapter 5: Data Quality 43
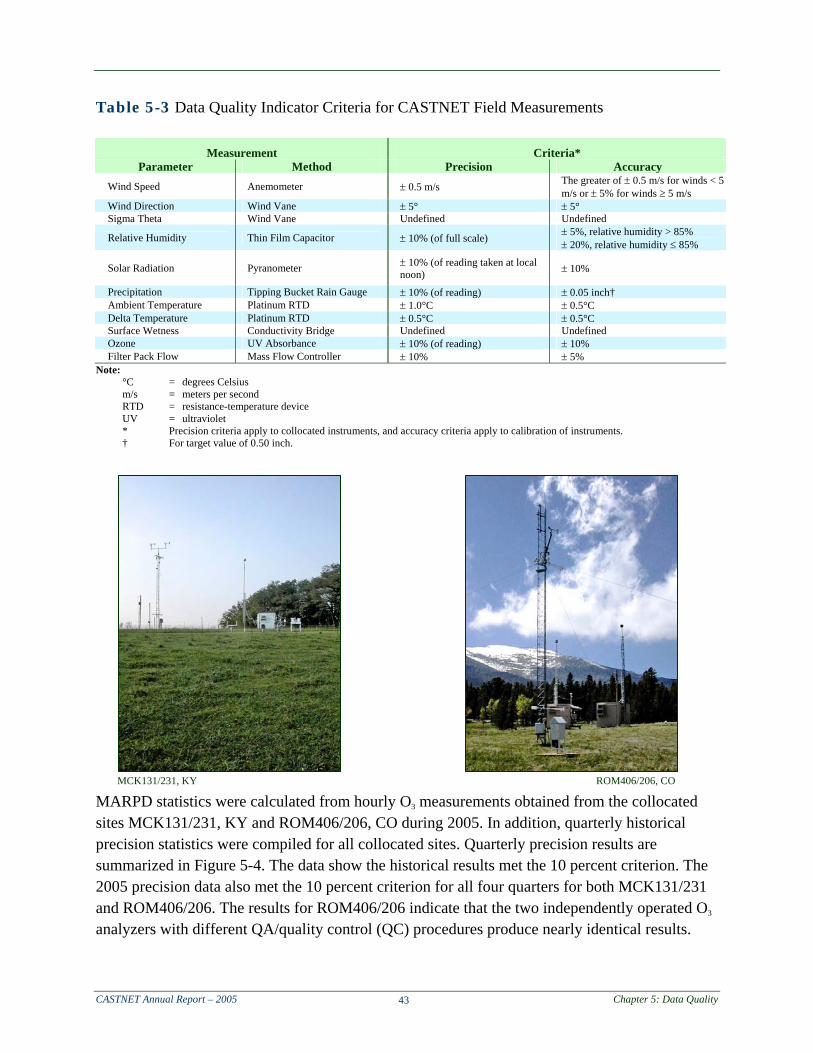
Table 5-3 Data Quality Indicator Criteria for CASTNET Field Measurements
Note: °C = degrees Celsius m/s = meters per second RTD = resistance-temperature device UV = ultraviolet * Precision criteria apply to collocated instruments, and accuracy criteria apply to calibration of instruments. † For target value of 0.50 inch.
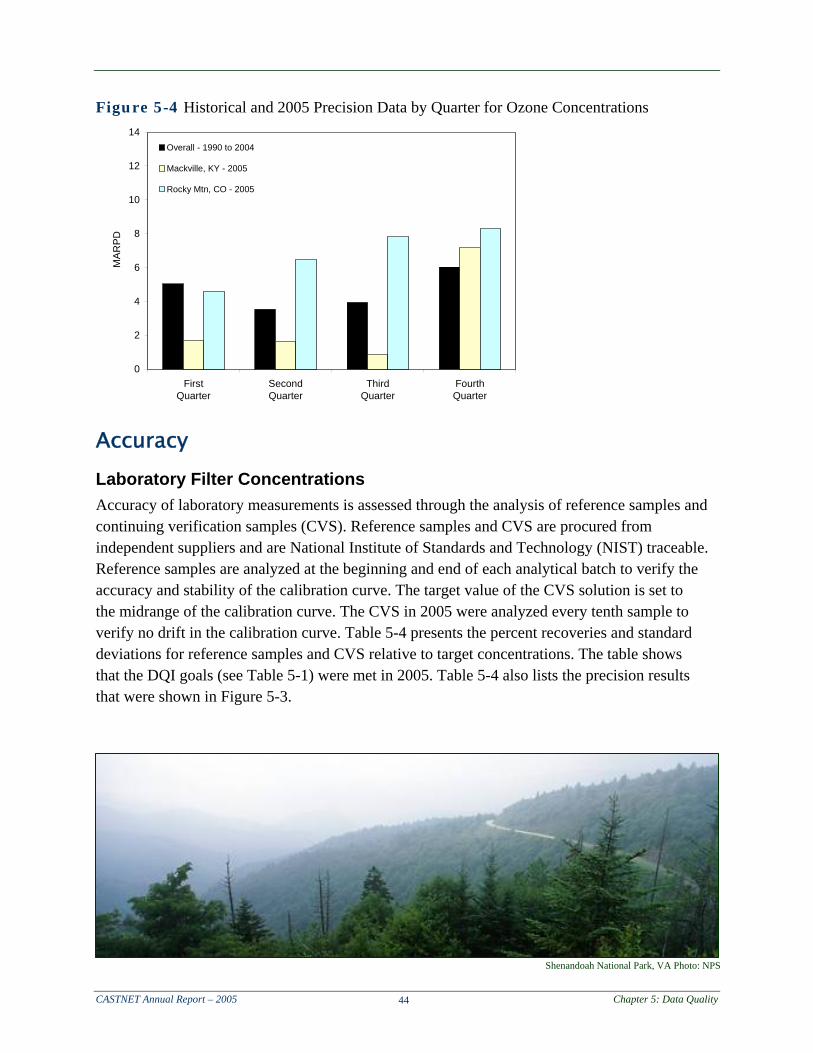
MARPD statistics were calculated from hourly O
3 measurements obtained from the collocated sites MCK131/231, KY and ROM406/206, CO during 2005. In addition, quarterly historical precision statistics were compiled for all collocated sites. Quarterly precision results are summarized in Figure 5-4. The data show the historical results met the 10 percent criterion. The 2005 precision data also met the 10 percent criterion for all four quarters for both MCK131/231 and ROM406/206. The results for ROM406/206 indicate that the two independently operated O
3 analyzers with different QA/quality control (QC) procedures produce nearly identical results.
MCK131/231, KY ROM406/206, CO
CASTNET Annual Report – 2005 Chapter 5: Data Quality 44
Figure 5-4 Historical and 2005 Precision Data by Quarter for Ozone Concentrations
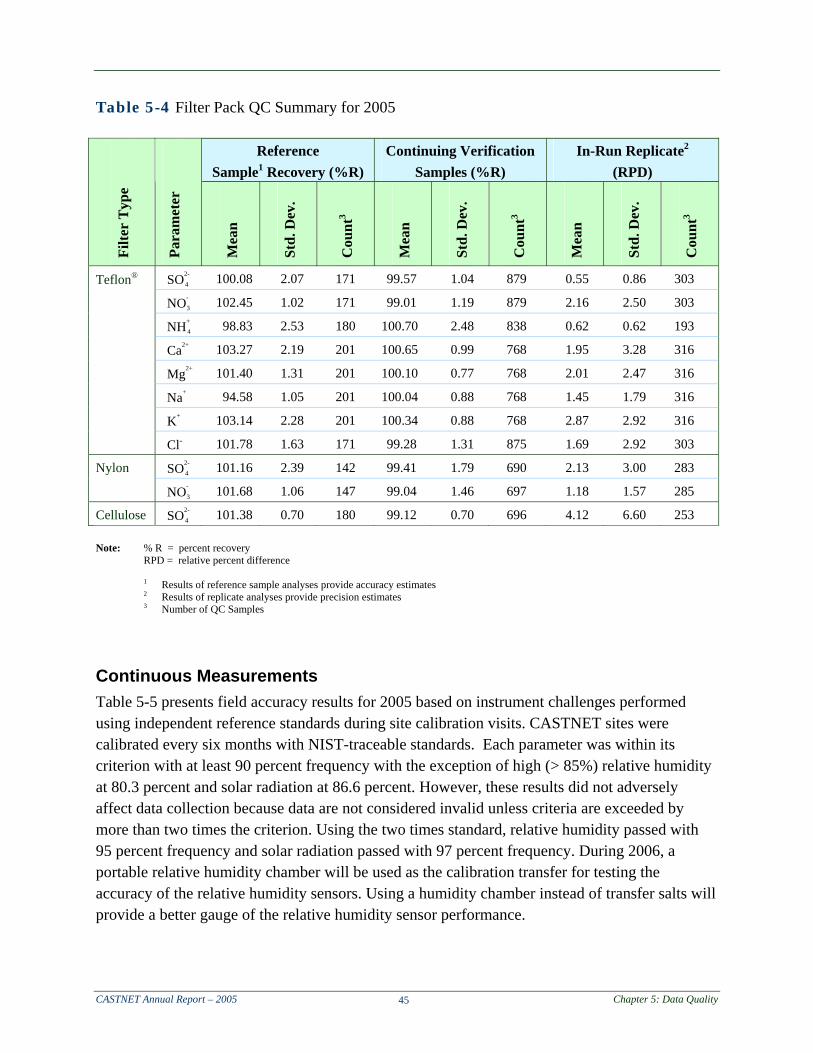
Accuracy Laboratory Filter Concentrations Accuracy of laboratory measurements is assessed through the analysis of reference samples and continuing verification samples (CVS). Reference samples and CVS are procured from independent suppliers and are National Institute of Standards and Technology (NIST) traceable. Reference samples are analyzed at the beginning and end of each analytical batch to verify the accuracy and stability of the calibration curve. The target value of the CVS solution is set to the midrange of the calibration curve. The CVS in 2005 were analyzed every tenth sample to verify no drift in the calibration curve. Table 5-4 presents the percent recoveries and standard deviations for reference samples and CVS relative to target concentrations. The table shows that the DQI goals (see Table 5-1) were met in 2005. Table 5-4 also lists the precision results that were shown in Figure 5-3.
0
2
4
6
8
10
12
14
FirstQuarter
SecondQuarter
ThirdQuarter
FourthQuarter
Overall - 1990 to 2004
Mackville, KY - 2005
Rocky Mtn, CO - 2005
MAR
PD
Shenandoah National Park, VA Photo: NPS
CASTNET Annual Report – 2005 Chapter 5: Data Quality 45
Note: % R = percent recovery RPD = relative percent difference 1 Results of reference sample analyses provide accuracy estimates 2 Results of replicate analyses provide precision estimates 3 Number of QC Samples
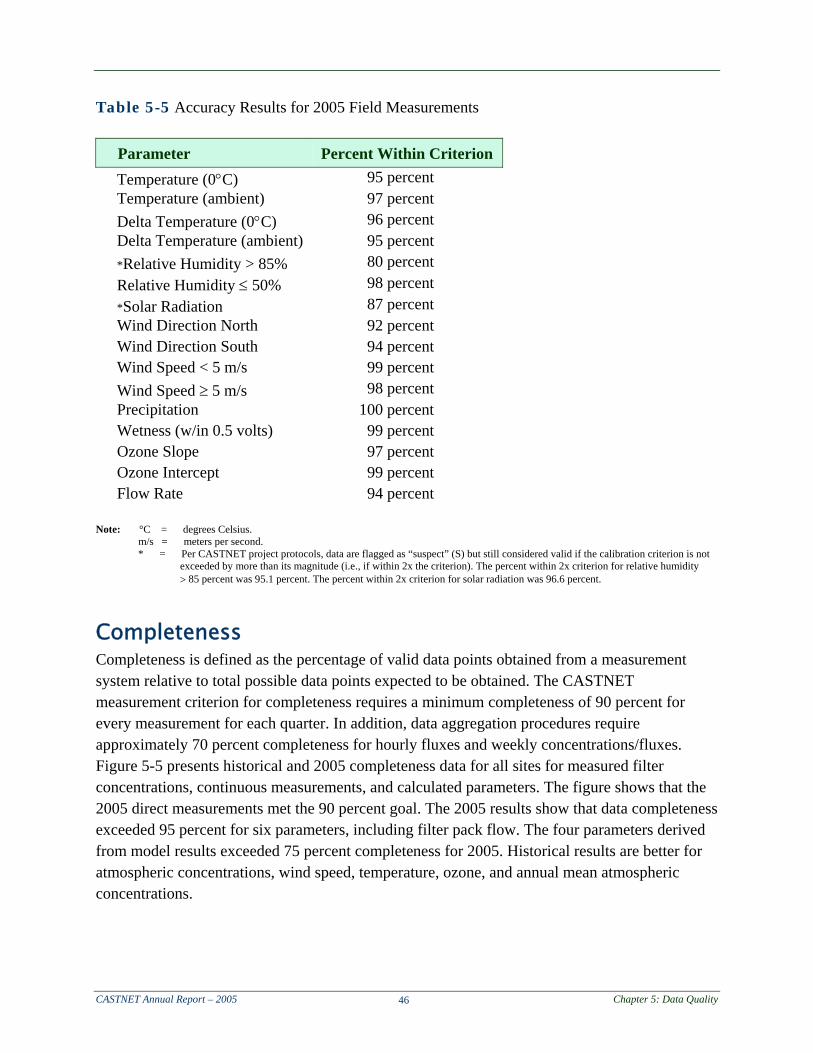
Continuous Measurements Table 5-5 presents field accuracy results for 2005 based on instrument challenges performed using independent reference standards during site calibration visits. CASTNET sites were calibrated every six months with NIST-traceable standards. Each parameter was within its criterion with at least 90 percent frequency with the exception of high (> 85%) relative humidity at 80.3 percent and solar radiation at 86.6 percent. However, these results did not adversely affect data collection because data are not considered invalid unless criteria are exceeded by more than two times the criterion. Using the two times standard, relative humidity passed with 95 percent frequency and solar radiation passed with 97 percent frequency. During 2006, a portable relative humidity chamber will be used as the calibration transfer for testing the accuracy of the relative humidity sensors. Using a humidity chamber instead of transfer salts will provide a better gauge of the relative humidity sensor performance.
CASTNET Annual Report – 2005 Chapter 5: Data Quality 46
Table 5-5 Accuracy Results for 2005 Field Measurements Parameter Percent Within Criterion
Temperature (0°C) 95 percent Temperature (ambient) 97 percent Delta Temperature (0°C) 96 percent Delta Temperature (ambient) 95 percent *Relative Humidity > 85% 80 percent Relative Humidity ≤ 50% 98 percent *Solar Radiation 87 percent Wind Direction North 92 percent Wind Direction South 94 percent Wind Speed < 5 m/s 99 percent Wind Speed ≥ 5 m/s 98 percent Precipitation 100 percent Wetness (w/in 0.5 volts) 99 percent Ozone Slope 97 percent Ozone Intercept 99 percent Flow Rate 94 percent
Note: °C = degrees Celsius. m/s = meters per second. * = Per CASTNET project protocols, data are flagged as “suspect” (S) but still considered valid if the calibration criterion is not
exceeded by more than its magnitude (i.e., if within 2x the criterion). The percent within 2x criterion for relative humidity > 85 percent was 95.1 percent. The percent within 2x criterion for solar radiation was 96.6 percent.
Completeness Completeness is defined as the percentage of valid data points obtained from a measurement system relative to total possible data points expected to be obtained. The CASTNET measurement criterion for completeness requires a minimum completeness of 90 percent for every measurement for each quarter. In addition, data aggregation procedures require approximately 70 percent completeness for hourly fluxes and weekly concentrations/fluxes. Figure 5-5 presents historical and 2005 completeness data for all sites for measured filter concentrations, continuous measurements, and calculated parameters. The figure shows that the 2005 direct measurements met the 90 percent goal. The 2005 results show that data completeness exceeded 95 percent for six parameters, including filter pack flow. The four parameters derived from model results exceeded 75 percent completeness for 2005. Historical results are better for atmospheric concentrations, wind speed, temperature, ozone, and annual mean atmospheric concentrations.
CASTNET Annual Report – 2005 Chapter 5: Data Quality 47
Figure 5-5 Historical* and 2005 Percent Completeness of Measurements and Modeled Estimates
Note:
* Black bars represent 1990-2004 data
Laboratory Intercomparison Studies
MACTEC participates in the U.S. Geological Survey (USGS) interlaboratory comparison program. Overall, eight laboratories participate in the program, receiving four samples for chemical analysis from USGS every two weeks. The samples are a mix of synthetically prepared samples, deionized water, and natural wet deposition samples. MACTEC reported the eight parameters of interest for CASTNET for 104 USGS samples during 2005. MACTEC 2005 median values for all of the parameters analyzed were within 10 percent of the target values. MACTEC generally participates in two studies by the National Water Research Institute (NWRI) of Canada’s Proficiency Testing QA Program each year in addition to interlaboratory comparison studies for the USGS. During the 2005 studies, MACTEC’s laboratory achieved the “Ideal” rating (i.e., results were within two standard deviations of the study’s assigned value) for seven of the eight CASTNET parameters tested with one sample result for sulfate listed between two and three standard deviations. The performance of the laboratory was rated as being free of systematic bias for all eight parameters. MACTEC was ranked number 5 out of 39 participating laboratories as of the end of 2005.
65 70 75 80 85 90 95 100
Annually Aggregated Flux Estimates
Annual Mean Deposition Velocities
Annual Mean Atm. Concentrations
Hourly Flux Estimates
Surface Wetness
Filter Pack Flow
Ozone
Delta Temperature
Ambient Temperature
Precipitation
Solar Radiation
Relative Humidity
Sigma Theta
Wind Direction
Scalar Wind Speed
Vector Wind Speed
Atmospheric Concentrations
Percent Completeness
MeteorologicalParameters
DQI Measurement Criterion
ModelResults
CASTNET Annual Report – 2005 Chapter 5: Data Quality 48
Conclusion DQI results demonstrate that field and laboratory processes were adequately monitored through QA/QC procedures and generally free of systematic bias during 2005. Accuracy data met the established criteria for field and laboratory parameters with the exception of relative humidity > 85 percent and solar radiation. However, since the criterion was exceeded by a value less than its own magnitude, the associated continuous data collected are considered valid. Precision data for sulfur constituents and ammonium are considered acceptable. Precision data for nitrate analyses of collocated field samples have not met the established criterion due, most likely, to the low concentrations generally measured and the unpredictable nature of the gas-particle equilibrium of the nitrate species. Completeness criteria were met for all parameters in 2005.
CASTNET Annual Report – 2005 References R-1
References Ames, R.B. and Malm, W.C. 2001. Comparison of Sulfate and Nitrate Particle Mass
Concentrations Measured by IMPROVE and the CDN. Atmospheric Environment. Vol. 35(5) 905-916.
Baumgardner Jr., R.E., Lavery, T.F., Rogers, C.M., and Isil, S.S. 2002. Estimates of the
Atmospheric Deposition of Sulfur and Nitrogen Species: Clean Air Status and Trends Network, 1990-2000. Environmental Science and Technology. 36(12):2,614-2,629.
Neal, J.A. 2000. Ozone and Sulfur Dioxide Dry Deposition to Forests: Observations and Model Evaluation. J. Geophys. Res. 105:D12:15,365-15,377.
Harding ESE, Inc., now known as MACTEC Engineering and Consulting, Inc. (MACTEC).
2003. Clean Air Status and Trends Network (CASTNET) 2001 Quality Assurance Report. Prepared for U.S. Environmental Protection Agency (EPA), Office of Air and Radiation, Research Triangle Park, NC, Contract No. 68-D-98-112. Gainesville, FL.
MACTEC Engineering and Consulting, Inc. (MACTEC). 2006a. Clean Air Status and Trends
Network (CASTNET) Fourth Quarter 2005 Data Report. Prepared for U.S. Environmental Protection Agency (EPA), Office of Air and Radiation, Clean Air Markets Division, Washington, D.C. Contract No. 68-D-03-052. Gainesville, FL.
MACTEC Engineering and Consulting, Inc. (MACTEC). 2006b. Clean Air Status and Trends
Network (CASTNET) Quality Assurance Report: Fourth Quarter 2005 (October-December) with 2005 Annual Summary. Prepared for U.S. Environmental Protection Agency (EPA), Office of Air and Radiation, Clean Air Markets Division, Washington, D.C. Contract No. 68-D-03-052. Gainesville, FL.
MACTEC Engineering and Consulting, Inc. (MACTEC). 2006c. Clean Air Status and Trends
Network (CASTNET) Third Quarter 2005 Data Report. Prepared for U.S. Environmental Protection Agency (EPA), Office of Air and Radiation, Clean Air Markets Division, Washington, D.C. Contract No. 68-D-03-052. Gainesville, FL.
CASTNET Annual Report – 2005 References R-2
References (continued) MACTEC Engineering and Consulting, Inc. (MACTEC). 2005a. Clean Air Status and Trends
Network (CASTNET) 2004 Annual Report. Prepared for U.S. Environmental Protection Agency (EPA), Office of Air and Radiation, Clean Air Markets Division, Washington, D.C. Contract No. 68-D-03-052. Gainesville, FL.
MACTEC Engineering and Consulting, Inc. (MACTEC). 2005b. Clean Air Status and Trends
Network (CASTNET) First Quarter 2005 Data Report. Prepared for U.S. Environmental Protection Agency (EPA), Office of Air and Radiation, Clean Air Markets Division, Washington, D.C. Contract No. 68-D-03-052. Gainesville, FL.
MACTEC Engineering and Consulting, Inc. (MACTEC). 2005c. Clean Air Status and Trends
Network (CASTNET) Second Quarter 2005 Data Report. Prepared for U.S. Environmental Protection Agency (EPA), Office of Air and Radiation, Clean Air Markets Division, Washington, D.C. Contract No. 68-D-03-052. Gainesville, FL.
MACTEC Engineering and Consulting, Inc. (MACTEC). 2004. Clean Air Status and Trends
Network (CASTNET) 2002 Quality Assurance Report. Prepared for U.S. Environmental Protection Agency (EPA), Research Triangle Park, NC, Contract No. 68-D-03-052. Gainesville, FL.
MACTEC Engineering and Consulting, Inc. (MACTEC). 2003a. Clean Air Status and Trends
Network (CASTNET) 2002 Annual Report. Prepared for U.S. Environmental Protection Agency (EPA), Research Triangle Park, NC, Contract No. 68-D-03-052. Gainesville, FL.
MACTEC Engineering and Consulting, Inc. (MACTEC). 2003b. Clean Air Status and Trends
Network (CASTNET) Quality Assurance Project Plan (QAPP), Revision 2.1. Prepared for U.S. Environmental Protection Agency (EPA), Research Triangle Park, NC, Contract No. 68-D-98-112. Gainesville, FL.
Meyers, T. P., Finkelstein, P., Clarke, J., Ellestad, T.G., and Sims, P.F. 1998. A Multilayer
Model for Inferring Dry Deposition Using Standard Meteorological Measurements. J. Geophys. Res. 103D17:22,645-22,661.
Rogers, C.M., Howell, H.K., and Lavery, T.F. 2006a. The Surprising Decline in Rural Ozone
Concentrations in the Eastern United States. Electric Utility Environmental Conference. Tucson, January 22-25.
CASTNET Annual Report – 2005 References R-3
References (continued) Rogers, C.M., Howell, H.K., and Lavery, T.F. 2006b. Uncertainties in CASTNET NO-
3 and HNO
3 Measurements. Paper # 06-C-858-AWMA. Air & Waste Management Association (AWMA) 99th Annual Conference. New Orleans, June 20-23.
Schwede, D.B. 2006. A Comparison of the Deposition Velocity Estimates from the CASTNET
and CAPMoN Networks. (Working paper). Research Triangle Park, NC. U.S. Department of Energy (DOE). 1997. The Effects of Title IV of the Clean Air Act
Amendments of 1990 on Electric Utilities: An Update. Energy Information Administration, Office of Coal, Nuclear, Electric and Alternate Fuels, U.S. Department of Energy, Washington, DC. DOE/EIA-0582(97).
Program Compliance and Environmental Results. EPA 430-R-06-013. September 2006. U.S. Environmental Protection Agency (EPA). 2005a. Acid Rain Program 2004 Progress
Report. EPA 430-R-05-012. October 2005. U.S. Environmental Protection Agency (EPA). 2005b. Evaluating Ozone Control Programs in
the Eastern United States. EPA 454-K-05-001. August 2005. U.S. Environmental Protection Agency (EPA). 2000. National Air Quality and Emissions
Trends Report, 1998. EPA-454-R-00-003. OAQPS, RTP, NC 27711. U.S. Environmental Protection Agency (EPA). 1998. Quality Assurance Requirements for State
and Local Air Monitoring Stations (SLAMS). 40 CFR 50, Appendix L. U.S. Environmental Protection Agency (EPA). 1997. National Ambient Air Quality Standards
for Ozone. 40 CFR 50.
AAAppppppeeennndddiiixxx AAA
Significant Events During 2005
CASTNET Annual Report – 2005 Appendix A
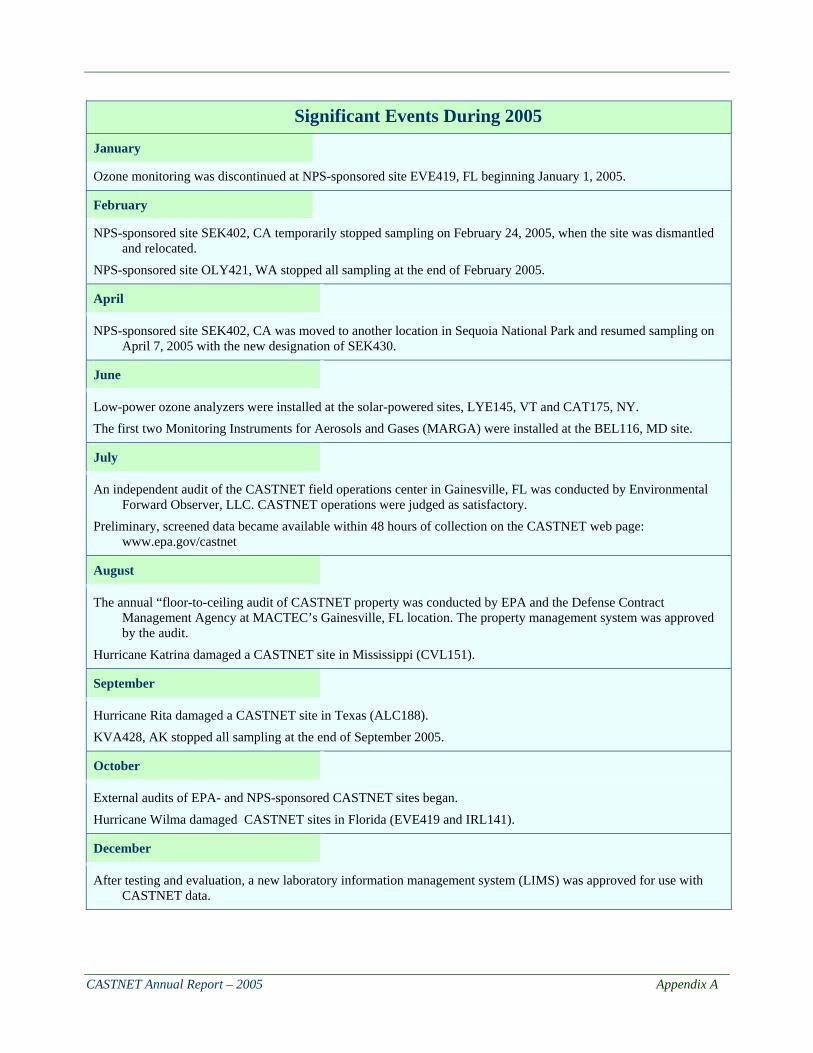
Significant Events During 2005
January
Ozone monitoring was discontinued at NPS-sponsored site EVE419, FL beginning January 1, 2005.
February
NPS-sponsored site SEK402, CA temporarily stopped sampling on February 24, 2005, when the site was dismantled and relocated.
NPS-sponsored site OLY421, WA stopped all sampling at the end of February 2005.
April
NPS-sponsored site SEK402, CA was moved to another location in Sequoia National Park and resumed sampling on April 7, 2005 with the new designation of SEK430.
June
Low-power ozone analyzers were installed at the solar-powered sites, LYE145, VT and CAT175, NY. The first two Monitoring Instruments for Aerosols and Gases (MARGA) were installed at the BEL116, MD site.
July
An independent audit of the CASTNET field operations center in Gainesville, FL was conducted by Environmental Forward Observer, LLC. CASTNET operations were judged as satisfactory.
Preliminary, screened data became available within 48 hours of collection on the CASTNET web page: www.epa.gov/castnet
August
The annual “floor-to-ceiling audit of CASTNET property was conducted by EPA and the Defense Contract Management Agency at MACTEC’s Gainesville, FL location. The property management system was approved by the audit.
Hurricane Katrina damaged a CASTNET site in Mississippi (CVL151).
September
Hurricane Rita damaged a CASTNET site in Texas (ALC188). KVA428, AK stopped all sampling at the end of September 2005.
October
External audits of EPA- and NPS-sponsored CASTNET sites began. Hurricane Wilma damaged CASTNET sites in Florida (EVE419 and IRL141).
December
After testing and evaluation, a new laboratory information management system (LIMS) was approved for use with CASTNET data.
AAAppppppeeennndddiiixxx BBB
Locational and Operational Characteristics of CASTNET Sites
CASTNET Annual Report – 2005 Appendix B B-1
Table B-1. Locational and Operational Characteristics of CASTNET Sites
Site ID Site Name Star
t dat
e
Lat
itude
(°N
)
Lon
gitu
de (°
W)
Ele
vatio
n (m
)
Dep
ositi
on F
ilter
Pa
ck1
Ozo
ne a
nd
Met
eoro
logy
2
Wet
Dep
ositi
on
Prim
ary
Lan
d U
se
Ter
rain
Rep
rese
ntat
ive
to
the
ML
M3
Spon
sor
Alabama SND152 Sand Mountain 12/27/88 34.2894 85.9704 352 • • Agri. Rolling Y EPA Alaska DEN417 Denali National Park 10/06/98 63.7258 148.9633 661 • • Forested Complex N NPS Arizona CHA467 Chiricahua National Monument 04/25/89 32.0092 109.3892 1570 • • ◊ Range Complex N NPS GRC474 Grand Canyon National Park 05/16/89 36.0597 112.1822 2073 • • Forested Complex M NPS PET427 Petrified Forest National Park 09/24/02 34.8225 109.8919 1723 • • Desert Flat Y NPS Arkansas CAD150 Caddo Valley 10/04/88 34.1792 93.0989 71 • • Forested Rolling N EPA California CON186 Converse Station 06/17/03 34.1941 116.9130 1837 • • Agri./Forested Complex N EPA DEV412 Death Valley National Monument 02/21/95 36.5092 116.8481 125 • • Desert Complex Y NPS JOT403 Joshua Tree National Monument 02/16/95 34.0714 116.3906 1244 • • Desert Complex M NPS LAV410 Lassen Volcanic National Park 07/25/95 40.5403 121.5764 1756 • • Forested Complex M NPS PIN414 Pinnacles National Monument 05/16/95 36.4850 121.1556 335 • • Forested Complex M NPS SEK430 Sequoia National Park 04/07/05 36.4894 118.8269 457 • • Forested Mountaintop N NPS YOS404 Yosemite National Park 09/25/95 37.7133 119.7061 1605 • • Forested Complex N NPS
CASTNET Annual Report – 2005 Appendix B B-2
Table B-1. Locational and Operational Characteristics of CASTNET Sites
Site ID Site Name Star
t dat
e
Lat
itude
(°N
)
Lon
gitu
de (°
W)
Ele
vatio
n (m
)
Dep
ositi
on F
ilter
Pa
ck1
Ozo
ne a
nd
Met
eoro
logy
2
Wet
Dep
ositi
on
Prim
ary
Lan
d U
se
Ter
rain
Rep
rese
ntat
ive
to
the
ML
M3
Spon
sor
Colorado GTH161 Gothic 05/16/89 38.9573 106.9854 2926 • • ◊ Range Complex N EPA MEV405 Mesa Verde National Park 01/10/95 37.1983 108.4903 2165 • • Forested Complex M NPS ROM206 Rocky Mountain National Park 07/03/01 40.2778 105.5453 2743 • • Forested Complex M EPA ROM406 Rocky Mountain National Park 12/20/94 40.2778 105.5453 2743 • • Forested Complex M NPS Connecticut ABT147 Abington 12/28/93 41.8402 72.0111 209 • • ◊ Urban-Agri. Rolling M EPA Florida EVE419 Everglades National Park 10/06/98 25.3911 80.6806 2 • •4 Swamp Flat Y NPS IRL141 Indian River Lagoon 07/09/01 30.1065 80.4554 2 • • Beach Flat Y SJRWMD SUM156 Sumatra 12/28/88 30.1065 84.9938 14 • • ◊ Forested Flat Y EPA Georgia GAS153 Georgia Station 06/28/88 33.1812 84.4100 270 • • Agri. Rolling M EPA Illinois ALH157 Alhambra 06/28/88 38.8690 89.6229 164 • • ◊ Agri. Flat Y EPA BVL130 Bondville 02/09/88 40.0520 88.3725 212 • • Agri. Flat Y EPA STK138 Stockton 12/28/93 42.2872 89.9998 274 • • Agri. Rolling M EPA
CASTNET Annual Report – 2005 Appendix B B-3
Table B-1. Locational and Operational Characteristics of CASTNET Sites
Site ID Site Name Star
t dat
e
Lat
itude
(°N
)
Lon
gitu
de (°
W)
Ele
vatio
n (m
)
Dep
ositi
on F
ilter
Pa
ck1
Ozo
ne a
nd
Met
eoro
logy
2
Wet
Dep
ositi
on
Prim
ary
Lan
d U
se
Ter
rain
Rep
rese
ntat
ive
to
the
ML
M3
Spon
sor
Indiana SAL133 Salamonie Reservoir 06/28/88 40.8164 85.6608 250 • • Agri. Flat Y EPA VIN140 Vincennes 08/04/87 38.7406 87.4844 134 • • Agri. Rolling M EPA Kansas KNZ184 Konza Prairie 03/26/02 39.1021 96.6096 348 • • Prairie Flat Y EPA Kentucky CDZ171 Cadiz 10/01/93 36.7841 87.8500 189 • • Agri. Rolling M EPA CKT136 Crockett 08/24/93 37.9211 83.0658 455 • • Agri. Rolling Y EPA MAC426 Mammoth Cave National Park 07/24/02 37.1319 86.1478 243 • • Agri./Forested Rolling M NPS MCK131 Mackville 07/31/90 37.7044 85.0483 353 • • Agri. Rolling M EPA Maine ACA416 Acadia National Park 12/01/98 44.3769 68.2608 158 • • Forested Complex M NPS ASH135 Ashland 12/20/88 46.6039 68.4142 235 • • Agri. Flat Y EPA HOW132 Howland 11/24/92 45.2158 68.7085 69 • • Forested Rolling Y EPA Maryland BEL116 Beltsville 11/01/88 39.0283 76.8175 46 • • Urban-Agri. Flat N EPA BWR139 Blackwater National Wildlife Refuge 07/04/95 38.4448 76.1115 4 • • Forest-Marsh Coastal M EPA
CASTNET Annual Report – 2005 Appendix B B-4
Table B-1. Locational and Operational Characteristics of CASTNET Sites
Site ID Site Name Star
t dat
e
Lat
itude
(°N
)
Lon
gitu
de (°
W)
Ele
vatio
n (m
)
Dep
ositi
on F
ilter
Pa
ck1
Ozo
ne a
nd
Met
eoro
logy
2
Wet
Dep
ositi
on
Prim
ary
Lan
d U
se
Ter
rain
Rep
rese
ntat
ive
to
the
ML
M3
Spon
sor
Michigan ANA115 Ann Arbor 06/28/88 42.4164 83.9019 267 • • ◊ Forested Flat M EPA HOX148 Hoxeyville 10/31/00 44.1809 85.7390 298 • • Forested Flat Y EPA UVL124 Unionville 06/28/88 43.6139 83.3597 201 • • ◊ Agri. Flat Y EPA Minnesota VOY413 Voyageurs National Park 06/13/96 48.4128 92.8292 429 • • Forested Rolling M NPS Mississippi CVL151 Coffeeville 12/27/88 34.0028 89.7989 134 • • Forested Rolling M EPA Montana GLR468 Glacier National Park 12/27/88 48.5103 113.9956 976 • • Forested Complex N NPS Nevada GRB411 Great Basin National Park 05/16/95 39.0053 114.2158 2060 • • Forested Complex M NPS New Hampshire WST109 Woodstock 12/27/88 43.9446 71.7008 258 • • Forested Complex N EPA New Jersey WSP144 Washington’s Crossing 12/27/88 40.3133 74.8726 61 • • Urban-Agri. Rolling M EPA
CASTNET Annual Report – 2005 Appendix B B-5
Table B-1. Locational and Operational Characteristics of CASTNET Sites
Site ID Site Name Star
t dat
e
Lat
itude
(°N
)
Lon
gitu
de (°
W)
Ele
vatio
n (m
)
Dep
ositi
on F
ilter
Pa
ck1
Ozo
ne a
nd
Met
eoro
logy
2
Wet
Dep
ositi
on
Prim
ary
Lan
d U
se
Ter
rain
Rep
rese
ntat
ive
to
the
ML
M3
Spon
sor
New York CAT175 Claryville 05/10/94 41.9423 74.5519 765 • •5 Forested Complex N EPA CTH110 Connecticut Hill 09/28/87 42.4010 76.6535 515 • • ◊ Forested Rolling N EPA HWF187 Huntington Wildlife Forest 05/28/02 43.9732 74.2232 502 • • Forested Complex N EPA North Carolina BFT142 Beaufort 12/28/93 34.8843 76.6213 2 • • ◊ Agri. Flat Y EPA CND125 Candor 09/25/90 35.2643 79.8382 198 • • ◊ Forested Rolling M EPA COW137 Coweeta 11/04/87 35.0605 83.4302 686 • • Forested Complex N EPA PNF126 Cranberry 12/27/88 36.1040 82.0448 1250 • • ◊ Forested Mountaintop M EPA North Dakota THR422 Theodore Roosevelt National Park 10/06/98 46.8947 103.3778 850 • • Range Rolling Y NPS Ohio DCP114 Deer Creek State Park 09/28/88 39.6358 83.2600 267 • • ◊ Agri. Rolling Y EPA LYK123 Lykens 01/10/89 40.9169 82.9981 303 • • ◊ Agri. Flat M EPA OXF122 Oxford 08/18/87 39.5314 84.7231 284 • • Agri. Rolling N EPA QAK172 Quaker City 09/28/93 39.9431 81.3378 372 • • Agri. Rolling M EPA Oklahoma CHE185 Cherokee Nation 04/02/02 35.7507 94.6700 299 • • Agri. Rolling Y EPA Ontario EGB181 Egbert, Ontario 12/27/94 44.2317 79.7840 251 •6 •4 Agri. Rolling Y EPA
CASTNET Annual Report – 2005 Appendix B B-6
Table B-1. Locational and Operational Characteristics of CASTNET Sites
Site ID Site Name Star
t dat
e
Lat
itude
(°N
)
Lon
gitu
de (°
W)
Ele
vatio
n (m
)
Dep
ositi
on F
ilter
Pa
ck1
Ozo
ne a
nd
Met
eoro
logy
2
Wet
Dep
ositi
on
Prim
ary
Lan
d U
se
Ter
rain
Rep
rese
ntat
ive
to
the
ML
M3
Spon
sor
Pennsylvania ARE128 Arendtsville 06/28/88 39.9231 77.3078 269 • • ◊ Agri. Rolling M EPA KEF112 Kane Experimental Forest 01/03/89 41.5981 78.7683 622 • • Forested Rolling Y EPA LRL117 Laurel Hill State Park 12/15/87 39.9883 79.2522 615 • • Forested Complex N EPA MKG113 M.K. Goddard State Park 01/12/88 41.4250 80.1447 384 • • Forested Rolling N EPA PSU106 Penn. State University 01/06/87 40.7209 77.9316 376 • • Agri. Rolling M EPA South Dakota WNC429 Wind Cave National Park 11/18/03 43.5578 103.4839 1292 • • Prairie Rolling M NPS Tennessee ESP127 Edgar Evins State Park 03/22/88 36.0389 85.7330 302 • • Forested Rolling N EPA GRS420 Great Smoky Mountains National Park 10/06/98 35.6331 83.9422 793 • • Forested Complex N NPS SPD111 Speedwell 06/12/89 36.4698 83.8265 361 • • ◊ Agri. Rolling Y EPA Texas ALC188 Alabama-Coushatta 04/02/04 30.4210 94.4045 101 • • Forested Rolling Y EPA BBE401 Big Bend National Park 07/18/95 29.3022 103.1772 1052 • • Forested Complex M NPS Utah CAN407 Canyonlands National Park 01/24/95 38.4586 109.8211 1809 • • Desert Complex M NPS Vermont LYE145 Lye Brook 03/30/94 43.0510 73.0613 730 • •5 ◊ Forested Mountaintop N EPA
CASTNET Annual Report – 2005 Appendix B B-7
Table B-1. Locational and Operational Characteristics of CASTNET Sites
Site ID Site Name Star
t dat
e
Lat
itude
(°N
)
Lon
gitu
de (°
W)
Ele
vatio
n (m
)
Dep
ositi
on F
ilter
Pa
ck1
Ozo
ne a
nd
Met
eoro
logy
2
Wet
Dep
ositi
on
Prim
ary
Lan
d U
se
Ter
rain
Rep
rese
ntat
ive
to
the
ML
M3
Spon
sor
Virginia PED108 Prince Edward 11/03/87 37.1653 78.3070 150 • • ◊ Forested Rolling M EPA SHN418 Shenandoah National Park 06/28/88 38.5231 78.4347 1073 • • Forested Mountaintop M NPS VPI120 Horton Station 06/02/87 37.3300 80.5573 920 • • Forested Mountaintop N EPA Washington MOR409 Mount Rainier National Park 08/29/95 46.7583 122.1244 415 • • Forested Complex N NPS NCS415 North Cascades National Park 02/14/96 48.5397 121.4472 109 • • Forested Complex M NPS West Virginia CDR119 Cedar Creek State Park 11/10/87 38.8794 80.8478 234 • • ◊ Forested Complex N EPA PAR107 Parsons 01/19/88 39.0906 79.6614 510 • • Forested Complex N EPA Wisconsin PRK134 Perkinstown 09/27/88 45.2066 90.5972 472 • • ◊ Agri. Rolling M EPA Wyoming CNT169 Centennial 08/19/91 41.3722 106.2422 3178 • • Range Complex M EPA PND165 Pinedale 12/27/88 42.9214 109.7900 2388 • • Range Rolling M EPA YEL408 Yellowstone National Park 06/26/96 44.5597 110.4006 2400 • • Forested Rolling N NPS
CASTNET Annual Report – 2005 Appendix B B-8
1. The dry deposition filters are analyzed for the following constituents:
Teflon® = SO2-4, NO-
3, NH+ 4, Cl -, K +, Na +, Mg2+
, Ca2+
Nylon = SO2-4, NO-
3 (reported as HNO 3)
Cellulose = SO2-4 (reported as SO
2)
2. Meteorological sensors: temperature, delta temperature, relative humidity, solar radiation, vector wind speed, scalar wind speed, wind direction, sigma theta, surface wetness, and precipitation via tipping bucket rain gauge.
3. N = No; Y = Yes; M = Marginal; N/A = Not Applicable. 4. O
3 not measured. 5. Solar-powered sites. 6. Composite filter pack, day filter pack, and night filter pack.
• Indicates current monitoring.
◊ Indicates discontinued monitoring. Measurements were discontinued at the various sites because of several reasons
including: (1) rotate limited number of instruments; (2) redundant measurements (e.g., with IMPROVE and NADP/NTN); and (3) funding limitations.
100 and 200 series = EPA – Operated Sites 400 series = NPS – Operated Sites 141 site = St. Johns River Water Management District (SJRWMD)
AAAppppppeeennndddiiixxx CCC
Acronyms and Abbreviations
CASTNET Annual Report – 2005 Appendix C
C-1
List of Acronyms and Abbreviations ARP Acid Rain Program °C degrees Celsius Ca2+
particulate calcium ion CAAA Clean Air Act Amendments CAPMoN Canadian Air and Precipitation Monitoring Network CASTNET Clean Air Status and Trends Network Cl- particulate chloride ion CO carbon monoxide CVS continuing verification samples DQI data quality indicator EPA U.S. Environmental Protection Agency HNO
kg/ha/yr kilograms per hectare per year km kilometer LAI leaf area index LIMS laboratory information management system MACT maximum available control technology MACTEC MACTEC Engineering and Consulting, Inc. MARGA monitoring instrument for aerosols and gases MARPD mean absolute relative percent difference MDN Mercury Deposition Network Mg2+
particulate magnesium ion mg/L milligrams per liter MLM Multi-Layer Model mm millimeter N nitrogen Na+
particulate sodium ion NAAQS National Ambient Air Quality Standards NADP/NTN National Atmospheric Deposition Program/National Trends Network
CASTNET Annual Report – 2005 Appendix C
C-2
List of Acronyms and Abbreviations (continued) NBP NOx Budget Trading Program NDDN National Dry Deposition Network NH3 ammonia NH +
4 particulate ammonium NH
4NO 3 ammonium nitrate
(NH 4)
2SO
4 ammonium sulfate NIST National Institute of Standards and Technology nm nanometer NO -
3 particulate nitrate NO
x nitrogen oxides NO
y total reactive oxides of nitrogen NPS National Park Service NWRI National Water Research Institute O
3 ozone OTC Ozone Transport Commission ppb parts per billion ppm parts per million QA quality assurance QAPP Quality Assurance Project Plan QC quality control RACT reasonably available control technology S sulfur SIP State Implementation Plan SLAMS State and Local Monitoring Stations SO