29
Emerging Trends in Clean Energy Finance October 13, 2015 Ray Wood, Global Head of Power, Bank of America Merrill Lynch

Emerging Trends in Clean Energy Finance
October 13, 2015
Ray Wood, Global Head of Power, Bank of America Merrill Lynch

The World at Night
38
56
64
67
82
306
Tanzania
DR Congo
Ethiopia
Bangladesh
Nigeria
India
Top 10 Countries
Electricity Access Deficit
(mm)
1
25
29
31
31
38
0 175 350
Myanmar
Uganda
Kenya
Sudan
Tanzania
Over one billion people do not have sufficient access to electricityOver one billion people do not have sufficient access to electricity
Source: World Bank.

Factors Encouraging Transition to Clean Energy
Security of Energy Supply
Environmental Stewardship
2
Cost Competitiveness
Individual Preference for Clean Power
Utility and Distributed-Scale Applications

Several Challenges Remain
Energy Demand
Technology Government
� Numerous
approaches taken
across the world
� Finding
opportunities when
� Lowering the levelized
cost
� Low demand growth in developed
markets where capital is available,
� High demand growth where capital
is not
3 Source: World Bank.
Technology Innovation
Capital Investment
Government Policy
opportunities when
incentives are
removed
� Recognizing and
overcoming the
challenge of change
to the existing
utility model
� Increased competition in
low commodity price
environment
� Applying disruptive
technologies (batteries,
smart grids, fuel cells)
� Expanding financial tools to meet market
demand for renewable investment
� De-risking emerging market infrastructure
investment

Growth Historically ($Bn)
151
208
247
235
215
254
$300
AMER
EMEA
APAC
Investment has Accelerated
Outlook 2015 – 2035 ($Bn)
$6,900$6,800
$8,000
4
2014 saw a new high of $254bn+ in Global Renewable Power Investment2014 saw a new high of $254bn+ in Global Renewable Power Investment
Source: Bloomberg New Energy Finance (“BNEF”) ‘Global Trends in Clean Energy Investment’ January, 2015.
33
53
69
107
144 151
$0
$150
2004 2005 2006 2007 2008 2009 2010 2011 2012 2013 2014
$2,700
$0
$4,000
Renewables &
Nuclear
Generation
Transmission &
Distribution
Thermal
Generation

Declining Renewable LCOE, Excluding Subsidies ($/MWh)
Innovation and Scale Efficiencies have Driven Down
Costs
� Wind:$/MW turbine prices
have stabilized as developers
opt for higher-priced, longer-
rotor diameter turbines,
while the price per MWh
continues to decline on
better turbine performance
2015
2014
2013
2012
$225
$291 300
2009-2015
(29%)
2009-2015
(36%)
2009-2015
(52%)
5
� Solar: Continued declines in
capex assumptions. $1.57/W
all-in capex is now possible in
most of the world, although
tariffs have temporarily
slowed module costs decline
Levelised Cost of Energy (“LCOE”) for Renewables continues to decline driven by technology improvements, competitive
equipment supply dynamics and lower financing costs
Levelised Cost of Energy (“LCOE”) for Renewables continues to decline driven by technology improvements, competitive
equipment supply dynamics and lower financing costs
Source: BNEF ‘H1 2015 Global LCOE OUTLOOK’ March, 2015.
2012
2011
2010
2009
$96
$68
$143 $139
0
150
Onshore Wind PV - Thin Film PV - c-Si tracking

Leading a Steady Increase of Renewable
Generation’s Contribution to the Electricity Mix
19%19% 19%
20%
20% 19% 19% 19%
20%
21% 21%22%
22% 23%
20%
25%
Renewable Generation
(% of Global Electricity Consumption)
20%
25%
Renewable Generation
(% of US Electricity Consumption)
6____________________
Source: National Renewable Energy Laboratory “2013 Renewable Energy Data Book” October 2014 and Enerdata Consulting.
5%
10%
15%
9%
8%
10%10%
10% 10%10%
9%10%
11% 11%
13% 13%13%
5%
10%
15%

Wind and Solar Technology Innovation Should
Continue
Onshore Wind LCOE, 2014-17 ($ / MWh)Residential Solar Average Cost per Watt, 2014-17 ($)
$68$65
$59
$55
$50
$75
0.65
0.60
0.45
0.50
0.47
0.30
0.20
0.20
0.18
0.16
0.12
$2.90
$2.66
$2.15
$1.77
$1.50
$3.00 Other
Sales
Installation
Other BoS
Racking
Inverter
Panel
7
Solar system costs could decline 40% in the next
2-3 years based on forecasts
Solar system costs could decline 40% in the next
2-3 years based on forecasts
Source: BNEF ‘Global Market Outlook: 2030’ June, 2014, Wall Street ResearchNotes: Onshore Wind - 50% Capacity Factor based on linear relationship with 40% Capacity Factor
$0
$25
Current 2015 2016 2017
0.75 0.70 0.65 0.50
0.25 0.23
0.20
0.17
0.25 0.23
0.19
0.16
0.30
0.25
0.20
0.17
0.45
0.45
0.20
$0.00
$1.50
2014 2015 2016 2017
Increasing Capacity Factors driven by improving turbine
and gearbox technology will support a further decline
Increasing Capacity Factors driven by improving turbine
and gearbox technology will support a further decline

5,312
10,569 11,000
Accelerating the Transition to Renewable Power
Generation
Annual New Build Generation (GW)
Renewables
Nuclear
Fossil Fuels
288
273 276
304315
360
400
Global Generation Capacity (GW)
225%
Increase
1,634
5,579
0
5,500
2012 2030
8
Renewable Generation will Capture a Significant Majority of Future Generation AdditionsRenewable Generation will Capture a Significant Majority of Future Generation Additions
Source: BNEF ‘2030 Market Outlook Overview’ June, 2014.
0
200
2013 2014 2015 2020 2025 2030

Disruptive Technologies Support This Evolution:
Smarter Grid Networks
17,213
19,369 19,925
23,736
25,965 26,869
27,609
$30,000
Global Smart Grid Spending, 2012-20e ($mm)
Rest of Asia
Japan
China
EMEA
North and South America
Central Generation
Transmission Networks
Demand Response
Connecting the Policy & Technology Elements of the
Power Chain
Utilities Regulators
9 Source: BNEF Potential Cost Reductions in EV lithium-ion Battery Packs, Sept 2015.
15,707 15,536
17,213
$0
$15,000
2012 2013 2014 2015 2016 2017 2018 2019 2020
Networks
Smart MetersDistributed Generation
Response
Individuals Businesses

Disruptive Technologies Support This Evolution:
Batteries
Cost of Lithium Ion Technology
160
200
240
800
1,000
1,200
$/kw-hour of capacity GWh per year
Global Production Capacity
10
____________________
Source: BNEF Potential Cost Reductions in EV lithium-ion Battery Packs, Sept 2015, 2H2014 Battery Cost Update.Note: The battery pack price line forecast in chart is projected cost based on the learning curve of EV lithium-ion batteries based on Bloomberg New
Energy Finance.(1) Brattle Group, “The Value of Distributed Electricity Storage in Texas” November 2014
0
40
80
120
0
200
400
600
2010 2012 2014 2016 2018 2020 2022 2024 2026 2028 2030
Annual battery production (GWh) Battery pack price ($/kWh) Observed electric vehicle battery price ($/kWh)
Powerpack
$250/kWh
H2 2014:$540/kWh
Estimated Level to Achieve Cost
Savings for Utility Installation (1)
H1 2015:$400/kWh
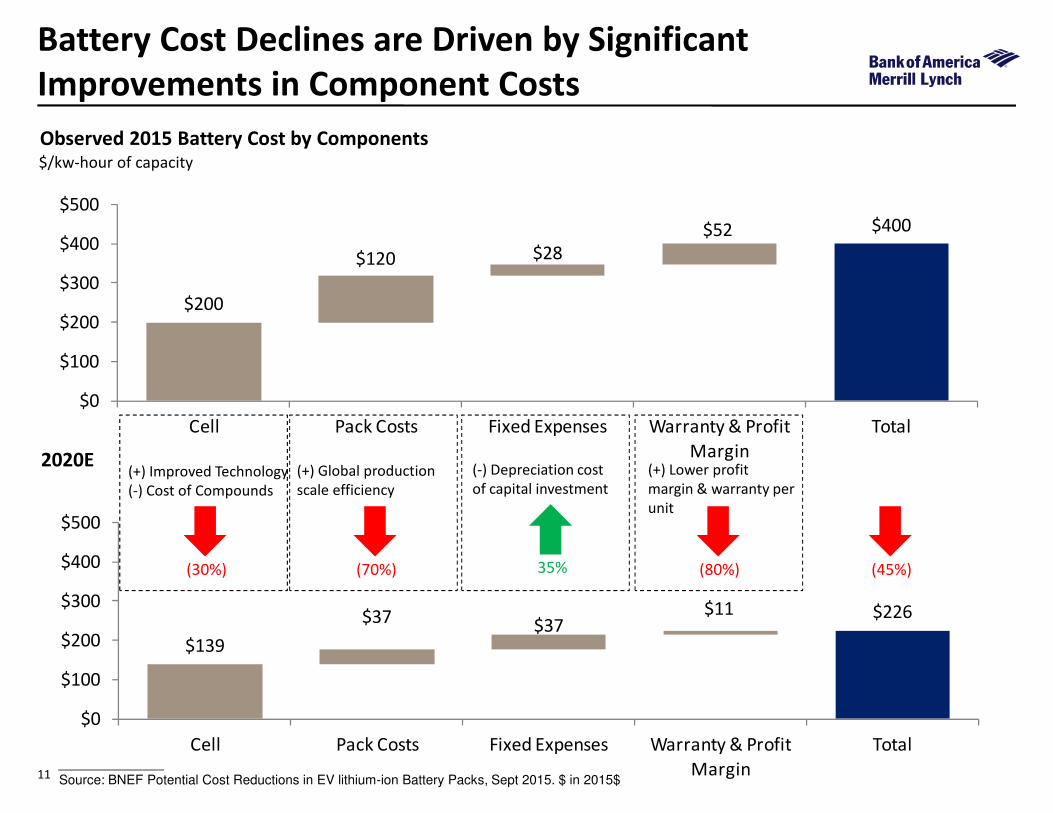
Battery Cost Declines are Driven by Significant
Improvements in Component Costs
Observed 2015 Battery Cost by Components$/kw-hour of capacity
$120 $28
$52
$200
$400
$0
$100
$200
$300
$400
$500
11____________________
Source: BNEF Potential Cost Reductions in EV lithium-ion Battery Packs, Sept 2015. $ in 2015$
$0
Cell Pack Costs Fixed Expenses Warranty & Profit
Margin
Total
2020E
$37 $37$11
$139
$226
$0
$100
$200
$300
$400
$500
Cell Pack Costs Fixed Expenses Warranty & Profit
Margin
Total
(30%) (70%) (80%)35% (45%)
(+) Improved Technology
(-) Cost of Compounds
(+) Global production
scale efficiency
(-) Depreciation cost
of capital investment
(+) Lower profit
margin & warranty per
unit

Creating a New Model for Utility Operations
Traditional Utility Model Utilities in the Future
12 Graphic Credit to Hawaiian Electric Industries
Generation by Coal/Oil/Gas/Nuclear/Hydro
Large central units
One Way Grid
Limited demand flexibility
Limited retail price transparency
OldGrowing Renewable Mix w/ Thermal Support
Increasing mix of smaller capacity units
Smart Two-way Grid
Increasing demand response capabilities
Real-time prices
New

Energy infrastructure requires an environment that
enables long-term investment built on stabilityM
icro
Infrastructure Projects
Regulatory
Framework
Regulatory
Framework
13 Source: World Bank.
Ma
cro
FrameworkFramework
Economic StabilityEconomic Stability
Political and Institutional Stability
Political and Institutional Stability
An enabling investment environment is characterised by: peace and stability, the rule of law, good governance with
accountability and transparency, the absence of corruption, adequate infrastructure, an educated workforce, clear property
rights and enforceable contracts.
An enabling investment environment is characterised by: peace and stability, the rule of law, good governance with
accountability and transparency, the absence of corruption, adequate infrastructure, an educated workforce, clear property
rights and enforceable contracts.

UN Estimates that $650bn/year of additional capital
needs to be invested to meet its Energy Goals
2030E Global Power Investment Needs ($ Bn)
11
4
65
95 98
66
23
2
100
150
200
250
US
D B
illi
on
1
2
3
Goals
Universal access to
modern energy
technology (today: 85%)
30% of world’s energy
supply from renewables
(today: 18%)
Doubling rate of annual
14 Source: IRENA REMap 2014; World Bank, IEA GTF 2015
49
17
65
1 2 9
66
50
36
57
0
50
North
America
Europe Developed
Asia &
Oceania
Developing
Asia
Middle
East
Africa Latin
America
Investment 2012 REmap 20302030
3 Doubling rate of annual
energy efficiency gains
(today: 1.3%)

The Equity Market Opportunity Remains Large
Compared to Traditional Energy Companies
$4,650
Global Market Capitalization of Renewable & Efficiency-Driven Public Companies Compared to the Oil & Gas
Industry ($bn)
15 Source: Factset and BNEF as of September 17, 2015.
The Global Market Cap of the Renewable Energy/Energy Efficiency Sector is only 30% Larger than ExxonMobilThe Global Market Cap of the Renewable Energy/Energy Efficiency Sector is only 30% Larger than ExxonMobil
$414$310
Public Renewable
Energy/Efficiency Companies
Exxon Mobil Global Oil & Gas

200
250
300
350
400
Public Equity Valuations Demonstrate Volatile Market
Psychology
Solar Index Returns (10-yr Return)
Financial
Crisis
150
200
250
300
Solar Index Returns (Since Summer 2013)
46.5%
Recent
Decline
0
50
100
150
200
16 Source: NYSE Bloomberg Global Solar Energy Index as of 10/07/15
Viewed as a growth-oriented sector, Renewable Energy Stocks are sensitive to investor sentiment regarding economic growth
outlook, commodity markets, and changes in capital market inflows/outflows
Viewed as a growth-oriented sector, Renewable Energy Stocks are sensitive to investor sentiment regarding economic growth
outlook, commodity markets, and changes in capital market inflows/outflows
0
50
100
150
(26.5%)
46.5%

Incentives to Support Renewables can take Many
Forms
Regulatory Policies & Targets Fiscal Incentives Public Financing
Country Name
Re
ne
wa
ble
En
erg
y
Ta
rge
ts
Fee
d-I
n
Ta
riff
/pre
miu
m
Pa
yme
nt
Ele
ctri
c U
tilit
y q
uo
ta
ob
liga
tio
n/
RP
S
Ne
t M
ete
rin
g
Bio
fue
ls o
blig
ati
on
/
Ma
nd
ate
He
at
Ob
liga
tio
n/
ma
nd
ate
Tra
da
ble
RE
C
Ca
pit
al S
ub
sid
y, g
ran
t,
or
reb
ate
Inve
stm
en
t o
r
pro
du
ctio
n t
ax
cre
dit
s
Re
du
ctio
ns
in s
ale
s,
en
erg
y, C
O2
, V
AT
, o
r
oth
er
taxe
s
En
erg
y p
rod
uct
ion
pa
yme
nt
Pu
blic
inve
stm
en
t,
loa
ns,
or
gra
nts
Pu
blic
co
mp
eti
tive
bid
din
g/t
en
de
rin
g
United States ○ ○ ● ● ○ ● ● ● ● ○
India ● ● ● ● ● ○ ● ● ● ● ● ● ●
France ● ● ● ● ● ● ● ● ●
Germany ● ● ● ● ● ● ● ● ●
indicates state/
provincial level
policy
indicates national
level policy
17 Source: Global Status Report, REN21 2013
Germany ● ● ● ● ● ● ● ● ●
Indonesia ● ● ● ● ● ● ● ● ●
Brazil ● ● ● ○ ● ● ● ●
Mexico ● ● ● ● ● ●
South Africa ● ● ● ● ● ●
Ghana ● ● ● ● ●
Kenya ● ● ● ●
Nigeria ● ● ● ●
Vietnam ● ● ● ●
Turkey ● ● ● ● ●
Colombia ● ● ●
Mozambique ● ● ●

The Experience of the EU Shows the Importance of
this Stability Even in OECD Countries
Major
Minor
None
N/A
Retroactive policy changes across the EU
� The EU has seen a drop in clean energy
investment from a peak of $114bn in 2011 to
$53bn in 2014
18 Source: BNEF
Clean energy investment in selective countries ($bn)
0
10
20
30
40
50
2004 2005 2006 2007 2008 2009 2010 2011 2012 2013 2014 2015
Czech Republic Greece Italy Romania Spain

Capital Can Come from Many Sources
Institutional & Retail Investors Banks Utilities
Governments
19
Private EquityVenture Capital
Insurance Companies
Other Strategics
Pension Funds
Sovereign Wealth Funds
Multi
National
Develop.
Banks

Other Equity
Finance has Many Roles to Play in Delivering This Capital to Meet Investment Needs
Venture Capital
Private Equity
Public EquityCommodities
M&A
Debt
Debt
20
Project Finance
Bank Loans
Bonds
Green Bonds
Derivatives
Financial Institutions are Critical to the Development of Renewable GenerationFinancial Institutions are Critical to the Development of Renewable Generation

$555
$924
$1,091
$926$1,000
$1,500
Developer / YieldCo
EPC / Installer / Financier
Manufacturer
Renewable Energy Initial Public Offerings ($ mm)
IPO Markets Follow this Volatility
21
$159
$505$555
$123 $143
$485
$0
$500
2005 2006 2007 2008 2009 2010 2011 2012 2013 2014 2015 1H 2015 2H
Initial
Public
Offerings
Source: BofAML Global Corporate and Investment Banking (“BofAML GCIB”), Factset and BNEF, ‘The YieldCo phenomenon, the U.S. solar pipeline, and the bigger picture’ November 2014.Note: Excludes European Utility spin-outs of renewable segments.

1
1
3
The YieldCo Model Emerges
■ Public YieldCos have created a new
investment class
■ A YieldCo is a dividend growth
oriented vehicle created to hold
and acquire assets with a
predictable revenue stream and
long-term tax shields to fund a
regular and increasing dividend to
public shareholders
■ Following a robust initial reaction
to the model, in the Summer of
2015 these companies have been
Number of YieldCos Increasing
5-10
6
2012 2013 2014 2015E
1
22
2015 these companies have been
impacted by macro conditions that
have investors taking a more risk-
off investment stance including:
■ Relatively limited public float
of their shares
■ Continued deterioration in
commodity markets
■ Concern over emerging
market slow down for those
with non-OECD exposure
■ Share price reaction in a
future rising interest rate
environment
Source: BofAML GCIB.
$4,000
$5,000
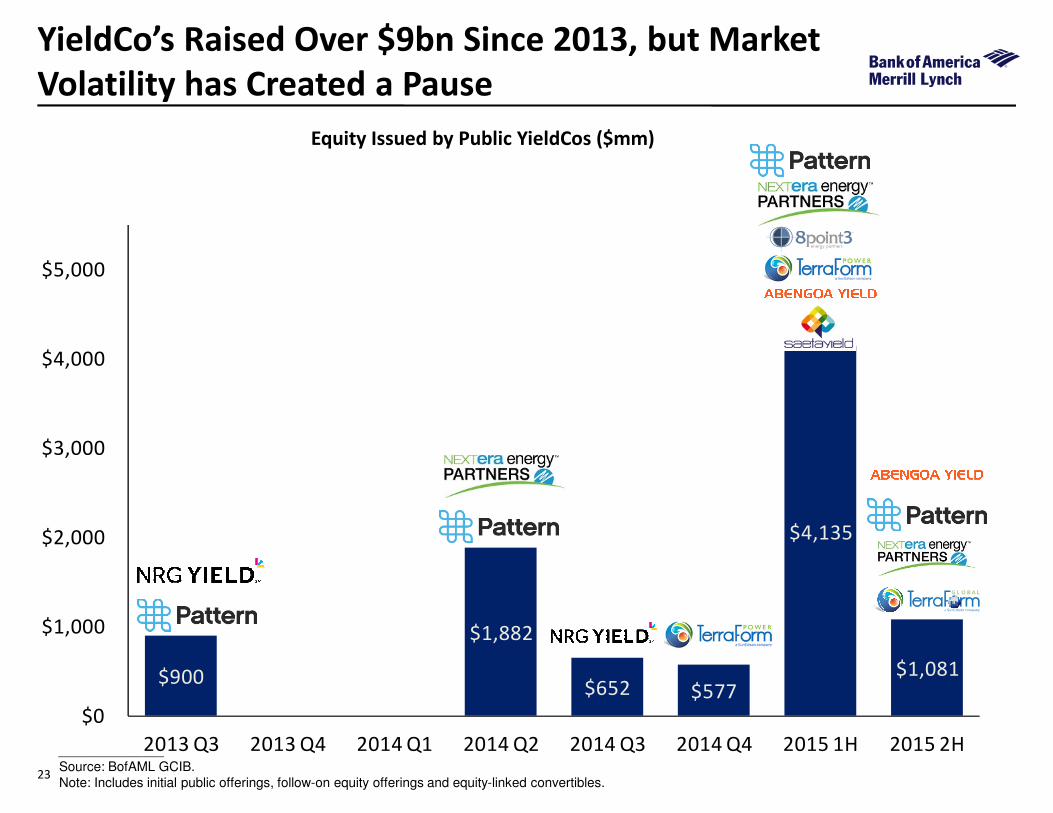
YieldCo’s Raised Over $9bn Since 2013, but Market
Volatility has Created a Pause
Equity Issued by Public YieldCos ($mm)
$900
$1,882
$652 $577
$4,135
$1,081
$0
$1,000
$2,000
$3,000
2013 Q3 2013 Q4 2014 Q1 2014 Q2 2014 Q3 2014 Q4 2015 1H 2015 2H
23
____________________
Source: BofAML GCIB.Note: Includes initial public offerings, follow-on equity offerings and equity-linked convertibles.

Green Bonds Allowing a Wide Range of Companies
to Support Renewable Investments
4.0
5.0
6.0
7.0
Coupon (%)
US investment grade corporate
bond trend line
24 Source: BNEF, BofAML GCIB.
0.0
1.0
2.0
3.0
0 2 4 6 8 10 12
$50m
Tenor (yrs)
Scale:
European investment grade
corporate bond trend line

ABS
Project
US Municipal
Corporates
Supranational, Sovereign & Agency
38.836.6
$40
Annual Green Bond Issuance ($ Bn)
The Green Bond Market has Matured into a
Significant Source of Funding
Extra
po
late
d
25 Source: BNEF ‘Green Bonds Market Outlook - Q1 2015’ January 2015.
0.9 0.4 0.5
4.8
3.24.3
15.0
18.3
$0
$20
2007 2008 2009 2010 2011 2012 2013 2014 1H2015
Issuance has Grown to ~$40BN/yrIssuance has Grown to ~$40BN/yr
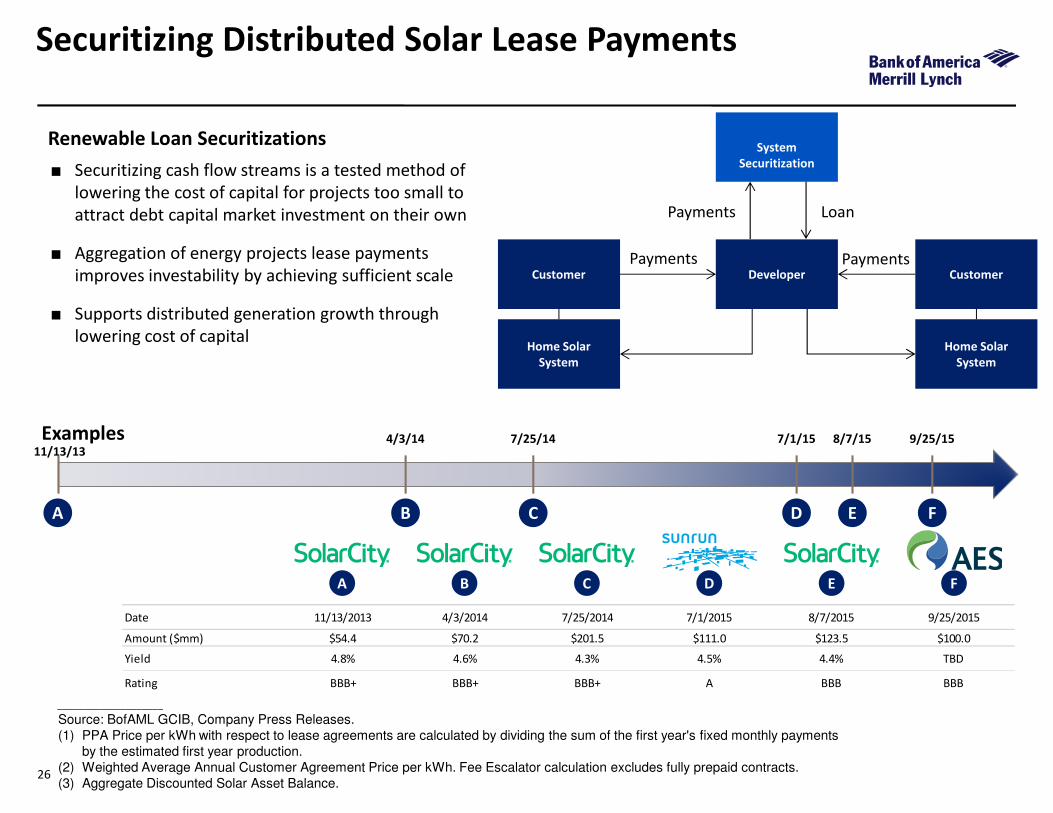
Securitizing Distributed Solar Lease Payments
■ Securitizing cash flow streams is a tested method of
lowering the cost of capital for projects too small to
attract debt capital market investment on their own
■ Aggregation of energy projects lease payments
improves investability by achieving sufficient scale
■ Supports distributed generation growth through
lowering cost of capital
Renewable Loan SecuritizationsSystem
Securitization
Home Solar
System
Home Solar
System
CustomerCustomer
LoanPayments
Payments PaymentsDeveloper
Date 11/13/2013 4/3/2014 7/25/2014 7/1/2015 8/7/2015 9/25/2015
Amount ($mm) $54.4 $70.2 $201.5 $111.0 $123.5 $100.0
Yield 4.8% 4.6% 4.3% 4.5% 4.4% TBD
Rating BBB+ BBB+ BBB+ A BBB BBB
A
11/13/13
B
4/3/14
C
7/25/14
E
8/7/15
D
7/1/15
F
9/25/15
A FB C D E
____________________
Source: BofAML GCIB, Company Press Releases.(1) PPA Price per kWh with respect to lease agreements are calculated by dividing the sum of the first year's fixed monthly payments
by the estimated first year production.(2) Weighted Average Annual Customer Agreement Price per kWh. Fee Escalator calculation excludes fully prepaid contracts.(3) Aggregate Discounted Solar Asset Balance.
26
Examples
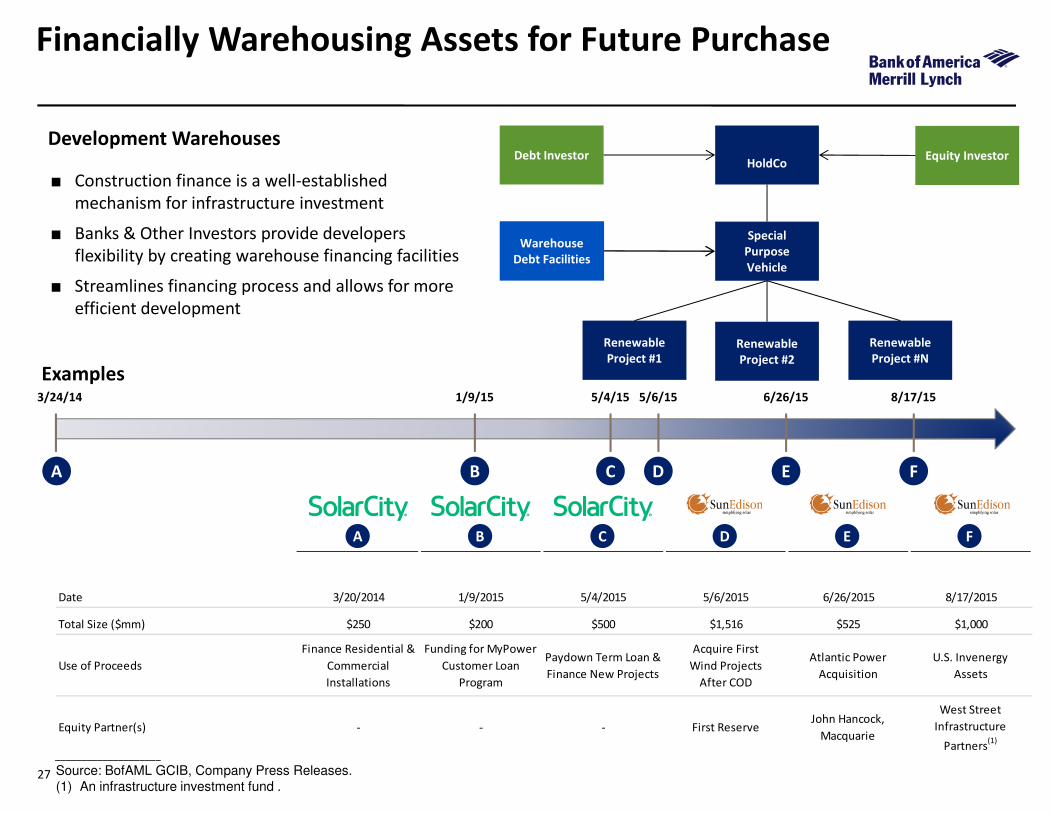
Financially Warehousing Assets for Future Purchase
■ Construction finance is a well-established
mechanism for infrastructure investment
■ Banks & Other Investors provide developers
flexibility by creating warehouse financing facilities
■ Streamlines financing process and allows for more
efficient development
Warehouse
Debt Facilities
Renewable
Project #2
Special
Purpose
Vehicle
Equity InvestorDebt InvestorHoldCo
Renewable
Project #N
Renewable
Project #1
Development Warehouses
Examples3/24/14 1/9/15 5/4/15 6/26/155/6/15 8/17/15
27
Date 3/20/2014 1/9/2015 5/4/2015 5/6/2015 6/26/2015 8/17/2015
Total Size ($mm) $250 $200 $500 $1,516 $525 $1,000
Use of Proceeds
Finance Residential &
Commercial
Installations
Funding for MyPower
Customer Loan
Program
Paydown Term Loan &
Finance New Projects
Acquire First
Wind Projects
After COD
Atlantic Power
Acquisition
U.S. Invenergy
Assets
Equity Partner(s) - - - First ReserveJohn Hancock,
Macquarie
West Street
Infrastructure
Partners(1)
17
A FB C D E
____________________
Source: BofAML GCIB, Company Press Releases.(1) An infrastructure investment fund .
A B C ED F

“Bank of America Merrill Lynch” is the marketing name for the global banking and global markets businesses of Bank of America Corporation. Lending, derivatives, and other commercial banking activities are performed globally by banking affiliates of Bank of America Corporation, including Bank of America, N.A., member FDIC. Securities, strategic advisory, and other investment banking activities are performed globally by investment banking affiliates of Bank of America Corporation (“Investment Banking Affiliates”), including, in the United States, Merrill Lynch, Pierce, Fenner & Smith Incorporated and Merrill Lynch Professional Clearing Corp., which are both registered broker dealers and members of FINRA and SIPC, and, in other jurisdictions, by locally registered entities.
Investment products offered by Investment Banking Affiliates: Are Not FDIC Insured * May Lose Value * Are Not Bank Guaranteed.
These materials have been prepared by one or more subsidiaries of Bank of America Corporation for the client or potential client to whom such materials are directly addressed and delivered (the “Company”) in connection with an actual or potential mandate or engagement and may not be used or relied upon for any purpose other than as specifically contemplated by a written agreement with us. These materials are based on information provided by or on behalf of the Company and/or other potential transaction participants, from public sources or otherwise reviewed by us. We assume no responsibility for independent investigation or verification of such information (including, without limitation, data from third party suppliers) and have relied on such information being complete and accurate in all material respects. To the extent such information includes estimates and forecasts of future financial performance prepared by or reviewed with the managements of the Company and/or other potential transaction participants or obtained from public sources, we have assumed that such estimates and forecasts have been reasonably prepared on bases reflecting the best currently available estimates and judgments of such managements (or, with respect to estimates and forecasts obtained from public sources, represent reasonable estimates). No representation or warranty, express or implied, is made as to the accuracy or completeness of such information and nothing contained herein is, or shall be relied upon as, a representation, whether as to the past, the present or the future. These materials were designed for use by specific persons familiar with the business and affairs of the Company and are being furnished and should be considered only in connection with other information, oral or written, being provided by us in connection herewith. These materials are not intended to provide the sole basis for evaluating, and should not be considered a recommendation with respect to, any transaction or other matter. These materials do not constitute an offer or solicitation to sell or purchase any securities and are not a commitment by Bank of America Corporation or any of its affiliates to provide or arrange any financing for any transaction or to purchase any security in connection therewith. These materials are for discussion purposes only and are subject to our review and assessment from a legal, compliance, accounting policy and risk perspective, as appropriate, following our discussion with the Company.
ConfidentialNotice to Recipient
materials are for discussion purposes only and are subject to our review and assessment from a legal, compliance, accounting policy and risk perspective, as appropriate, following our discussion with the Company. We assume no obligation to update or otherwise revise these materials. These materials have not been prepared with a view toward public disclosure under applicable securities laws or otherwise, are intended for the benefit and use of the Company, and may not be reproduced, disseminated, quoted or referred to, in whole or in part, without our prior written consent. These materials may not reflect information known to other professionals in other business areas of Bank of America Corporation and its affiliates.
Bank of America Corporation and its affiliates (collectively, the “BAC Group”) comprise a full service securities firm and commercial bank engaged in securities, commodities and derivatives trading, foreign exchange and other brokerage activities, and principal investing as well as providing investment, corporate and private banking, asset and investment management, financing and strategic advisory services and other commercial services and products to a wide range of corporations, governments and individuals, domestically and offshore, from which conflicting interests or duties, or a perception thereof, may arise. In the ordinary course of these activities, parts of the BAC Group at any time may invest on a principal basis or manage funds that invest, make or hold long or short positions, finance positions or trade or otherwise effect transactions, for their own accounts or the accounts of customers, in debt, equity or other securities or financial instruments (including derivatives, bank loans or other obligations) of the Company, potential counterparties or any other company that may be involved in a transaction. Products and services that may be referenced in the accompanying materials may be provided through one or more affiliates of Bank of America Corporation. We have adopted policies and guidelines designed to preserve the independence of our research analysts. The BAC Group prohibits employees from, directly or indirectly, offering a favorable research rating or specific price target, or offering to change a rating or price target to a subject company as consideration or inducement for the receipt of business or for compensation and the BAC Group prohibits research analysts from being directly compensated for involvement in investment banking transactions. The views expressed herein are the views solely of Global Corporate and Investment Banking, and no inference should be made that the views expressed represent the view of the firm’s research department. We are required to obtain, verify and record certain information that identifies the Company, which information includes the name and address of the Company and other information that will allow us to identify the Company in accordance, as applicable, with the USA Patriot Act (Title III of Pub. L. 107-56 (signed into law October 26, 2001)) and such other laws, rules and regulations as applicable within and outside the United States.
We do not provide legal, compliance, tax or accounting advice. Accordingly, any statements contained herein as to tax matters were neither written nor intended by us to be used and cannot be used by any taxpayer for the purpose of avoiding tax penalties that may be imposed on such taxpayer. If any person uses or refers to any such tax statement in promoting, marketing or recommending a partnership or other entity, investment plan or arrangement to any taxpayer, then the statement expressed herein is being delivered to support the promotion or marketing of the transaction or matter addressed and the recipient should seek advice based on its particular circumstances from an independent tax advisor. Notwithstanding anything that may appear herein or in other materials to the contrary, the Company shall be permitted to disclose the tax treatment and tax structure of a transaction (including any materials, opinions or analyses relating to such tax treatment or tax structure, but without disclosure of identifying information or, except to the extent relating to such tax structure or tax treatment, any nonpublic commercial or financial information) on and after the earliest to occur of the date of (i) public announcement of discussions relating to such transaction, (ii) public announcement of such transaction or (iii) execution of a definitive agreement (with or without conditions) to enter into such transaction; provided, however, that if such transaction is not consummated for any reason, the provisions of this sentence shall cease to apply. Copyright 2015 Bank of America Corporation.


