PROJECT DESIGN DOCUMENT FORM (CDM PDD) - Version 03.1. CDM – Executive Board page 1 CLEAN DEVELOPMENT MECHANISM PROJECT DESIGN DOCUMENT FORM (CDM-PDD) Version 03 - in effect as of: 28 July 2006 CONTENTS A. General description of project activity B. Application of a baseline and monitoring methodology C. Duration of the project activity / crediting period D. Environmental impacts E. Stakeholders’ comments Annexes Annex 1: Contact information on participants in the project activity Annex 2: Information regarding public funding Annex 3: Baseline information Annex 4: Monitoring plan
Transcript
PROJECT DESIGN DOCUMENT FORM (CDM PDD) - Version 03.1. CDM – Executive Board page 1
CLEAN DEVELOPMENT MECHANISM PROJECT DESIGN DOCUMENT FORM (CDM-PDD)
Version 03 - in effect as of: 28 July 2006
CONTENTS A. General description of project activity B. Application of a baseline and monitoring methodology C. Duration of the project activity / crediting period D. Environmental impacts E. Stakeholders’ comments
Annexes Annex 1: Contact information on participants in the project activity Annex 2: Information regarding public funding Annex 3: Baseline information
Annex 4: Monitoring plan
PROJECT DESIGN DOCUMENT FORM (CDM PDD) - Version 03.1. CDM – Executive Board page 2 SECTION A. General description of project activity A.1 Title of the project activity: PT ASTA Keramasan Energi - 145 MW new build CCGT Version: 1 01 May 2008 A.2. Description of the project activity: This PDD represents a 145 MW gas power plant, comprising two gas turbine units of 50 MW each and a steam turbine of 45 MW, at Keramasan, Palembang, South Sumatra. The project uses natural gas, a relatively clean energy source and a resource which was recently identified in Palembang. The project is expected to lower carbon dioxide (greenhouse gas - GHG) emissions by supplying energy to the grid which otherwise would have been supplied through coal- or oil-based power generation. Gas fired generation is a significant deviation from the norm in the region. New power plants being built are overwhelmingly coal fired, reflecting the Government’s policies which aim to increase significantly the development of low cost coal fired power production. This large-scale CDM project is expected to contribute to the sustainable development of Indonesia by improving the availability and reliability of electricity from the utilisation of natural gas. The project will result in reduced CO2 emissions and local air pollutants, by displacing coal and oil based power generation. While the electricity generated through this project is connected to the South Sumatra grid, the power is expected to be predominantly consumed in the local area and thus reduce transmission losses. The project increases the installed electricity generation capacity in South Sumatra and helps in bridging the gap between demand and supply of electrical energy in the island. Economic and social benefits will include opportunity for expansion of small- and medium-sized enterprises, and reduced dependency on oil and coal – with benefits from savings in foreign exchange; higher living standards through better infrastructure for schools, clinics, and small businesses. It is also expected to improve local services for lighting and communication, while creating local employment, enhancing technical skills and improving air quality. The Natural Gas consumption in the power plant is 223,840,264 Nm3/yr (≈ 7,413.49 TJ/yr) and has an easy access to the gas transmission point from PT Medco E&P Indonesia which is within Perusahaan Listrik Negara’s (PT PLN) facilities. PT PLN is the state electricity company, owned by the Indonesian government and responsible for power provision and grid distribution throughout Indonesia. The electricity output from the project will be transmitted to 150 kV switchyard located in the existing PT PLN facilities, which will subsequently be linked to the 150 kV interconnection systems in South Sumatra. The transmission lines between the power plant and the existing PT PLN substation are approximately 20 metres apart. The power plant is to be built in two phases and once completed as a Combined Cycle Gas Turbine (CCGT) the 145 MW natural gas based power project will have an estimated output of 889,140 MWh/yr. Applying the approved methodology specified for large scale CDM, 145 MW natural gas based power project will result in an annual emissions avoidance of 0.1668 tonnes of CO2e/MWh (tCO2e/MWh) in
PROJECT DESIGN DOCUMENT FORM (CDM PDD) - Version 03.1. CDM – Executive Board page 3 single cycle (SC) mode in 2009 and 0.4309 tCO2e/MWh in combined cycle (CC) mode from 2010 until the end of the crediting period. This figure is based on the most conservative option, Option 01 of AM0029, the build margin, calculated according to – “Tool to calculate emission factor for an electricity system” in tCO2e/MWh of the current generation mix for the years 2005, 2006 and 2007, which is the most recent data that is available. Other project benefits include reduction in NOx and SO2 pollution, and generation of short- and long-term local employment. A.3. Project participants: PT Asta Keramasan Energi (PT AKE) is a private entity which was incorporated in November 2004 as PT Satria Agung Perkasa, and changed its name in January 2006. PT AKE will build the “PT ASTA Keramasan Energi – 145 MW new build CCGT” project, generate and sell the electricity based on the Power Purchase Agreement with PT PLN that will cover an initial period of 5 years. PT AKE will retain full rights to any and all emissions reductions that will result from the implementation of this project. PT AKE is seeking registration of the project under the Clean Development Mechanism (CDM) to help the project raise bank loan financing and mitigate the risks associated with being an Independent Power Producer (IPP) developing natural gas based generation power projects in Indonesia. The Republic of Indonesia is the host country for this project. It ratified the Kyoto Protocol on 03 December 2004 and established its Designated National Authority for CDM, the National Commission for Clean Development Mechanism (NCCDM), under the Ministry of Environment in July 2005. NCCDM is registered with the CDM Executive Board. See Annex 1 for contact information of all participants.
Name of involved (*) party ((host) indicates the
host party)
Private and/or public entity(ies) project participants (*)
(as applicable)
Kindly indicate if the Party involved wishes to be considered as
project participant (Yes/No)
Republic of Indonesia (host)
Private entity: PT Asta Keramasan Energi (PT AKE) No
United Kingdom Private Entity: Climate Change Capital Carbon Fund 2 SARL No
United Kingdom Private Entity: Climate Change Capital Carbon Managed Account SARL
No
(*) In accordance with the CDM modalities and procedures, at the time of making the CDM-PDD public at the stage of validation, a Party involved may or may not have provided its approval. At the time of requesting registration, the approval by the Party(ies) involved is required. A.4. Technical description of the project activity: A.4.1. Location of the project activity: A.4.1.1. Host Party(ies):
PROJECT DESIGN DOCUMENT FORM (CDM PDD) - Version 03.1. CDM – Executive Board page 4 Republic of Indonesia A.4.1.2. Region/State/Province etc.: South Sumatra Province, Sumatra Island A.4.1.3. City/Town/Community etc: Keramasan, Palembang, South Sumatra A.4.1.4. Detail of physical location, including information allowing the unique identification of this project activity (maximum one page): The project site is leased from PT PLN and is a 9,000 m2 property located at the PT PLN facilities in Keramasan, South Sumatra. The advantages are a) easy access by road and river b) easy access to gas transmission point from PT Medco E&P Indonesia which is within PT PLN facilities c) easy access to the power transmission grid which is in PLN facilities and d) sufficient land space and provides ideal conditions for constructing and operation of a power facility. Figure A1 & A2 indicates the details. The project has the following GPS coordinates: Latitude : 3°01’48.96”S Longitude : 104°44’39.01”E
Figure A1: Map of Indonesia, showing where the project is located
PROJECT DESIGN DOCUMENT FORM (CDM PDD) - Version 03.1. CDM – Executive Board page 5
Figure A2: Inset of red square area from Figure 1, yellow circle shows the exact site location of
the project The address of the plant is Jl Abikusno Cokrosuroso No. 24, Palembang 30259, South Sumatra which is about 10 km South of the city center. The nearest water way is Keramasan river where the nearest point to the project site is about 500 m. Keramasan river is a branch of Musi river which meets at Kertapati point about 2 km from the nearest point to the project site. Kertapati point has a jetty that is equipped with a coal loading & unloading system. It receives coal from rail wagons to be transferred to barges. Railroads along the public road connecting Kertapati and coal mines pass about 200 meter from the project site. A.4.2. Category(ies) of project activity: The project activity is a large scale CDM project that fits under the Category 1, i.e. Energy industries (renewable-/ non renewable sources) as per ‘List of Sectoral Scopes’. The project conforms to the project category since the nominal installed capacity is above the 15 MW threshold and the generated electricity will be sold to the interconnected power grid of South Sumatra and Lampung. A.4.3. Technology to be employed by the project activity: Atmospheric air is drawn in and compressed to high pressure in a compressor. The compressed air will then be channelled into the combustion chamber to be burnt together with natural gas fuel. The burning of gas with compressed air in the combustion chamber results in high-pressure, high-velocity gas.
PROJECT DESIGN DOCUMENT FORM (CDM PDD) - Version 03.1. CDM – Executive Board page 6 The energy from the high-pressure and high-velocity gas will be extracted and optimally utilised by the turbine to rotate the generator to produce electricity. Electricity generated from the generator will be channelled to the PT PLN grid network via the transformer that will adjust voltage based on system requirement. For open cycle PLTG, the used gas will be emitted out from the plant into the atmosphere via the exhaust stack. The used gas maintains the quality of highly energised hot gas. To further utilize these hot gases, Single Cycle PLTG requires a Combined Cycle (PLTGU) system that will achieve 60% thermal efficiency rate of the prior system. This will enable the generation of an additional output of 45 MW through steam turbine generating unit without additional fuel supply, refer Figure A3 for details. The plant will initially operate in Single Cycle until completion of the combined cycle operating unit by 2010. The plant will be built in two phases to spread the financial outlay and risk to the project developers, who must secure additional debt and equity funding to complete the full construction of the plant and because the plant has agreement to sell only a limited proportion of its potential power output.
Figure A3: Schematic of a Combined Cycle Plant (PLTGU) In the first stage of the project (single-cycle RLTG), the power plant is driven by two GEC EM610B 50Hz gas turbine generators with the following features:
• 13 stage compressor and 2 stage power turbine, single shaft supported by 2 bearings • 3.3 KV motor starter • 2-pole, 3 phase 50Hz 11.8 KV 72.5 MVA air cooled generator • Brushless exciter control system • 11.8/132 KV 80 MVA OFAF generator transformer with on load tap changer • 11,800/433 V 250KVA ONAN unit transformer • 110V AC inverter with battery / charger system • High scanning speed temperature monitoring system with IBM PC Data acquisition program • Full package of auxiliaries including a workshop • With a 2.6 MVA black start diesel generator as option
The Design capacity of the plant
• Base load 58.7MW and peak load 61.9MW under ambient air conditions of 30°C and 1013 mbar
PROJECT DESIGN DOCUMENT FORM (CDM PDD) - Version 03.1. CDM – Executive Board page 7
• Corresponding thermal efficiencies for base load and peak load at 25.4% and 27.0 % • Normal start/Emergency start to synchronise speed total time required at 6.0 min and 6.0 min • Normal start/Emergency start to peak load total time required at 15.0 min and 9.0 min
There are three major components in the power plant namely, the Gas Turbines, Transformers and Generators. The overall specifications are as follows: Gas Turbine
• Single shaft, 2 bearings supported on rigid steel stools • 13 compressor stage, 2 power turbine stage • 10 individual reverse flow combustion chambers • Mean gas temperature at first row guide vanes at 900°C base / 950°C peak • Mean gas temperature at turbine exhaust at 503°C base / 541°C peak Combustion chamber • Ten combustion chambers fabricated from nimonic 75 alloy • Permit quick removal for inspection • LPG ignition, simplex type burner nozzle • Individually metered and temperature monitored Lubrication and Jacking Oil System • Mineral oil BS489 grade 46 total quantity 200Kg • Shaft driven positive displacement oil pump via auxiliary gearbox • 1 AC motor centrifugal oil pump • 1 DC motor centrifugal oil pump for emergency standby • 2 AC motor jacking oil pumps • 1 air oil cooler and 1 duplex strainer Cooling Air and Gland Packing System • Bled from compressor casing, cooled by air blast cooler • Cool the turbine discs, diaphragms and stator rings • Pack the turbine end bearing glands Intake system • Turbine intake filter package in a filter house
Coalescer safety pad Duracel high efficiency filter Differential pressure switch Inlet silencer Stainless steel trash screen before turbine inlet
• Generator filter package in a pair of wing houses Dust louvre inertial separator Amerkleen pad
Generator • 2-pole, 3 phase 50Hz 11.8 KV 72.5 MVA air cooled generator • Class F insulation, delta connection
PROJECT DESIGN DOCUMENT FORM (CDM PDD) - Version 03.1. CDM – Executive Board page 8
• Temperature sensors at stator core, windings and air circuit for monitoring • Full scheme of electrical protection
Transformer Generator Transformer • Pauwels Trafo 11.8/132 KV 80 MVA generator transformer • DY connection, OFAF cooling with on load tap changer • Full scheme of electrical protection
The power plant will be fully operational in CCGT mode by 2010. A number of 45 MW steam turbine providers are currently being evaluated as technological solutions, and the final decision is being made in the second half of 2008. Completion of Combined Cycle operation The Power Plant will be completed for full operation through installing a steam turbine, to obtain 45MW additional capacity output without any fuel increment. This expansion is scheduled for early 2009 and it is very likely to be endorsed by PLN since in view of the facts that power shortage will still prevail. Operating as a combined cycle plant is a well-proven and efficient means of increasing plant output, with significant improvements in efficiency and associated specific fuel consumption. The increase in electrical power generated is achieved without additional input of fuel, but will increase production by approximately 45 MW. Discussion of the Anticipated Power Output in Combined Cycle The anticipated additional performance of the plant in combined cycle is in between 43 to 48 MW and is in accordance with AKE’s Information memorandum. The planned 45 MW steam turbine is conservative, as the exhaust gas temperature in EM610B gas turbine is relatively low compared to modern units. This will be determined after commissioning; information as to the actual and current exhaust gas conditions will not be available until the units are brought into service and the performance tests carried out. Independent consultants have informed AKE that the additional power of 45MW is realistic and is in the range of values in technical modelling. Impact on Operations of Completion as Combined Cycle The build of the plant in single cycle includes the installation of a diverter damper, complete with Gas Turbine bypass stack. The function of the diverter damper would be to direct the Gas Turbine exhaust gas through either the Heat Recovery Steam Generator (HRSG) or direct to atmosphere via the bypass stack. Installation of a diverter damper in single cycle will ensure that the turbine does not have to be taken out of service during the installation of the HRSG, Steam Turbine and Condenser. It requires a higher initial financial investment as the equipment can be installed prior to the installation of the HRSG.
A.4.4 Estimated amount of emission reductions over the chosen crediting period: As per AM0029, the annual emission reductions would be calculated based on the baseline emissions, project emissions and leakage.
PROJECT DESIGN DOCUMENT FORM (CDM PDD) - Version 03.1. CDM – Executive Board page 9
Table A1: Emission reductions through the project activity
Years Annual Estimation of Emission Reductions in tonne of CO2e
Total estimated emission reductions (tonnes of CO2e)
2,719,527
Total number of crediting years 10
Annual average over the crediting period of estimated reductions (tonnes of CO2e)
271,953
A.4.5. Public funding of the project activity: Financing for this project is a combination of project developer equity from PT Asta Keramasan Energi (PT AKE) and loan financing from a Bank, which is being finalized. No Annex I Party public funding or Official Development Assistance (ODA) is involved in the proposed project. SECTION B. Application of a baseline and monitoring methodology B.1. Title and reference of the approved baseline and monitoring methodology applied to the project activity:
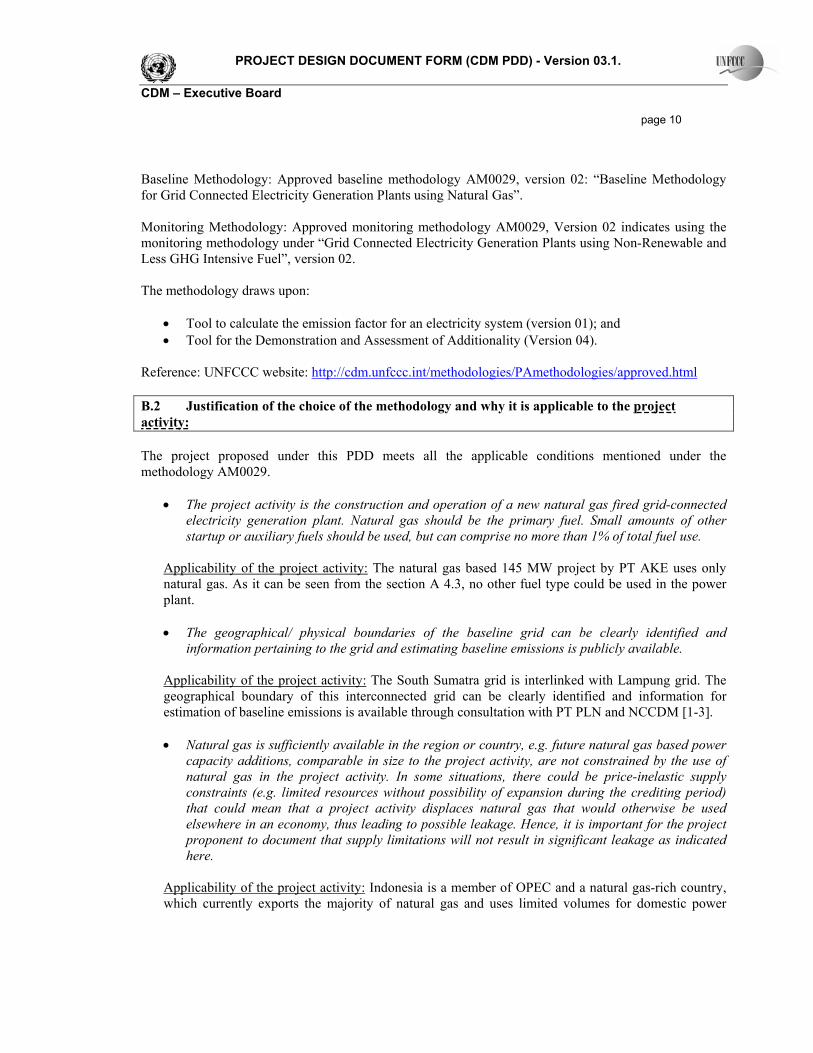
PROJECT DESIGN DOCUMENT FORM (CDM PDD) - Version 03.1. CDM – Executive Board page 10 Baseline Methodology: Approved baseline methodology AM0029, version 02: “Baseline Methodology for Grid Connected Electricity Generation Plants using Natural Gas”. Monitoring Methodology: Approved monitoring methodology AM0029, Version 02 indicates using the monitoring methodology under “Grid Connected Electricity Generation Plants using Non-Renewable and Less GHG Intensive Fuel”, version 02. The methodology draws upon:
• Tool to calculate the emission factor for an electricity system (version 01); and • Tool for the Demonstration and Assessment of Additionality (Version 04).
Reference: UNFCCC website: http://cdm.unfccc.int/methodologies/PAmethodologies/approved.html B.2 Justification of the choice of the methodology and why it is applicable to the project activity: The project proposed under this PDD meets all the applicable conditions mentioned under the methodology AM0029.
• The project activity is the construction and operation of a new natural gas fired grid-connected electricity generation plant. Natural gas should be the primary fuel. Small amounts of other startup or auxiliary fuels should be used, but can comprise no more than 1% of total fuel use.
Applicability of the project activity: The natural gas based 145 MW project by PT AKE uses only natural gas. As it can be seen from the section A 4.3, no other fuel type could be used in the power plant.
• The geographical/ physical boundaries of the baseline grid can be clearly identified and
information pertaining to the grid and estimating baseline emissions is publicly available. Applicability of the project activity: The South Sumatra grid is interlinked with Lampung grid. The geographical boundary of this interconnected grid can be clearly identified and information for estimation of baseline emissions is available through consultation with PT PLN and NCCDM [1-3]. • Natural gas is sufficiently available in the region or country, e.g. future natural gas based power
capacity additions, comparable in size to the project activity, are not constrained by the use of natural gas in the project activity. In some situations, there could be price-inelastic supply constraints (e.g. limited resources without possibility of expansion during the crediting period) that could mean that a project activity displaces natural gas that would otherwise be used elsewhere in an economy, thus leading to possible leakage. Hence, it is important for the project proponent to document that supply limitations will not result in significant leakage as indicated here.
Applicability of the project activity: Indonesia is a member of OPEC and a natural gas-rich country, which currently exports the majority of natural gas and uses limited volumes for domestic power
PROJECT DESIGN DOCUMENT FORM (CDM PDD) - Version 03.1. CDM – Executive Board page 11
production. Indonesia’s natural gas reserves in 2005 were 5261.27 billion cubic meter (bcm). About 2755.23 bcm is proven and 2506.04 bcm is probable reserves, with the proven reserve having been increased since then. This corresponds to almost 2.7 % of world proven natural gas reserves. More than 70 % of natural gas reserves are located offshore, far from demand centres with the largest reserves in East Kalimantan, Natuna Island, Papua, Aceh, and south Sumatra. The most promising new finds are Wiriagar, Berau, and Muturi fields located in Papua, with total proven reserves of about 0.41 tcm, and Donggi, Centre of Sulawesi. A distribution of proven reserves in Indonesia is shown in the figure B1 below:
Figure B1: Map of Indonesian proven natural gas reserves Sumatra accounts for around 15% of Indonesia’s proven reserves, with South Sumatra accounting for the majority of that. Despite the abundance of natural gas there is limited natural gas usage for power in South Sumatra and the project will be the largest installation in the region, at over 3 times the size of the next largest natural gas power plant there. The supply of the gas for the project will be provided by PT PLN as per a gas-supply agreement signed between PT PLN and PT Medco [4]. The gas is to be supplied from a previously unused source, which will go into production shortly, with the project having easy access to the gas transmission point from Medco E&P which is within PLN facilities. Indonesia’s gross natural gas production has been increasing rapidly since major production took off in the 1980s. According to the BP statistical review [5 and see figure B2 below] natural gas production in 2006 was around 75 bcm, having almost doubled from 1990 levels. A significant proportion of this is exported as LNG and LPG with Indonesia’s current LNG and LPG production at 23.7 million metric tonnes and 1.8 million metric tonnes per year, respectively. The major markets for Indonesian LNG are Japan, South Korea and Taiwan. An export through pipeline to Singapore and Malaysia accounted for about 4.8% of the total natural gas production. The development of BP’s Tangguh gas field in Papua is intended for markets in China. The total revenue for LNG export has
PROJECT DESIGN DOCUMENT FORM (CDM PDD) - Version 03.1. CDM – Executive Board page 12
increased to US$ 9.1 billion in 2005 compared with US$ 6.8 billion in 2000 due to higher price of LNG [6].
Figure B2: Indonesian natural gas production
Around 50% of the natural gas produced is processed into liquefied natural gas (LNG) for export whilst the rest is consumed domestically by industries and some for electricity production. It is anticipated that domestic utilisation will increase, but current pricing dictates that use for gas-based power production is not economically attractive in the absence of economic incentives and when compared to power plants using the country’s inexpensive and large coal supplies. Other domestic uses of natural gas include the fertilizer industry and ceramic industry, where demand is relatively stable. Indonesia’s current annual production is only between 2-3% of proven reserves and between 1-2% of proven and probable reserves. A report by Business Monitor International [7] forecasts that Indonesian natural gas production will increase to 100 bcm by 2011, with domestic usage increasing to over 50 bcm per year by that time. The project is sourcing its gas from a new source that is not currently used, but this forecast also indicates that there will be plentiful new supply from Indonesia’s large resources and the project only requires around 0.2bcm per year, which accounts for only 0.3% of current production, 0.2% of future production, or 0.8% of the forecast increase in production. In summary there is clearly sufficient gas available within the country in the future to comfortably satisfy the existing capacity of gas based power production and the project. The above information clearly substantiates that Indonesia has sufficient proven and probable resource to meet the local energy requirements. B.3. Description of the sources and gases included in the project boundary Indonesia is an archipelago nation which has 17,508 islands which stretch over more than 5000 km. Thus Indonesia can’t be represented with a single national grid, although some are inter-connected, such as the
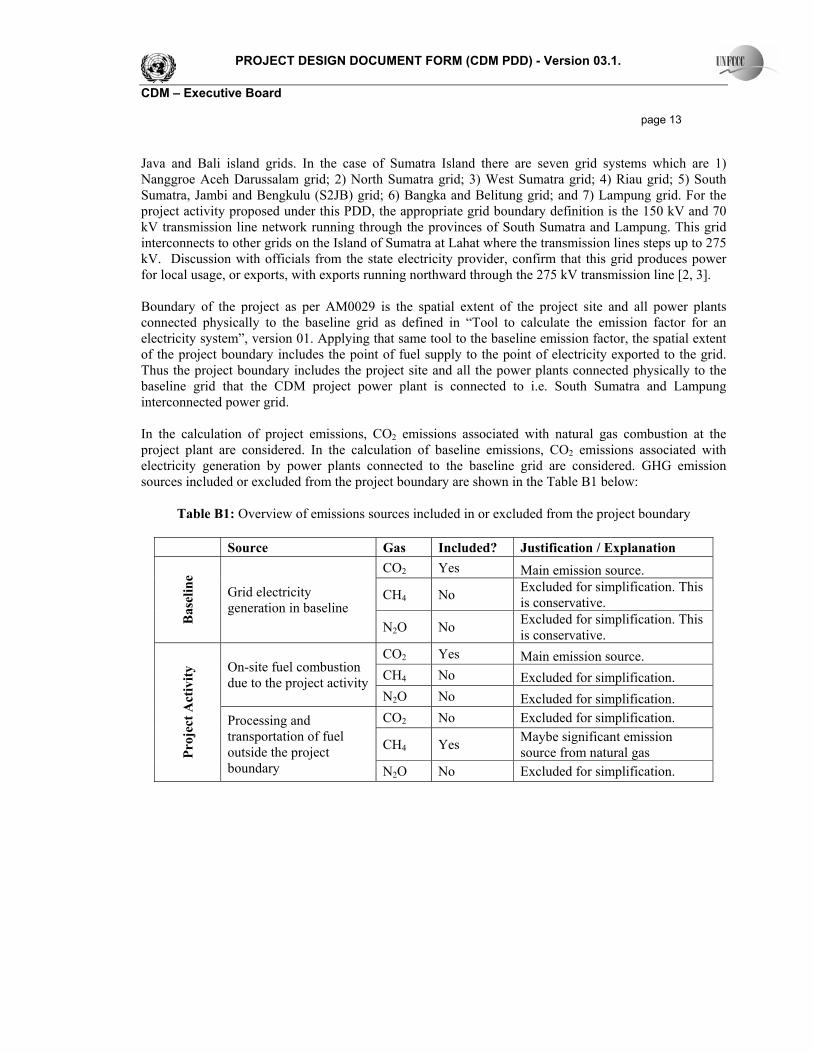
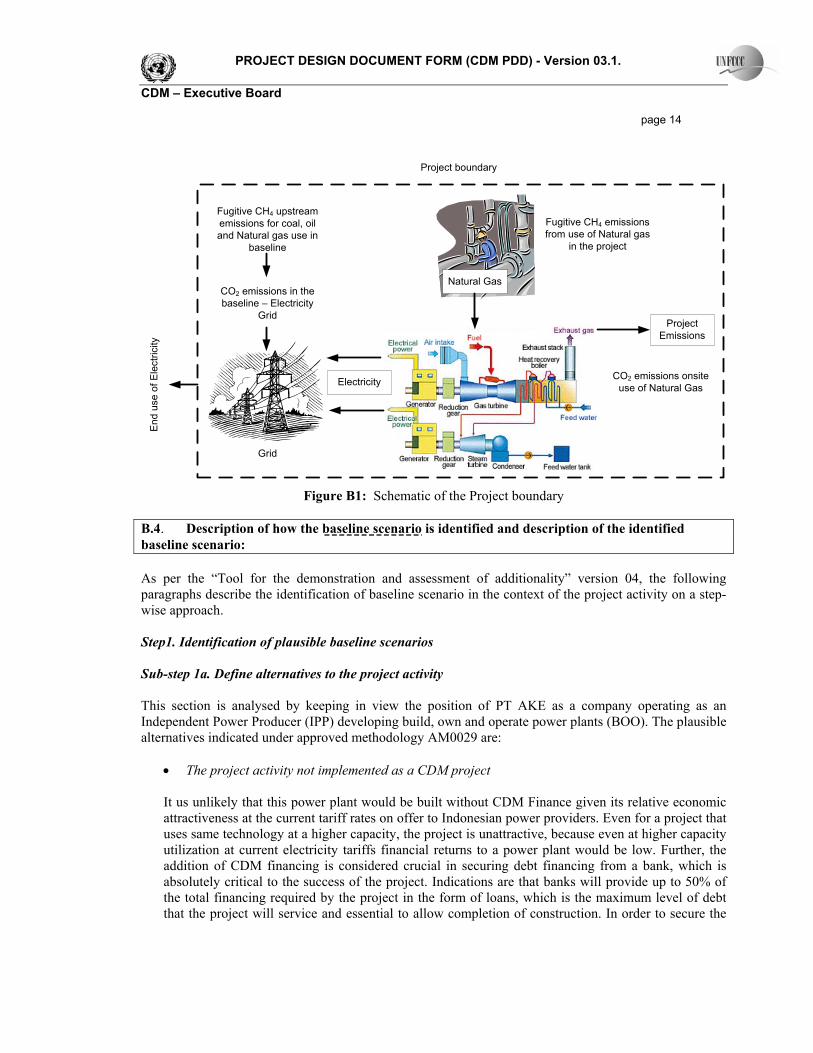
PROJECT DESIGN DOCUMENT FORM (CDM PDD) - Version 03.1. CDM – Executive Board page 13 Java and Bali island grids. In the case of Sumatra Island there are seven grid systems which are 1) Nanggroe Aceh Darussalam grid; 2) North Sumatra grid; 3) West Sumatra grid; 4) Riau grid; 5) South Sumatra, Jambi and Bengkulu (S2JB) grid; 6) Bangka and Belitung grid; and 7) Lampung grid. For the project activity proposed under this PDD, the appropriate grid boundary definition is the 150 kV and 70 kV transmission line network running through the provinces of South Sumatra and Lampung. This grid interconnects to other grids on the Island of Sumatra at Lahat where the transmission lines steps up to 275 kV. Discussion with officials from the state electricity provider, confirm that this grid produces power for local usage, or exports, with exports running northward through the 275 kV transmission line [2, 3]. Boundary of the project as per AM0029 is the spatial extent of the project site and all power plants connected physically to the baseline grid as defined in “Tool to calculate the emission factor for an electricity system”, version 01. Applying that same tool to the baseline emission factor, the spatial extent of the project boundary includes the point of fuel supply to the point of electricity exported to the grid. Thus the project boundary includes the project site and all the power plants connected physically to the baseline grid that the CDM project power plant is connected to i.e. South Sumatra and Lampung interconnected power grid. In the calculation of project emissions, CO2 emissions associated with natural gas combustion at the project plant are considered. In the calculation of baseline emissions, CO2 emissions associated with electricity generation by power plants connected to the baseline grid are considered. GHG emission sources included or excluded from the project boundary are shown in the Table B1 below:
Table B1: Overview of emissions sources included in or excluded from the project boundary
Source Gas Included? Justification / Explanation CO2 Yes Main emission source.
CH4 No Excluded for simplification. This is conservative.
Bas
elin
e
Grid electricity generation in baseline
N2O No Excluded for simplification. This is conservative.
CO2 Yes Main emission source. CH4 No Excluded for simplification.
On-site fuel combustion due to the project activity
N2O No Excluded for simplification. CO2 No Excluded for simplification.
CH4 Yes Maybe significant emission source from natural gas Pr
ojec
t Act
ivity
Processing and transportation of fuel outside the project boundary N2O No Excluded for simplification.
PROJECT DESIGN DOCUMENT FORM (CDM PDD) - Version 03.1. CDM – Executive Board page 14
Natural Gas
Electricity
Grid
Project Emissions
Project boundaryE
nd u
se o
f Ele
ctric
ity
CO2 emissions in the baseline – Electricity
Grid
CO2 emissions onsite use of Natural Gas
Fugitive CH4 upstream emissions for coal, oil and Natural gas use in
baseline
Fugitive CH4 emissions from use of Natural gas
in the project
Figure B1: Schematic of the Project boundary
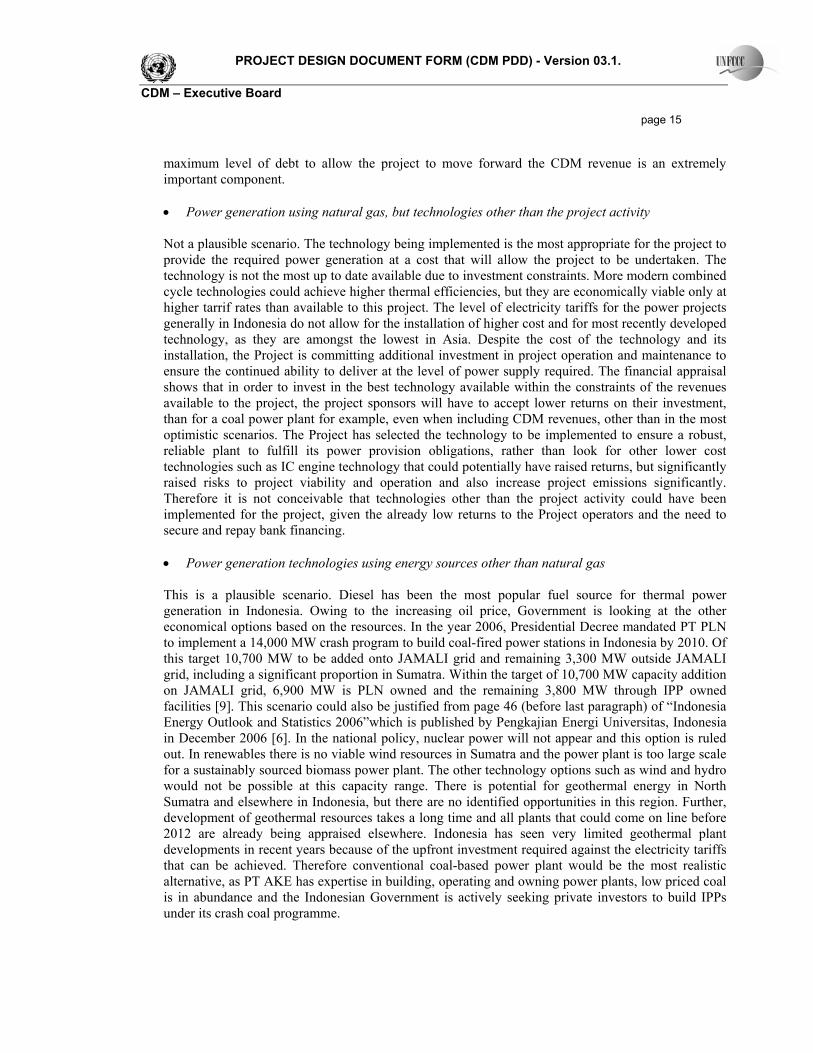
B.4. Description of how the baseline scenario is identified and description of the identified baseline scenario: As per the “Tool for the demonstration and assessment of additionality” version 04, the following paragraphs describe the identification of baseline scenario in the context of the project activity on a step-wise approach. Step1. Identification of plausible baseline scenarios Sub-step 1a. Define alternatives to the project activity This section is analysed by keeping in view the position of PT AKE as a company operating as an Independent Power Producer (IPP) developing build, own and operate power plants (BOO). The plausible alternatives indicated under approved methodology AM0029 are:
• The project activity not implemented as a CDM project
It us unlikely that this power plant would be built without CDM Finance given its relative economic attractiveness at the current tariff rates on offer to Indonesian power providers. Even for a project that uses same technology at a higher capacity, the project is unattractive, because even at higher capacity utilization at current electricity tariffs financial returns to a power plant would be low. Further, the addition of CDM financing is considered crucial in securing debt financing from a bank, which is absolutely critical to the success of the project. Indications are that banks will provide up to 50% of the total financing required by the project in the form of loans, which is the maximum level of debt that the project will service and essential to allow completion of construction. In order to secure the
PROJECT DESIGN DOCUMENT FORM (CDM PDD) - Version 03.1. CDM – Executive Board page 15
maximum level of debt to allow the project to move forward the CDM revenue is an extremely important component.
• Power generation using natural gas, but technologies other than the project activity
Not a plausible scenario. The technology being implemented is the most appropriate for the project to provide the required power generation at a cost that will allow the project to be undertaken. The technology is not the most up to date available due to investment constraints. More modern combined cycle technologies could achieve higher thermal efficiencies, but they are economically viable only at higher tarrif rates than available to this project. The level of electricity tariffs for the power projects generally in Indonesia do not allow for the installation of higher cost and for most recently developed technology, as they are amongst the lowest in Asia. Despite the cost of the technology and its installation, the Project is committing additional investment in project operation and maintenance to ensure the continued ability to deliver at the level of power supply required. The financial appraisal shows that in order to invest in the best technology available within the constraints of the revenues available to the project, the project sponsors will have to accept lower returns on their investment, than for a coal power plant for example, even when including CDM revenues, other than in the most optimistic scenarios. The Project has selected the technology to be implemented to ensure a robust, reliable plant to fulfill its power provision obligations, rather than look for other lower cost technologies such as IC engine technology that could potentially have raised returns, but significantly raised risks to project viability and operation and also increase project emissions significantly. Therefore it is not conceivable that technologies other than the project activity could have been implemented for the project, given the already low returns to the Project operators and the need to secure and repay bank financing.
• Power generation technologies using energy sources other than natural gas
This is a plausible scenario. Diesel has been the most popular fuel source for thermal power generation in Indonesia. Owing to the increasing oil price, Government is looking at the other economical options based on the resources. In the year 2006, Presidential Decree mandated PT PLN to implement a 14,000 MW crash program to build coal-fired power stations in Indonesia by 2010. Of this target 10,700 MW to be added onto JAMALI grid and remaining 3,300 MW outside JAMALI grid, including a significant proportion in Sumatra. Within the target of 10,700 MW capacity addition on JAMALI grid, 6,900 MW is PLN owned and the remaining 3,800 MW through IPP owned facilities [9]. This scenario could also be justified from page 46 (before last paragraph) of “Indonesia Energy Outlook and Statistics 2006”which is published by Pengkajian Energi Universitas, Indonesia in December 2006 [6]. In the national policy, nuclear power will not appear and this option is ruled out. In renewables there is no viable wind resources in Sumatra and the power plant is too large scale for a sustainably sourced biomass power plant. The other technology options such as wind and hydro would not be possible at this capacity range. There is potential for geothermal energy in North Sumatra and elsewhere in Indonesia, but there are no identified opportunities in this region. Further, development of geothermal resources takes a long time and all plants that could come on line before 2012 are already being appraised elsewhere. Indonesia has seen very limited geothermal plant developments in recent years because of the upfront investment required against the electricity tariffs that can be achieved. Therefore conventional coal-based power plant would be the most realistic alternative, as PT AKE has expertise in building, operating and owning power plants, low priced coal is in abundance and the Indonesian Government is actively seeking private investors to build IPPs under its crash coal programme.
PROJECT DESIGN DOCUMENT FORM (CDM PDD) - Version 03.1. CDM – Executive Board page 16
A joint study with Japan has identified an additional coal resources 67 million tonnes in South Sumatra. In Sumatra island - Meulaboh project of 130 MW capacity in Aceh, Sibolga Baru project of 200 MW capacity in North Sumatra, Sumbar Pesisir Selatan project of 200 MW capacity in West Sumatra, Amurang Baru project of 50 MW capacity in North Sulawesi, Tarahan Baru project of 200 MW capacity in Lampung [10] and Banjarsari 2x100 MW [11] plant in South Sumatra by Bukit Pembangkit are being developed under GOI Crash Program. A number of IPP projects, including a 2,400 MW coal-fired power plant in South Sumatra and 270-MW coal-fired power plant in Bali, are currently on offer [12]. Most of these plants would likely rely on Chinese coal-fired technology. • Import of electricity from connected grids, including the possibility of new interconnections Not a plausible scenario. The largest grid, the Java and Bali grid is not interconnected with Sumatra island and will not be soon, given Java and Bali’s own power shortages. Under this situation it may not be reliable to count on import of electricity through future connected grids. Sumatra, in kind with other Indonesian islands, faces power shortages. Therefore power plants being developed on other grids within Sumatra, or other islands, will be required for power in that local region. By 2006, seven power plants in Sumatra (Unit I gas power plant PLTG, Simpang Tiga, Palembang; Unit II thermal power plant, Ombilin, Sawahlunto; Unit II PLTG, Teluk Lembu, Pekanbaru; Unit II PLTG, Pauh Limo, Pandang; Unit I PLTG, Borang, Palembang; and Unit I and II hydro power plants PLTA, Musi, Palembang) are in a state of disrepair, leaving central and south Sumatra network facing a peak capacity deficit of 160 MW. PLN acknowledges that these power plants are due for maintenance and replacements. There is no certainty or conformation that all these generators would return to normal operation.
From the above discussions the most likely baseline scenarios identified for PT AKE is construction of a coal based power plant that would export the electricity to current grid mix and that project would not be implemented as CDM project activity. B.5. Description of how the anthropogenic emissions of GHG by sources are reduced below those that would have occurred in the absence of the registered CDM project activity (assessment and demonstration of additionality): The development of less GHG intensive fuel would contribute to sustainable development by reducing emissions which otherwise would have been generated from coal and oil, as well as creating the employment to the local community during its construction and operation. The rest of this section demonstrates that the project is considered additional to the emissions baseline based on an analysis of selected barriers listed in the “Tool for the demonstration and assessment of additionality” version 04. Specifically, these demonstrate that the projects face significant barriers related to (a) identification of alternatives to the project activity consistent with mandatory laws and regulations (b) investment analysis (c) barriers analysis and (d) Common practice analysis. Step1: Identification of alternatives to the project activity consistent with mandatory laws and regulations Sub-step 1a – Define alternatives to the project activity
PROJECT DESIGN DOCUMENT FORM (CDM PDD) - Version 03.1. CDM – Executive Board page 17 The alternatives to the project activity are a) The project activity not implemented as a CDM project b) Power generation using natural gas, but technologies other than the project activity c) Power generation technologies using energy sources other than natural gas and d) Import of electricity from connected grids, including the possibility of new interconnections. These options are discussed in detail under section B.4, Sub-step 1a. Outcome of sub-Step 1a: For PT AKE, identified realistic and credible alternative scenarios to the project activity are a) construction of a coal based power plant that would export the electricity to current grid mix (Scenario 1) or b) the project implemented without CDM (Scenario 2). Sub-step 1b – Consistency with mandatory laws and regulations Construction of a coal based power plant is in compliance with all mandatory applicable legal and regulatory requirements. The government has mandated a “crash programme” of development of coal-fired power plants by PLN, under a Presidential Decree [9]. Implementation of natural gas-fired power plant, with or without CDM, is fully compliant with existing laws. Outcome of sub-Step 1b: These two scenarios are identified as realistic and credible alternative scenarios. Step2: Investment analysis Sub-step 2a – Determine appropriate analysis method From the options suggested under “Tool for the demonstration and assessment of additionality”, Version 4, benchmark analysis is used i.e. Option III to demonstrate the Project additionality. Simple cost analysis is not appropriate as there are revenues to the project. Investment comparison is not appropriate as this is the project company’s first IPP investment and will not consider other investments in the same technology (gas-fired power generation) until they see the level of success (or failure) of this project. Therefore, benchmark analysis is more appropriate in this case. The proposed project activity is determined for the selected financial indicator. Sub-step2b - Option III. Benchmark investment analysis The benchmark rate used for returns comparison is investment loan rate as published by the Bank of Indonesia for 2007, which stood at 14%. This is conservative in that project equity providers would expect to attach a risk premium to the bank financing rate in assessing projects. However, this is deemed appropriate in this situation in order to be conservative and as the major shareholder in PT AKE also has a cost of equity of 14% [14]. The project has a contract to sell power for 5 years only, at 62.5% of operational capacity. Assuming that the contract can be extended for a life of 20 years, in the base case without CDM finance, the equity IRR of the project is 10.16% without considering the additional revenue from the registration of the project as CDM project. Upon considering the additional revenue from registration of the project as CDM project,
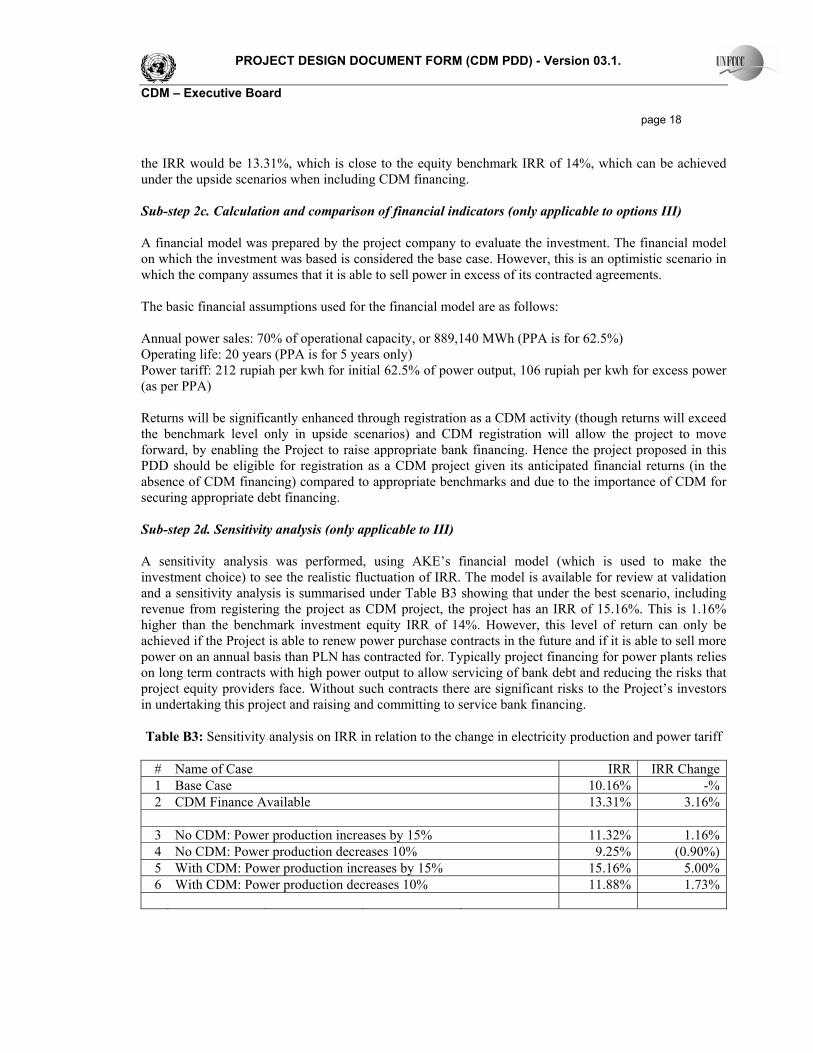
PROJECT DESIGN DOCUMENT FORM (CDM PDD) - Version 03.1. CDM – Executive Board page 18 the IRR would be 13.31%, which is close to the equity benchmark IRR of 14%, which can be achieved under the upside scenarios when including CDM financing. Sub-step 2c. Calculation and comparison of financial indicators (only applicable to options III) A financial model was prepared by the project company to evaluate the investment. The financial model on which the investment was based is considered the base case. However, this is an optimistic scenario in which the company assumes that it is able to sell power in excess of its contracted agreements. The basic financial assumptions used for the financial model are as follows: Annual power sales: 70% of operational capacity, or 889,140 MWh (PPA is for 62.5%) Operating life: 20 years (PPA is for 5 years only) Power tariff: 212 rupiah per kwh for initial 62.5% of power output, 106 rupiah per kwh for excess power (as per PPA) Returns will be significantly enhanced through registration as a CDM activity (though returns will exceed the benchmark level only in upside scenarios) and CDM registration will allow the project to move forward, by enabling the Project to raise appropriate bank financing. Hence the project proposed in this PDD should be eligible for registration as a CDM project given its anticipated financial returns (in the absence of CDM financing) compared to appropriate benchmarks and due to the importance of CDM for securing appropriate debt financing. Sub-step 2d. Sensitivity analysis (only applicable to III) A sensitivity analysis was performed, using AKE’s financial model (which is used to make the investment choice) to see the realistic fluctuation of IRR. The model is available for review at validation and a sensitivity analysis is summarised under Table B3 showing that under the best scenario, including revenue from registering the project as CDM project, the project has an IRR of 15.16%. This is 1.16% higher than the benchmark investment equity IRR of 14%. However, this level of return can only be achieved if the Project is able to renew power purchase contracts in the future and if it is able to sell more power on an annual basis than PLN has contracted for. Typically project financing for power plants relies on long term contracts with high power output to allow servicing of bank debt and reducing the risks that project equity providers face. Without such contracts there are significant risks to the Project’s investors in undertaking this project and raising and committing to service bank financing. Table B3: Sensitivity analysis on IRR in relation to the change in electricity production and power tariff
# Name of Case IRR IRR Change1 Base Case 10.16% -%2 CDM Finance Available 13.31% 3.16%
3 No CDM: Power production increases by 15% 11.32% 1.16%4 No CDM: Power production decreases 10% 9.25% (0.90%)5 With CDM: Power production increases by 15% 15.16% 5.00%6 With CDM: Power production decreases 10% 11.88% 1.73%
PROJECT DESIGN DOCUMENT FORM (CDM PDD) - Version 03.1. CDM – Executive Board page 19
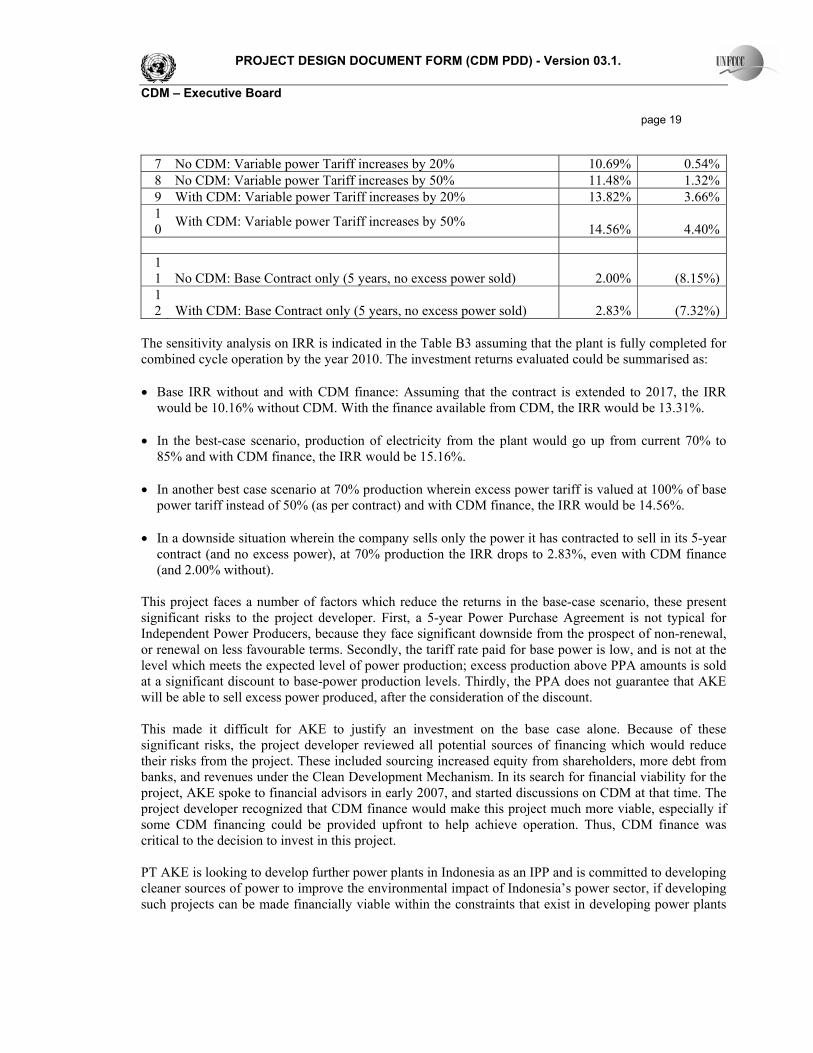
7 No CDM: Variable power Tariff increases by 20% 10.69% 0.54%8 No CDM: Variable power Tariff increases by 50% 11.48% 1.32%9 With CDM: Variable power Tariff increases by 20% 13.82% 3.66%10 With CDM: Variable power Tariff increases by 50% 14.56% 4.40%
11 No CDM: Base Contract only (5 years, no excess power sold) 2.00% (8.15%)12 With CDM: Base Contract only (5 years, no excess power sold) 2.83% (7.32%)
The sensitivity analysis on IRR is indicated in the Table B3 assuming that the plant is fully completed for combined cycle operation by the year 2010. The investment returns evaluated could be summarised as: • Base IRR without and with CDM finance: Assuming that the contract is extended to 2017, the IRR
would be 10.16% without CDM. With the finance available from CDM, the IRR would be 13.31%. • In the best-case scenario, production of electricity from the plant would go up from current 70% to
85% and with CDM finance, the IRR would be 15.16%. • In another best case scenario at 70% production wherein excess power tariff is valued at 100% of base
power tariff instead of 50% (as per contract) and with CDM finance, the IRR would be 14.56%. • In a downside situation wherein the company sells only the power it has contracted to sell in its 5-year
contract (and no excess power), at 70% production the IRR drops to 2.83%, even with CDM finance (and 2.00% without).
This project faces a number of factors which reduce the returns in the base-case scenario, these present significant risks to the project developer. First, a 5-year Power Purchase Agreement is not typical for Independent Power Producers, because they face significant downside from the prospect of non-renewal, or renewal on less favourable terms. Secondly, the tariff rate paid for base power is low, and is not at the level which meets the expected level of power production; excess production above PPA amounts is sold at a significant discount to base-power production levels. Thirdly, the PPA does not guarantee that AKE will be able to sell excess power produced, after the consideration of the discount. This made it difficult for AKE to justify an investment on the base case alone. Because of these significant risks, the project developer reviewed all potential sources of financing which would reduce their risks from the project. These included sourcing increased equity from shareholders, more debt from banks, and revenues under the Clean Development Mechanism. In its search for financial viability for the project, AKE spoke to financial advisors in early 2007, and started discussions on CDM at that time. The project developer recognized that CDM finance would make this project much more viable, especially if some CDM financing could be provided upfront to help achieve operation. Thus, CDM finance was critical to the decision to invest in this project. PT AKE is looking to develop further power plants in Indonesia as an IPP and is committed to developing cleaner sources of power to improve the environmental impact of Indonesia’s power sector, if developing such projects can be made financially viable within the constraints that exist in developing power plants
PROJECT DESIGN DOCUMENT FORM (CDM PDD) - Version 03.1. CDM – Executive Board page 20 in the country. This first project will determine whether AKE can economically build more gas fired power stations in the country, or should focus on other investments such as coal-based power generation. The sensitivity analysis detailed under Table B3 consistently supports that the project activity is unlikely to be the most financially attractive. Outcome of Step 2: Therefore, it is concluded that the proposed CDM project activity has a less favorable indicator (i.e. lower IRR) than the benchmark and the CDM project activity cannot be considered as financially attractive without CDM financing. Step3: Barriers analysis Sub-step 3a. Identify barriers that would prevent the implementation of the proposed CDM project activity: The realistic and credible barriers that would prevent the implementation of the proposed project activity from being carried out if the project activity was not registered as a CDM activity are as follows:
1. Investment barriers The investment analysis from section B.4, Step 2 and Step 2 in the above section clearly confirms that the proposed CDM Project activity has a less favorable indicator i.e. lower IRR. Therefore in order to mitigate the risks associated with investment, the project is seeking its registration under CDM. Investors in the project face the following risks, many of which are not typical for IPPs in other countries:
• PPA lasts for 5 years only, with the project having to assume it will be able to achieve a contract on the same terms in the future
• PPA is for 62.5% of operating capacity only, with the project having to assume it will be able to generate higher levels of power
• Inability to raise standard project bank financing due to nature of the PPA. The project is trying to raise 50% bank financing, compared with 70-80% in typical project financed power stations
2. Barriers due to Prevailing practices
The average growth of electricity supply in Indonesia is about 7.5% per year, though demand exceeds this level. In 2005, Indonesia’s electrical generating capacity (only for PLN) is 22,515 MW with more than 30 million consumers. In Java alone, the installed capacity in year 2005 was 16,355 MW with peak load of 14,824 MW. The peak load for Indonesia is considered to be about 19,263 MW. This peak load figure is not a standard peak load since it was determined from the total of regional peak loads, because most grids are not interconnected. The electricity sold by PLN in Indonesia is 107,032 GWh, where Java consumes 83.3% of total electricity sold. In 2005, electrification ratio was still low at 54 percent for Indonesia, which was broken down further at 57 percent for Java and 48 percent outside Java [5]. This clearly shows that analysis for the grid under consideration i.e. South Sumatra and Lampung is quite realistic. In the year 2007, the total installed capacity of the units connected to South Sumatra and Lampung is 1,152.11 MW and electricity generated is 3,670.19 GWh. Two coal power plants have recently been completed on South Sumatra and data show that total installed capacity of South Sumatra and Lampung is 90%
PROJECT DESIGN DOCUMENT FORM (CDM PDD) - Version 03.1. CDM – Executive Board page 21 Thermal (coal and oil account for 68% of the total capacity), with the remaining 10% as hydro [8]. This clearly demonstrates that coal and oil are the major contributors to the electricity generation of the grid. PT PLN’s financial health is affected by the increase in global oil prices, since the majority of electricity generation is currently fuelled by oil (51%). This has created a drive to shift generation to the main low cost energy resource, coal. The new generation capacity additions in Indonesia will be constructed by PT PLN, its subsidiaries and Independent Power Producers (IPPs). The most recent power developments are coal-fired 1,320 MW tanjung Jati B plant, coal-fired 600 MW plant in Cilacap and coal-fired 740 MW plant in Cilegon [15, 16]. As indicated earlier, there is an expansion plan under crash program to build more coal-fired power stations. This above information demonstrates and affirms that the dominant share of electricity generation in the future would come from coal both for Indonesia as a whole and in the local grid considered. Thus the project activity is not a prevailing practice and is additional.
3. Other barriers
Electricity tariff for power producers There is a lack of new investments flowing in this sector due to the fact that the electricity tariff applied is not at an economic level to attract significant levels of investments into the sector [17-19]. In general, due to unreliability in electricity transmission and distribution, some potential customers provide their own generation plants. In 2005, Indonesia managed to reduce subsidies for oil products; however, since oil based power plants are still widely used to supply electricity demand during peak hours, the sharp increase in oil prices since 2005 has forced the government to provide large subsidies to the sector.
Electricity costs to the user and on-time payments The electricity costs in Indonesia are highly subsidised with the costs charged amongst the lowest in the region. The average electricity tariff stood at US¢ 6.1/kWh in 2005. Although the government has increased the tariffs since 1998 to keep pace with the rising costs, the tariff adjustment process has been rather slow. The average electricity charges were increased by 29% in April 2000, 17% in July/October 2001 and by 6% every quarter during 2002-2003. However, there has been no increase in electricity tariffs since 2003 [16]. As there is no revision of tariff in line with the rising cost of electricity generated, PLN faces significant uncertainties on tariff revisions. Due to this PT PLN may not have a strong balance sheet [17] for reimbursing the on-time payments for the electricity exported by the independent power producer (IPP). And thus may not provide the comfort required by the private players to enter into a long-term electricity purchase agreement. The delayed payments would be a barrier for especially to a project of this capacity. Step 4: Common practice analysis Sub-step 4a. Analyze other activities similar to the proposed project activity: Applying the conditions provided under the “Tool for the demonstration and assessment of additionality”, Version 4, it could be concluded that there is no similar project activity under the interconnected grid of South Sumatra and Lampung i.e. electricity produced through the technology of Combined Cycle Gas Turbine (PLTGU) using natural gas as fuel. However there are already power plants developed and
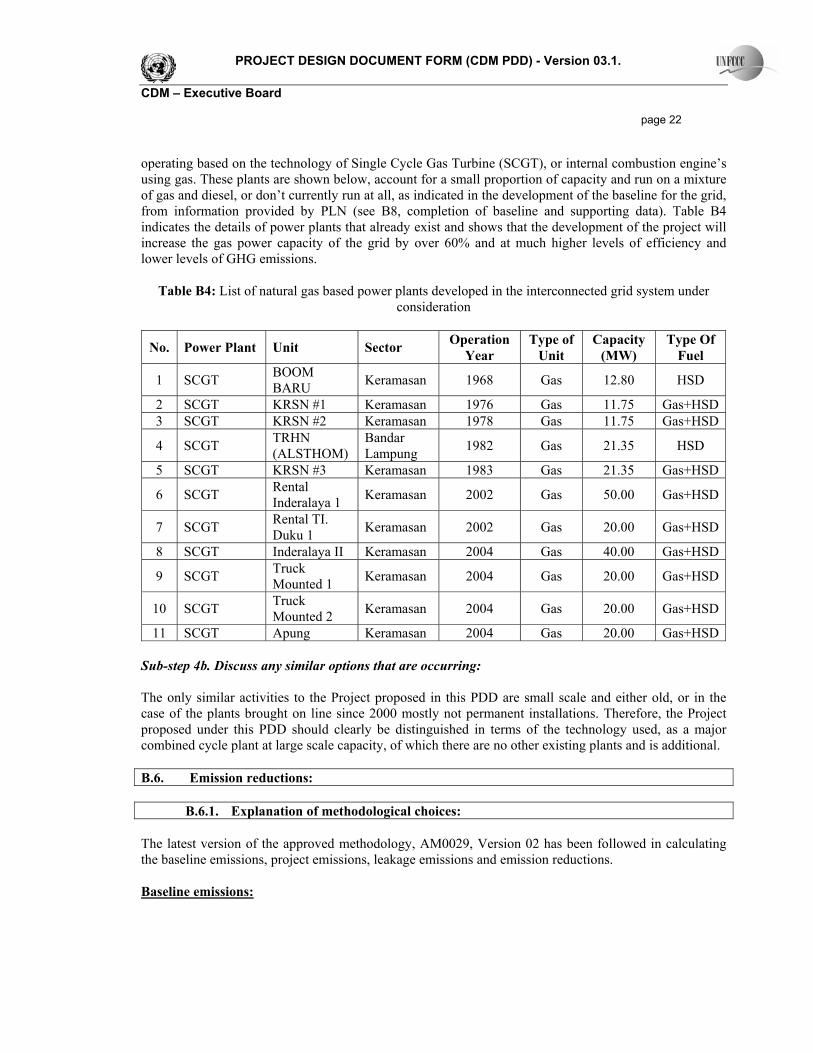
PROJECT DESIGN DOCUMENT FORM (CDM PDD) - Version 03.1. CDM – Executive Board page 22 operating based on the technology of Single Cycle Gas Turbine (SCGT), or internal combustion engine’s using gas. These plants are shown below, account for a small proportion of capacity and run on a mixture of gas and diesel, or don’t currently run at all, as indicated in the development of the baseline for the grid, from information provided by PLN (see B8, completion of baseline and supporting data). Table B4 indicates the details of power plants that already exist and shows that the development of the project will increase the gas power capacity of the grid by over 60% and at much higher levels of efficiency and lower levels of GHG emissions.
Table B4: List of natural gas based power plants developed in the interconnected grid system under consideration
No. Power Plant Unit Sector Operation Year
Type of Unit
Capacity (MW)
Type Of Fuel
1 SCGT BOOM BARU Keramasan 1968 Gas 12.80 HSD
2 SCGT KRSN #1 Keramasan 1976 Gas 11.75 Gas+HSD3 SCGT KRSN #2 Keramasan 1978 Gas 11.75 Gas+HSD
4 SCGT TRHN (ALSTHOM)
Bandar Lampung 1982 Gas 21.35 HSD
5 SCGT KRSN #3 Keramasan 1983 Gas 21.35 Gas+HSD
6 SCGT Rental Inderalaya 1 Keramasan 2002 Gas 50.00 Gas+HSD
8 SCGT Inderalaya II Keramasan 2004 Gas 40.00 Gas+HSD
9 SCGT Truck Mounted 1 Keramasan 2004 Gas 20.00 Gas+HSD
10 SCGT Truck Mounted 2 Keramasan 2004 Gas 20.00 Gas+HSD
11 SCGT Apung Keramasan 2004 Gas 20.00 Gas+HSD Sub-step 4b. Discuss any similar options that are occurring: The only similar activities to the Project proposed in this PDD are small scale and either old, or in the case of the plants brought on line since 2000 mostly not permanent installations. Therefore, the Project proposed under this PDD should clearly be distinguished in terms of the technology used, as a major combined cycle plant at large scale capacity, of which there are no other existing plants and is additional. B.6. Emission reductions:
B.6.1. Explanation of methodological choices: The latest version of the approved methodology, AM0029, Version 02 has been followed in calculating the baseline emissions, project emissions, leakage emissions and emission reductions. Baseline emissions:
PROJECT DESIGN DOCUMENT FORM (CDM PDD) - Version 03.1. CDM – Executive Board page 23 Baseline emissions are calculated by multiplying the electricity generated in the project plant (EGPJ,y) with a baseline CO2 emission factor (EFBL,CO2,y), as follows: Wherein:
BEy : Baseline emissions in year y (tCO2e / yr) EGPJ,y : Electricity generation in the project plant during the year y in MWh EFBL,CO2,y : Baseline emission factor for the grid in year y (tCO2/MWh)
AM0029 advises to address the baseline uncertainties in a conservative manner by choosing the EFBL,CO2,y as the lowest emission factor among the following three options:
• Option 1: The build margin, calculated according to “Tool to calculate emission factor for an electricity system”; and
• Option 2: The combined margin, calculated according to “Tool to calculate emission factor for an electricity system”, using a 50/50 OM/BM weight.
• Option 3: The emission factor of the technology (and fuel) identified as the most likely baseline scenario under “Identification of the baseline scenario” above, and calculated as follows:
where, COEFBL : the fuel emission coefficient (tCO2e/GJ), based on national average fuel data, if available, otherwise IPCC defaults can be used ηBL : the energy efficiency of the technology, as estimated in the baseline scenario analysis above.
This determination will be made once at the validation stage based on an ex ante assessment, once again at the start of each subsequent crediting period (if applicable). If either option 1 (BM) or option 2 (CM) are selected, they will be estimated ex post, as described in “Tool to calculate emission factor for an electricity system”. Please refer to the Annex 3 for detailed calculations. Emission factors determined using the three options are summarised in the TableB5 below,
Table B5: Summary of baseline emission factor
Option Particulars Emission Factor (tCO2e/MWh)
1 Build Margin 0.8417 2 Combined Margin 0.9992 3 Emission factor for coal based Power Plant 1.1933
Where, EFBL,CO2,y is calculated in a conservative manner and should use the lowest emission factor among the three options mentioned above. Among the three options above, the lowest emission factor selected is Build Margin emission factor of 0.8417 tCO2e/MWh.
(2)
(1)
PROJECT DESIGN DOCUMENT FORM (CDM PDD) - Version 03.1. CDM – Executive Board page 24 Therefore the baseline emissions are calculated by multiplying the electricity generated in the project plant (EGPJ,y) with a baseline CO2 emission factor (EFBL,CO2,y), as follows:
= 613,200 MWh x 0.8417 tCO2e/MWh = 516,155 tCO2e for the year 2009 = 889,140 MWh x 0.8417 tCO2e/MWh = 748,424 tCO2e from the year 2010 onwards Project emissions: The project activity is on-site combustion of natural gas to generate electricity. The CO2 emissions from electricity generation (PEy) are calculated as follows:
Where:
FCf,y : is the total volume of natural gas or other fuel ‘f’ combusted in the project plant or other startup fuel (m3 or similar) in year(s) ‘y’ COEFf,y : is the CO2 emission coefficient (tCO2/m3 or similar) in year(s) for each fuel and is obtained as:
Where:
NCVf,y : is the net calorific value (energy content) per volume unit of natural gas in year ‘y’ (GJ/m3) as determined from the fuel supplier, wherever possible, otherwise from local or national data; EFCO2,f,y : is the CO2 emission factor per unit of energy of natural gas in year ‘y’ (tCO2/GJ) as determined from the fuel supplier, wherever possible, otherwise from local or national data; OXIDf : is the oxidation factor of natural gas
Table B6: Parameters and their value used in the calculation of project emissions
# Parameter Value Unit 1 Net calorific value of Natural gas (NCVf,y) 48.00 TJ/kt
Net Calorific Value of the natural gas combusted 42.78 TJ/106 m3
2 Gas consumption in the Plant (for 12 months) (FCf,y)
154 kt/yr
Gas consumption in the Plant (for 12 months) (FCf,y)
223,840,264 Nm3/yr
3 Emission factor for gas (EFCO2,f,) 56.1 tCO2/TJ 4 Oxidation factor of gas (OXIDf) 0.995
PEy = 413,823 tCO2
(3)
(4)
PROJECT DESIGN DOCUMENT FORM (CDM PDD) - Version 03.1. CDM – Executive Board page 25 Leakage Leakage may result from fuel extraction, processing, liquefaction, transportation, re-gasification and distribution of fossil fuels outside of the project boundary. This includes mainly fugitive CH4 emissions and CO2 emissions from associated fuel combustion and flaring. In this methodology, the following leakage emission sources shall be considered.
• Fugitive CH4 emissions associated with fuel extraction, processing, liquefaction, transportation, re-gasification and distribution of natural gas used in the project plant and fossil fuels used in the grid in the absence of the project activity.
• In the case LNG is used in the project plant: CO2 emissions from fuel combustion/electricity consumption associated with the liquefaction, transportation, re-gasification and compression into a natural gas transmission or distribution system.
Thus, leakage emissions are calculated as follows:
Where:
LEy Leakage emissions during the year y in tCO2e LECH4,y Leakage emissions due to fugitive upstream CH4 emissions in the year y in t CO2e LELNG,CO2,y Leakage emissions due to fossil fuel combustion / electricity consumption associated
with the liquefaction, transportation, re-gasification and compression of LNG into a natural gas transmission or distribution system during the year y in t CO2e
In the project activity there will be no LNG consumption, hence LELNG,CO2,y will be zero. Fugitive methane emissions For the purpose of estimating fugitive CH4 emissions, project participants should multiply the quantity of natural gas consumed by the project in year y with an emission factor for fugitive CH4 emissions (EFNG,upstream,CH4) from natural gas consumption and subtract the emissions occurring from fossil fuels used in the absence of the project activity, as follows:
Where: LECH4,y Leakage emissions due to fugitive upstream CH4 emissions in the year y in t CO2e FCy Quantity of natural gas combusted in the project plant during the year y in m3 NCVNG,y Average net calorific value of the natural gas combusted during the year y in GJ/m3 EFNG,upstream,CH4 Emission factor for upstream fugitive methane emissions of natural gas from production,
transportation, distribution, and, in the case of LNG, liquefaction, transportation, re-gasification and compression into a transmission or distribution system, in t CH4 per GJ fuel supplied to final consumers
EGPJ,y Electricity generation in the project plant during the year in MWh EFBL,upstream,CH4 Emission factor for upstream fugitive methane emissions occurring in the absence of the
project activity in t CH4 per MWh electricity generation in the project plant, as defined below GWPCH4 Global warming potential of methane valid for the relevant commitment period
(5)
(6)
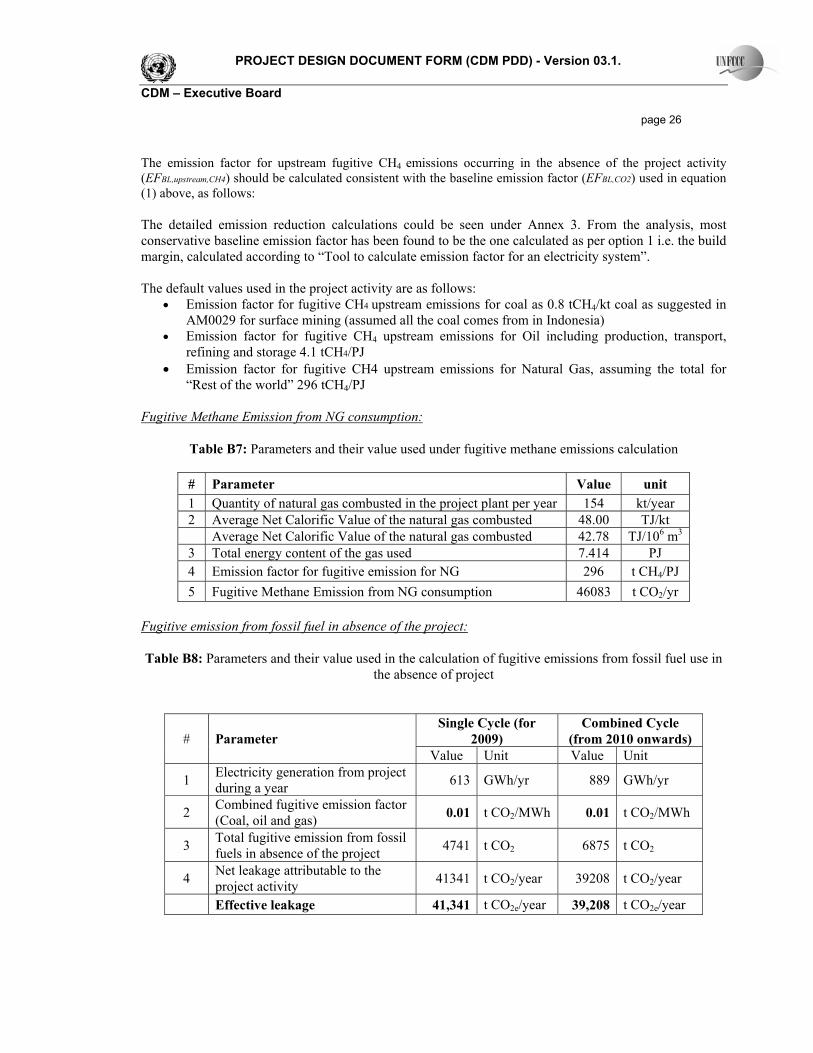
PROJECT DESIGN DOCUMENT FORM (CDM PDD) - Version 03.1. CDM – Executive Board page 26 The emission factor for upstream fugitive CH4 emissions occurring in the absence of the project activity (EFBL,upstream,CH4) should be calculated consistent with the baseline emission factor (EFBL,CO2) used in equation (1) above, as follows: The detailed emission reduction calculations could be seen under Annex 3. From the analysis, most conservative baseline emission factor has been found to be the one calculated as per option 1 i.e. the build margin, calculated according to “Tool to calculate emission factor for an electricity system”. The default values used in the project activity are as follows:
• Emission factor for fugitive CH4 upstream emissions for coal as 0.8 tCH4/kt coal as suggested in AM0029 for surface mining (assumed all the coal comes from in Indonesia)
• Emission factor for fugitive CH4 upstream emissions for Oil including production, transport, refining and storage 4.1 tCH4/PJ
• Emission factor for fugitive CH4 upstream emissions for Natural Gas, assuming the total for “Rest of the world” 296 tCH4/PJ
Fugitive Methane Emission from NG consumption:
Table B7: Parameters and their value used under fugitive methane emissions calculation
# Parameter Value unit 1 Quantity of natural gas combusted in the project plant per year 154 kt/year 2 Average Net Calorific Value of the natural gas combusted 48.00 TJ/kt Average Net Calorific Value of the natural gas combusted 42.78 TJ/106 m3
3 Total energy content of the gas used 7.414 PJ 4 Emission factor for fugitive emission for NG 296 t CH4/PJ 5 Fugitive Methane Emission from NG consumption 46083 t CO2/yr
Fugitive emission from fossil fuel in absence of the project:
Table B8: Parameters and their value used in the calculation of fugitive emissions from fossil fuel use in
the absence of project
Single Cycle (for
2009) Combined Cycle
(from 2010 onwards) # Parameter Value Unit Value Unit
1 Electricity generation from project during a year 613 GWh/yr 889 GWh/yr
2 Combined fugitive emission factor (Coal, oil and gas) 0.01 t CO2/MWh 0.01 t CO2/MWh
3 Total fugitive emission from fossil fuels in absence of the project 4741 t CO2 6875 t CO2
4 Net leakage attributable to the project activity 41341 t CO2/year 39208 t CO2/year
Effective leakage 41,341 t CO2e/year 39,208 t CO2e/year
PROJECT DESIGN DOCUMENT FORM (CDM PDD) - Version 03.1. CDM – Executive Board page 27
B.6.2. Data and parameters that are available at validation:
Data / Parameter: NCVNG,y Data unit: TJ/106 m3 Description: Calorific Value of natural gas Source of data used: PERTAMINA Value applied: 42.78 Justification of the choice of data or description of measurement methods and procedures actually applied :
Country specific data.
Any comment:
Data / Parameter: NCVCoal,y Data unit: TJ/kilo tonne Description: Calorific Value of Coal Source of data used: IPCC guidelines 2006 Value applied: 25.8 Justification of the choice of data or description of measurement methods and procedures actually applied :
Default value
Any comment: Equivalent to Other Bituminous Coal
Data / Parameter: NCVHSD,y Data unit: TJ/kilo tonne Description: Calorific Value of High Speed Diesel Source of data used: IPCC guidelines 2006 Value applied: 43.00 Justification of the choice of data or description of measurement methods and procedures actually applied :
Default value
Any comment: Equivalent to Gas/Diesel Oil
Data / Parameter: NCVIDO,y Data unit: TJ/kilo tonne Description: Calorific Value of Industrial Diesel Oil Source of data used: IPCC guidelines 2006
PROJECT DESIGN DOCUMENT FORM (CDM PDD) - Version 03.1. CDM – Executive Board page 28 Value applied: 43.00 Justification of the choice of data or description of measurement methods and procedures actually applied :
Default value
Any comment: Equivalent to Gas/Diesel Oil
Data / Parameter: NCVMFO,y Data unit: TJ/kilo tonne Description: Calorific Value of Marine Fuel Oil Source of data used: IPCC guidelines 2006 Value applied: 40.40 Justification of the choice of data or description of measurement methods and procedures actually applied :
Default value
Any comment: Equivalent to Residual Fuel Oil
Data / Parameter: EFCO2,NG Data unit: tCO2/TJ Description: CO2 emission factor of natural gas Source of data used: IPCC 2006 guidelines Value applied: 56.10 Justification of the choice of data or description of measurement methods and procedures actually applied :
IPCC 2006 guidelines
Any comment:
Data / Parameter: EFCO2,Coal Data unit: tCO2/TJ Description: CO2 emission factor of Coal Source of data used: IPCC 2006 guidelines Value applied: 94.60 Justification of the choice of data or description of measurement methods and procedures actually applied :
IPCC 2006 guidelines
PROJECT DESIGN DOCUMENT FORM (CDM PDD) - Version 03.1. CDM – Executive Board page 29 Any comment: Equivalent to Other Bituminous Coal
Data / Parameter: EFCO2,HSD Data unit: tCO2/TJ Description: CO2 emission factor of High Speed Diesel Source of data used: IPCC 2006 guidelines Value applied: 74.07 Justification of the choice of data or description of measurement methods and procedures actually applied :
IPCC 2006 guidelines
Any comment: Equivalent to Gas/Diesel Oil
Data / Parameter: EFCO2,IDO Data unit: tCO2/TJ Description: CO2 emission factor of Industrial Diesel Oil Source of data used: IPCC 2006 guidelines Value applied: 74.07 Justification of the choice of data or description of measurement methods and procedures actually applied :
IPCC 2006 guidelines
Any comment: Equivalent to Gas/Diesel Oil
Data / Parameter: EFCO2,MFO Data unit: tCO2/TJ Description: CO2 emission factor of Marine Fuel Oil Source of data used: IPCC 2006 guidelines Value applied: 77.37 Justification of the choice of data or description of measurement methods and procedures actually applied :
IPCC 2006 guidelines
Any comment: Equivalent to Residual Fuel Oil
Data / Parameter: ηBL Data unit: % Description: The efficiency of baseline technology i.e. coal based power generation Source of data used: PT PLN Value applied: 28.5%
PROJECT DESIGN DOCUMENT FORM (CDM PDD) - Version 03.1. CDM – Executive Board page 30 Justification of the choice of data or description of measurement methods and procedures actually applied :
Calculated for the year 2007.
Any comment:
B.6.3 Ex-ante calculation of emission reductions: Emission Reductions: To calculate the emission reductions the project participant shall apply the following equation:
Where:
ERy emissions reductions in year y (t CO2e) BEy emissions in the baseline scenario in year y (t CO2e) PEy emissions in the project scenario in year y (t CO2e) LEy leakage in year y (t CO2e)
ERy = (516,155 - 413,823 – 41,341) tCO2e
= 60,990 tCO2e for the Year 2009 = (748,424 - 413,823 – 39,208) tCO2e = 295,393 tCO2e from the Year 2010 onwards till the end of crediting period The detailed emission reduction calculations could be seen under Annex 3.
B.6.4 Summary of the ex-ante estimation of emission reductions:
Table B9. Overall emission reduction through the project
B.7 Application of the monitoring methodology and description of the monitoring plan: The monitoring methodology followed is as per approved monitoring methodology AM0029, Version 2 of “Grid Connected Electricity Generation Plants using Non-Renewable and Less GHG Intensive Fuel”. This methodology also uses the build margin (BM) approach as specified in “Tool to calculate the emission factor for an electricity system”, version 01. Emissions will be calculated ex-post as per Option 2 of the Tool, with the data required to recalculate the build margin being compiled annually through consultation with PLN. The project activity is natural gas based power generation project, which exports the generated electricity to the identified power grid. The project activity meets the methodology applicability criteria. All the data to be monitored to estimate project, baseline and leakage emissions for verification and issuance will be kept for two years after the end of the crediting period or the last issuance of CERs for the project activity, whichever occurs later. The data should be monitored 100% if not indicated otherwise in the tables under section B.7.1. All measurements should be conducted with calibrated measurement equipment according to relevant industry standards. The data presented in the spreadsheet is presented in a manner that enables reproducing of the calculation of baseline emission factor.
B.7.1 Data and parameters monitored: Data / Parameter: EGPJ,y Data unit: MWh Description: Electricity generation in the project plant during the year Source of data to be used:
On-site measurement of net metered electricity output from the project and electricity sales receipts
Value of data applied for the purpose of calculating expected emission reductions in section B.5
889,140
PROJECT DESIGN DOCUMENT FORM (CDM PDD) - Version 03.1. CDM – Executive Board page 32 Description of measurement methods and procedures to be applied:
On-site electricity meter
QA/QC procedures to be applied:
The meters used for electricity measurement will be calibrated at pre-planned preventive maintenance scheduled as indicated by the manufacturer of the equipment. The data would be archived and made available until two years after the last issuance of CERs for the project
Any comment: • Data will be aggregated daily, monthly and annually • The total electricity generated will be monitored by both the parties – PT
AKE and PT PLN as grid operator. Data / Parameter: FCf,y Data unit: Nm3 Description: Annual quantity of fuel “f” consumed in project activity Source of data to be used:
Fuel flow meter reading in the project boundary
Value of data applied for the purpose of calculating expected emission reductions in section B.5
223,840,264
Description of measurement methods and procedures to be applied:
Metered (m)
QA/QC procedures to be applied:
The data would be archived and made available until two years after the last issuance of CERs for the project
Any comment: • Data will be aggregated daily, monthly and annually • Gas use measurement meters will be calibrated at pre-planned preventive
maintenance scheduled as indicated by the manufacturer of the equipment
• The total fuel consumption will be monitored both at supplier and PT AKE
Data / Parameter: NCVf,y Data unit: TJ/106 Nm3 Description: Net Calorific Value of fuel “f” Source of data to be used:
Fuel Supplier
Value of data applied for the purpose of calculating expected emission reductions in section B.5
33.12
Description of measurement methods and procedures to be
Estimated (e)
PROJECT DESIGN DOCUMENT FORM (CDM PDD) - Version 03.1. CDM – Executive Board page 33 applied: QA/QC procedures to be applied:
The data would be archived and made available until two years after the last issuance of CERs for the project
Any comment: • Fortnightly • Supplier-provided data.
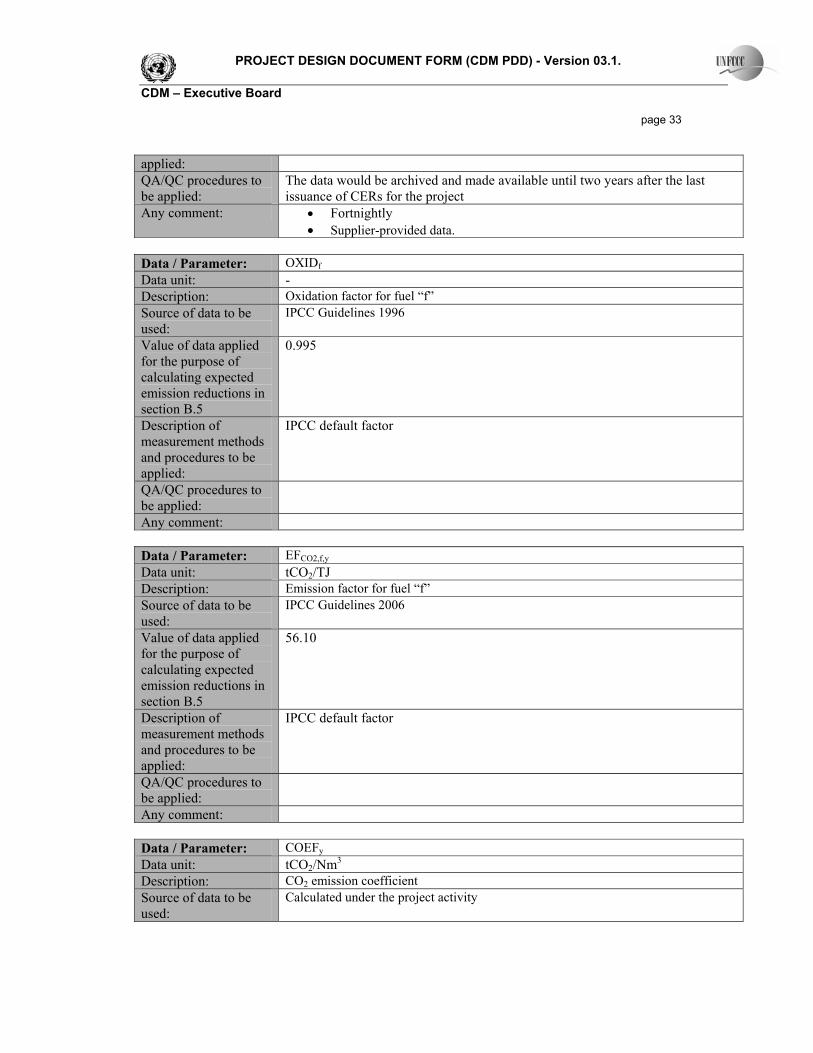
Data / Parameter: OXIDf Data unit: - Description: Oxidation factor for fuel “f” Source of data to be used:
IPCC Guidelines 1996
Value of data applied for the purpose of calculating expected emission reductions in section B.5
0.995
Description of measurement methods and procedures to be applied:
IPCC default factor
QA/QC procedures to be applied:
Any comment:
Data / Parameter: EFCO2,f,y Data unit: tCO2/TJ Description: Emission factor for fuel “f” Source of data to be used:
IPCC Guidelines 2006
Value of data applied for the purpose of calculating expected emission reductions in section B.5
56.10
Description of measurement methods and procedures to be applied:
IPCC default factor
QA/QC procedures to be applied:
Any comment:
Data / Parameter: COEFy Data unit: tCO2/Nm3 Description: CO2 emission coefficient Source of data to be used:
Calculated under the project activity
PROJECT DESIGN DOCUMENT FORM (CDM PDD) - Version 03.1. CDM – Executive Board page 34 Value of data applied for the purpose of calculating expected emission reductions in section B.5
0.001858
Description of measurement methods and procedures to be applied:
Calculated (c) using NCVf,y and EFCO2,f,y
QA/QC procedures to be applied:
Any comment: • Annual
Data / Parameter: PEy Data unit: tCO2 Description: Project emission due to combustion of fuel Source of data to be used:
Calculated under the project activity
Value of data applied for the purpose of calculating expected emission reductions in section B.5
413,823
Description of measurement methods and procedures to be applied:
Calculated (c)
QA/QC procedures to be applied:
Any comment: • Annual B.7.2 Description of the monitoring plan:
Operation and maintenance service: PT AKE will be operating the power plant with additional operation and maintenance services provided by Pembangkitan Jawa Bali Services (PJBS), a subsidiary of PT PLN with extensive experience in operating and maintenance services for several power plants in Indonesia. The company will apply its experience to perform and arrange for the performance of specific operations, maintenance and repair services necessary to ensure robust and continued operation and production of electrical energy by the Project. Operational and Maintenance Structure:
PROJECT DESIGN DOCUMENT FORM (CDM PDD) - Version 03.1. CDM – Executive Board page 35 The parameters that need to be monitored (as mentioned under section B.7.1) under the CDM process are integrated with the existing project operational setup. The power plant is automated; parameters are continuously monitored and recorded using the standard software used for power plants. The site in-charge from PJBS will head the CDM monitoring team which includes two personnel with specific responsibility for keeping the data as per the monitoring requirement under the CDM process in addition to standard operational and maintenance team. The CDM team is trained with all the procedures and monitoring requirements as per CDM process. A good coordination is maintained between the two teams to avoid misrepresentation of data. Figure B2 details the framework of monitoring. The CDM team will archive the data in calculating the results related to GHG emissions. The recorded data would be stored and made available (both forms – hard copies as well softcopy) until two years after the last issuance of CERs for the project.
Figure B2: Framework of Monitoring setup under the project
The monitoring team will undertake all activities to ensure provision of accurate information for verification and certification in accordance with the monitoring plan. The specific data collection activities are detailed further in Annex 4. B.8 Date of completion of the application of the baseline study and monitoring methodology and the name of the responsible person(s)/entity(ies) Date of completion: 31/03/2008 Person/entity determining the baseline: Climate Change Capital Ltd., 3 More London Riverside, London, SE1 2AQ United Kingdom Tyler Chapman Michael Brown [email protected][email protected]
PROJECT DESIGN DOCUMENT FORM (CDM PDD) - Version 03.1. CDM – Executive Board page 36 Tel: +44 (0)20 7939 5000 Tel: +44 (0)20 7939 5000 Fax: +44 (0)20 7939 5030 Fax: +44 (0)20 7939 5030 Climate Change Capital determined the baseline through consultation with PLN. SECTION C. Duration of the project activity / crediting period C.1 Duration of the project activity: C.1.1. Starting date of the project activity: Starting date of the project is 30 October 2007 (30/10/2007), being the date of signing the agreement with PLN to operate the power plant and sell power to PLN. C.1.2. Expected operational lifetime of the project activity: Expected operational life of the project is 10 years C.2 Choice of the crediting period and related information: Fixed crediting period C.2.1. Renewable crediting period C.2.1.1. Starting date of the first crediting period: Intentionally left blank >> C.2.1.2. Length of the first crediting period: Intentionally left blank >> C.2.2. Fixed crediting period: C.2.2.1. Starting date: The starting date of the crediting period is from 01 January 2009, or registration of the project, whichever is later. C.2.2.2. Length: Ten (10) years 0 months
PROJECT DESIGN DOCUMENT FORM (CDM PDD) - Version 03.1. CDM – Executive Board page 37 SECTION D. Environmental impacts To fulfil the requirement set forth by the Ministry of Environment with regard to ecological protection: KEP-03/MENLH/2000 year 2000 governing the types of business and/or activity that requires obligatory environmental studies and the project activity would fall under this category. D.1. Documentation on the analysis of the environmental impacts, including transboundary impacts: The identifiable impacts on the environmental with respect to the project are:
a. Air parameter • Noise level
Noise pollution tolerance level will be based on standard set by Ministry of Environment: KEP-48/MENLH/11/1996, pertaining to the quality of the noise level.
• Sulfur dioxide In view of the low sulfuric content in compressed natural gas in Keramasan, the impact on environment for this parameter is insignificant.
b. Water Parameter
The main sources of water pollution are expected to come from disposed oil and domestic waste, such as sanitation system. Pollution from these sources will be low. Disposed oil will be filtered and trapped with equipments such as oil catcher, oil trap and well-like absorber. All wastes will be disposed in accordance with the Ministry of Environment standard kep-51/MENKLH/10/1995 about Baku the Quality of the Liquid Waste. D.2. If environmental impacts are considered significant by the project participants or the host Party, please provide conclusions and all references to support documentation of an environmental impact assessment undertaken in accordance with the procedures as required by the host Party: As indicated, KEP-03/MENLH/2000 year 2000 governing the types of business and/or activity that requires obligatory environmental studies, the company will submit full report on environmental studies and these documents will cover:
a. Environmental Impact Assessment Report (AMDAL by PLN) is available. b. Environmental studies (AMDAL) conducted by PT PLN (Persero) (completed) c. The reference framework of the project (kA) that was the reference point for all environmental
studies (yet to be done). d. Environmental Management Plan (RKL), is the management guidelines for actions in the event of
any environmental impact during the course of the project (yet to be done). e. Environmental Monitoring Plan (RPL), layout the plan for monitoring environmental parameters
in the event of unforeseen changes in the implementation of the project (yet to be done).
SECTION E. Stakeholders’ comments
PROJECT DESIGN DOCUMENT FORM (CDM PDD) - Version 03.1. CDM – Executive Board page 38 E.1. Brief description how comments by local stakeholders have been invited and compiled: A public forum was organized in conjunction with the requirement for a consultation of local stakeholders in the design for the CDM Project on natural gas based power production in Palembang, Indonesia. The public forum was held at the Horison Hotel, Palembang on 28 January 2007. The potential stakeholders were identified, including local government, industry and business, non-governmental organisations (NGOs), academia, civil society and the media. Invitations were sent directly to more than 40 potential stakeholders about 3 weeks before the date of the forum and over 30 people attended. Presentations were given on the background to the project and an overview of CDM.
E.2. Summary of the comments received: Comments and questions received covered issues such as local employment, technology, how the CDM works, regulatory approvals and local environmental impacts. These comments and questions are detailed in the following section E.3. E.3. Report on how due account was taken of any comments received: A summary of the questions received and responses is below:
Table E1. Summary on comments received through stakeholder’s consultation process
Question / comment Answer
1. We strongly support the development of the project in Palembang, since this project is needed to overcome the power supply crisis. We see that the development of this project shall increase work opportunities in Palembang, and South Sumatra in general. What are the criteria for employment?
We will mostly be in need for machine operators, so we will need workers that have a background in machinery or electrical instrumentation. Qualifications vary in grade, but we will mostly require high school graduates, although D1 – D3 graduates will also be needed. Other positions outside operations, such as administration, accounting and finance will require workers from high school until university graduates.
2. One of the requirements of Clean The advantage of natural gas-fired power plants is that it is
PROJECT DESIGN DOCUMENT FORM (CDM PDD) - Version 03.1. CDM – Executive Board page 39
Question / comment Answer Development Mechanism is the sustainability of technology. What kind of technology will be used by the power plant?
clean. Natural gas (methane) when burnt produces a smaller amount of CO2, if compared to power plants that use other forms of energy. If qualifications for a project are not met, then CDM cannot be applied. The technology used is Combined Cycle Gas Turbine (CCGT) which uses natural gas as fuel in the power plant. The burning of gas with compressed air in the combustion chamber results in high-pressure, high-velocity gas which is used to rotate turbines and turbines trigger generators, which in turn generates power. The machines we will use are from UK, which are reliable, and with proper usage and maintenance can operate for 15-20 years. This technology is widely used in the world. Natural gas is a cleaner fuel than coal or diesel since it emits less CO2. The problem is, gas is not always available in all areas. Other clean alternatives for energy sources are wind and solar. Wind is not widely available in Sumatra, whilst solar energy requires advanced technologies.
3. The activity plan for the project has gained approval from the Minister of Environment. The activity plan must refer to the Minister of Environment Decree No. 11 year 2006 regarding activity plans that are required to own Amdal (Environmental Impact Assessment).
We have already fulfilled Amdal requirements from the Government. However, there is an additional requirement that needs to be fulfilled also, that is, the CDM requirements. This project refers to the Kyoto Protocol, and requires CER reduction certification.
4. This project will require workforce. There will be a problem in the contribution of local workers since they might not fulfill the employment requirement of AKE. We suggest that local workers still be involved by recruiting them as low-level workers.
AKE will recruit local workers and will not be rigid in applying the employment requirements. The qualification mentioned earlier applies only to positions that are specifically related to machinery, while there are still many other positions provided. Local workers will be prioritized to fill in the low-level positions.
5. You have mentioned the contributions of advanced and developing countries towards the reduction of greenhouse gas emission. Will the development of gas-fired power plants reduce greenhouse gas emission or will it only not add to the current state of gas emission? Will there also be pollution in form of radiation or waste that will affect the surrounding community?
Natural gas-fired power plants still emit CO2, but in a smaller amount when compared to other types of power plants such as coal and oil based power generation. There are alternatives that do not emit CO2, such as solar and wind power, but the technology is still very expensive. The waste produced is in form of gas, CO2, which is the result of the combustion of natural gas. Drainage will also be developed, and after the development of the plant is completed, trees will be planted to block wind and dust, while the roots will function to contain water.
6. What type of gas is used and will it harm the surrounding community? Is there a possibility that gas leakage might occur? How would gas leakage be handled? A gas leakage has once occurred in Palembang
Natural gas is distributed through pipes to the gas receiving station at Keramasan. The pressure and volume of gas is monitored at the station. AKE applies K3 (Kesehatan dan Keselamatan Kerja/Occupational Safety and Health) procedures, so that if an incident occurs, a standard
PROJECT DESIGN DOCUMENT FORM (CDM PDD) - Version 03.1. CDM – Executive Board page 40
Question / comment Answer caused by one of the SOEs (State Owned Enterprise).
procedure will be followed. In the power generator area and the gas receiving area, fire extinguishers are provided. Pipes do not go through residential housing areas, but through vacant lands. AKE’s responsibility is at the point of receiving gas, while the points involved during the transfer of gas is the responsibility of gas suppliers.
7. How far is the coverage area of local community that can be employed at AKE?
We cannot determine how far, but priority will be given to the local community, for both formal and non-formal positions, from low-level to company staff positions, so that the economical benefits can soon be made aware of.
8. In our experience at PLTG Asri Gita Sarana, the sound of the power plant there is quite disturbing, so we think that it could be a problem for the surrounding community. We suggest that the project should be socialized to the surrounding community to give an understanding to them also.
We are aware that the operating turbines produce disturbing noise. There is a PLN residential housing located 400-500 m to the west of the machines and there is also a community housing area located 700 m to the south of the machines. We have ensured that no housing areas are located near to the plant. We will also plant trees that will function to reduce noise, besides blocking wind and dust. We also have ensured that the noise of the turbines do not reach Jalan Keramasan.
References
[1] Fransiscus Alip (2007): Minutes of Meeting between GreenWorksAsia and Prasetyo Utomo (staff member of secretariat of Indonesian DNA) on 06 September 2007. Ed. IndoConsult, Held at D.I Paijaitan Kav. 24, Building A, 6th Floor (Otorita Batam), Kebon Nanas, Jakarta 13410, p. 2.
[2] Primanitya Swastyastu (2008): Minutes of Meeting between PT AKE and PT PLN on 22 February 2008. Ed. IndoConsult, Held at PLN Generating & Distribution Sumbagsel (“PLN Kitlur Sumbagsel”), Jakarta, p. 2.
[3] Primanitya Swastyastu (2008): Minutes of Meeting between PT AKE and PT PLN on 03 March 2008. Ed. IndoConsult, Held at PLN Dispatch Centre for Sumbagsel (PLN P3B Sumbagsel), Palembang, p. 5.
[4] PT Medco Energi Internasional Tbk (2006): Offering Circular - PT Medco Energi Internasional Tbk, Available online at http://www.medcoenergi.com/download/OC%20CB%20Medco.pdf (the date of Offering Circular is May 9, 2006). Jakarta, pp. Page F-169, paragraph Xii.
[5] BP Statistical Review of World Energy 2007, Available at http://www.bp.com/productlanding.do?categoryId=6848&contentId=7033471 (accessed in December 2007). BP 2007.
[6] Dr. Ir. Widodo Wahyu Purwanto, Ir. Yulianto Sulistyo Nugroho, Ir. Rinaldy Dalimi, Dr. A. Harsono Soepardjo, Ir. Abdul Wahid, Ir. Dijan Supramono, Dinna Herminna, Teguh Ahmad Adilina (Eds.): Indonesia Energy Outlook And Statistics 2006, Available at www.peui.eng.ui.ac.id/files/publikasi2007/EXECUTIVE%20SUMMARY%20IEOS%202006.pd
PROJECT DESIGN DOCUMENT FORM (CDM PDD) - Version 03.1. CDM – Executive Board page 41
f (accessed in December 2007). Pengkajian Energi Universitas Indonesia, Depok, December 2006.
[7] Business Monitor International Industry Insights - Oil & Gas Asia, 2007. Business Monitor International 2007.
[8] James Booker (2007): Available at http://www.booker.com.sg/publications/A%20BOOM%20IN%20INDONESIA%20S%20DOMESTIC%20MARKET.pdf (accessed in December 2007). In McCloskey’s 5th Asian Coal Conference, PT Paiton Energy, Jakarta, Indonesia, p. 16.
[9] Economic Section (May 2006): Indonesia: Energy Highlights May 2006, Available at http://jakarta.usembassy.gov/econ/Energy_Highlights_May_06.pdf (accessed in January 2008). US Embassy Jakarta.
[10] Economic Section (January 2007): Indonesia: Energy Highlights January 2007, Available at http://jakarta.usembassy.gov/econ/Energy%20highlights_jan07.pdf (accessed in January 2008). US Embassy Jakarta.
[11] The Jakarta Post (11 September 2007): PLN launches one of biggest power projects, Available at http://id2.mofcom.gov.cn/aarticle/chinanews/200709/20070905084470.html (accessed in January 2008). The Jakarta Post, Jakarta, p. Commercial News.
[12] PT. Tambang Batubara Bukit Asam (Persero), T. (14-15 June 2007): PT. Tambang Batubara Bukit Asam - Presentation for NDR, Hongkong, Available at http://www.ptba.co.id/index.php?halaman=Pengetahuan.publikasi, alternatively www.ptba.co.id/index.php?halaman=include.downloadfileattachment&id=ed3d2c2211991e32007bef5e06970613af9fa6ca (accessed in April 2008). Hong Kong.
[13] Stephan I Hasjim, Robert Kong, David Fergusson (2007): Industry In-Depth: Indonesia Banks Ed. Citigroup Report, Indonesia, p. 64.
[14] PLN (2007): Statistics Data - Energy, Indonesia, Available at http://202.162.220.3/statistik/statistik.asp (accessed in December 2007). In Energy Statistics, PLN, Jakartha.
[15] Coalportal (June 2007): 10,000MW fast track, Available at www.coalportal.com (accessed on January 2008). In Indonesian Coal and Power, p. 13.
[16] National Committee for the acceleration of Infrastructure Provision (KKPPI) (2006): Information memorandum - Central Java Coal-Fired Power Project, Available at www.infrastructureindonesia.org (accessed in January 2008). In Information memorandum. Eds. Ministry of Energy and Mineral Resources, State Electricity Corporation (PLN), Jakartha, pp. Central Java-Coal Power Project.
[17] Anshukant Taneja, Joey Chew (2007): PT Perusahaan Listrik Negara (Persero), Available at www.standardandpoors.com/ratingsdirect (accessed in December 2007). Eds. Standard and Poors, RratingsDirect, Standard & Poors, New York, p. 7.
PROJECT DESIGN DOCUMENT FORM (CDM PDD) - Version 03.1. CDM – Executive Board page 42 [18] Chetan Ahya, Tanvee Gupta, Deyi Tan (2007): Indonesia: Building a Foundation for Reviving
Infrastructure, Available at www.morganstanley.com (accessed in December 2007). In Indonesia Economics, Morgan Stanley p. 83.
[19] Migara Jayawardena, Leiping Wang, Eka Putra, Alex Sundakov, Helianti Hilman, Alfonzo Guzman, Sati Bur Rasuanto, Rod Barfield, Lolo Panggabean (December 2005): Electricity For All: Options for Increasing Access in Indonesia, Available at http://siteresources.worldbank.org/INTINDONESIA/Resources/Publication/280016-1106130305439/Electricity-for-All-Options-for-Increasing-Access-in-Indonesia.pdf (accessed in January 2008). The World Bank Office Jakarta, Jakarta, p. 74.
PROJECT DESIGN DOCUMENT FORM (CDM PDD) - Version 03.1. CDM – Executive Board page 43
Annex 1
CONTACT INFORMATION ON PARTICIPANTS IN THE PROJECT ACTIVITY Organization: Climate Change Capital acting on behalf of Climate Change Capital Carbon
Fund II S.à r.l and Climate Change Capital Managed Account S.à r.l Street/P.O.Box: 3 More London Riverside Building: City: London State/Region: Postfix/ZIP: SE1 2AQ Country: United Kingdom Telephone: +44 207 9395000 FAX: +44 207 9395030 E-Mail: URL: Represented by: Michael Brown Title: Associate Salutation: Last Name: Brown Middle Name: First Name: Michael Department: Carbon Finance Mobile: Direct FAX: Direct tel: +44 207 9395240 Personal E-Mail: [email protected]
Organization: PT Asta Keramasan Energi Street/P.O.Box: JL Jend Sudirman Kav 54-55 Building: Plaza Bapindo, Mandiri Tower 20th Floor City: Jakarta State/Region: Postfix/ZIP: 12190 Country: Indonesia Telephone: +62 21 527 5620 FAX: +62 21 527 5621 E-Mail: URL: Represented by: Dana Pamilih Title: Salutation: Pak Last Name: Pamilih Middle Name: First Name: Dana
PROJECT DESIGN DOCUMENT FORM (CDM PDD) - Version 03.1. CDM – Executive Board page 44 Department: Mobile: Direct FAX: Direct tel: +62 81 311457488 Personal E-Mail: [email protected]
PROJECT DESIGN DOCUMENT FORM (CDM PDD) - Version 03.1. CDM – Executive Board page 45
Annex 2
INFORMATION REGARDING PUBLIC FUNDING
No public funding is involved in this project
Annex 3
BASELINE INFORMATION
The detailed baseline calculations information can be found under attachment 1, an excel file which accompanies this document.
Annex 4
MONITORING INFORMATION The monitoring plan will be undertaken by the project team as described in section B.7 of this PDD. The actions necessary to record all the monitoring parameters required by the methodology are described below. All data will be archived electronically, and backed up regularly. The data will be kept for the full crediting period, plus two years after the end of the crediting period, or the last issuance of CERs for this project activity, whichever occurs later. The Monitoring Plan for this project has been developed to ensure that from the start, the project is well organized in terms of the collection and archiving of complete and reliable data. The details of the monitoring management and organization are provided in Section B.7.2. Data to be monitored: The team responsible for monitoring will monitor a) Electricity generation in the project plant during the year b) Annual quantity of fuel “f” consumed in project activity c) Net Calorific Value of fuel “f” and using these parameters project emission due to combustion of fuel are calculated.
a) Electricity generation in the project plant during the year: Two on-site electricity meters are installed, one is from PT PLN (agency responsible for grid operation) which is the main meter and the other is from the PT AKE as check meter (also serve as a backup meter). Both the meters are checked before acceptance by the parties involved. However the project receives the payment against the main meter of PT PLN wherein monthly meter reading (both main and check meter) is taken jointly by the Parties on the fixed day of the month. However the daily record of the electricity generated by the project will be maintained as per the maintenance and operational protocol of PJBS.
b) Annual quantity of natural gas consumed in project activity: The continuous monitoring on the amount of natural gas used in the power plant is monitored through the flow meter reading in the project boundary. The gas will be supplied as per the gas-supply agreement signed with PT PLN. The project has an easy access to the gas transmission point from Medco E&P which is within PLN facilities. All the related reports and data are available at the power plant.
PROJECT DESIGN DOCUMENT FORM (CDM PDD) - Version 03.1. CDM – Executive Board page 46
c) Net Calorific Value of natural gas: This is obtained from the natural gas supplier i.e. PT PLN. Project emission due to combustion of fuel in the project is calculated using the above data. All records are stored electronically by the project team and records available for report production against required time frames. Calibration: Both the energy meters as well as flow meter for measuring the natural gas used in the project will be calibrated once in a year especially the meter installed by the PT PLN. During the daily reading if a variation is identified between the readings, then check meter shall be calibrated as per the testing protocol by PJBS. The remaining monitoring procedures are part of PT AKE policy which are in the similar lines with the monitoring methodology. Data and records management: All data collected during the verification period will be stored in an electronic format that will be easily accessible to the CDM verifier for independent checking. In the event that a series of measurements is truncated a remediation of conservative interpolations with recorded data will be applied to restore the integrity of the data. In order to make it easy for the verifier to retrieve the documentation and information in relation to the project emission reduction verification, a document register will be maintained and continually updated. The document register will ensure adequate document control for CDM purposes. The dedicated CDM Manager will be responsible for checking the data (according to a formal procedure) and will be responsible for managing the collection, storage and archiving of all data and records. A procedure will be developed to manage the CDM record keeping arrangements. All the data will be kept for two years after the end of each crediting period.