Climate Change and Consequences in the Intra- Americas Region(IAR) Dr. Jorge E. González NOAA-CREST Professor of Mechanical Engineering, The City College of New York, New York, NY Dr. Moises Angeles Malaspina & Dr. Nathan Hosannah Post-Docs, The City College of New York, New York, NY Jhon Ibsen Web Developer, The City College of New York, New York, NY Dr Daniel E. Comarazamy NOAA/NESDIS/STAR/SOCD, The City College of New York, New York, NY Equisha Glenn NOAA-CREST Fellow, The City College of New York, New York, NY Pablo Ortiz Mechanical Engineering Dept., The City College of New York, New York, NY Coastal Environmental Research Group cuerg.ccny.cuny.edu
Transcript
Climate Change and Consequences in the Intra-Americas Region(IAR)Dr. Jorge E. GonzálezNOAA-CREST Professor of Mechanical Engineering, The City College of New York, New York, NY Dr. Moises Angeles Malaspina & Dr. Nathan HosannahPost-Docs, The City College of New York, New York, NY
Jhon IbsenWeb Developer, The City College of New York, New York, NY
Dr Daniel E. ComarazamyNOAA/NESDIS/STAR/SOCD, The City College of New York, New York, NY
Equisha GlennNOAA-CREST Fellow, The City College of New York, New York, NY
Pablo OrtizMechanical Engineering Dept., The City College of New York, New York, NY
Coastal Environmental Research Groupcuerg.ccny.cuny.edu
• What is Caribbean climate?• How is the CC changing? • What are the regional, local, and societal
implications of these changes?• How the CC will change in the future?• What future research is needed?
Factors to be considered for climate studies in the Intra-Americas Region
Gamble et al., 2008
Sea Surface Temperature
IAR Climate Overview
Mid-Summer Drought (MSD) – Cause(s) for MSD variability is still unknown– More pronounced in western Caribbean– Potential link to Saharan dust contribution
Precipitation in the Caribbean– Match global average changes– Annual and decadal variability– Related to SSTs
Bimodal Precipitation Trend:oDry Season: Dec - Mar
oEarly Rainfall: April - June
oLate Rainfall: Aug - Nov
0
20
40
60
80
100
120
140
160
180
200
J F M A M J J A S O N D
Dai
ly A
ccum
ulat
ed P
reci
pita
tion
for t
he IA
R(m
m/d
ay)
Months
Precipitation 1979 to 2010
Precipitation 1979 to 1994
Precipitation 1995 to 2010
Mid-Summer Drought
Slight increase in LRS precipitation within past
15 years
GPCP monthly precipitation data
1) Angeles et al.,2010; 2) Magaña et al.,2009; 3) Gamble et al., 2008; 4) Comarazamy et al 2006; 5) Frich et al., 2002; 6) Peterson et al., 2002; 7) IPCC, 2007; 8) Spence et al., 2004; 9) Stephenson et al., 2007
Observed Caribbean Climatology
SST observed climatology from Reynolds-Smith data, 1982-2003 for (a) DS, (b) ERS, (c) LRS and Climatological Rainfall from CPC-Merged Analysis, 1979-2003 for (d) DS, (e) ERS and (f) LRS.
(a) (b) (c)
(d) (e) (f)
DRY SEASON EARLY RAINFALL SEASON LATE RAINFALL SEASON
Aerosols and Caribbean Bi-Modal
Date01/01/03 04/02/03 07/02/03 10/01/03 12/31/03
AOT
(nor
mal
ized
to
aver
age)
0.5
1.0
1.5
2.0
Annual Aerosol Variation (NW Puerto Rico, 2003)
380 nm440 nm500 nm
675 nm
870 nm
RMS Smoothed Data plus Annual & Semi-annual Fit
HOW IS THE CARIBBEAN CLIMATE CHANGING?
Guiding Questions
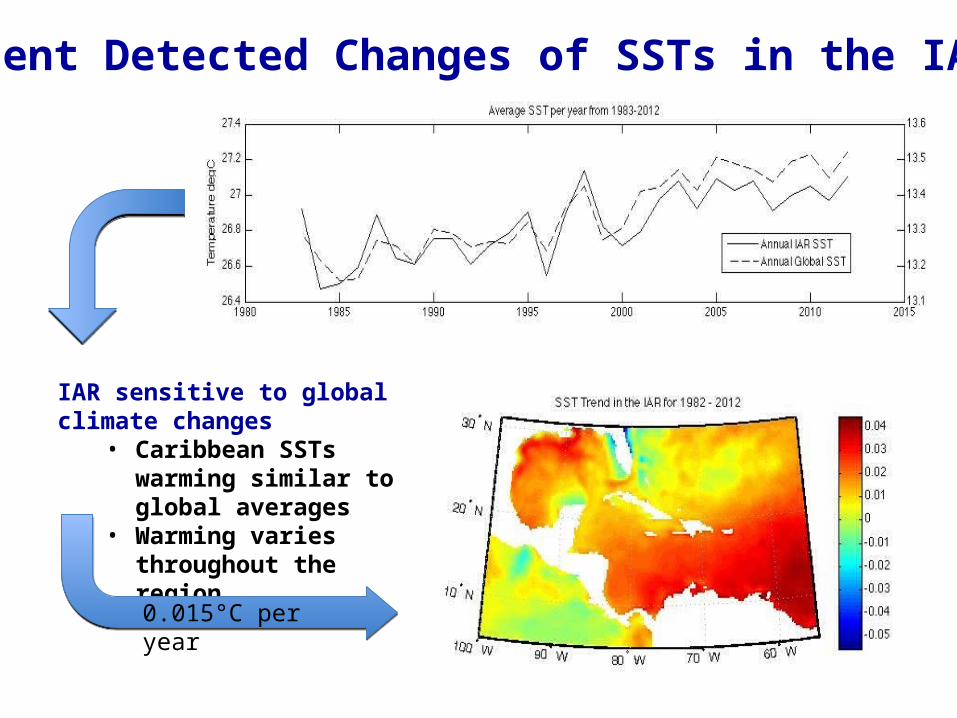
IAR sensitive to global climate changes
• Caribbean SSTs warming similar to global averages
• Warming varies throughout the region
Recent Detected Changes of SSTs in the IAR
0.015°C per year
Recent Detected Changes of SSTs in the IARLeft-Daily Spatial Variability
Right-Daily Anomalies
Early Rainfall Season
Late Rainfall Season
Dry Season
SSTs Seasonal Trends (1982-2012)
Over the past 30 years:
Warming (significant)• Gulf Coast• Northeast of South America
Cooling• Around coast of Florida
Increasing trend in DS not sufficient to motivate convection, leads to drying trend
Early Rainfall Season
Late Rainfall Season
Dry Season
SSTs Seasonal Trends (1982-2012)
Regions of greatest warming have high cross-correlation with precipitation in that same area•ERS – 0.78•LRS – 0.79
Regional Changes in Upper Air Conditions
Large-scale temperature (˚C) and near surface (between the 1000-700mb pressure levels) wind magnitude (m s-1) change in the Caribbean basin from 1955-59 to 2000-04. Calculated from the NCEP Reanalysis 2.5˚ resolution data averaged at 02 and 14 LST, the two closest times in the 4-hourly data to the local overnight low and daytime high temperatures, during the 3-month Caribbean ERS (Comarazamy et al., 2011).
WHAT ARE THE REGIONAL, LOCAL, AND SOCIETAL IMPLICATIONS OF THESE CHANGES?
Guiding Questions
Drought Index in the Caribbean Region
Standardized Precipitation Index (SPI) It is a statistical tool defined to monitor drought at a given time scale and rainfall
station. This index can also be used to monitor periods of anomalous wet events.
3-month SPI: reflects short/medium moisture condition. In agriculture gives an indication of Soil Moisture condition at the growing season.
SPI Classification
> 2.0 Extremely wet
1.5 to 1.99 Very wet
1.0 to 1.49 Moderately wet
0 to 0.99 Mildly wet
0 to -0.99 Mild drought
-1 to -1.49 Moderate drought
-1.5 to -1.99 Severe drought
< -2.0 Extreme drought
Drought Index in the Caribbean Region SPI 3 month window size for June 1994 shows severe
to extreme drought in Dominican Republic and Puerto Rico.
Central America also have extreme drought, while the northern Caribbean region is mildly to moderate wet.
Long term drought index in Dominican Republic show periods of severe and extreme drought events.
Long term annual minimum SPI shows an increasing trend, which means slight drought reduction but still in the category of moderate to severe drought.
0.0215/year
1980 - 2014Extreme drought June 1994
CMAP coordinate 18.25oN, 71.25oW South East DOMINICAN REPUBLIC
Min
imum
Ann
ual S
PI
Mon
thly
SPI
Extreme drought Nov 2009
Heat Index – a measure of heat-stress danger
From 1948 to 1990, Dominican Republic shows a HI increasing trend of 0.059oF per year.
Dominican Republic’s heat index indicates a fast increasing trend from the year 1990 to 2014 (0.195 oF/year).
Long-term HI trend and moving average also shows the HI increasing tendency.
0.059oF/year
0.1915oF/year
Max
imum
Mon
thly
NCEP coordinate 17.5oN, 70oW South West DOMINICAN REPUBLIC
1948 - 2014
safe caution high caution
Impacts of Climate Change in Energy Infrastructurein Tropical Coastal Regions
• Energy per capita required– Energy activity is linked to climate change
in several ways. – There is a direct relationship between the
energy required for air conditioning systems and the environmental surface air temperature and humidity conditions.
Impacts of Climate Change in Energy Infrastructure in Tropical Coastal Regions
Total Energy Consumption for Dominican Republic (1980-2013)
HVAC for Dominican Republic (1980-2013)
The HVAC is the required to reduce the temperature and humidity to comfort levels.
HVAC is increasing at a rate 0.24GW per year, which correspond with the long-term increasing trend of the real total electric consumption per capita.
NCEP coordinate 17.5oN, 70oW South West DOMINICAN REPUBLIC The world bank data
What are the potential consequential effects of the observed Caribbean climate changes in local ecosystems?
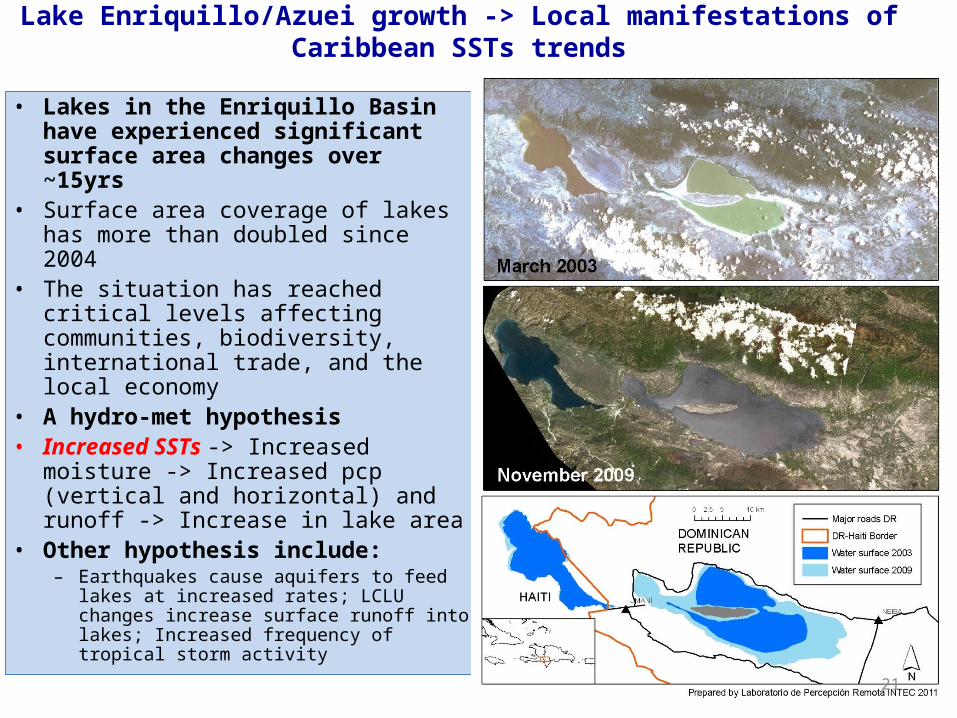
Lakes Enriquillo & Azuei Growth
"El agua se lo llevó todo": el misterio de los lagos crecientes del Caribe. BBC-Espanol, 1/16.2014
Rising Tide Is a Mystery That Sinks Island Hopes – by New York Times – Jan. 11, 2014
• Lakes in the Enriquillo Basin have experienced significant surface area changes over ~15yrs
• Surface area coverage of lakes has more than doubled since 2004
• The situation has reached critical levels affecting communities, biodiversity, international trade, and the local economy
• A hydro-met hypothesis• Increased SSTs -> Increased moisture -
> Increased pcp (vertical and horizontal) and runoff -> Increase in lake area
• Other hypothesis include:– Earthquakes cause aquifers to feed lakes at
increased rates; LCLU changes increase surface runoff into lakes; Increased frequency of tropical storm activity
Lake Enriquillo/Azuei growth -> Local manifestations of Caribbean SSTs trends
21
Lake Enriquillo/Azuei Area Increase 2000 - 2015
Lakes Area Changes as Observed from Satellites
23
Lakes Area Changes & Precipitation (through July 2015)
24
Ground Observations (Barahona/NCDC)
25
Why is the Surface Area of the Lakes Changing Dramatically?A Hydro-Meteorology Hypothesis
• Increased moisture in the lake area due to increased SSTs surrounding the lake basin• Increasing fresh water production in the area due to increased horizontal rain produced mainly
by orographic cloud formation in the surrounding cloud montane forestsA combination of these factors is leading to Total Lake Surface Area increase
Increase in orographic water production
Reduction in evaporation
Increase in Lake surface area
Lakes Enriquillo & Azuei Growth
Increased precipitation
Evaporation increase over the sea
Precipitation increase
Increase of fresh water production
Runoff increase
Lake evaporation decrease
Lake level rise
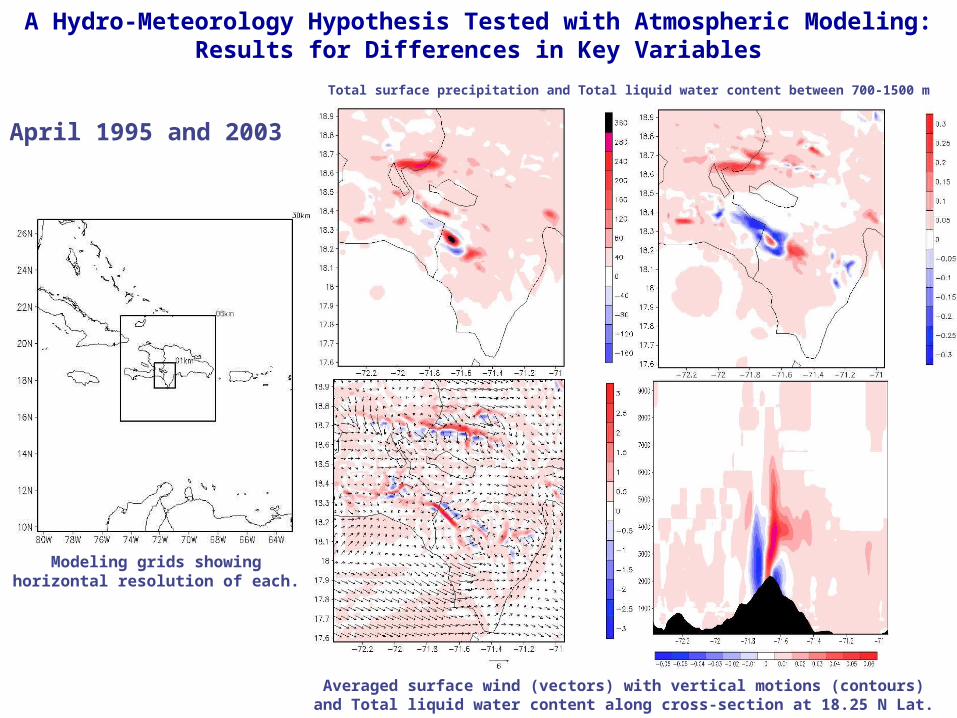
Total surface precipitation and Total liquid water content between 700-1500 m
Averaged surface wind (vectors) with vertical motions (contours) and Total liquid water content along cross-section at 18.25 N Lat.
Modeling grids showing horizontal resolution of each.
April 1995 and 2003
A Hydro-Meteorology Hypothesis Tested with Atmospheric Modeling:Results for Differences in Key Variables
Total surface precipitation and Total liquid water content between 700-1500 m
Averaged surface wind (vectors) with vertical motions (contours) and Total liquid water content along cross-section at 18.25 N Lat.
Modeling grids showing horizontal resolution of each.
April 2003 and 2012
A Hydro-Meteorology Hypothesis Tested with Atmospheric Modeling:Results for Differences in Key Variables