| 23.Jun.2015 Prof. Dr. Andreas Fischlin Climate Change and Ecosystem Services in a Changing Climate Andreas Fischlin First coordinating lead author (CLA) IPCC SAR, AR4, Review Editor (RE) IPCC TAR, AR5, Reviewer of IPCC SAR, TAR, AR4, AR5, SR LULUCF and lead author (LA) GPG LULUCF Co-faclitator of industrialized countries of the «Structured Expert Dialogue» and member of Swiss delegation for climate negotiations (UNFCCC) ETH Zurich, D-USYS, IBP, Head of Terrestrial Systems Ecology Department of Environmental Systems Science, Terrestrial Systems Ecology, IBP
Transcript
| 23.Jun.2015Prof. Dr. Andreas Fischlin
Climate Change and Ecosystem Services in a Changing ClimateAndreas Fischlin
First coordinating lead author (CLA) IPCC SAR, AR4, Review Editor (RE) IPCC TAR, AR5, Reviewer of IPCC SAR, TAR, AR4, AR5, SR LULUCF and lead author (LA) GPG LULUCF Co-faclitator of industrialized countries of the «Structured Expert Dialogue» and member of Swiss delegation for climate negotiations (UNFCCC) ETH Zurich, D-USYS, IBP, Head of Terrestrial Systems Ecology
Department of Environmental Systems Science, Terrestrial Systems Ecology, IBP
Please take home:
• The physical science basis is very robust • Human caused warming is clear • Risks can be managed via mitigation and
up to some limits via adaptation • Unless emissions are radically and soon
reduced, warming will impact soon some ecosystems significantly, e.g. coral reefs or NH sea ice biome
• Unmitigated climate change as currently projected will exceed the adaptive capacities of most ecosystems and thus would come with most severe impacts on their structure, functioning, and services
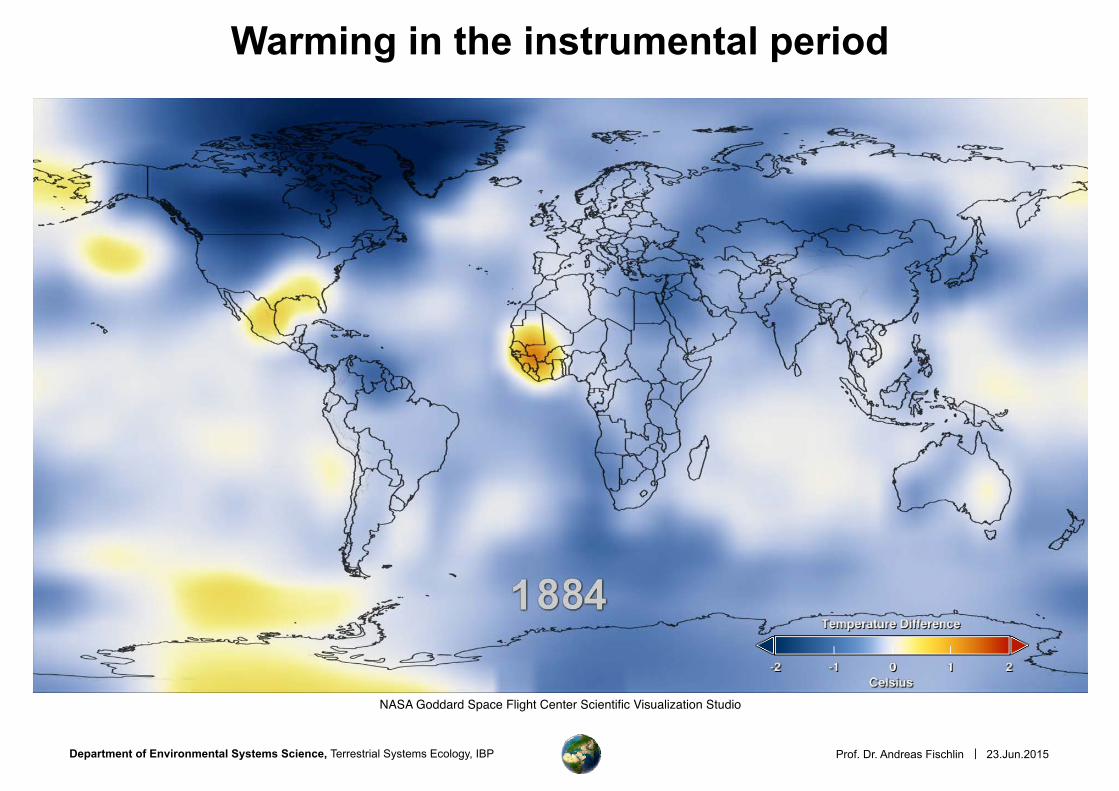
NASA Goddard Space Flight Center Scientific Visualization Studio
Warming in the instrumental period
Department of Environmental Systems Science, Terrestrial Systems Ecology, IBP Prof. Dr. Andreas Fischlin
| 23.Jun.2015
Warming in the instrumental period
Department of Environmental Systems Science, Terrestrial Systems Ecology, IBP Prof. Dr. Andreas Fischlin
NASA Goddard Space Flight Center Scientific Visualization Studio
|Department of Environmental Systems Science, Terrestrial Systems Ecology, IBP 23.Jun.2015Prof. Dr. Andreas Fischlin
+0.85°C
Summary for Policymakers in the contribution of Working Group I to the Fifth Assessment Report of the Intergovernmental Panel on Climate Change, figure SPM.1(b)
Warming of climate system is unequivocal
Clear warming
trend
Each of the last three decades has been successively warmer at the Earth’s surface than any preceding decade since 1850. !!In the Northern Hemisphere, 1983–2012 was likely the warmest 30-year period of the last 1400 years (medium confidence).
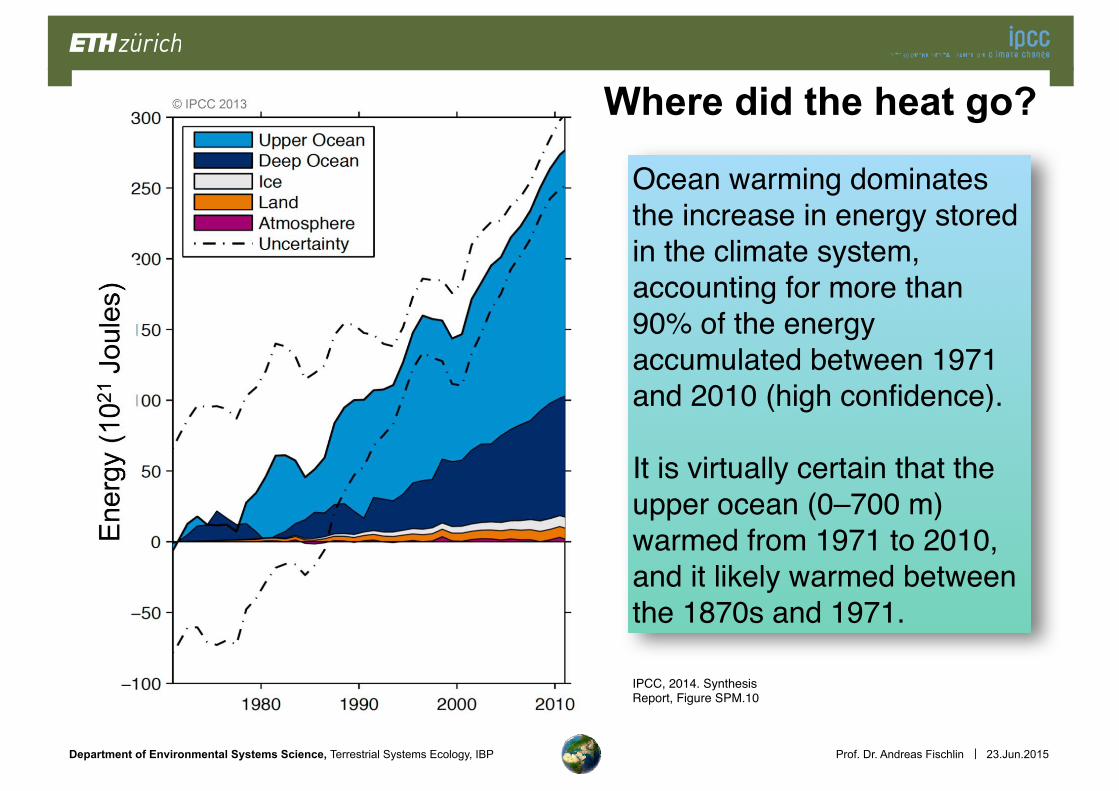
Where did the heat go?
|Department of Environmental Systems Science, Terrestrial Systems Ecology, IBP 23.Jun.2015Prof. Dr. Andreas Fischlin
IPCC, 2014. Synthesis Report, Figure SPM.10
Ocean warming dominates the increase in energy stored in the climate system, accounting for more than 90% of the energy accumulated between 1971 and 2010 (high confidence).!It is virtually certain that the upper ocean (0–700 m) warmed from 1971 to 2010, and it likely warmed between the 1870s and 1971.
|Department of Environmental Systems Science, Terrestrial Systems Ecology, IBP 23.Jun.2015Prof. Dr. Andreas Fischlin
WMO 2015, kombinierte Daten aus NOAA-NASA-UK Datensätzen
14 of last 15 years are the
warmest measured
Only exception:
2000
(a La Niña year)
El Niño year ~ warmer as average!La Niña year ~ cooler as average
The last 15 years (alleged “hiatus”)
|Department of Environmental Systems Science, Terrestrial Systems Ecology, IBP 23.Jun.2015Prof. Dr. Andreas Fischlin
WMO, 2014. The state of greenhouse gases in the atmosphere based on global observations through 2013
Ocean show clear trends of acidification
The ocean has absorbed about 30% of the emitted anthropogenic carbon dioxide, causing ocean acidification.
|Department of Environmental Systems Science, Terrestrial Systems Ecology, IBP 23.Jun.2015Prof. Dr. Andreas Fischlin
Some extreme events have become more frequent Ex.: Summer Temperatures in Europe
Freq
uenc
ies
%
Temperature anomalies °C Barriopedro et al., 2011. Science
Attribution
|Department of Environmental Systems Science, Terrestrial Systems Ecology, IBP 23.Jun.2015Prof. Dr. Andreas Fischlin
Globally averaged greenhouse gas concentrations
Atmospheric concentrations of CO2, CH4, and N2O have increased to levels unprecedented in at least the last 800,000 years. Carbon dioxide concentrations have increased by 40% since pre-industrial times, primarily from fossil fuel emissions and secondarily from net land use change emissions. !!The ocean has absorbed about 30% of the emitted anthropogenic carbon dioxide, causing ocean acidification.
|Department of Environmental Systems Science, Terrestrial Systems Ecology, IBP 23.Jun.2015Prof. Dr. Andreas Fischlin
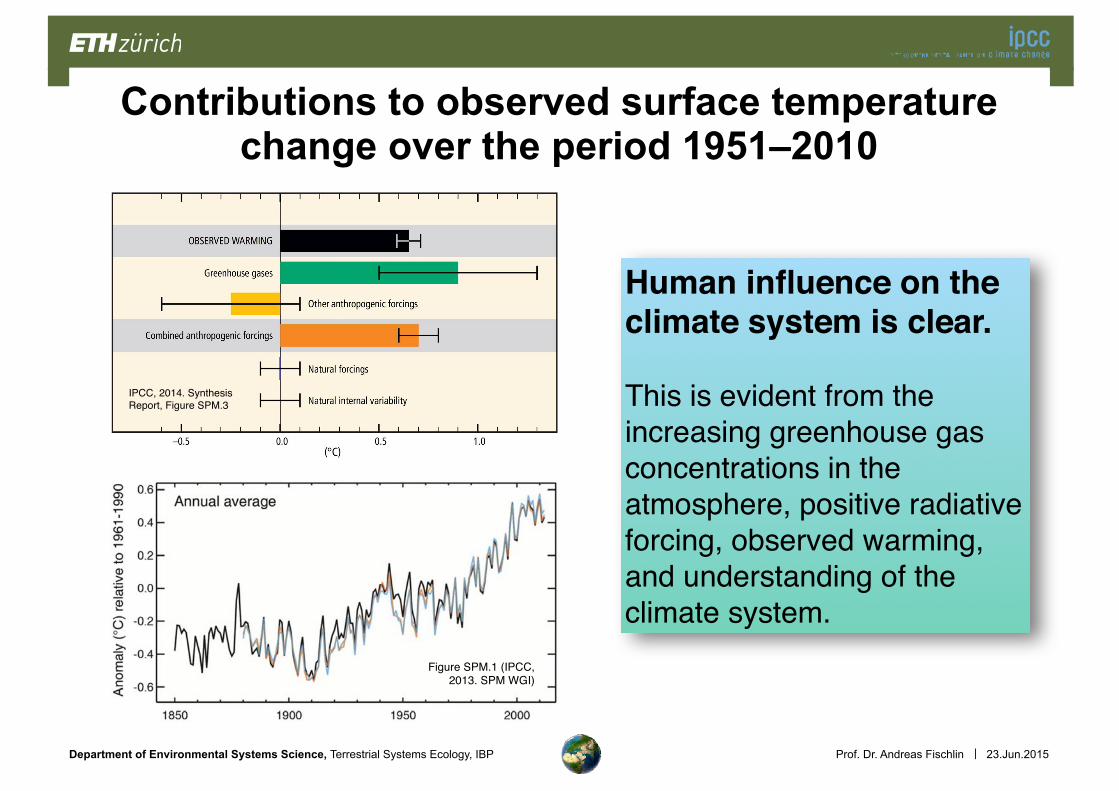
Contributions to observed surface temperature change over the period 1951–2010
IPCC, 2014. Synthesis Report, Figure SPM.3
|Department of Environmental Systems Science, Terrestrial Systems Ecology, IBP 23.Jun.2015Prof. Dr. Andreas Fischlin
Contributions to observed surface temperature change over the period 1951–2010
IPCC, 2014. Synthesis Report, Figure SPM.3
Human influence on the climate system is clear. This is evident from the increasing greenhouse gas concentrations in the atmosphere, positive radiative forcing, observed warming, and understanding of the climate system.
Figure SPM.1 (IPCC, 2013. SPM WGI)
|Department of Environmental Systems Science, Terrestrial Systems Ecology, IBP 23.Jun.2015Prof. Dr. Andreas Fischlin
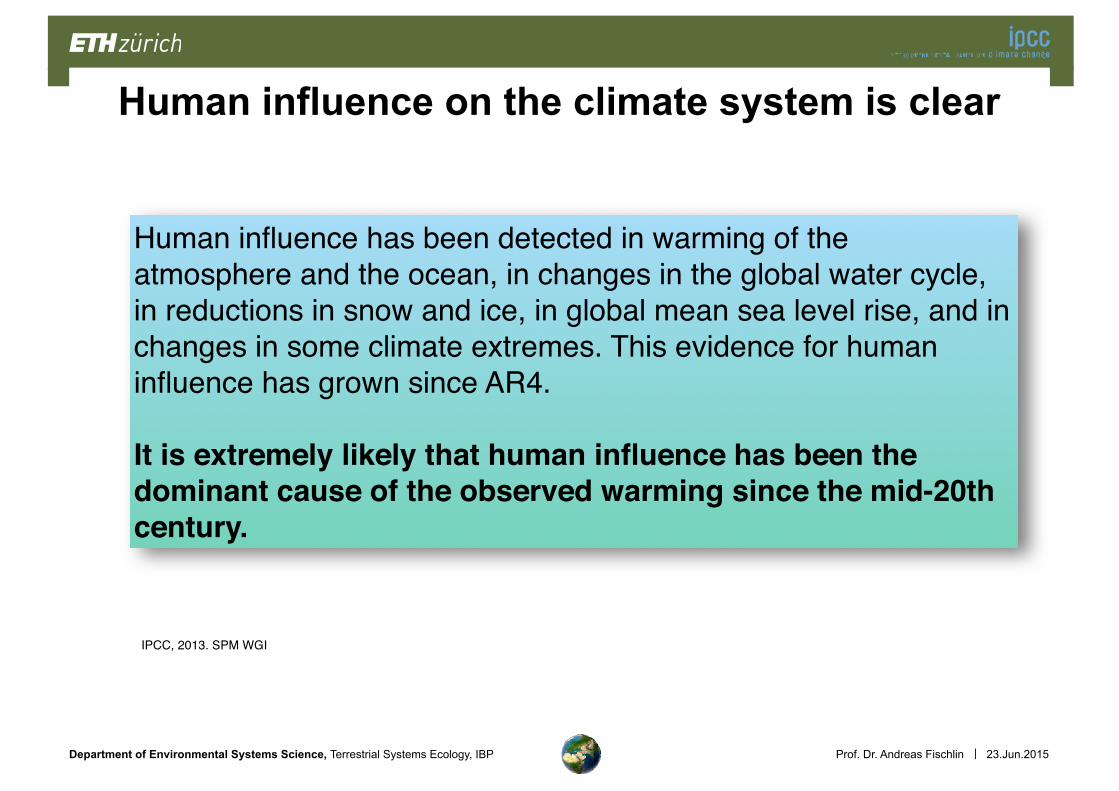
Human influence on the climate system is clear
IPCC, 2013. SPM WGI
Human influence has been detected in warming of the atmosphere and the ocean, in changes in the global water cycle, in reductions in snow and ice, in global mean sea level rise, and in changes in some climate extremes. This evidence for human influence has grown since AR4. !It is extremely likely that human influence has been the dominant cause of the observed warming since the mid-20th century.
Projections
|Department of Environmental Systems Science, Terrestrial Systems Ecology, IBP 23.Jun.2015Prof. Dr. Andreas Fischlin
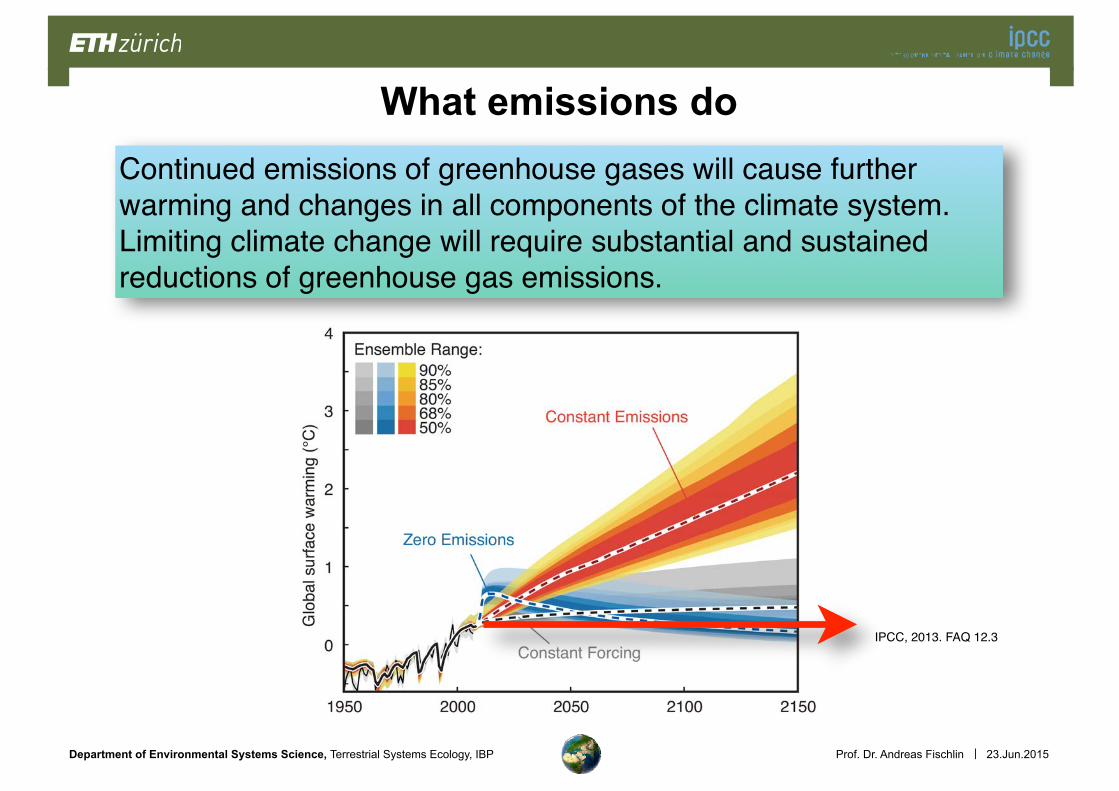
What emissions do
IPCC, 2013. FAQ 12.3
Continued emissions of greenhouse gases will cause further warming and changes in all components of the climate system. Limiting climate change will require substantial and sustained reductions of greenhouse gas emissions.
| 23.Jun.2015Department of Environmental Systems Science, Terrestrial Systems Ecology, IBP Prof. Dr. Andreas Fischlin
Figure 12.5: global annual mean surface air temperature anomalies (relative to 1986–2005) from CMIP5 concentration-driven (IPCC, 2013. AR5 WGI)
Unmitigated CC
Ambitiously mitigated CC
+8.3°C over pre-industrial levels
Future: Climate scenarios
|Department of Environmental Systems Science, Terrestrial Systems Ecology, IBP 23.Jun.2015Prof. Dr. Andreas Fischlin
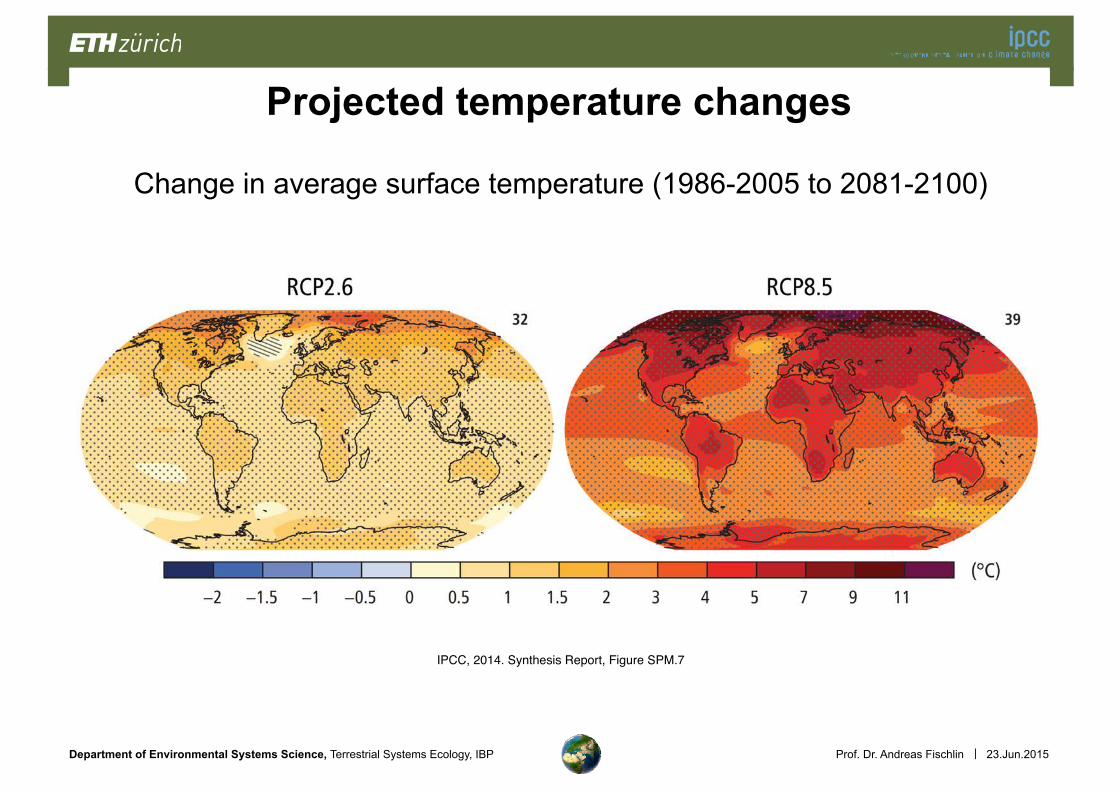
Projected temperature changes
IPCC, 2014. Synthesis Report, Figure SPM.7
Change in average surface temperature (1986-2005 to 2081-2100)
|Department of Environmental Systems Science, Terrestrial Systems Ecology, IBP 23.Jun.2015Prof. Dr. Andreas Fischlin
Projected precipitation changes
IPCC, 2014. Synthesis Report, Figure SPM.7
Change in average precipitation (1986-2005 to 2081-2100)
Implications
|Department of Environmental Systems Science, Terrestrial Systems Ecology, IBP 23.Jun.2015Prof. Dr. Andreas Fischlin
Arctic September sea ice extent
IPCC, 2013. WGI, Figure SPM.7
|Department of Environmental Systems Science, Terrestrial Systems Ecology, IBP 23.Jun.2015Prof. Dr. Andreas Fischlin
Global ocean surface pH
IPCC, 2013. WGI, Figure SPM.7
|Department of Environmental Systems Science, Terrestrial Systems Ecology, IBP 23.Jun.2015Prof. Dr. Andreas Fischlin
Global mean sea level rise
IPCC, 2013. WGI, Figure SPM.9
Part 2 - Ecosystem services in a changing climate
• On ecosystem services • Impacts framework • Managing the
risks
On ecosystem services
Ecosystems Services
|Department of Environmental Systems Science, Terrestrial Systems Ecology, IBP 23.Jun.2015Prof. Dr. Andreas Fischlin
|Department of Environmental Systems Science, Terrestrial Systems Ecology, IBP 23.Jun.2015Prof. Dr. Andreas Fischlin
Ecosystems Services
Supporting Services
Provisioning Regulating Cultural
90% to 300%
Ecosystems Services
Costanza et al., 1997. Nature, 387: 253-260
Trillions (=1012 =Tera) US $
16 33 54
Global GDP 1997
18
Impacts framework
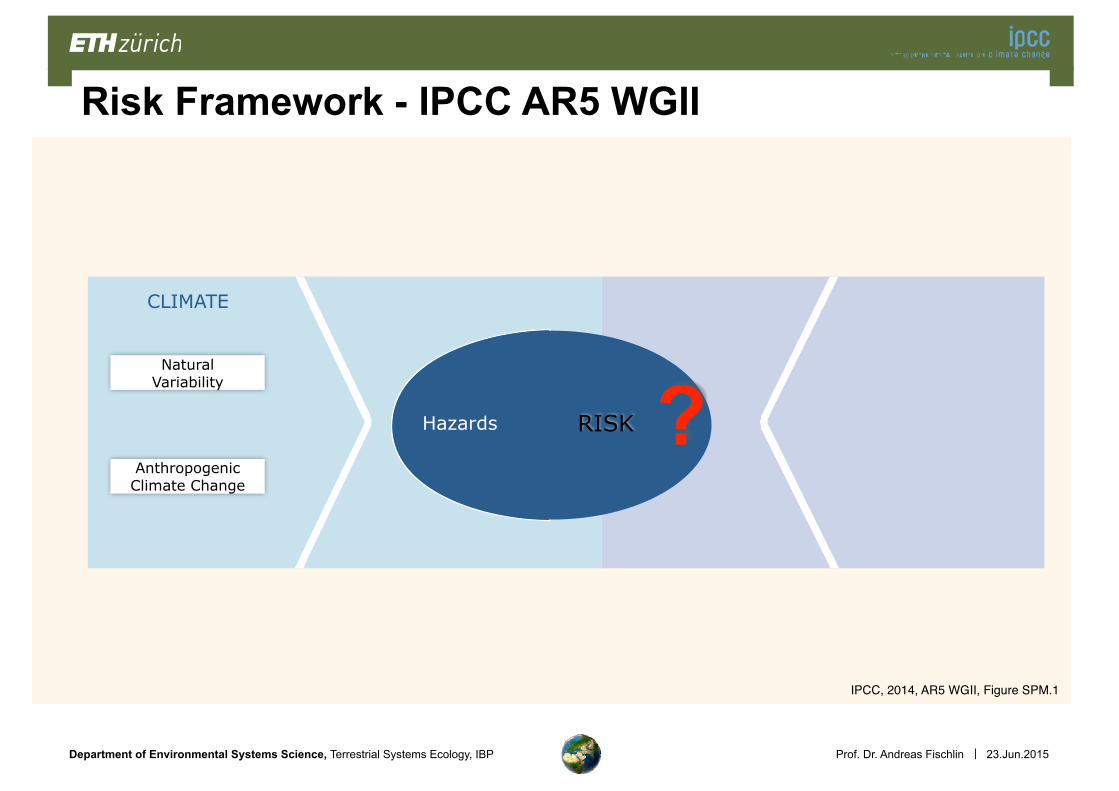
Risk Framework - IPCC AR5 WGII
|Department of Environmental Systems Science, Terrestrial Systems Ecology, IBP 23.Jun.2015Prof. Dr. Andreas Fischlin
CLIMATE
Hazards RISK ?Natural
Variability
AnthropogenicClimate Change
IPCC, 2014, AR5 WGII, Figure SPM.1
Risk Framework - IPCC AR5 WGII
|Department of Environmental Systems Science, Terrestrial Systems Ecology, IBP 23.Jun.2015Prof. Dr. Andreas Fischlin
CLIMATE
RISK
NaturalVariability
AnthropogenicClimate Change
Vulnerability
Hazards
IPCC, 2014, AR5 WGII, Figure SPM.1
Risk Framework - IPCC AR5 WGII
|Department of Environmental Systems Science, Terrestrial Systems Ecology, IBP 23.Jun.2015Prof. Dr. Andreas Fischlin
CLIMATE
NaturalVariability
AnthropogenicClimate Change
Exposure
Hazards
Vulnerability
IPCC, 2014, AR5 WGII, Figure SPM.1
Risk Framework - IPCC AR5 WGII
|Department of Environmental Systems Science, Terrestrial Systems Ecology, IBP 23.Jun.2015Prof. Dr. Andreas Fischlin
CLIMATE
NaturalVariability
AnthropogenicClimate Change
Vulnerability
Hazards
Exposure
RISK
IPCC, 2014, AR5 WGII, Figure SPM.1
Risk Framework - IPCC AR5 WGII
|Department of Environmental Systems Science, Terrestrial Systems Ecology, IBP 23.Jun.2015Prof. Dr. Andreas Fischlin
SOCIOECONOMICPROCESSES
SocioeconomicPathways
Adaptation and Mitigation Actions
Governance
CLIMATE
NaturalVariability
AnthropogenicClimate Change
IMPACTS
EMISSIONSand Land-use Change
Vulnerability
Exposure
Hazards RISK
IPCC, 2014, AR5 WGII, Figure SPM.1
Risk Framework - IPCC AR5 WGII
|Department of Environmental Systems Science, Terrestrial Systems Ecology, IBP 23.Jun.2015Prof. Dr. Andreas Fischlin
SOCIOECONOMICPROCESSES
SocioeconomicPathways
Adaptation and Mitigation Actions
Governance
CLIMATE
NaturalVariability
AnthropogenicClimate Change
EMISSIONSand Land-use Change
Vulnerability
Exposure
Hazards RISK
IPCC, 2014, AR5 WGII, Figure SPM.1
IMPACTS
|Department of Environmental Systems Science, Terrestrial Systems Ecology, IBP 23.Jun.2015Prof. Dr. Andreas Fischlin
Impacts and Adaptation
IPCC, 2014. Summary for Policy Makers AR5 WGII. Assessment Box SPM.2 Table 1 Europe, p. 22
|Department of Environmental Systems Science, Terrestrial Systems Ecology, IBP 23.Jun.2015Prof. Dr. Andreas Fischlin
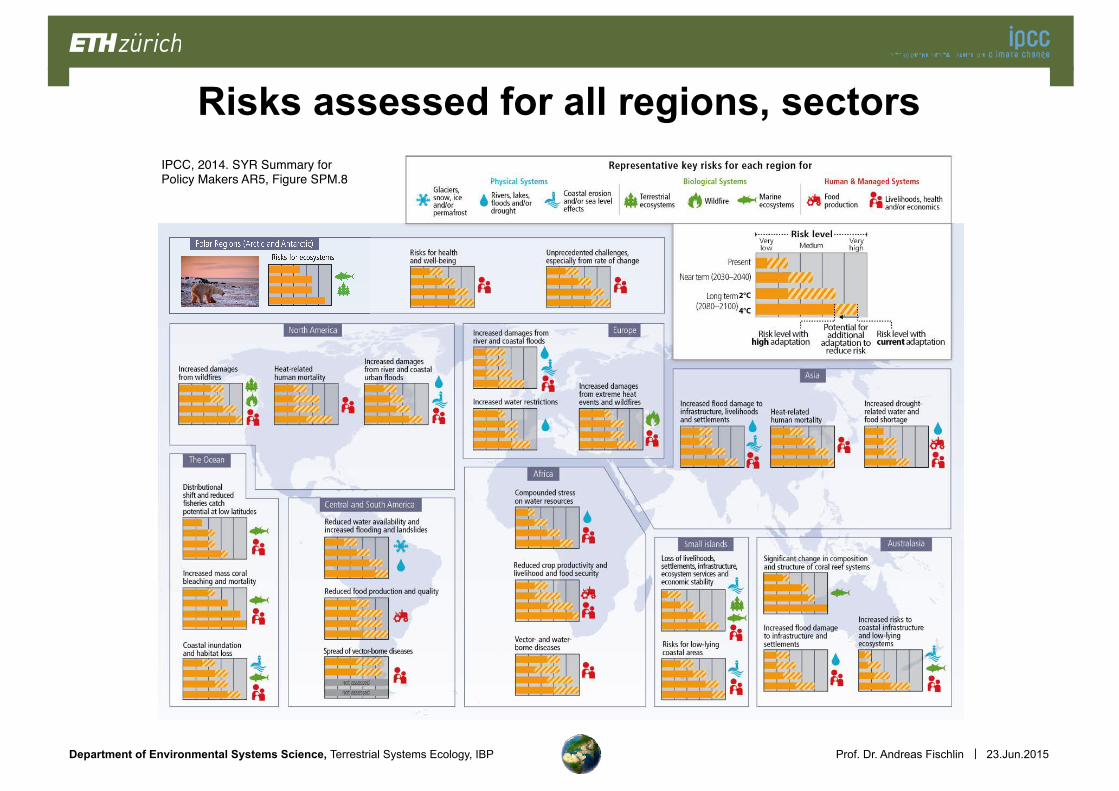
Risks assessed for all regions, sectorsIPCC, 2014. SYR Summary for Policy Makers AR5, Figure SPM.8
|Department of Environmental Systems Science, Terrestrial Systems Ecology, IBP 23.Jun.2015Prof. Dr. Andreas Fischlin
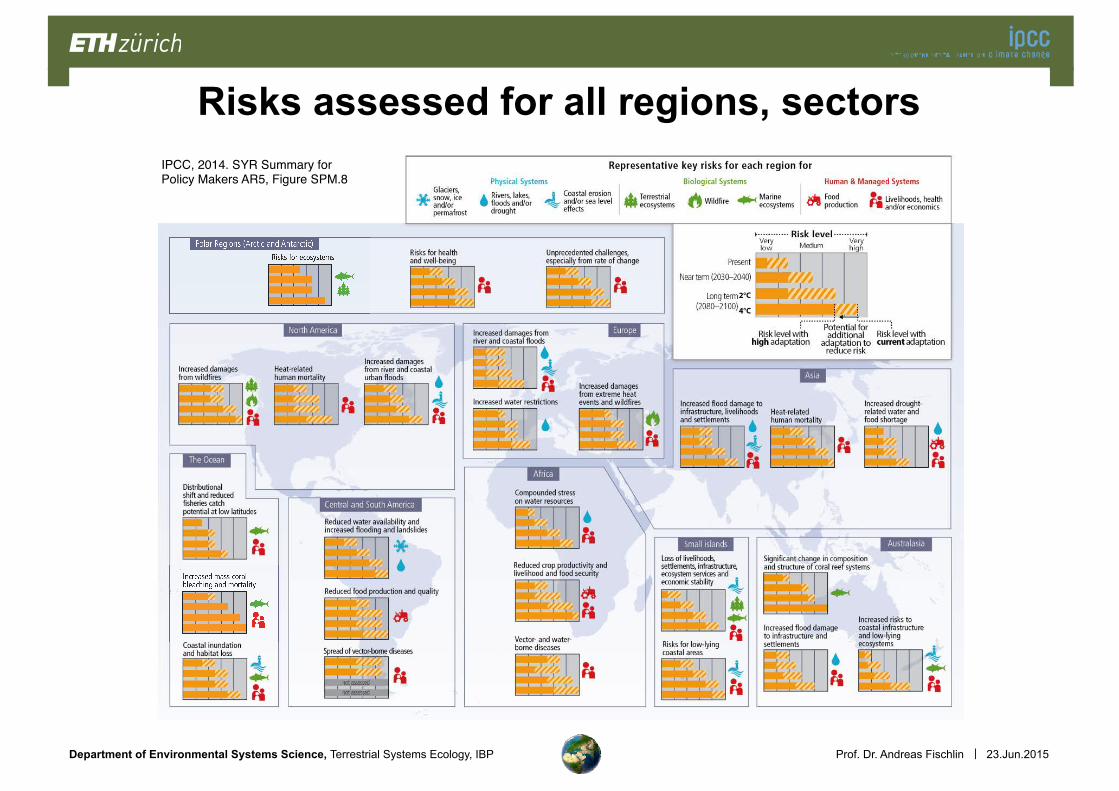
Risks assessed for all regions, sectorsIPCC, 2014. SYR Summary for Policy Makers AR5, Figure SPM.8
|Department of Environmental Systems Science, Terrestrial Systems Ecology, IBP 23.Jun.2015Prof. Dr. Andreas Fischlin
Risks assessed for all regions, sectorsIPCC, 2014. SYR Summary for Policy Makers AR5, Figure SPM.8
|Department of Environmental Systems Science, Terrestrial Systems Ecology, IBP 23.Jun.2015Prof. Dr. Andreas Fischlin
Risks assessed for all regions, sectorsIPCC, 2014. SYR Summary for Policy Makers AR5, Figure SPM.8
|Department of Environmental Systems Science, Terrestrial Systems Ecology, IBP 23.Jun.2015Prof. Dr. Andreas Fischlin
Risks assessed for all regions, sectorsIPCC, 2014. SYR Summary for Policy Makers AR5, Figure SPM.8
Most corals bleached
+1.7 °
+2°
Fischlin et al., 2007. IPCC WGII, Figure TS.6
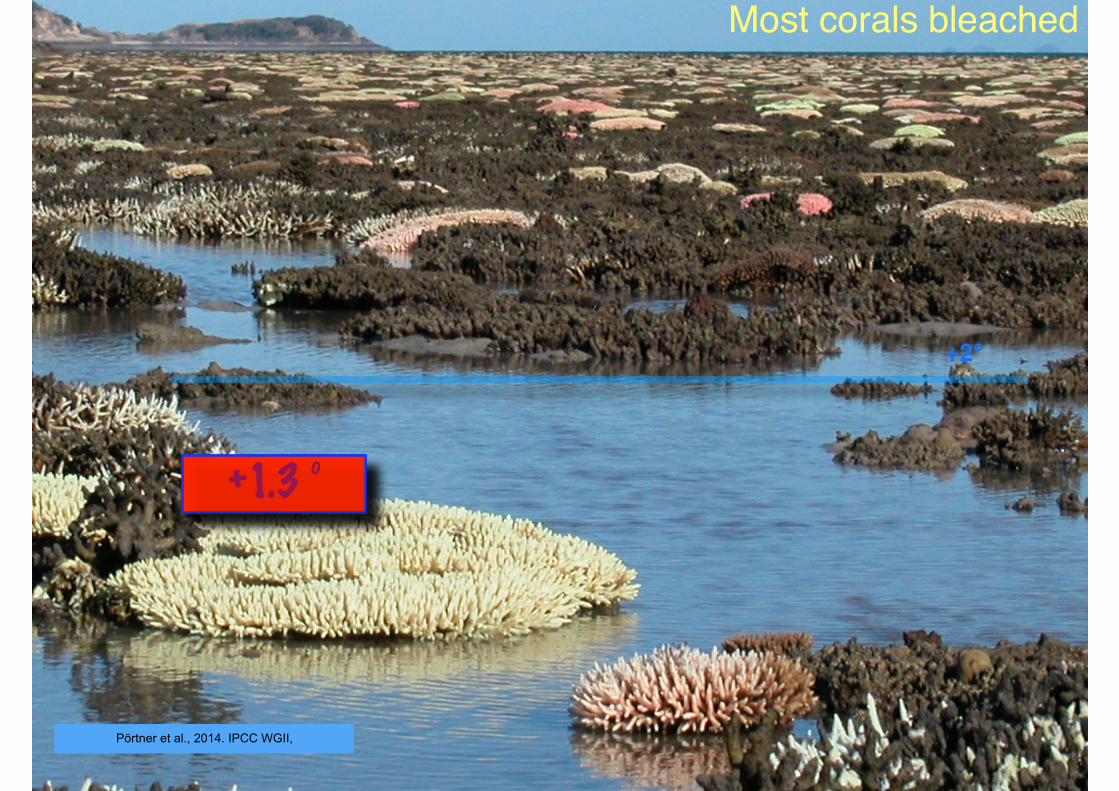
Most corals bleached
+2°
Pörtner et al., 2014. IPCC WGII,
+1.7 °+1.3 °
IPCC, 2014. WGII, Cross-chapter box compendium
|Department of Environmental Systems Science, Terrestrial Systems Ecology, IBP 23.Jun.2015Prof. Dr. Andreas Fischlin
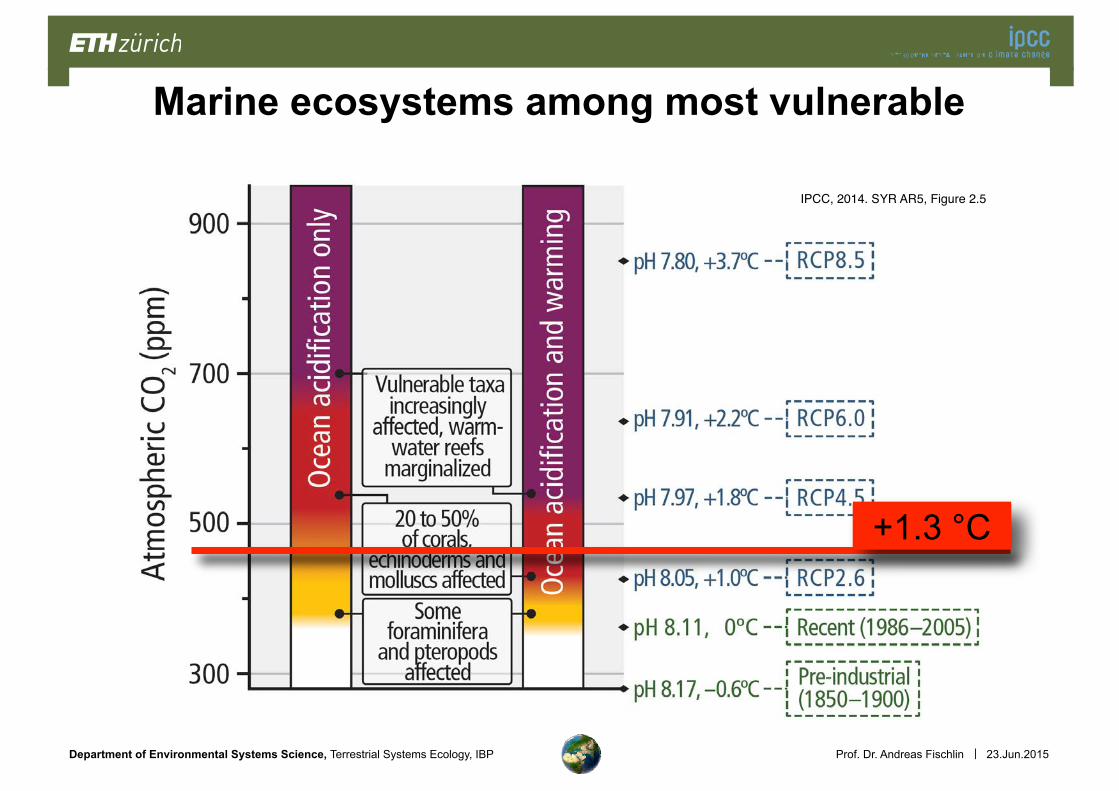
Marine ecosystems among most vulnerable
+1.7 °C
IPCC, 2014. SYR AR5, Figure 2.5
|Department of Environmental Systems Science, Terrestrial Systems Ecology, IBP 23.Jun.2015Prof. Dr. Andreas Fischlin
Marine ecosystems among most vulnerable
IPCC, 2014. SYR AR5, Figure 2.5
+1.7 °C+1.3 °C
|Department of Environmental Systems Science, Terrestrial Systems Ecology, IBP 23.Jun.2015Prof. Dr. Andreas Fischlin
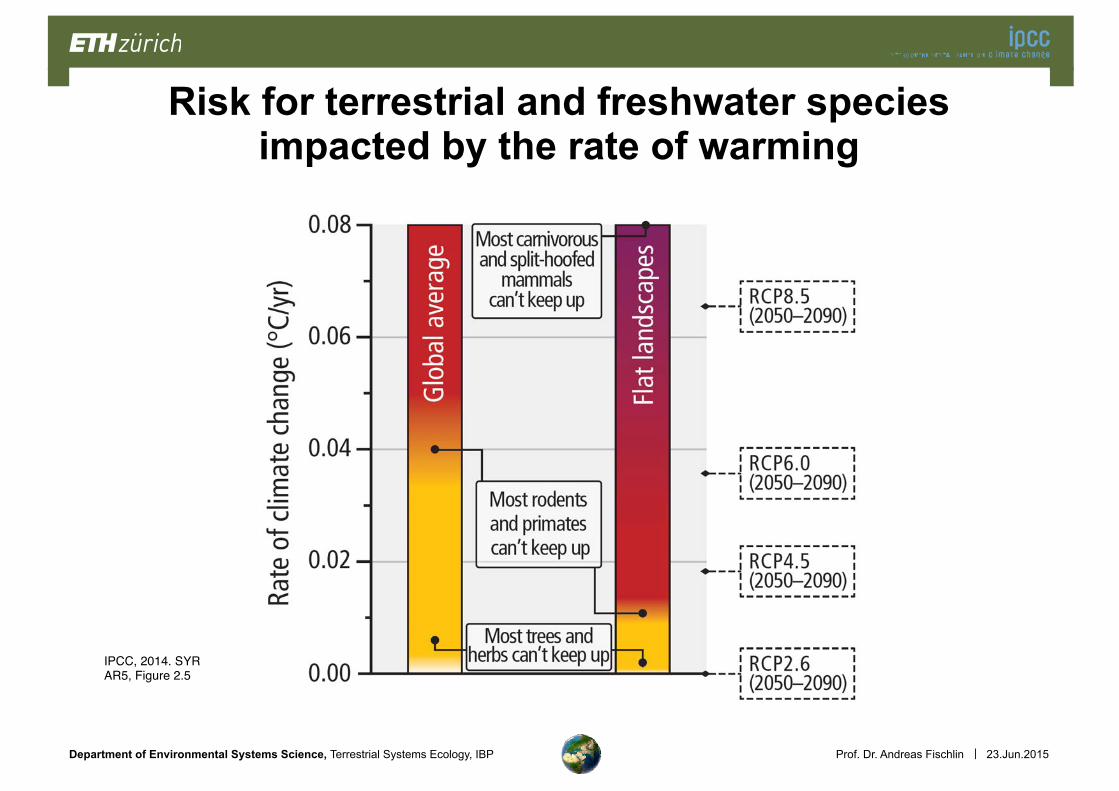
Risk for terrestrial and freshwater species impacted by the rate of warming
IPCC, 2014. SYR AR5, Figure 2.5
Managing the risks
| 23.Jun.2015Department of Environmental Systems Science, Terrestrial Systems Ecology, IBP Prof. Dr. Andreas Fischlin
Know-ledge!TAR!2001
Reasons of
Concern
Smith et al., 2009. PNAS u. Fischlin, 2009
Today
Dangerous Anthropogenic Interference (DAI) vs. global mean warming (°C)
| 23.Jun.2015Department of Environmental Systems Science, Terrestrial Systems Ecology, IBP Prof. Dr. Andreas Fischlin
Know-ledge!AR4!2007
Reasons of
Concern
Today
Smith et al., 2009. PNAS u. Fischlin, 2009
Dangerous Anthropogenic Interference (DAI) vs. global mean warming (°C)
| 23.Jun.2015Department of Environmental Systems Science, Terrestrial Systems Ecology, IBP Prof. Dr. Andreas Fischlin
Know-ledge!AR5!2014
Reasons of
Concern
Today
Smith et al., 2009. PNAS u. Fischlin, 2009
Dangerous Anthropogenic Interference (DAI) vs. global mean warming (°C)
| 23.Jun.2015Department of Environmental Systems Science, Terrestrial Systems Ecology, IBP Prof. Dr. Andreas Fischlin
Know-ledge!AR5!2014
Reasons of
Concern
Today
Smith et al., 2009. PNAS u. Fischlin, 2009
Dangerous Anthropogenic Interference (DAI) vs. global mean warming (°C)
1.5°C
| 23.Jun.2015
2
(A) (B)
(C)-‐40% to -‐70%
by 2050meaningAfter IPCC, 2014.
Synthesis Report, Figure SPM.10
Mitigation
Department of Environmental Systems Science, Terrestrial Systems Ecology, IBP Prof. Dr. Andreas Fischlin
and zero GHG emissions by the end of the
century
Fischlin et al., 2015. SED Report Figure 9
|Department of Environmental Systems Science, Terrestrial Systems Ecology, IBP 23.Jun.2015Prof. Dr. Andreas Fischlin
However, current emission trends
Total annual anthropogenic greenhouse gas emissions by groups of gases, 1970–2010
After IPCC, 2014. Synthesis Report, Figure SPM.2
|Department of Environmental Systems Science, Terrestrial Systems Ecology, IBP 23.Jun.2015Prof. Dr. Andreas Fischlin
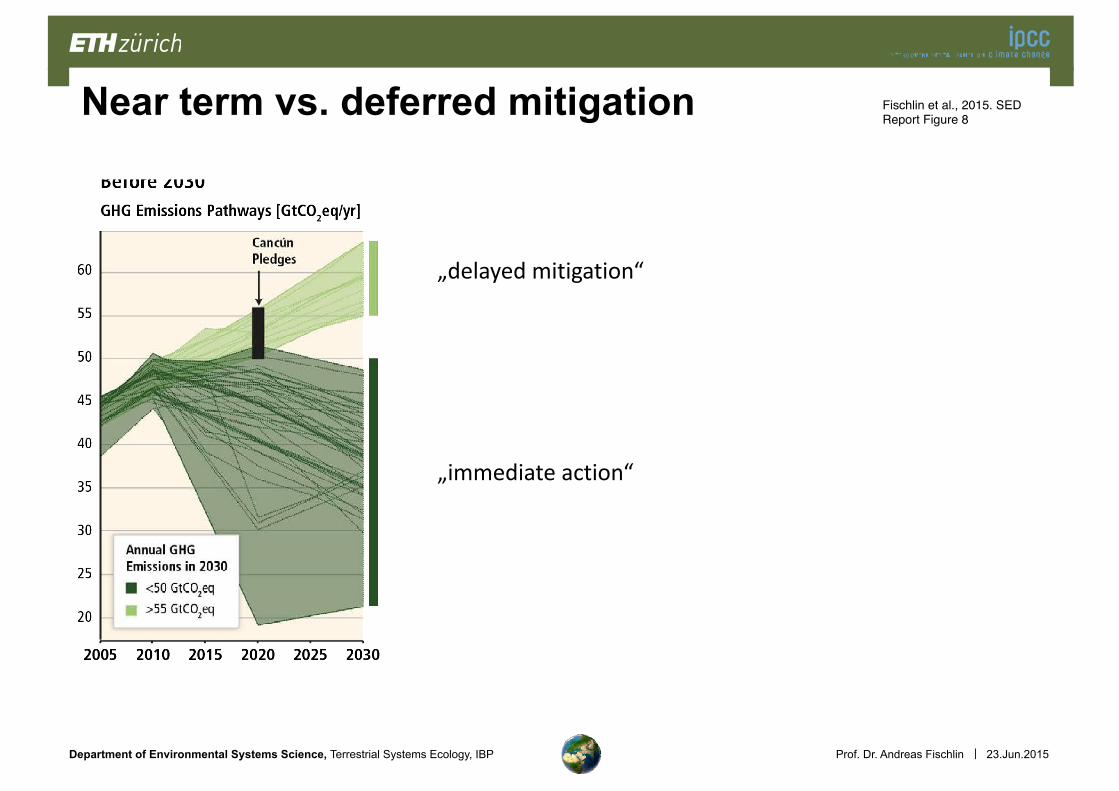
Near term vs. deferred mitigation
„immediate action“
Fischlin et al., 2015. SED Report Figure 8
|Department of Environmental Systems Science, Terrestrial Systems Ecology, IBP 23.Jun.2015Prof. Dr. Andreas Fischlin
Near term vs. deferred mitigation Fischlin et al., 2015. SED Report Figure 8
|Department of Environmental Systems Science, Terrestrial Systems Ecology, IBP 23.Jun.2015Prof. Dr. Andreas Fischlin
Near term vs. deferred mitigation Fischlin et al., 2015. SED Report Figure 8
|Department of Environmental Systems Science, Terrestrial Systems Ecology, IBP 23.Jun.2015Prof. Dr. Andreas Fischlin
„immediate action“
„delayed mitigation“
Near term vs. deferred mitigation Fischlin et al., 2015. SED Report Figure 8
|Department of Environmental Systems Science, Terrestrial Systems Ecology, IBP 23.Jun.2015Prof. Dr. Andreas Fischlin
Near term vs. deferred mitigation Fischlin et al., 2015. SED Report Figure 8
| 23.Jun.2015
und ...
Department of Environmental Systems Science, Terrestrial Systems Ecology, IBP Prof. Dr. Andreas Fischlin
Fitz Simmons - www.cagle.com
It isn’t hell or high water, it is now
both!
|Department of Environmental Systems Science, Terrestrial Systems Ecology, IBP 23.Jun.2015Prof. Dr. Andreas Fischlin
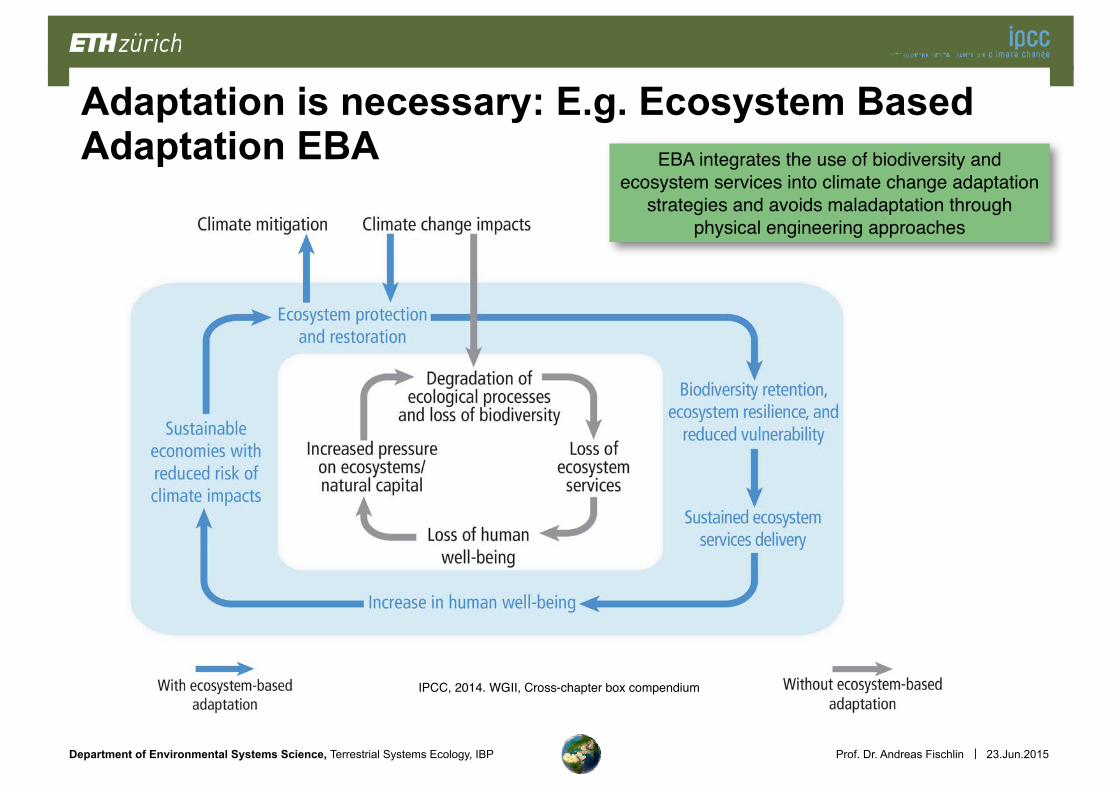
Adaptation is necessary: E.g. Ecosystem Based Adaptation EBA
IPCC, 2014. WGII, Cross-chapter box compendium
EBA integrates the use of biodiversity and ecosystem services into climate change adaptation
strategies and avoids maladaptation through physical engineering approaches
| 23.Jun.2015
and ...
Department of Environmental Systems Science, Terrestrial Systems Ecology, IBP Prof. Dr. Andreas FischlinJoel Pett
Please take home:
• The physical science basis is very robust • Human caused warming is clear • Risks can be managed via mitigation and
up to some limits via adaptation • Unless emissions are radically and soon
reduced, warming will impact soon some ecosystems significantly, e.g. coral reefs or NH sea ice biome
• Unmitigated climate change as currently projected will exceed the adaptive capacities of most ecosystems and thus would come with most severe impacts on their structure, functioning, and services