1 23 Climatic Change An Interdisciplinary, International Journal Devoted to the Description, Causes and Implications of Climatic Change ISSN 0165-0009 Climatic Change DOI 10.1007/s10584-013-0989-8 Climate change response in Europe: what’s the reality? Analysis of adaptation and mitigation plans from 200 urban areas in 11 countries D. Reckien, J. Flacke, R. J. Dawson, O. Heidrich, M. Olazabal, A. Foley, J. J.- P. Hamann, H. Orru, M. Salvia, S. De Gregorio Hurtado, et al.
Transcript
1 23
Climatic ChangeAn Interdisciplinary, InternationalJournal Devoted to the Description,Causes and Implications of ClimaticChange ISSN 0165-0009 Climatic ChangeDOI 10.1007/s10584-013-0989-8
Climate change response in Europe: what’sthe reality? Analysis of adaptation andmitigation plans from 200 urban areas in11 countries
D. Reckien, J. Flacke, R. J. Dawson,O. Heidrich, M. Olazabal, A. Foley, J. J.-P. Hamann, H. Orru, M. Salvia, S. DeGregorio Hurtado, et al.
1 23
Your article is protected by copyright and all
rights are held exclusively by Springer Science
+Business Media Dordrecht. This e-offprint
is for personal use only and shall not be self-
archived in electronic repositories. If you wish
to self-archive your article, please use the
accepted manuscript version for posting on
your own website. You may further deposit
the accepted manuscript version in any
repository, provided it is only made publicly
available 12 months after official publication
or later and provided acknowledgement is
given to the original source of publication
and a link is inserted to the published article
on Springer's website. The link must be
accompanied by the following text: "The final
publication is available at link.springer.com”.
LETTER
Climate change response in Europe: what’s the reality?Analysis of adaptation and mitigation plans from 200urban areas in 11 countries
D. Reckien & J. Flacke & R. J. Dawson & O. Heidrich &
M. Olazabal & A. Foley & J. J.-P. Hamann & H. Orru &
M. Salvia & S. De Gregorio Hurtado & D. Geneletti &F. Pietrapertosa
Received: 19 June 2013 /Accepted: 15 October 2013# Springer Science+Business Media Dordrecht 2013
Abstract Urban areas are pivotal to global adaptation and mitigation efforts. But how docities actually perform in terms of climate change response? This study sheds light on the stateof urban climate change adaptation and mitigation planning across Europe. Europe is anexcellent test case given its advanced environmental policies and high urbanization. Weperformed a detailed analysis of 200 large and medium-sized cities across 11 Europeancountries and analysed the cities’ climate change adaptation and mitigation plans. We
Climatic ChangeDOI 10.1007/s10584-013-0989-8
Electronic supplementary material The online version of this article (doi:10.1007/s10584-013-0989-8)contains supplementary material, which is available to authorized users.
D. Reckien (*)Center for Research on Environmental Decisions, Columbia University, 406 Schermerhorn Hall–MC5501,1190 Amsterdam Ave, New York, NY 10027, USAe-mail: [email protected]
J. FlackeFaculty of Geo-Information Science and Earth Observation (ITC), University of Twente, PO Box 217, 7500AE Enschede, The Netherlands
R. J. Dawson : O. HeidrichSchool of Civil Engineering and Geosciences, Newcastle University, Cassie Building, Newcastle uponTyne NE1 7RU, UK
M. OlazabalBasque Centre for Climate Change (BC3), Alameda de Urquijo 4, 48008 Bilbao, Spain
M. OlazabalDepartment of Land Economy, University of Cambridge, 19 Silver Street, Cambridge CB3 9EP, UK
A. FoleySchool of Mechanical and Aerospace Engineering, Queen’s University Belfast, Ashby Building, StranmillisRoad, Belfast BT9 5AH, UK
A. FoleySchool of Engineering, University College Cork, College Road, Cork, Ireland
investigate the regional distribution of plans, adaptation and mitigation foci and the extent towhich planned greenhouse gas (GHG) reductions contribute to national and internationalclimate objectives. To our knowledge, it is the first study of its kind as it does not rely onself-assessment (questionnaires or social surveys). Our results show that 35 % of Europeancities studied have no dedicated mitigation plan and 72 % have no adaptation plan. No city hasan adaptation plan without a mitigation plan. One quarter of the cities have both an adaptationand a mitigation plan and set quantitative GHG reduction targets, but those vary extensively inscope and ambition. Furthermore, we show that if the planned actions within cities arenationally representative the 11 countries investigated would achieve a 37 % reduction inGHG emissions by 2050, translating into a 27 % reduction in GHG emissions for the EU as awhole. However, the actions would often be insufficient to reach national targets and fall shortof the 80 % reduction in GHG emissions recommended to avoid global mean temperaturerising by 2 °C above pre-industrial levels.
Cities1 are responsible for 31–80 % of global greenhouse gas emissions (Duren and Miller2012; Satterthwaite 2008) and they are particularly vulnerable to climate hazards due to theirhigh density of people, assets, and infrastructure (Hunt and Watkiss 2011; de Sherbinin et al.2007; Dawson 2007; Butler and Spencer 2010). Cities are also unencumbered by thecomplicated international negotiations that hamper climate change action at the internationallevel (Kousky and Schneider 2003). Thus, cities may prove pivotal for both mitigation of andadaptation to global climate change (Rosenzweig et al. 2010, 2011; Betsill and Bulkeley2007). But how do cities actually perform in terms of climate change response? Existinganalyses of urban climate change responses typically focus on large and prominent cities, suchas London, New York or Mexico City, or groups of the world’s megacities, e.g. the C402
1 The terms ‘city’ and ‘urban area’ are used interchangeably, though definition might vary across countries. Weuse data from the Urban Audit, which also refers to “cities” (Eurostat 2013).2 The C40 Cities Climate Leadership Group (C40) is a network of the world’s megacities committed toaddressing climate change through action to reduce greenhouse gas emissions.
J. J.<P. HamannCentre International de Recherche sur l’Environnement et le Développement (CIRED), Campus du JardinTropical, 45 bis, Avenue de la Belle Gabrielle, 94736 Nogent-sur-Marne Cedex, France
H. OrruDepartment of Public Health, University of Tartu, Ravila 19, 50411 Tartu, Estonia
H. OrruDepartment of Public Health and Clinical Medicine, Umea University, 901 85 Umeå, Sweden
M. Salvia : F. PietrapertosaInstitute of Methodologies for Environmental Analysis–National Research Council of Italy (CNR-IMAA),C.da S.Loja, 85050 Tito Scalo, PZ, Italy
S. De Gregorio HurtadoMinisterio de Fomento, Centro de Estudios y Experimentación de Obras Públicas (CEDEX), C/Alfonso XII3 y 5, 28014 Madrid, Spain
D. GenelettiDepartment of Civil, Environmental and Mechanical Engineering, University of Trento, Via Mesiano 77,38123 Trento, Italy
Climatic Change
Author's personal copy
(Castán Broto and Bulkeley 2012; Romero–Lankao 2012; Carbon Disclosure Project 2012;Johnson 2013). Furthermore, many studies rely exclusively on self-report measures such asquestionnaires and interviewing of city representatives (Carbon Disclosure Project 2012;Carmin et al. 2012), which might incorporate bias. Evidently, a less subjective assessmentand more representative selection of urban areas is needed to more accurately characterise theclimate change response of cities.
We explore the state of urban climate change response in Europe by way of an objectiveempirical analysis of 200 large- as well as medium-sized European cities (Fig. 1;Supplementary Table S1), which are part of the Urban Audit (UA). The UA cities wereselected by the European Commission, Eurostat and the national statistical offices based on thefollowing criteria (Eurostat 2010): (i) approximately 20 % of the population is covered inevery country; (ii) national capitals and, where possible, regional capitals are included; (iii)large (more than 250,000 people) and medium-sized urban areas (minimum 50,000 andmaximum 250,000 population) are to be included; and (iv) urban areas should begeographically dispersed within countries. The UA cities are therefore a balanced andregionally representative sample of cities from each country covered and so is our sample of200 cities. We analyse all UA cities (200 in total) of the 11 European countries where authorshave worked and are familiar with the language and respective urban and climate policies. Theentire UA database comprises 358 cities across 30 pan-European countries (Eurostat 2013).The 11 countries chosen cover 72.1 % of the EU-27 population and the 200 cities represent16.8 % of all EU-27 inhabitants (2008).
The analysis provides insights to a range of pertinent questions in urban climatechange studies referring to 1) the regional distribution of urban adaptation and mitigationplans across Europe, 2) the breadth and foci of their thematic content, as well as 3) theextent of proposed urban emission reduction efforts and their cumulative contribution tonational and international reduction targets. We gathered urban climate change responsesin the form of strategic policy and planning documents, i.e. approved (by the relevantmunicipal authority) and/or published urban climate change adaptation and climate changemitigation plans. Adaptation plans incorporate actions that lead to the abatement orreduction of vulnerability to climate change; mitigation plans encompass actions thatentail a reduction of greenhouse gas emissions. A document was considered relevantwhen it targets the entire urban area or city region and when climate change wasexplicitly stated as a motivation for the plan’s development. Adoption of the plan wasnot a necessary condition if a draft document or sufficient information about the plan andits content was available. The document had to be published as a single strategy, acollection of separate climate change actions was not considered. Sectoral plans, with theexception of some ‘energy plans’, that were motivated by climate change were generallyexcluded (e.g. ‘transport strategies’ were not considered). First, we conducted an internetsearch. If no documents were available online, city administration officers were contacteddirectly to confirm that no climate change action plan existed or to provide the document.Thereby, we analysed the plans without relying on self-assessment of city representatives.Additional methodological detail, such as keywords used, and the full list of mitigationand adaptation documents analysed are given in Supplementary Methods andSupplementary Table S1.
The first part of the analysis looks at the regional distribution of urban climate changeadaptation and mitigation plans. Overall, 65.0 % of cities (130 cities) in our sample have atleast a mitigation plan while 35 % have neither a mitigation nor an adaptation plan(Supplementary Table S2). There is large variability across countries: 93 % of UKcities studied have a mitigation plan (Heidrich et al 2013), whereas only 43 % of
Climatic Change
Author's personal copy
French3 and 42 % of Belgian cities do. Most (88 %) of the mitigation plans quantifytargets for carbon dioxide (CO2) or GHG emission reduction, applying either to theurban area as a whole, the city administration or certain economic sectors. Less than a
3 Even when legislation requires the development of plans—the legally mandatory Territorial Climate andEnergy Plans (Plans Climat-Energie Territoriaux or TCEPs) of the Grenelle de l’Environnement in France area recent example, these can take a while to appear. During 2012, 6 out of 35 French cities in our sampledeveloped a mitigation plan and four of these also developed an adaptation plan, which leaves 14 cities out of 35without any plan at the end of 2012. Yet, legislation requires all major cities in France to have developed both amitigation and an adaptation plan by the end of 2012.
Fig. 1 City sample, climate change plans, and emission reduction targets for 195 of the 200 Urban Audit cities(5 UA cities are overseas). Location of urban areas, the availability of climate change plans, and emissionreduction targets are shown for each city. Countries are colour-coded according to the calculated ‘urban-ledtarget’ for each country, i.e. the population weighted average of urban greenhouse gas (GHG) emissionsreduction targets per country (see further down). Cities that have an adaptation and a mitigation plan withquantitative targets are considered to be ‘climate leaders’. C40 cities are members of the C40-network of theworld’s megacities taking action to reduce GHG emissions. The existence of climate change plans is very unevenacross Europe, with evidence of a North–south gradient, but also variable within countries (SupplementaryTable S2)
Climatic Change
Author's personal copy
third of cities also have an adaptation plan (28 %). Cardinally, no city has anadaptation plan without a mitigation plan, i.e. all adaptation documents werepublished simultaneously or after an existing mitigation document.4 The highestproportions of cities with an adaptation plan are in the UK (80 % of 30 cities), Finland(50 % of 4) and Germany (33 % of 40 cities). In 22 % of all cities studied, the mitigationand adaptation actions are integrated into a joint strategy (predominantly in the UK,Finland, and France), which increases the likelihood of integration and considerationof possible trade-offs and feedbacks between adaptation and mitigation policies(Viguie and Hallegatte 2012; Dawson 2011; Barnett and O’Neill 2010). Overall,25 % of cities have both an adaptation and a mitigation plan and set quantitativetargets for GHG emission reductions. In the context of our analysis we consider thesecities to be ’climate leaders’. Despite the advanced stage of environmental policies inEurope these are not plenty.
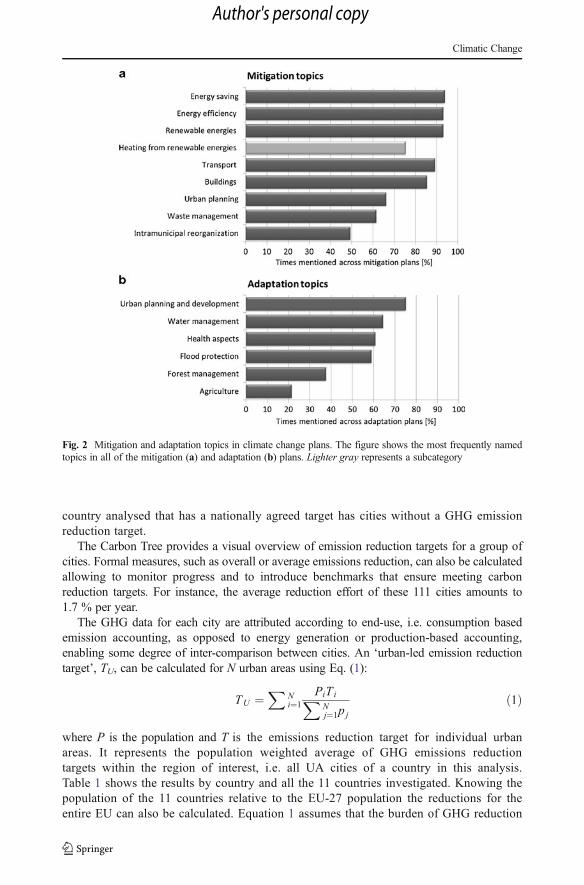
The second focus of our analysis is thematic content of plans. Figure 2 shows thatmost mitigation plans include technological options, such as improved energyefficiency and renewable energy generation, and energy saving measures. Mitigationmeasures typically focus on individual sectors or urban functions (e.g. increasing bikelanes, efficient heating systems, building insulation), rather than systemic changes (e.g.zoning regulations or urban planning). In contrast, adaptation measures tend to fall intothe urban planning and development category. Adaptation plans are generally lessconcrete than mitigation strategies (for example: calling for more scientific studies,urban greening or better cooperation of urban stakeholders), albeit they increase theirbreadth and focus slightly over time (e.g., the adaptation topics of more recent plansaddress a larger number of adaptation categories; see Supplementary InformationFigure S1). Also, it seems adaptation plans are often developed for broader scales.For instance, there are many regional adaptation plans in Italy and France, andadaptation to sea-level rise in the Netherlands is managed nationally instead of bycities (Kabat et al. 2005).
Third, we analyse the GHG reduction targets of plans. In our sample, 111 urban areasdefine quantitative, urban-wide GHG reduction targets, which we plotted in a ‘CarbonTree’ in Fig. 3. The figure reveals substantial variation in magnitude, baseline and targetyear of the reduction schedule, but also many targets aligned with the EU goal of a 20 %emissions reduction before 2020 (relative to a 1990 baseline). Interestingly, none of themitigation strategies look beyond the year 2050, although climate modellers requireemission projections far beyond this point (Moss et al. 2010). National capitals and C40cities are generally large and prominent cities in a country and have reduction targets, butnot necessarily large ones. Dutch cities are the most ambitious aiming to be ‘carbon’,‘climate’ or ‘energy neutral’ (100 % reduction target) by 2050 or earlier, thoughimplementation strategies vary. For instance, Groningen—the most ambitious city as itplans to be energy neutral already by 2025—aims to do so through an increase inrenewable energies and the planting of trees. Cities in the UK, France and Germany,which all act within the framework of national long-term targets set by their governments(see Table 1), tend to be relatively ambitious compared to other countries. However, not allcities with high ambitions lie in countries with a national target as seen in the Netherlands.Likewise, an ambitious national target is no guarantee of an ambitious urban target. Every
4 In one case, the city of Moers, in Germany, a sustainable area management plan was produced—betwixt a land-use plan and an adaptation plan—through the Local Agenda 21 process in cooperation with the city before theofficial mitigation plan.
Climatic Change
Author's personal copy
country analysed that has a nationally agreed target has cities without a GHG emissionreduction target.
The Carbon Tree provides a visual overview of emission reduction targets for a group ofcities. Formal measures, such as overall or average emissions reduction, can also be calculatedallowing to monitor progress and to introduce benchmarks that ensure meeting carbonreduction targets. For instance, the average reduction effort of these 111 cities amounts to1.7 % per year.
The GHG data for each city are attributed according to end-use, i.e. consumption basedemission accounting, as opposed to energy generation or production-based accounting,enabling some degree of inter-comparison between cities. An ‘urban-led emission reductiontarget’, TU, can be calculated for N urban areas using Eq. (1):
TU ¼X
Ni¼1
PiT iXNj¼1pj
ð1Þ
where P is the population and T is the emissions reduction target for individual urbanareas. It represents the population weighted average of GHG emissions reductiontargets within the region of interest, i.e. all UA cities of a country in this analysis.Table 1 shows the results by country and all the 11 countries investigated. Knowing thepopulation of the 11 countries relative to the EU-27 population the reductions for theentire EU can also be calculated. Equation 1 assumes that the burden of GHG reduction
Fig. 2 Mitigation and adaptation topics in climate change plans. The figure shows the most frequently namedtopics in all of the mitigation (a) and adaptation (b) plans. Lighter gray represents a subcategory
Climatic Change
Author's personal copy
Fig. 3 The ‘Carbon Tree’ for the 111 urban areas with mitigation targets. Each city is denoted by a horizontalbar, or ‘branch’. Urban areas from the same country have the same colour. The vertical position of the branchrefers to the magnitude of the emission reduction target in percent, indicated by the scale on the right. The blackboxes on the scale denote all those cities that fall into the exact increment of 10 % that the box surrounds, i.e.there are seven cities that have a reduction target of exactly 30 %, all encompassed by the upper and lower limitof the box that surrounds the number ‘30’. The whiskers from one order of magnitude to the next encompass allcities that have reduction targets between two increments of 10 %, i.e. there are 11 cities that have reductiontargets between 30 % and 40 %. The length of the bar indicates the timeframe of the target, starting with thebaseline that was used for defining the target and extending to the year in which the target wants to be met.Capital cities and C40 cities are highlighted at the left. They can be used as a cross-reference to Table S1 in orderto locate the position of all cities in the tree, as Table S1 lists all cities in the same order top to bottom. Aweak‘Carbon Tree’ has a dense and wide canopy at the top with many urban areas having low targets over longtimescales. An ambitious and realistic ‘Carbon Tree’ has a dense and wide canopy at the bottom with many citieshaving high reduction targets over longer, i.e. more realistic timeframes. The ‘Carbon Tree’ displays overallreduction targets; interim targets are not displayed
Climatic Change
Author's personal copy
within each city is shared equally by each citizen and that the sample is sufficientlyrepresentative of the action being taken by the remaining population in each country.Thus, TU provides an estimate of national GHG reduction action based on ‘bottom-up’reduction intentions.
Many capital cities have ambitious targets, relative to other urban areas within their country,i.e. those where the combined target of all cities is substantially larger than the combined targetwithout capital. All countries apart from Ireland and Italy would reach their EU2020 GHGtargets,5 as would the EU as a whole. Crucially, however, there appears to be insufficientaction within cities to meet the national targets of the four countries that set themselves anational reduction target, i.e. Finland, France, Germany and the UK. The EU wouldexceed its 20 % GHG reduction commitment (37 % urban-led target in the 11 countriesinvestigated translates into roughly 27 % GHG reduction for the EU as a whole), butwould fall short of the 80 % emissions reduction recommended to limit global warmingto 2 °C (see Table 1).
Table 1 Urban-led greenhouse gas (GHG) emissions reduction targets, EU 2020 GHG emissions reductiontargets and national GHG emissions reduction targets. Table 1 shows the urban-led GHG emission reductiontargets for our sample of 11 countries (EU-11) with and without capital cities—the latter in order to assess therelative contribution of large and/or prominent cities, and the relative contribution of the urban-led GHG emissionreduction targets in EU-11 to the GHG emission reductions of EU-27
Country Urbanpopulation insample, 2008[% of nationalpopulation]
Combinedurban-ledtarget of allcities percountry [%]
Combined urban-led target of allcities w/o capitalsper country [%]
EU 2020 targeta, overall(baseline 1990) andassigned per country(baseline 2005;non-ETS sectors) [%]
5 The EU2020 targets are specified in the EU’s climate and energy package—a set of binding legislation whichaims to ensure the European Union meets its ambitious climate and energy targets for 2020. These targets, knownas the “20-20-20” targets (or 3×20 targets), set three key objectives for 2020: 1) A 20 % reduction in EUgreenhouse gas emissions from 1990 levels; 2) Raising the share of EU energy consumption produced fromrenewable resources to 20 %; 3) A 20 % improvement in the EU’s energy efficiency. Agreement on the packagewas reached in December 2008; it became European law in 2009.
Climatic Change
Author's personal copy
We acknowledge the limitations of a European study for global policy implications.However, the European Union is an important contributor to global warming releasingapproximately 11 % of global carbon emissions (European Commission et al. 2011) and hasestablished some of the most ambitious supra-national targets and policies. Our indicators ofclimate change response and climate leadership allow for larger objectivity than, e.g.,comparisons relying on self-assessment, but they are also rigorous and consequently do notcapture the complexity of the policy processes involved (Baker et al. 2012; Romero-Lankao2012) Furthermore, climate plans may not include activities within urban areas that arerelevant to adaptation and mitigation but not labelled as such (Castán Broto and Bulkeley2012). Yet, the adoption of climate change plans indicates awareness of the cross-sectoralchallenges that climate change poses in the urban environment (Heidrich et al. 2013).Furthermore, structural and/or small-scale but wide-ranging changes often start with a multi-sectoral planning process (Corfee-Morlot et al. 2011). We also acknowledge that theextrapolation used for the urban-led emission reduction target introduces uncertainty. Yet,the accounting methods for the national and urban emissions are consistent, therefore allowingfor comparison of national targets and the TU. Future studies ought to deeper investigatepotential drivers and barriers of plan development as well as of the implementation of planedactions, which includes addressing monitoring and updating of plans (Heidrich et al. 2013) anddocumenting the success of plans in achieving climate change adaptation and mitigation(Millard-Ball 2012). To gain a better understanding of the global climate change responseand emissions reduction actions we recommend the establishment of an international databasethat builds upon this European study. This will require an ontology of mitigation andadaptation options in order to provide more consistent comparison of the breadth, focus anddetail of climate plans and their development over time. Our analysis provides a first step inthat direction.
In summary, our study reveals large variation in climate change response across thisrepresentative sample of urban areas in Europe—a variation that is particularly noticeableacross city size and North–South direction. The magnitude of urban GHG reductiontargets varies considerably ranging from 7 to 100 %. If the planed actions within citiesare nationally representative the European Union would achieve its 20 % reduction target,but fall short of the 80 % emissions reduction recommended to avoid global meantemperature rising by more than 2 °C.
Acknowledgments Research undertaken for this paper was conducted as part of the European ScienceFoundation funded COST Action network Integrated assessment technologies to support the sustainabledevelopment of urban areas (TU0902). D.R. is funded by the German Research Foundation (RE 2927/2-1).R.D. is funded by an Engineering & Physical Sciences Research Council Fellowship (EP/H003630/1). H.O.would like to acknowledge Estonia’s Ministry of Education for providing resources with the grantSF0180060s09. We thank S. Schärf, K. Oinonen, S. Reiter, V. D’Alonzo and E. Feliu for their contributionsto data gathering.
Author contribution The study and manuscript preparation was led by D.R. The initial analysis was initiatedby D.R. and J.F. who also led the statistical analysis. All co-authors contributed towards data acquisition in theirrespective countries, interpretation of results, and manuscript preparation. Figure 1 was produced by J.F. Figure 2was produced by D.R. Figure 3 was developed by D.R. and produced with S. De G.H. R.D. is chair and D.R. wasvice-chair of the COST Action network that supported this research and enabled the necessary internationalcoordination.
Competing financial interest statement The authors declare that they have no competing financial interests.
Climatic Change
Author's personal copy
References
Baker I, Peterson A, Brown G, McAlpine C (2012) Local government response to the impacts of climate change:an evaluation of local climate adaptation plans. Landsc Urban Plan 107(2):127–136. doi:10.1016/j.landurbplan.2012.05.009
Barnett J, O’Neill S (2010) Maladaptation. Glob Environ Chang 20(2):211–213. doi:10.1016/j.gloenvcha.2009.11.004
Betsill M, Bulkeley H (2007) Looking Back and Thinking Ahead: A Decade of Cities and Climate ChangeResearch. Local Environ 12(5):447–456
Butler D, Spencer N (2010) The century of the city. Nature 467(7318):900–901Carbon Disclosure Project (2012) Measurement for management: CDP cities 2012 global report—including
special report on C40 cities, vol 2012. Carbon Disclosure ProjectCarmin J, Nadkami N, Rhie C (2012) Progress and challenges in urban climate adaptation planning: results of a
global survey. Massachusetts Institute of Technology, Cambridge, MACastán Broto V, Bulkeley H (2012) A survey of urban climate change experiments in 100 cities. Glob Environ
Chang (0). doi:10.1016/j.gloenvcha.2012.07.005Corfee-Morlot J, Cochran I, Hallegatte S, Teasdale PJ (2011) Multilevel risk governance and urban adaptation
policy. Clim Chang 104(1):169–197Dawson R (2007) Re-engineering cities: a framework for adaptation to global change. Philos Trans Math Phys
Eng Sci 365(1861):3085–3098. doi:10.2307/25190643Dawson R (2011) Potential pitfalls on the transition to more sustainable cities and how they might be avoided.
Carbin Manag 2(2):175–188. doi:10.4155/CMT.11.8de Sherbinin A, Schiller A, Pulsipher A (2007) The vulnerability of global cities to climate hazards. Environ
Urban 19:39–64Duren RM, Miller CE (2012) Measuring the carbon emissions of megacities. Nat Clim Chang 2(8):560–562European Commission, Joint Research Centre (JRC)/PBL Netherlands Environmental Assessment Agency
(2011) Emission Database for Global Atmospheric Research (EDGAR), release version 4.2. http://edgar.jrc.ec.europe.eu. Accessed 11 Sep 2013
Eurostat (2010) European regional and urban statistics reference guide. Methodologies and working papers.European Union, Luxembourg
Eurostat (2013) What is the urban audit? http://www.urbanaudit.org/index.aspx. Accessed 07 Oct 2013Glaser B, Strauss A (1967) The discovery of grounded theory: strategies for qualitative research. Aldine
Publishing Company, ChicagoHeidrich O, Dawson RJ, Reckien D, Walsh CL (2013) Assessment of the climate preparedness of 30 urban areas
in the UK. Clim Chang 120(4):771–784. doi:10.1007/s10584-013-0846-9Hunt A, Watkiss P (2011) Climate change impacts and adaptation in cities: a review of the literature. Clim Chang
104(1):13–49. doi:10.1007/s10584-010-9975-6Johnson CA (2013) Political science: new climate alliances. Nat Clim Chang 3(6):537–538. doi:10.1038/
nclimate1912Kabat P, van Vierssen W, Veraart J, Vellinga P, Aerts J (2005) Climate proofing the Netherlands. Nature
438(7066):283–284Kousky C, Schneider SH (2003) Global climate policy: will cities lead the way? Clim Pol 3(4):359–372. doi:10.
1016/j.clipol.2003.08.002Millard-Ball A (2012) Do city climate plans reduce emissions? J Urban Econ 71(3):289–311. doi:10.1016/j.jue.
2011.12.004Moss RH, Edmonds JA, Hibbard KA, Manning MR, Rose SK, van Vuuren DP, Carter TR, Emori S, Kainuma
M, Kram T, Meehl GA, Mitchell JFP, Nakicenovic N, Riahi K, Smith SJ, Stouffer RJ, Thomson AM,Weyant JP, Wilbanks TJ (2010) The next generation of scenarios for climate change research andassessment. Nature 463:747–756. doi:10.1038/nature08823
Romero-Lankao P (2012) Governing carbon and climate in the cities: an overview of policy and planningchallenges and options. Eur Plan Stud 20(1):7–26. doi:10.1080/09654313.2011.638496
Rosenzweig C, Solecki W, Hammer SA, Mehrotra S (2010) Cities lead the way in climate-change action. Nature467(7318):909–911
Rosenzweig C, Solecki W, Hammer SA, Mehrotra S (2011) Climate change and cities: first assessment report ofthe urban climate change research network. Cambridge University Press, Cambridge
Satterthwaite D (2008) Cities’ contribution to global warming: notes on the allocation of greenhouse gasemissions. Environ Urban 20(2):539–549. doi:10.1177/0956247808096127
Viguie V, Hallegatte S (2012) Trade-offs and synergies in urban climate policies. Nat Clim Chang 2(5):334–337.doi:10.1038/nclimate1434