Page 1
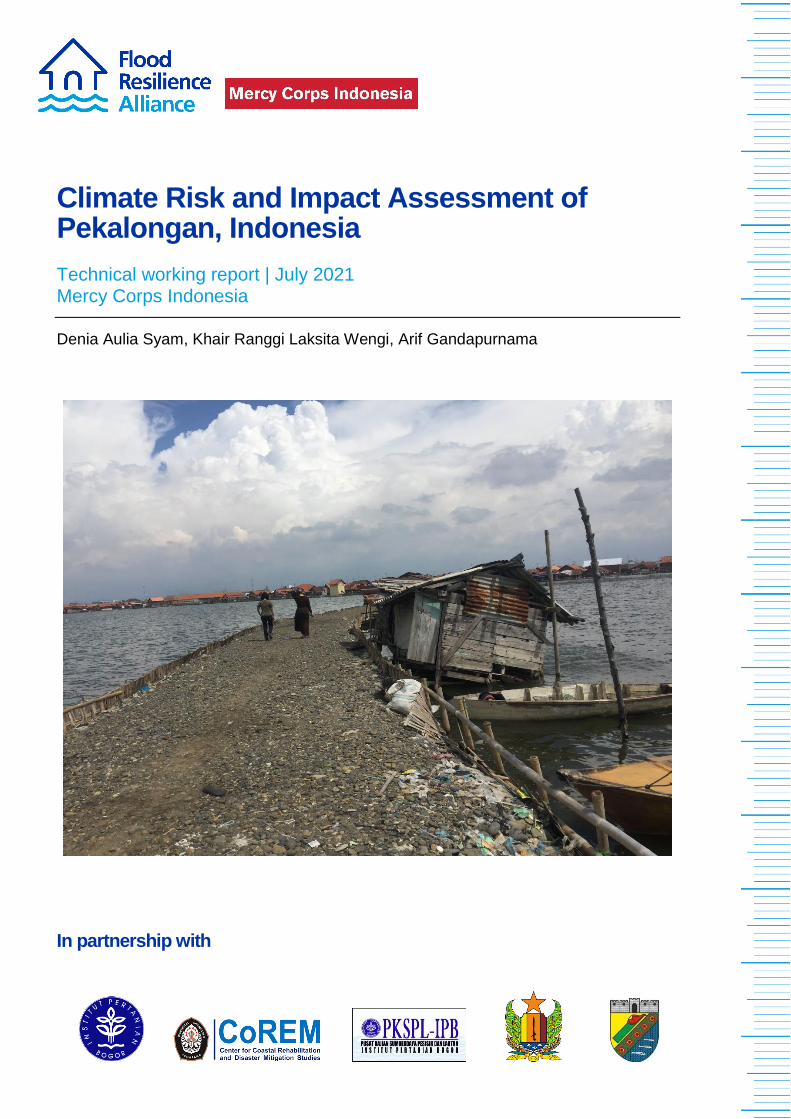
Climate Risk and Impact Assessment of Pekalongan, Indonesia
Technical working report | July 2021 Mercy Corps Indonesia
Denia Aulia Syam, Khair Ranggi Laksita Wengi, Arif Gandapurnama
In partnership with
Page 2
2
www.floodresilience.net @floodalliance
Executive Summary
Indonesia ranks fifth in the world in terms of population inhabiting lower elevation coastal zones
vulnerable to sea level rise, with 60 percent of the population living along the 100,000
kilometers of coastline. Over 4.2 million people are likely to be exposed to permanent flooding
by 2070–2100 without adaptation1. The Greater Pekalongan Area on the north coast of Java,
comprised of Pekalongan City and Regency, is frequently affected by severe coastal and tidal
flooding causing loss of income, assets, and productive land for the 1.2 million residents.
Mercy Corps Indonesia, Diponegoro University, and Bogor Agricultural Institute, as part of the
Zurich Flood Resilience Alliance program, conducted a climate risk and impact assessment of
the Kupang River watershed and coastal areas of Pekalongan City and Pekalongan Regency,
with the aim to support local governments to understand the underlying drivers, risks, and
impacts of flooding; and inform policy development. The assessment consists of a hazard,
vulnerability, and risk analysis; and an economic and non-economic impact analysis of coastal
and tidal flood events.
The decadal climate prediction indicates an increase in the frequency and intensity of extreme
rainfall in the upstream areas of the Kupang watershed. The combination of sea level rise
(projected to be around 0.81 cm/year) and land subsidence (between 0-34.5 cm/year) is
expected to increase tidal flooding in Pekalongan, in addition to climate-induced coastal
flooding. The percentage of villages/kelurahans categorized as having a very high hazard index
is estimated to rise from the current 10 percent, to nearly 40 percent by 2035.
Poor land use management has led to around 22 percent of the Kupang watershed, the primary
water source of Pekalongan, to experience ecosystem degradation and surface runoff. Lack of
alternative water sources has led to excessive groundwater extraction and caused significant
land subsidence. The rate of land subsidence is alarming, ranging from 0 – 34.5 centimeters
(median 16.5) per year, with coastal and downstream areas experiencing the highest rates. The
rapid and high rate of land subsidence has led to permanent inundation of villages in coastal
areas, and driven some parts of the community to relocate from their ancestral lands. Residents
who have opted to stay in permanently inundated areas due to their socio-economic status, are
faced with the difficult task of transforming their livelihoods to withstand these climate impacts.
Spatial inundation modelling results predict permanent inundation to increase four times from
the current 1,478 Ha to 5,721 Ha by 2035 - 90 percent of Pekalongan City and a major portion
of Pekalongan Regency’s coastal area will be under water. The majority of this land is currently
utilized for agriculture, aquaculture, and residential settlements. The percentage of residential
areas impacted by flooding in Pekalongan City is estimated to increase 100 times, from 0.5
percent in 2020 to 51 percent in 2035.
An impact analysis on 41 villages identified as having the highest risk revealed the total annual
impact of flooding to be around 474.4 million annually in 2020. This figure is twice the total
annual budget of Pekalongan City and Regency. Losses are predicted to increase almost five-
fold to USD 2.15 billion per year by 2035 due to increasing flood risks.
The adaptive capacity of communities is predicted to largely remain at a low to moderate level,
with slight increases due to flood mitigation infrastructure development and the implementation
of a planned health insurance program which is expected to decrease the impact of water-borne
____________________
1 : Climate Risk Profile: Indonesia (2021): The World Bank Group and Asian Development Bank,
<https://www.adb.org/publications/climate-risk-country-profile-indonesia > [accessed 1 July 2021].
Page 3
3
www.floodresilience.net @floodalliance
diseases in flood events. The poor socio-economic conditions of communities, and lack of
knowledge and skills on adaptation and disaster risk management, hinder the adoption of
adaptive and resilient livelihood practices, and accelerate loss of livelihood productivity and
assets. Such conditions have been exacerbated by the COVID-19 pandemic, which has had
significant socio-economic and health impacts to communities. The pandemic has affected the
resilience of communities to withstand shocks and stresses such as flooding in both the short-
term and long-term.
The evidence generated from risk and impact assessments are informing policy development of
the Pekalongan City and Regency governments. Policy recommendations are currently being
developed around four clusters: zoning and regional adaptation; flood management
infrastructure; water resource management through infrastructure and conservation; and human
resource and institutional capacity development on disaster risk reduction.
Page 4
4
www.floodresilience.net @floodalliance
Background
Indonesia ranks fifth in the world in terms of population inhabiting lower elevation coastal zones,
which are vulnerable to sea level rise, with 60 percent of the population living along the 100,000
kilometer coastline. Approximately 3,000 villages located along the coast experienced flooding
between 2016-2018. A country abundant with marine resources, 22 percent of the population of
coastal villages rely on the fisheries sector for their livelihood (BPS, 2018). Indonesia also ranks
in the top-third of countries for climate risk, with high exposure to flooding and extreme heat.
Over 4.2 million people are likely to be exposed to permanent flooding by 2070–2100 without
adaptation (ADB, 2021). Climate vulnerability, especially for coastal areas in the country,
impacts peoples’ lives and livelihoods.
The Greater Pekalongan Area on the north coast of Java, comprised of Pekalongan City and
Regency and home to 1.2 million, is frequently affected by severe coastal and tidal and sea
tides (Pasaribu et al. 2013). Historically, the Pekalongan coastal area has experienced sea level
rise of 5 mm per year, which is higher than that of the Java Sea, which is generally 3.9 mm per
year (Kismawardhani et al. 2018). The rapid rate of land subsidence in Pekalongan, estimated
to be 10-17cm per year (2012-2018), combined with rising sea levels, make the area especially
vulnerable to flooding (Tempo, 2019).
The recurring floods have caused losses in assets, productive lands, and infrastructure, as well
as disruption in public services. Moreover, the disasters have decreased the communities’
income due to significant costs for preparedness, response, and recovery. The local
government’s fiscal capacity has also been impacted by having to continuously support flood
risk reduction and response measures.
The severe impacts and climate vulnerabilities of Pekalongan drove Mercy Corps Indonesia,
Diponegoro University, and Bogor Agricultural Institute, to undertake a climate risk and impact
assessment as part of the Zurich Flood Resilience Alliance program, with the aim to support the
Pekalongan City and Regency governments to understand the underlying drivers, risks, and
impacts of flooding; provide evidence for decision making on interventions; and inform policy
development.
Methodology
The climate risk and impact assessment consists of a hazard, vulnerability, and risk analysis;
and an economic and non-economic impact analysis of the causal impacts of flooding on
peoples’ lives (Figure 1). The study area involved two interconnected landscapes: the Kupang
River watershed and the transboundary coastal area of Pekalongan City and Pekalongan
Regency. The areas were selected for their strategic role in regional water supply heavily
influenced by environmental degradation.
Page 5
5
www.floodresilience.net @floodalliance
Figure 1: Climate risk and impact assessment and policy integration process.
Hazard analysis methodology
The hazard analysis entailed climate modelling (climate change projection), sea level rise
projection, flood spatial model simulation, and hazard modelling. Considering the rapid physical
changes taking place in the studied coastal area and the urgent need for short-term
recommendations for policy development, the climate modelling was done for both the near-
term (decadal projections) and the long-term (RCP 4.5 and RCP 8.5 predictions).
The hazard analysis process was conducted for the current baseline (2020), 5-yearly
projections until 2035 for decadal projections, and 25-yearly projections until 2095 for long-term
projections. A flood hazard index for each projection period was determined based on the
inundation level and land level from the agent-based model simulation results with 30x30 meter
spatial resolution.
Category Inundation level (cm) Index value
Not affected 0 0
Very light 0.01-4.2 0.2
Light 4.2-31.7 0.4
Moderate 31.7-77.83 0.6
High 77.83-192.74 0.8
Very high >192.74 1
Table 1: Flood hazard categorization developed by authors.
Page 6
6
www.floodresilience.net @floodalliance
Vulnerability analysis methodology
The vulnerability analysis is comprised of a sensitivity analysis, exposure analysis, and adaptive
capacity analysis. The analysis process was conducted for the current baseline condition and 5-
yearly projections until 2035. Vulnerability was measured from a function of sensitivity,
exposure, and adaptive capacity (vulnerability = [sensitivity*exposure] / adaptive capacity). The
results of the vulnerability model were classified into five vulnerability index classes, from very
low to very high. Data was obtained from primary and secondary data collection, both spatial
and non-spatial, including geospatial data analysis, questionnaires (targeting communities,
regency/city governments, and villages/kelurahans), and statistical data at the village/kelurahan
level. An analysis on land use change and land subsidence was also conducted to further
understand the vulnerability of the study area.
Figure 2: Vulnerability analysis components and indicators.
Risk analysis methodology
Risk is considered as a function of hazard and vulnerability (risk = hazard * vulnerability). A risk
map was produced with a grid-scale analysis unit, overlaid with village administrative
boundaries. The risk analysis additionally examined the potential impact of inundation from a
spatial perspective. The results of the risk analysis were classified into five levels of an index,
ranging from very low to very high. The classification is done by proportionally dividing the risk
value (0 - 1) into the five classes. The risk level is categorized as very-high if the index value is
above 0.8 to 1, and categorized as very-low if the value is between 0 to 0.2.
Page 7
7
www.floodresilience.net @floodalliance
Loss and damage assessment with economic and non-economic impact valuation methodology
Loss and damage calculation was conducted in 41 villages/kelurahans predicted to be most
impacted by inundation. This was assessed across four categories: material loss (costs for
adaptation and repair, medical costs, additional cost of clean water needs, additional food cost,
and additional energy cost); non-material loss (psychological impacts and household social
disruptions such as domestic violence); land productivity loss; and ecosystem service loss
(tourism service). The calculation basis utilized are as follows:
Future loss and damage value is calculated based on the time value of money;
Future value is calculated by using the discount rate of 4.44% per annum. The respective discount rate is based on the average annual inflation rate in Pekalongan in the last seven years (year 2013-2019);
Projection of impacted population is calculated exponentially by using the average annual population growth rate;
Projection of spatial distribution of the flooded area in each period is based on GIS simulations that consider the percentage of flooded areas, percentage of flooded village/ward areas, and data on agriculture and fishpond areas.
Hazard Analysis Findings
Climate scenario
Analysis of the probability of monthly rainfall anomaly, which indicates the deviations of annual
rainfall from long-run averages, shows a trend of Above Normal (AN) anomaly. For example, in
2021, AN rainfall is predicted to occur more frequently in the study area, particularly in the
upstream and midstream areas of the Kupang River watershed, except for February and
December. Meanwhile, downstream and coastal show a Normal (N) rain anomaly. The trend of
increased rainfall in upstream areas is predicted to continue, indicating a likelihood for
flash floods to occur and affect the midstream and downstream areas if risk reduction
measures are not taken. The need for a comprehensive watershed management system is
evident.
The wet extreme indices analyzed under the decadal climate prediction are comprised of: 1)
Rx1day, which is the highest daily rainfall within a year; 2) Rx5day, which is the highest 5-day
cumulative rainfall in a year; and 3) R20mm, which is the number of rainy days in a year with
daily rainfall value of more than 20 mm. The upstream areas of the Kupang watershed will likely
experience an increase in the frequency and intensity of extreme rainfall. The midstream and
downstream areas are predicted to experience more frequent but less intense rainfall.
Long-term climate projection
Long-term climate projection was carried out for two scenarios from 2021-2095, namely 1) RCP
4.5, which represents a moderate condition with a scenario of moderate mitigation measures to
maintain radiative forcing level due to greenhouse gas emissions, and 2) RCP 8.5, which
represents an extreme condition with a scenario of no measures conducted to limit greenhouse
gas emissions. The extreme indices utilized for the projection were Consecutive Dry Days
(CDD), Consecutive Wet Days (CWD), R10mm, R20mm, Rx1day, and Rx5day. The Rx1day,
Rx5day, and R20mm indices served as a reference for wet extreme conditions that are
correlated with flood and landslide events. Meanwhile, Consecutive Dry Days (CDD) indicates
Page 8
8
www.floodresilience.net @floodalliance
the possibility of drought, as the index provides information on the number of consecutive days
without rain over a certain period of time.
The long-term climate projection results predict the Pekalongan will experience wetter
conditions. Higher rainfall intensity and frequency will not only affect coastal areas, but
also the southern upstream areas. Spatial analysis shows an increase in the likelihood of
intensity and frequency of extreme rainfall events, especially in the coastal area as shown by
the increases of percentage changes in the Rx1day, Rx5day, R10mm and R20mm. Moreover,
in a RCP8.5 scenario without any measures for mitigation, the number of Consecutive
Wet Days (CWD) is expected to increase 40 percent. The number of Consecutive Dry Days
(CDD) did not show significant change in the future.
Page 9
Figure 3.1: Decadal climate prediction - probability of monthly rainfall anomaly for the period of January-December 2021.
Figure 3.2: Prediction on the possibility of number of days in a year with daily rainfall value of more than 20 mm.
Figure 3.3: Historical trend and decadal prediction of Rx1day Wet Extreme Index (above) and R20 mm (below).
Page 10
10
www.floodresilience.net @floodalliance
Inundation Modelling
Inundation modelling was conducted by using the extreme values of inputs such as climate
attributes (rainfall, sea level rise, and tidal waves), geological attributes (land topography and
subsidence), and hydro-geological attributes (geomorphology of coastal and river areas). The
maximum Rx1day data in each grid obtained from the decadal prediction calculation, and the
95th percentile value for RCP4.5 and RCP8.5 scenarios were used to assess runoff. The 90th
percentage of tidal water level during the observation period (2020) was used for tidal flood.
2019 data analysis shows a constant rate of land subsidence, and therefore, a constant value
was used throughout the projection period.
Permanent inundation
The significant rate of land subsidence, caused by excessive ground water extraction due to
lack of alternative water sources, has led to chronic and irreversible impacts of flooding, such us
permanent inundation. The spatial inundation modelling results show a significant four-
fold increase in permanent inundation from the current 1,478 Ha in 2020 to 5,721 Ha by
2035. The inundation will reach Kelurahan Tirto in the south and some parts of Kelurahan
Padukuhan Kraton and Pasir Kraton Kramat in the east by 2025. By 2035, permanent
inundation will further expand to the south and reach some parts of Kertijayan and
Simbangkulon in Pekalongan Regency, and Kelurahan Kalibaros and Kuripan Yosorejo in
Pekalongan City.
The current furthest inundation was observed to be 4.2 km away from the shore. By 2025, this
distance is expected to reach around 7.5km, and reach Kelurahan Degayu, Kuripan Yosorejo,
Noyontaansari, and Jenggot. By 2035, the furthest distance of inundation from the shore
will increase up to 8.5 km and 9.4 km, for the decadal prediction and RCP 4.5 projection,
respectively; and reach the villages of Simbangwetan and Wonoyoso, as well as Kelurahan
Sokoduwet and Kuripan Kertoharjo.
In 2035, inundation in Pekalongan City is projected to reach 674 Ha across 10 kelurahans, and
mostly cover settlement areas (248 Ha), green space (104.8 Ha), and aquaculture zone (154
Ha). For Pekalongan Regency, inundation will be experienced by 11 villages with a total
affected area of 1,383 Ha, covering aquaculture areas (811 Ha) and urban settlement areas
(266 Ha).
DISAPPEARING VILLAGES FACE DIFFICULT DECISIONS
Simonet, one hamlet in Semut village in Pekalongan Regency, with a total area of 15 Ha, has
almost completely disappeared due to inundation and tidal flooding. Tidal flooding in Simonet
is a daily occurrence. The height of floods can reach up to 5 meters, forcing residents to
evacuate. The local district government decided to provide one hectare of land for ten families
that chose to relocate. Now, the government is preparing to relocate the remaining 67
households (162 people) – however, relocation is a difficult decision since the majority of
residents work in the fisheries sector and need to live along the coast to sustain their
livelihood.
Page 11
11
www.floodresilience.net @floodalliance
Figure 5: Inundation of current state in 2020 (above), and inundation simulation for the period of 2021-2025 for decadal prediction (middle), and RCP 4.5 scenario (below).
Page 12
12
www.floodresilience.net @floodalliance
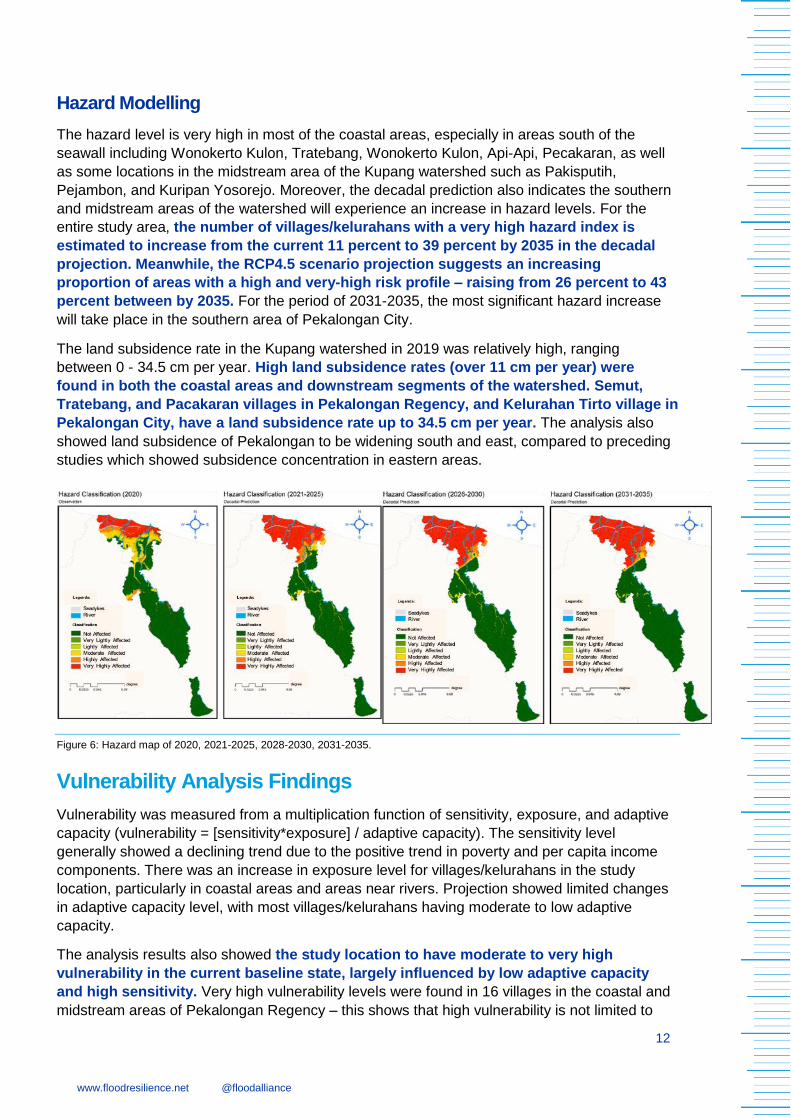
Hazard Modelling
The hazard level is very high in most of the coastal areas, especially in areas south of the
seawall including Wonokerto Kulon, Tratebang, Wonokerto Kulon, Api-Api, Pecakaran, as well
as some locations in the midstream area of the Kupang watershed such as Pakisputih,
Pejambon, and Kuripan Yosorejo. Moreover, the decadal prediction also indicates the southern
and midstream areas of the watershed will experience an increase in hazard levels. For the
entire study area, the number of villages/kelurahans with a very high hazard index is
estimated to increase from the current 11 percent to 39 percent by 2035 in the decadal
projection. Meanwhile, the RCP4.5 scenario projection suggests an increasing
proportion of areas with a high and very-high risk profile – raising from 26 percent to 43
percent between by 2035. For the period of 2031-2035, the most significant hazard increase
will take place in the southern area of Pekalongan City.
The land subsidence rate in the Kupang watershed in 2019 was relatively high, ranging
between 0 - 34.5 cm per year. High land subsidence rates (over 11 cm per year) were
found in both the coastal areas and downstream segments of the watershed. Semut,
Tratebang, and Pacakaran villages in Pekalongan Regency, and Kelurahan Tirto village in
Pekalongan City, have a land subsidence rate up to 34.5 cm per year. The analysis also
showed land subsidence of Pekalongan to be widening south and east, compared to preceding
studies which showed subsidence concentration in eastern areas.
Figure 6: Hazard map of 2020, 2021-2025, 2028-2030, 2031-2035.
Vulnerability Analysis Findings
Vulnerability was measured from a multiplication function of sensitivity, exposure, and adaptive
capacity (vulnerability = [sensitivity*exposure] / adaptive capacity). The sensitivity level
generally showed a declining trend due to the positive trend in poverty and per capita income
components. There was an increase in exposure level for villages/kelurahans in the study
location, particularly in coastal areas and areas near rivers. Projection showed limited changes
in adaptive capacity level, with most villages/kelurahans having moderate to low adaptive
capacity.
The analysis results also showed the study location to have moderate to very high
vulnerability in the current baseline state, largely influenced by low adaptive capacity
and high sensitivity. Very high vulnerability levels were found in 16 villages in the coastal and
midstream areas of Pekalongan Regency – this shows that high vulnerability is not limited to
Page 13
13
www.floodresilience.net @floodalliance
areas directly affected by tidal floods. Approximately 75 percent of the villages/kelurahans with
very high vulnerability levels have low adaptive capacity level, and 60% have high sensitivity
level.
Projections of vulnerability differ according to the segment of the watershed, and is described
below:
Upstream: Increasing vulnerability in upstream areas is caused by the increase of exposure in the area, with relatively minor changes in sensitivity and adaptive capacity (Talun, Tlogohendro). The increase in exposure is largely influenced by changes in topography and planned settlements.
Midstream: Decreasing vulnerability in midstream areas is due to a decline in sensitivity and increase in adaptive capacity. The midstream area overall sees an increase in average income and a declining proportion of people living under the poverty line, as well as improved access to health care services due to the planned insurance roll out, which together strengthens communities’ capacity to deal with shocks and stresses such as flooding.
Downstream and coastal area: The decreasing vulnerability level in downstream and coastal areas is influenced by a decline in sensitivity and an increase in adaptive capacity due to infrastructure development which mitigates flood impacts.
Page 14
14
Figure 7: Spatial distribution of vulnerability index at 2020 (left), 2025 (middle), and 2035 (right).
Page 15
15
www.floodresilience.net @floodalliance
Risk Analysis Findings
Risk was considered as a function of hazard and vulnerability (risk = hazard * vulnerability) The
projection results show an increase of risk level in coastal areas due to increasing hazard levels
in most of the villages/kelurahans. Inundation projections predict an increase in inundation
size in coastal areas, which will definitely contribute to an increase in flood risk. Both
sea level rise and the high rate of land subsidence will contribute to a rapid increase in
permanently inundated land. Historical data from the Disaster Management Agency show that
flood hazards caused by extreme rain affects coastal areas as well as midstream and upstream
areas of the Kupang river, and areas with lower elevation.
Coastal Area
In general, the villages/kelurahans have high to very high risk level, except for Pesanggrahan
Village. The high flood risk in the coastal area of Pekalongan Regency is caused by high levels
of vulnerability and hazards – the area experiences multiple types of flooding, including coastal
flooding, flash floods and localized urban flooding due to poor drainage systems. The
kelurahans of Kandang Panjang, Panjang Baru, and Tirto, have a moderate vulnerability level.
This vulnerability profile is due to not only the high level of exposure, but also due to the
moderate-high sensitivity level.
Exposure is strongly influenced by the potential of hazard events, as well as population density
and state of development. The number of critical assets and poor health care system are the
dominant factors influencing the sensitivity level. All coastal villages in Pekalongan City and
Regency have moderate, high, or very high vulnerability levels. Well-planned adaptation
measures are highly needed to increase the communities’ adaptive capacity, especially in
dealing with the increasing flood hazard.
Non-Coastal Area
The risk profile of the non-coastal area is generally categorized to be medium to low. Some
areas in the Pekalongan Regency (Ambokembang Kebonrowopucang, Kedungkebo, Kertijayan,
Logandeng, Pagumenganmas, Pakumbulan, Pegandon, Pekajangan, Podo and Salakbrojo)
and a small portion of downstream and midstream areas in Pekalongan City have a high level of
risk. The contributing factors of the risk differ according to location. In the downstream area, the
relatively flat topography and close distance to the sea or river, lead to high exposure. The
insufficient health care system leads to high sensitivity. Meanwhile, in the midstream areas, the
low socio-economic status of the communities contributes to a high sensitivity level.
Communities in this area also have a low level of adaptive capacity and lack understanding on
flood management practices. Strengthening the communities’ skills and knowledge to cope with
potential hazards is critically important.
Risk Projection (2021-2035)
In Pekalongan City, the number of kelurahans experiencing a higher risk level will increase
consistently, and all of the kelurahans will have a high to very high risk level (both in decadal
prediction scenario as well as RCP 4.5 projection) by 2035, compared to only 65 percent having
such risk levels in the baseline year of 2020.
For Pekalongan Regency, differences were found between the projection results from the
decadal prediction and RCP4.5 projection. In the baseline year of 2020, 36 out of 58 villages
had a high-very high risk level. By the end of the 2035, this number shifted to 32 villages and 48
Page 16
16
www.floodresilience.net @floodalliance
villages for the decadal prediction and RCP 4.5 projection, respectively – there was a decrease
in the number of villages for the decadal prediction, whereas the RCP 4.5 projection showed an
increase. This difference shows that the change in rainfall intensity (especially maximum daily
rainfall) influences the risk level of Pekalongan Regency; the hazard analysis showed a different
trend (until year 2035) for maximum daily rainfall under the two scenarios.
The difference of characteristics of vulnerability and hazard levels can be used to determine the
most suitable adaptation option, such as one that will focus on the decrease of exposure and
sensitivity level, or one that will focus on adaptive capacity, although all components must be
considered. In addition, the use of the 30x30m spatial resolution within our analysis will better
indicate the most appropriate intervention area for the formulated programs and activities.
Interlinkage between land use change and inundation
Trend in Land Use Change
The projection indicates that land use in Pekalongan will still be dominated by settlements, rice
fields, and forests in 2035. Agriculture is expected to remain one of the main income sources for
communities. An increasing trend can be observed for the settlement size (±1.000 Ha) and tidal
flood/inundated land (± 1.400 Ha), while the land size for rice fields and fish ponds show a
decline of approximately 1,600 Ha and 1,300 Ha. Such predictions and further analysis show
that the expansion of inundated land and settlement areas leads to a decrease in rice fields and
fish ponds. Fish ponds become permanently inundated areas in coastal areas, while rice fields
are converted to settlements in non-coastal areas.
Land use affected by inundation
Over 90 percent of mangroves, bushes, and park land will be permanently inundated by
the end of 2035. Further, more than half of settlements, fish ponds, open land, and
industrial land will also be permanently inundated. The increase in affected settlement area
will increase gradually from 0.53% in 2020, 21.59% by 2025, 46.9% by 2030, and 50.83% by
2035. Areas currently being developed into settlement areas are located in places vulnerable to
permanent inundation.
Page 17
17
Figure 8.1: Potential impacts of permanent inundation and furthest inundation in the decadal prediction model.
Page 18
18
Figure 8.2: Potential impacts of permanent inundation in the RCP 4.5 projection model.
Page 19
19
www.floodresilience.net @floodalliance
Loss and damage predictions from floods by 2035
Baseline Profile (2020)
Flood damage values in 2020 was estimated at USD 474.4 million, with Pekalongan City
at USD 287.4 million and Pekalongan Regency at USD 187 million. This is a significant
figure, as the total annual budget for Pekalongan City and Regency for 2020 was around 206
million USD. The annual impact of flooding is more than twice the local annual budget.
Material loss is the main contributor, with USD 162 million and USD 114 million for the city and
regency, respectively. The highest costs of material loss are adaptation costs, asset repairment
costs, and income loss.
Loss and Damage Projection (2021-2035)
Flooding is predicted to severely affect 41 villages/kelurahan (24 kelurahans in Pekalongan City
and 17 villages/kelurahans in Pekalongan Regency) by 20352. Flood impacts are predicted to
reach USD 2.1 billion per year by 2035 from USD 474.4 million in 2020, with USD 1.17
billion in material losses, USD 806 million in non-material losses, USD 5 million in land
productivity; and over USD 174 million in ecosystem services loss.
Economic and non-economic adaptation costs and impacts to households are significant with
income loss, additional costs for livelihood activities, and reduction of land productivity. Loss of
income due to tidal flooding in the 41 affected villages is predicted to reach USD 171
million annually. The three livelihood sectors of trade and service, aquaculture, and
farming will especially be affected due to market and material distribution disruption,
inundation, and flood defence measures that will affect the hydrological environment.
The assessment further shows that tidal floods have caused household conflict, making
women particularly vulnerable to domestic violence. Further, around 14 percent of families
in Pekalongan Regency are female-headed, and work in climate-vulnerable sectors such as
agroforestry, fishery, and batik sector. As the family head, such women are also responsible for
household and caregiving duties, leading to further financial, physical, and psychological
pressure during disasters such as flooding. The total projected estimation of economic and non-
economic loss for flooding is summarized in the following table.
____________________
2 Loss and damage analysis from 2020-2035 does not include Pringrejo Village due to lack of data.
Page 20
20
www.floodresilience.net @floodalliance
Recapitulation of Total Economic and Non-Economic Loss (thousand USD)
Components Pekalongan City Pekalongan Regency
2020 2025 2030 2035 2020 2025 2030 2035
Affected area (kelurahan/villages)
11 24 24 24 13 15 17 17
Material loss (economic)
Adaptation Cost 81,345 221,729 294,539 385,157 42,838 62,744 87,201 115,141
Asset repairment cost 16,651 51,300 67,858 89,316 24,462 33,886 45,812 59,497
Medical cost 5,325 19,664 26,269 34,937 5,902 7,948 10,919 14,236
Additional cost for water 13,677 38,401 50,614 67,021 7,890 10,791 15,032 19,662
Additional cost for food 11,176 31,430 41,659 55,257 10,943 14,554 19,745 25,698
Additional cost for energy
7,387 25,699 34,240 45,239 7,602 10,318 14,463 18,915
Wastewater treatment 9,074 30,115 40,154 52,943 7,031 9,886 13,639 17,778
Income reduction 13,243 60,498 82,016 110,072 5,020 6,801 10,147 13,153
Increase in business cost
4,319 19,787 26,849 36,055 2,383 3,188 4,616 5,985
Total material loss 162,198 498,622 664,199 875,997 114,071 160,117 221,575 290,065
Non-material loss (non-economic)
Mental health 32,047 110,709 150,202 198,400 19,424 27,537 37,549 48,557
Household system disruption
71,023 266,268 354,440 469,158 29,271 48,657 68,934 90,127
Total non-material loss 103,070 376,977 504,641 667,558 48,695 76,194 106,483 138,684
Land productivity loss
Farming 355 1,130 1,403 1,744 751 1,036 1,401 1,740
Fish-pond 267 331 412 511 742 922 1,145 1,423
Total land productivity loss
622 1,461 1,815 2,255 1,493 1,958 2,546 3,163
Ecosystem service loss (for tourism)
21,522 68,288 90,207 119,319 22,741 30,028 40,970 54,936
Total 287,410 945,348 1,260,862 1,665,128 187,000 268,296 371,573 486,848
Table 2: Projected economic and non-economic loss from flooding in Pekalongan City and Regency for 2020 – 2035.
Page 21
21
www.floodresilience.net @floodalliance
Flood risk perceptions of communities in Pekalongan
The risk perception analysis was conducted through a structured interview in 42
villages/kelurahans and used five indicators of knowledge, direct experience, impact,
awareness and concern, and personal readiness. The risk perception level in Pekalongan City
and Regency showed a score of 9.6 and 10.5 respectively, on a scale of 5-25 – indicating a low
risk perception level. Interviewees generally scored high on knowledge and experience of
disasters, but scored low on concern and readiness levels.
Figure 9: Risk perception scale in 42 high-risk villages/kelurahans in Pekalongan City and Regency.
Way forward
The findings from the study are currently being utilized to conduct dialogues with the
Pekalongan City and Regency governments to identify interventions that can address climate
risk and impacts, and inform policy development. Four clusters of actions to contribute to a
comprehensive transboundary flood management roadmap in Pekalongan City and Regency
have been proposed to date: zoning and regional adaptation; flood management infrastructure;
water resource management through infrastructure and conservation; and human resource and
institutional capacity strengthening on disaster risk reduction. Mercy Corps Indonesia and
research partners will continue to work with governments and key stakeholders to support
climate resilient policy making and programming in Pekalogan City and Regency.
MAP OF FLOOD RISK PERCEPTION SCALE
PEKALONGAN REGENCY – CITY
YEAR 2020
Risk Perception Scale
Low
Moderate
High
Road
River
MAP INDEX
PEKALONGAN CITY
PEKALONGAN REGENCY
STUDY LOCATION
JAVA SEA
Source of Information: 1. Analysis results
J A V A S E A
Page 22
22
www.floodresilience.net @floodalliance
References
Asian Development Bank. (2021). Climate Risk Profile: Indonesia.
<https://www.adb.org/publications/climate-risk-country-profile-indonesia > [accessed 1 July
2021].
BPS. (2018). Statistik Sumber Daya Laut dan Pesisir 2018. Jakarta: BPS.
Kismawardhani, Ratu & Wirasatriya, Anindya & Berlianty, Dessy. (2018). Sea Level Rise in The
Java Sea Based on Altimetry Satellites Data Over 1993-2015. IOP Conference Series: Earth
and Environmental Science. 165. 012006. 10.1088/1755-1315/165/1/012006.
Nashrrullah, Syams & Aprijanto, Titot & Pasaribu, Junita & Hazarika, Manzul & Samarakoon,
Lal. (2013). Study of flood inundation in Pekalongan, Central Java. International Journal of
Remote Sensing and Earth Sciences. 10. 76-83.
Tempo. (2019). Penurunan Tanah Terparah Peneliti ITB Save Pekalongan.
<https://tekno.tempo.co/read/1284106/penurunan-tanah-terparah-peneliti-itb-save-pekalongan>
[accessed 1 July 2021].
Recommended Reading
Andreas, H., Abidin, H.Z., Sarsito, D.A. and Pradipta, D. 2018. Insight Analysis on Dike
Protection against Land Subsidence and the Sea Level Rise around Northern Coast of Java
(Pantura) Indonesia. Geoplanning Vol. 5, No. 1, 2018 101-114. doi:
10.14710/geoplanning.5.1.101-114
Doberstein B., Fritzgibbons, J. and Michell, C. 2019. Protect, Accommodate, Retreat or Avoid
(PARA): Canadian community options for flood disaster risk reduction and flood resilience.
Natural Hazards (2019) 98:31-50. https://doi.org/10.1007/s11069-018-3529-z
[IPCC] International Panel for Climate Change. 2012. Managing the Risks of Extreme Events
and Disasters to Advance Climate Change Adaptation. New York, USA: Intergovernmental
Panel on Climate Change
Lechowska, E. 2018. What determines flood risk perception? A review of factors of flood risk
perception and relations between its basic elements. Natural Hazards.
https://doi.org/10.1007/s11069-018-3480-z
Mañez, M., Carmona, M., Haro, D., & Hanger, S. Risk perception. In Aerts, Jeroen & Mysiak,
Jaroslav (Eds). 2016. Novel Multi-Sector Partnerships in Disaster Risk Management. Results of
the ENHANCE project. pp. 51-67 Brussels, Belgium: EU FP7 project ENHANCE.
Peraturan Daerah Kota Pekalongan Nomor 30 Tahun 2011 tentang Rencana Tata Ruang
Wilayah (RTRW) Kota Pekalongan 2009 – 2029.
Peraturan Daerah Kabupaten Pekalongan Nomor 3 Tahun 2020 tentang Rencana Tata Ruang
Wilayah (RTRW) Kabupaten Pekalongan Tahun 2020 – 2040.
Raaijmakers, R., Krywkow, J. and van der Veen, A. 2008. Flood risk perceptions and spatial
multi-criteria analysis: an exploratory research for hazard mitigation. Natural Hazards 46, 307-
322 (2008) https://doi.org/10.1007/s11069-007-9189-z
Page 23
23
www.floodresilience.net @floodalliance
Shah K.U, Dulal H.B, Johnson C, Baptise A. 2013. Understanding livelihood vulnerability to
climate change: Applying the livelihood vulnerability index in Trinidad and Tobago. Geoforum.
47(2013): 125-137. Doi: 10.1016/j.geoforum.2013.04.04
William, D.J. and Noyes, J.N. 2007. How does our perception on risk influence decision-
making? Implications for the design of risk information. Theoretical Issues in Ergonomics
Science Vol. 8, No. 1, January-February 2007, 1-35
Page 24
Zurich Flood Resilience Alliance
www.floodresilience.net @floodalliance
Contact
Denia Aulia Syam
Program Manager and Advocacy Specialist
Zurich Flood Resilience Alliance | Mercy Corps Indonesia
[email protected]