+ All Categories
Home > Documents > Climatic limits for the present distribution of beech (Fagus L

Climatic limits for the present distribution of beech (Fagus L

Date post: 09-Feb-2022
Category:
Upload: others
View: 1 times
Download: 0 times
Share this document with a friend
33
ORIGINAL ARTICLE Climatic limits for the present distribution of beech (Fagus L.) species in the world Jingyun Fang 1 * and Martin J. Lechowicz 2 1 Department of Ecology, College of Environmental Sciences, and Centre for Ecological Research & Education, Peking University, Beijing 100871, China and 2 Biology Department, McGill University, 1205 Dr Penfield Avenue, Montreal, Quebec, Canada H3A 1B1 *Correspondence: Jingyun Fang, Department of Ecology, College of Environmental Sciences, Peking University, Beijing 100871, China. E-mail: [email protected] ABSTRACT Aim Beech (Fagus L., Fagaceae) species are representative trees of temperate deciduous broadleaf forests in the Northern Hemisphere. We focus on the distributional limits of beech species, in particular on identifying climatic factors associated with their present range limits. Location Beech species occur in East Asia, Europe and West Asia, and North America. We collated information on both the southern and northern range limits and the lower and upper elevational limits for beech species in each region. Methods In total, 292 lower/southern limit and 310 upper/northern limit sites with available climatic data for all 11 extant beech species were collected by reviewing the literature, and 13 climatic variables were estimated for each site from climate normals at nearby stations. We used principal components analysis (PCA) to detect climatic variables most strongly associated with the distribution of beech species and to compare the climatic spaces for the different beech species. Results Statistics for thermal and moisture climatic conditions at the lower/ southern and upper/northern limits of all world beech species are presented. The first two PCA components accounted for 70% and 68% of the overall variance in lower/southern and upper/northern range limits, respectively. The first PCA axis represented a thermal gradient, and the second a moisture gradient associated with the world-wide distribution pattern of beech species. Among thermal variables, growing season warmth was most important for beech distribution, but winter low temperature (coldness and mean temperature for the coldest month) and climatic continentality were also coupled with beech occurrence. The moisture gradient, indicated by precipitation and moisture indices, showed regional differences. American beech had the widest thermal range, Japanese beeches the most narrow; European beeches occurred in the driest climate, Japanese beeches the most humid. Climatic spaces for Chinese beech species were between those of American and European species. Main conclusions The distributional limits of beech species were primarily associated with thermal factors, but moisture regime also played a role. There were some regional differences in the climatic correlates of distribution. The growing season temperature regime was most important in explaining distribution of Chinese beeches, whilst their northward distribution was mainly limited by shortage of precipitation. In Japan, distribution limits of beech species were correlated with summer temperature, but the local dominance of beech was likely to be dependent on snowfall and winter low temperature. High summer temperature was probably a limiting factor for southward extension of American beech, while growing season warmth seemed critical for its northward distribution. Although the present distribution of beech species corresponded Journal of Biogeography (J. Biogeogr.) (2006) 33, 1804–1819 1804 www.blackwellpublishing.com/jbi ª 2006 The Authors doi:10.1111/j.1365-2699.2006.01533.x Journal compilation ª 2006 Blackwell Publishing Ltd
Transcript

ORIGINALARTICLE

Climatic limits for the present distributionof beech (Fagus L.) species in the worldJingyun Fang1* and Martin J. Lechowicz2

1Department of Ecology, College of

Environmental Sciences, and Centre for

Ecological Research & Education, Peking

University, Beijing 100871, China and 2Biology

Department, McGill University, 1205 Dr

Penfield Avenue, Montreal, Quebec, Canada

H3A 1B1

*Correspondence: Jingyun Fang, Department ofEcology, College of Environmental Sciences,Peking University, Beijing 100871, China.E-mail: [email protected]

ABSTRACT

Aim Beech (Fagus L., Fagaceae) species are representative trees of temperatedeciduous broadleaf forests in the Northern Hemisphere. We focus on the

distributional limits of beech species, in particular on identifying climatic factors

associated with their present range limits.

Location Beech species occur in East Asia, Europe and West Asia, and North

America. We collated information on both the southern and northern rangelimits and the lower and upper elevational limits for beech species in each region.

Methods In total, 292 lower/southern limit and 310 upper/northern limit sites

with available climatic data for all 11 extant beech species were collected by

reviewing the literature, and 13 climatic variables were estimated for each sitefrom climate normals at nearby stations. We used principal components analysis

(PCA) to detect climatic variables most strongly associated with the distribution

of beech species and to compare the climatic spaces for the different beechspecies.

Results Statistics for thermal and moisture climatic conditions at the lower/southern and upper/northern limits of all world beech species are presented. The

first two PCA components accounted for 70% and 68% of the overall variance in

lower/southern and upper/northern range limits, respectively. The first PCA axisrepresented a thermal gradient, and the second a moisture gradient associated

with the world-wide distribution pattern of beech species. Among thermalvariables, growing season warmth was most important for beech distribution, but

winter low temperature (coldness and mean temperature for the coldest month)

and climatic continentality were also coupled with beech occurrence. Themoisture gradient, indicated by precipitation and moisture indices, showed

regional differences. American beech had the widest thermal range, Japanese

beeches the most narrow; European beeches occurred in the driest climate,Japanese beeches the most humid. Climatic spaces for Chinese beech species were

between those of American and European species.

Main conclusions The distributional limits of beech species were primarily

associated with thermal factors, but moisture regime also played a role. There

were some regional differences in the climatic correlates of distribution. Thegrowing season temperature regime was most important in explaining

distribution of Chinese beeches, whilst their northward distribution was mainly

limited by shortage of precipitation. In Japan, distribution limits of beech specieswere correlated with summer temperature, but the local dominance of beech was

likely to be dependent on snowfall and winter low temperature. High summer

temperature was probably a limiting factor for southward extension of Americanbeech, while growing season warmth seemed critical for its northward

distribution. Although the present distribution of beech species corresponded

Journal of Biogeography (J. Biogeogr.) (2006) 33, 1804–1819

1804 www.blackwellpublishing.com/jbi ª 2006 The Authorsdoi:10.1111/j.1365-2699.2006.01533.x Journal compilation ª 2006 Blackwell Publishing Ltd

INTRODUCTION

Beech (Fagus L., Fagaceae) are among the most representative

trees in the temperate deciduous broadleaf forests of the

Northern Hemisphere (Shen, 1992; Denk, 2003). The genus

includes ten primary species and two minor segregates (Willis,

1966) broadly distributed in three isolated regions: East Asia,

Europe and West Asia, and North America. Six species occur

in East Asia (F. engleriana, F. longipetiolata, F. lucida and

F. hayatae in China and F. crenata and F. japonica in Japan)

(Horikawa, 1972; Editorial Committee for Flora of China,

1999), two in Europe and West Asia (F. sylvatica and

F. orientalis) (Jalas & Suominen, 1972–91), and one in North

America (F. grandifolia) (Little, 1965, 1979). Some studies have

recognized two additional beech species, one on a small island

off Korea: F. multinervis (Kim et al., 1986; Kim, 1988) and

another one in the north-eastern mountains of Mexico:

F. mexicana (e.g. Miranda & Sharp, 1950; Rzedowski, 1983;

Maycock, 1994; Peters, 1995). Fagus multinervis is a segregate

of F. engleriana in China (Okubo et al., 1988; Peters, 1992;

Shen, 1992; Denk, 2003); F. mexicana is a segregate of the

North American F. grandifolia. For the purposes of the present

study we accept the validity of both segregate species.

In East Asia, beech occurs primarily in mountain areas. All

Chinese beeches are restricted to remote subtropical/warm-

temperate mountain areas, ranging from south China to the

Yangtze River (c. 33! N), and from the south-east coast of the

East China Sea to the eastern edge of the Tibetan Plateau

(Tsien et al., 1975; Wu, 1980; Hou, 1988; Hong & An, 1993;

Cao et al., 1995). Compared with the continuous distribution

of other Chinese beeches, F. hayatae is isolated in three very

limited mountain areas: north-east Taiwan, eastern Zhejiang

and north-west Sichuan. Unlike beech in other regions,

Chinese beeches rarely form pure stands but typically occur

mixed with various deciduous broad-leaved trees (Betula, Acer,

Liriodendron, Davidia, Tilia, Carpinus and Nyssa), evergreen

broad-leaved trees (Lithocarpus, Cyclobalanopsis, Manglietia

and Castanopsis) and evergreen needle-leaved (Tsuga) trees

(Wu, 1980; Hou, 1983, 1988; Hsieh, 1989; Cao, 1995; Fang

et al., 1996).

Two beech species, F. crenata and F. japonica, are native to

Japan. The former is distributed from Kyushu (c. 30.5! N) tosouthern Hokkaido (c. 42.8! N), whereas the latter is limited

to the south of Iwate-ken (Horikawa, 1972; Miyawaki, 1980–

89). Beech forest in Japan falls into two broad forest types: the

Pacific-Ocean-side type that grows intermixed with many

other temperate tree species, and the Japan-Sea-side type

where beech is frequently dominant (Yamazaki, 1983; Maeda,

1991). Forests with F. multinervis are restricted to a small

island, Ulreung-do in South Korea, and they are more or less

similar in community composition and structure to Japanese

beech forests of the Japan-Sea-side type (Kim et al., 1986; Kim,

1988).

In North America, F. grandifolia is one of the most

widespread species among temperate trees, covering almost

all the temperate zone along the Appalachian Mountains from

the northern edge of the subtropical zone almost to the

southern edge of the boreal zone (USDA Forest Service, 1975).

A number of studies have shown large differences in commu-

nity composition and structure in different climatic regions

(Braun, 1967; Barnes, 1991; Maycock, 1994). Based on

differences in geographical distribution and morphological

characters, three races of F. grandifolia (grey beech, white

beech, and red beech) have been identified (Camp, 1951;

Braun, 1967; Maycock, 1994) but these have never been given

species status.

Another beech species in North America, F. mexicana, is

found in only four montane localities in north-eastern Mexico

(Little, 1965; Rzedowski, 1983). Its community characters are

more or less similar to those of Chinese beech forests, usually

mixing with many species of Quercus, Magnolia, Acer and

Carya (Miranda & Sharp, 1950; Rzedowski, 1983; Peters, 1995;

Williams-Linera et al., 2000).

In Europe, F. sylvatica spreads from Sicily in southern Italy

(c. 37.7! N) to Bergen in south Norway (c. 60.7! N) (Jalas &Suominen, 1972–91; Feoli & Lagonegro, 1982; Jahn, 1991); this

is the most widely distributed of all beech species. Fagus

orientalis replaces F. sylvatica in a small region of southeast

Europe and spreads into West Asia: northern Turkey, the

Caucasus and the Elburz Mountains of northern Iran, where

well to the contemporary climate in most areas, climatic factors could not

account for some distributions, e. g., that of F. mexicana compared to its closerelative F. grandifolia. It is likely that historical factors play a secondary role in

determining the present distribution of beech species. The lack of F. grandifolia

on the island of Newfoundland, Canada, may be due to inadequate growingseason warmth. Similarly, the northerly distribution of beech in Britain has not

reached its potential limit, perhaps due to insufficient time since deglaciation to

expand its range.

KeywordsClimatic index, climatic space, continentality, Fagus, growing season warmth,precipitation, principal components analysis, range limit, temperate forest.

Climatic limits for world beech distribution

Journal of Biogeography 33, 1804–1819 1805ª 2006 The Authors. Journal compilation ª 2006 Blackwell Publishing Ltd

the climate is more or less continental (Jalas & Suominen,

1972–91; Davis, 1982).

The three regions where beech species occur are controlled

by different air masses and have various topographic settings. A

monsoon climate prevails in East Asia with cold and dry air

masses from Siberia predominant in winter and hot, humid

subtropical highs from the Pacific Ocean predominant in

summer. This causes abundant summer rainfall and high

temperature after a dry and cold winter (Arakawa, 1969; Shen,

1986). The Himalayan Range, higher to the west and lower

eastwards in mainland China, intensifies this climatic difference

between winter and summer (Chang, 1983; Fang et al., 1996)

on the continent in comparison to the Japanese archipelago.

In eastern North America, the climate is governed by two

major circulations: cold and dry air masses from the Arctic and

moist warm air masses from the southern tropical seas, and

therefore the climatic patterns resemble more or less those in

East Asia. However, there is no topographic barrier akin to the

Himalayas to block meridional air mass exchange (Lydolph,

1985).

The European and West Asian region has a narrower

seasonal cycle of temperatures and rainfall than the two other

regions. In Europe, the air masses resemble those of western

Northern America, but are much influenced by topography.

The east–west trend of European mountain ranges reduces

northward invasion of large subtropical bodies of warm air,

and the Mediterranean Sea also plays a role in the generation

and routes of cyclonic storms (Lydolph, 1985).

The floristic, climatic and topographic patterns of these

regions where beech occurs have attracted the attention of

previous investigators. For example, using Fagus pollen data

and monthly mean temperature, Huntley et al. (1989) studied

climatic control of beech distribution and abundance in

Europe and North America. Peters (1992) and Peters &

Poulson (1994) compared tree growth, and community

structure and dynamics of the world beech species. Maycock

(1994) documented detailed information on differences in

community composition between North American and

Japanese beeches. Iverson & Prasad (1998) used forest

inventory data to estimate the climate envelope for

F. grandifolia and predict its range extension under climate

change. Piovesan & Adams (2001) compared masting beha-

viours of beech from Europe, eastern North America and

Japan, and discussed their links to climatic variations. In

addition, some case studies on relationships between beech

distribution and climates have been conducted, but most are

restricted to single species in a region (e.g. Birks, 1989; Cao

et al., 1995; Sykes et al., 1996).

Taken together, the studies mentioned above provide useful

ecological comparisons among beech species in the three

regions where they occur, but many questions remain about

relationships between beech distribution and climate. For

example, how different are the geographical patterns shown in

the three separate regions where beech species occur? What

climatic factors control such patterns? Can contemporary

climate explain the present distribution of beech species?

Answering these questions is not only important in biogeog-

raphy, but also will provide a firmer basis for predicting the

effects of climate change on the future distribution of beech

species. Focusing on distribution limits (lower or southern and

upper or northern limits) of the world beech species, we

therefore compare their climatic spaces to detect possible

factors limiting their distributions.

DATA AND METHODS

Data sets for beech distribution

Data sets for beech distribution were assembled by reviewing

ecological, botanical and geographical journals, books and

reports to record the geographical location, lower and upper

elevational limits, and associated information (e.g. topography,

climate and community characteristics) for each site where a

beech species was reported to occur. Vertical distribution ranges

were reported especially frequently in East Asia, but less often in

Europe andNorth America where topographic relief at the range

limits of beech species is less extreme. We assembled data for

F. grandifolia from a silvicultural atlas (USDA Forest Service,

1975) and ancillary literature reports. We found relatively little

data for F. sylvatica and F. orientalis; the map of Jalas &

Suominen (1972–91) yielded data on northern range limits for

these species, but high relief and uncertain elevational distribu-

tions left the southern limits undefined.

When latitude and longitude were not reported for study

locations, we used gazetteers to georeference the sites: (1)

China Places Name (Anon., 1986) and Atlas of Land Use in

China (Editorial Committee of 1/1,000,000 Land-use Map of

China, 1990) for Chinese beeches; (2) Gazetteer to AMS

1 : 250,000 Maps of Japan (Corps of Engineers, US Army,

1956) and The National Atlas of Japan (Geographical Survey

Institute, 1977) for Japanese beeches; (3) American Places

Dictionary (Abate, 1994) for American beech; and (4) Atlas of

the World (Times, 1992) for others. In total we identified 350

sites with reliable data for the lower/southern limits and 353

sites for the upper/northern limits of beech species (Table 1;

Fang, 2003). For detailed information on the location and

elevation of distribution limits for each beech species, see

Appendix S1 in Supplementary Material.

Climatic data

We used monthly mean temperatures and monthly precipita-

tion records from the following data sources: (1) China

Meteorological Agency (1984); (2) Japan Meteorological

Agency (1972); (3) Central Meteorological Office of Korea

(1972); (4) National Climatic Center, NOAA (1983) for USA;

(5) Atmospheric Environmental Service, Environment Canada

(1982) for Canada; and (6) Wernstedt (1972) for Mexico,

Europe and West Asia. The period of record for most stations

was 1951–80 or 1941–71.

Temperatures at altitudes of the upper and lower

elevation limits of beech were estimated for each locality

J. Fang and M. J. Lechowicz

1806 Journal of Biogeography 33, 1804–1819ª 2006 The Authors. Journal compilation ª 2006 Blackwell Publishing Ltd

using a mean lapse rate of 0.6 !C per 100 m (Barry, 1992)

together with data from the nearest climatic station. The

rainfall data for each beech site were estimated from

relationships between precipitation and elevation regressed

by using rainfall and altitude data at more than five climatic

stations close to the beech site. Similar to Huntley et al.

(1989), distances between beech sites and climatic stations

were less than 0.5! of latitude and 1.0! of longitude (c. 50–

100 km radius). In total, we secured reliable climate data for

292 sites at the lower/southern limit and 310 sites at the

upper/northern limit of beech species.

Climatic parameters

Growing season warmth

The distribution limits of many tree species are closely related

to growing season temperature (e.g. Kira, 1945, 1991; Hold-

ridge, 1947; Tuhkanen, 1980; Woodward, 1987; Prentice et al.,

1992; Sykes et al., 1996). We used Kira’s Warmth Index (WI)

(Kira, 1945, 1991) and Holdridge’s annual biotemperature

(ABT) (Holdridge, 1947) as proxies for growing season

warmth, given respectively by:

WI ¼X

ðT # 5Þ ðfor months in which T > 5 %CÞ ð1Þ

ABT ¼P

T

12ðfor months in which 0 < T < 30 %CÞ ð2Þ

Coldness and winter temperature summation

A number of studies have shown the importance of minimum

winter temperatures in controlling distributional limits of

plant species (e.g. Sakai & Weiser, 1973; Woodward, 1987;

Sykes et al., 1996; Pederson et al., 2004). Mean temperature for

the coldest month (MTCM) is often used as a surrogate for the

minimum winter temperature (Solomon, 1986; Ohsawa, 1990;

Prentice et al., 1992; Sykes et al., 1996). In this study, the

coefficient of determination (R2) between these two variables

was 0.94 (P < 0.0001, n ¼ 602), so we also used the more

readily available MTCM as a measure of coldness.

Previous studies also suggest that cumulative winter tem-

perature is important for the northward/upward distributions

of warm-temperate and tropical tree species (Kira, 1948, 1991;

Hattori & Nakanishi, 1985; Fang & Yoda, 1991), and for spring

budburst of many northern tree species (Prentice et al., 1992;

Lechowicz, 2001). We used Kira’s Coldness Index (CI) (Kira,

1948, 1991) to express the cumulative winter temperature:

CI ¼ #X

ð5# TÞ ðfor months in which T < 5 %CÞ ð3Þ

Annual mean temperature and mean temperature for thewarmest month

Annual mean temperature (AMT) and mean temperature for

the warmest month (MTWM) are often used to explain

northward and upward distribution of northern tree species

(Walter, 1979; Tuhkanen, 1980; Ohsawa, 1990, 1991).

Climatic continentality

Wolfe (1979), Tuhkanen (1980), Ohsawa (1990) and Fang

et al. (1996) have addressed the effect of climatic continentality

on distribution of some tree species. We used the annual range

of monthly mean temperatures (ART) and Gorcynski’s (1922)

continentality index (K):

K ¼ 1:7& R

sin L

! "# 20:4 ð4Þ

where R is the annual range of monthly mean temperature in

!C and L is the latitude in degrees.

Moisture variables

To assess moisture regime, we considered annual precipita-

tion (AP, mm), potential evapotranspiration (PET, mm),

annual actual evapotranspiration (AAE, mm), moisture

index (Im), and the Ellenberg quotient (EQ, !C mm)1).

With the exception of AP and EQ, all moisture parameters

were estimated by the Thornthwaite (1948) method, which

uses two climatic variables commonly recorded at climatic

stations around the world: monthly mean temperature and

monthly precipitation. The Thornthwaite index has proven a

good correlate of vegetation and plant distribution at both

Table 1 Sample size for distribution limits of all world beechspecies. Data set for Fagus grandifolia was mainly extracted fromits southern and northern distributional edges, and the northernlimit of F. sylvatica actually lies to the north-east according to themap of Jalas & Suominen (1972–91)

Species Distribution

Lower

limit

Upper

limit

F. crenata Pacific Ocean side, Japan 42 46

F. japonica Japanese Sea side, Japan 28 22

F. engleriana South and southwest China 34 36

F. hayatae Taiwan, Zhejiang,

and Sichuan, China

8 10

F. longipetiolata South, east, and

southwest China

55 55

F. lucida East, and Central China 60 54

F. multinervis Ulreung-do, South Korea 1 1

F. grandifolia* Eastern North America 80 80

F. mexicana Northeastern Mexico 4 4

F. sylvatica! Europe 32 40

F. orientalis Southeast Europe

and West Asia

6 5

Total 350 353

*Most data for southern or northern extremes.

!Most data for northern edge.

Climatic limits for world beech distribution

Journal of Biogeography 33, 1804–1819 1807ª 2006 The Authors. Journal compilation ª 2006 Blackwell Publishing Ltd

regional and global scales (e.g. Mather & Yoshioka, 1968;

Fang & Yoda, 1990; O’Brien, 1993; Frank & Inouye, 1994).

For calculation of PET, AA and Im, see Fang (1989) and

Fang & Yoda (1990).

The EQ is the ratio of the MTWM to annual precipitation

and is frequently used to show the climatic limit of beech in

Europe (Ellenberg, 1986; Jahn, 1991). According to Jahn

(1991), values below 20 show a pure ‘beech climate’; the

competitive vigour of beech slowly decreases with an increase

from 20 to 30; and in Europe beech disappears in regions with

an EQ over 30:

EQ ¼ Warmest month’s mean temperature in %C

Annual precipitation ðmmÞ & 1000

ð5Þ

Principal components analysis

We used principal components analysis (PCA) (Wilks, 1995)

to: (1) examine which climatic variables are most associated

with the distribution of beech species, and (2) compare the

climatic space at distributional limits for beech species in the

three regions.

To assess the influence of the diverse climatic variables, we

compared the eigenvalues of different PCA axes for each

species and the axis loadings of climatic variables for the

species that have a large sample size. In general, variables with

bigger loadings are considered more important in placement

along PCA axes when variables are standardized to allow for

differences in units and magnitude (Wilks, 1995). We analysed

13 climatic variables (AMT, WI, CI, ABT, MTWM, MTCM,

ART, K, AP, PET, AAE, Im and EQ) using PC-ORD software

(McCune & Mefford, 1999). To minimize the differences

associated with differing units and magnitude, all the variables

were standardized:

x0i ¼xi # !x

rð6Þ

where xi and x0i are the original and standardized value of a

climatic variable for the ith site, !x is average of the climatic

variable for all the sites, and r is the standard deviation of the

climatic variable. To compare climate spaces among the beech

species, we used the eigenvalues of the first two components

for each beech site. To illustrate the climate space for species

with sufficiently large sample sizes, we calculated a 50%

Gaussian bivariate confidence ellipse (ELL) using sysgraph

(SYSTAT Inc., 1996).

RESULTS

Climatic statistics at the distribution limits

Table 2 lists the average for thermal and moisture climatic

parameters at lower/southern and upper/northern limits for

all beech species; the details for the statistics (average, SD and

range) of these variables are displayed in Table S1 in the

Supplementary Material. The descriptions that follow are

supported by both Table 2 and Table S1.

In East Asia, in spite of large fluctuations within and among

species, average values of growing season warmth at the lower

limits of beech distribution were between 74.8 !C (F. crenata)

and 115.9 !CÆmonth (F. longipetiolata) for Warmth Index

(WI) and between 9.8 and 14.3 !C for annual biotemperature

(ABT) (Table 2). Interestingly, most of the seven Asian beech

species had lower limits associated with very similar average

thermal parameters (AMT of 11.7–12.8 !C, WI of 91.8–

100.6 !CÆmonth, ABT of 11.7–12.8 !C, MTWM of 22.4–

23.9 !C and MTCM of 0.1–2.1 !C) even though the

species have widely disparate ranges (F. japonica in Japan,

F. multinervis in Korea and others in China). Only two species,

F. crenata from colder climates and F. longipetiolata in warmer

regions, are exceptions. The thermal variables at the upper

limit of East Asian beeches showed smaller fluctuation for

most species with an AMT value of 7.3–9.2 !C, WI of 56.0–

70.3 !CÆmonth, and ABT of 8.1–9.5 !C (Table 2), but

F. crenata is an exception. Fagus crenata has a WI value

of 45.1 !CÆmonth, approximately the climatic threshold

(45 !CÆmonth) of the cool-temperate zone defined by Kira

(1991).

With regard to moisture regime, all beech species locations

in East Asia fall within an average Im range of 61.4–189.9 for

their lower limits and 70–241.3 for their upper limits, denoting

a humid or perhumid climate according to the Thornthwaite

(1948) system (Table 2).

In North America, F. grandifolia showed the widest climatic

space, with average WI ranging from 50.7 !CÆmonth (northern

limit) to 173.4 !CÆmonth (southern limit), and ABT from 7 to

19.5 !C. This spans two bioclimatic zones: cool-temperate

(45–85 !CÆmonth for WI and 6–12 !C for ABT) and warm-

temperate zone (85–180 !CÆmonth for WI and over 12 !C for

ABT). Although F. mexicana is distributed much farther south

than F. grandifolia, it has a smaller climatic range (117.1–

127.3 !CÆmonth in WI and 14.8–15.6 !C in ABT) and much

smaller thermal variables at its lower limit than those of

F. grandifolia (Table 2). Fagus grandifolia has more moist

conditions at its northern limit with an average Im value of

91.1 compared with 40.3 at its southern limit. Mexican beech

has a much larger Im average value (Im ¼ 103) at its

elevational and southern limit.

In Europe, the climatic spaces of beech species span almost

the entire temperate zone. Growing season warmth in the

range of beech ranged from 47.7 to 104.3 !CÆmonth for

WI and 7.2–13.5 !C for ABT for F. sylvatica, and 46.3–

78.3 !CÆmonth for WI and 7.1–10.4 !C for ABT for F. orientalis

(Table 2). It is noteworthy that F. sylvatica has a rather narrow

climatic range despite having the widest latitudinal range

among the world beech species (spanning c. 23!) (Jalas &

Suominen, 1972–91). In comparison with beech species in

other regions, the moisture regime in the area of European

beech species is relatively dry, with average precipitation of

905.9 mm, mean Im value of 38, and mean EQ of 29 !C mm)1

for the lower limit of F. sylvatica, and 1272.3 mm, 119.3 and

J. Fang and M. J. Lechowicz

1808 Journal of Biogeography 33, 1804–1819ª 2006 The Authors. Journal compilation ª 2006 Blackwell Publishing Ltd

Table

2Average

forclim

aticvariablesat

lower

(sou

thern)andupper

(northern)lim

itsof

distribution

forworld

beech(Fagus)species.AMT:annualmeantemperature;WI:warmth

index;CI:

coldnessindex;A

BT:annualbiotem

perature;M

TWM:m

eantemperature

forthewarmestmon

th;M

TCM:m

eantemperature

forthecoldestmon

th;A

RT:annualrange

ofmeantemperature;K

:continentalityindex;AP:annualprecipitation;PET:annualpotentialevapotranspiration;AAE:actualannualevapotranspiration;Im

:moisture

index;andEQ:Ellenberg

quotient.–indicates

no

estimation

Species

Low

er/upper

limits

AMT

(!C)

WI

(!CÆm

onth)

CI

(!CÆm

onth)

ABT

(!C)

MTWM

(!C)

MTCM

(!C)

ART

(!C)

K

AP

(mm)

PET

(mm)

AAE

(mm)

Im

EQ

(!Cmm

)1)

F.engleriana

Low

er12.4

99.0

)10.1

12.5

23.0

1.1

21.9

53.3

1230

805.4

803.3

61.4

21.7

Upp

er7.3

56.0

)28.1

8.1

17.8

)3.9

21.7

52.8

1366

795.6

793.5

70.0

19.4

F.hayatae

Low

er12.8

99.4

)6.4

12.8

22.4

2.1

20.3

50.7

1670

914.6

914.6

85.5

17.0

Upp

er9.2

67.0

)16.6

9.5

18.6

)0.7

19.3

46.3

2233

887.0

887.0

109.8

13.2

F.longipetiolata

Low

er14.3

115.9

)4.1

14.3

24.2

3.5

20.8

54.1

1421

845.4

831.8

77.5

19.0

Upp

er8.9

66.2

)19.8

9.2

18.9

)2.0

20.9

54.2

1738

621.2

619.2

132.6

14.7

F.lucida

Low

er12.7

100.6

)8.2

12.8

23.0

1.5

21.5

57.8

1419

874.0

862.7

70.0

19.5

Upp

er8.8

66.4

)21.3

9.2

19.1

)2.4

21.5

57.8

1757

674.4

671.7

168.5

13.8

F.crenata

Low

er9.5

74.8

)21.3

9.8

21.8

)2.1

23.9

48.5

2047

706.2

706.2

189.9

12.5

Upp

er5.0

45.1

)45.2

6.7

17.6

)6.8

24.4

48.8

2660

606.8

606.8

241.3

9.5

F.japonica

Low

er11.7

91.8

)12.0

11.7

23.9

0.3

23.7

48.8

1805

746.6

746.6

142.0

15.3

Upp

er9.0

70.3

)21.9

9.4

21.2

)2.2

23.4

48.6

2329

716.4

716.4

206.5

11.5

F.multinervis

Low

er11.5

90.2

)11.9

11.5

23.4

0.1

23.3

45.0

1485

702.6

702.6

111.3

16.1

Upp

er7.6

59.0

)27.5

8.3

19.5

)3.8

23.3

45.0

––

––

F.grandifolia

Low

er19.5

173.4

019.5

27.5

10.4

17.1

36.8

1426

1024.0

996.9

40.3

19.5

Upp

er4.2

50.7

)60.5

7.0

18.4

)11.4

29.8

49.5

1021

537.8

530.5

91.1

18.5

F.mexicana

Low

er15.6

127.3

015.6

19.6

10.5

9.1

22.2

1741

949.0

906.0

103.1

14.5

Upp

er14.8

117.1

014.8

18.7

9.7

9.1

22.2

––

––

F.sylvatica

Low

er13.5

104.3

)2.7

13.5

23.0

4.7

18.2

27.7

906

749.8

497.1

38.1

29.0

Upp

er6.6

47.7

)28.3

7.2

16.9

)2.7

19.6

25.8

1272

577.6

496.7

119.3

16.8

F.orientalis

Low

er10.2

78.3

)16.2

10.4

20.5

)1.5

22.0

38.1

745

717.2

486.5

15.4

32.7

Upp

er6.5

46.3

)28.5

7.1

16.1

)3.2

19.3

31.5

912

668.9

460.3

23.8

27.9

Climatic limits for world beech distribution

Journal of Biogeography 33, 1804–1819 1809ª 2006 The Authors. Journal compilation ª 2006 Blackwell Publishing Ltd

16.8 !C mm)1 for AP, Im and EQ for its upper/northern limit.

For F. orientalis, AP, Im and EQ were, respectively, 744.8 mm

and 32.7 !C mm)1 for its lower limits, and 911.8 mm, 23.8

and 27.9 !C mm)1 for its upper limit. It is apparent that

climate at the lower limits of both beeches is rather dry, close

to the EQ threshold of 30 !C mm)1 suggested by Jahn (1991).

The EQ value of European beeches is much smaller than for

beech species in other regions: ranging from 15 to 20 !C mm)1

for the lower/southern limit and from 11.5 to 19.4 !C mm)1

for the upper/northern limit for other regions, with the

smallest value (12.5 and 9.5 !C mm)1 for its lower and upper

limits, respectively) for F. crenata (Table 2).

Climatic factors controlling beech speciesdistributions

We used the 13 climatic variables in a PCA to identify limiting

factors for beech distribution. To assess regional variations in

the relationships between geographic distribution and climatic

space, we combined four Chinese beeches and two European

beeches into the same group because they have similar climate

ranges (cf. Table S1). The two Japanese beeches occur

primarily in two different climatic regions (Japan Sea side

and Pacific Ocean side), and thus we did not deal with them as

a single group. The first two principal components account for

70% and 68% of overall variance for southern/lower and

northern/upper limits of all species, respectively (Table 3).

Accordingly we considered the loadings on these axes to be

most important in delimiting beech distribution. For each

beech region, the first two PCA axes explained more than

70% of the variance; for example, 80% and 87% for the

southern and northern limits of Amerian beech, respectively,

and 73–80% for F. japonica and the European beeches.

The first PCA axis represents a thermal gradient, and the

second a moisture gradient in the overall distribution of world

beech species (Table S2 in Supplementary Material). In general

the thermal climate played a leading role and precipitation a

secondary role in controlling the large-scale distribution of

beech species. Among thermal variables, AMT, WI and ABT

always showed larger loadings at both lower/southern and

upper/northern limits, but CI and MTCM exhibited a large

value for world beech species (Table S2). This indicates that

growing season warmth is most important for beech distribu-

tion, and CI and MTCM are also closely coupled with the

potential for their range expansion. The second PCA axis

exhibited a different trend: for the lower/southern limit the

loadings of AP, Im and EQ were 0.83 mm, 0.84 and

)0.89 !C mm)1, while for the upper limit/northern they were

)0.83 mm, )0.92 and 0.89 !C mm)1, respectively (Table S2).

The negative loadings of AP and Im indicate that altitude

limits for beech species are negatively correlated with moisture

climate, implying that the altitude of the upper elevational

limit decreases with an increase of precipitation.

In spite of these overall trends, some component loadings

varied across regions, suggesting that limiting climatic factors

shifted somewhat among beech in different regions. In general,

both the lower/southern and upper/northern limits in all three

beech regions depended on seasonal thermal regimes (loadings

of growing season warmth (WI and ABT) on the first PCA axis

were largest, and winter temperatures (CI and MTCM) also

showed a large influence), but the two Japanese beech species

were an exception. For the second PCA axis, the loadings of

moisture climate variables were largest for the lower/southern

limit, indicating the general influence of a moisture gradient.

However, for the upper/northern limit, the climatic variables

with the largest loading showed a large regional difference. The

second axis for Chinese beech suggests a moisture regime

gradient, while the loading of winter coldness (CI) was largest

for European beeches, and MTCM had the largest loading for

American beech.

For the lower limit of the two Japanese beeches, winter

temperature (CI and MTCM) had a large loading on the first

axis, summer temperature (MTWT) on the second. This

suggests that moisture regime is not a limiting factor for the

downward distribution of these two species due to abundant

precipitation in Japan, which agrees with other studies (e.g.

Maeda, 1991). For the upper limit of these two species, on the

second axis, the loadings of PET and AAE for F. crenata and of

MTWT and moisture indices (Im and EQ) for F. japonica were

largest.

It is noteworthy that PET, an indicator of total solar energy,

showed the largest loading (0.98) on the first axis for the

northern limit of American beech; this is consistent with the

correlation between PET and vegetation distribution and

overall tree species richness in North America (Stephenson,

1990; Francis & Currie, 2003).

DISCUSSION

Zonal distribution of world beech species

Although most beech species are considered typical trees of the

temperate zone, they in fact showed different climatic ranges in

the three regions where they occur (Table 2; Table S1). In East

Table 3 Proportion (%) of cumulative variance on the first fourprincipal components in a principal components analysis of thedistribution limits for world beech (Fagus) species

Species

Lower (southern) limit Upper (northern) limit

PCA

1

PCA

2

PCA

3

PCA

4

PCA

1

PCA

2

PCA

3

PCA

4

Chinese

beeches

46.34 69.89 83.71 96.69 41.19 73.56 89.04 96.12

F. crenata 37.60 71.86 90.25 97.27 50.48 74.57 88.08 96.49

F. japonica 47.98 72.96 88.70 98.34 49.27 80.20 90.85 97.71

F. grandifolia 59.25 79.76 91.69 98.77 54.46 86.65 96.99 99.12

European

beeches

43.65 76.86 87.73 94.73 40.45 71.79 88.01 97.26

All beech

species

50.71 69.89 84.98 94.28 44.89 67.57 83.72 93.79

J. Fang and M. J. Lechowicz

1810 Journal of Biogeography 33, 1804–1819ª 2006 The Authors. Journal compilation ª 2006 Blackwell Publishing Ltd

Asia, most species, excluding F. crenata, concentrated within a

climatic range of 90–116 !CÆmonth in WI and 11.7–14.3 !C in

ABT in their lower limits, and 56–70 !CÆmonth in WI and

c. 8.1–9.5 !C in ABT in their upper limits. This is to say, the

boundaries for most Asian beech species are located in warmer

places than the cool-temperate zone defined by Kira (1945,

1991) and Holdridge (1947); the climatic parameters at the

southern/lower edge of the cool-temperate zone was set at

85 !CÆmonth in WI by Kira, and 12 !C in ABT by Holdridge,

and 45 !CÆmonth in WI and 8 !C in ABT at the northern or

upper limit. This suggests that beech species occupy an ecotone

between cool-temperate deciduous broadleaf forest (a WI

range of 45–85 !CÆmonth) and warm-temperate evergreen

broadleaf forest (WI > 85 !CÆmonth) (Kira, 1991). However,

the WI value at the upper limit of F. crenata in Japan

(45.1 !CÆmonth) coincided well with Kira’s criterion of 45 !Cmonth; this supports the idea that F. crenata is an indicator of

the Japanese temperate zone (e.g. Miyawaki, 1980–89).

American beech occupies a large climatic space, with a range

of 50.7–173.4 !CÆmonth in WI and 7.0–19.5 !C in ABT

(Table S1). This spans two bioclimatic zones: the cool-

temperate zone [45–85 !CÆmonth for WI (Kira, 1945, 1991)

and 6–12 !C for ABT (Holdridge, 1947)], and the warm-

temperate zone (85–180 !C month for WI and > 12 !C for

ABT).

In Europe, climatic parameters at the northern/upper limit

of beech distribution indicated good agreement with criteria

defining the cool-temperate zone: a WI value of 47.7–

104.3 !CÆmonth, and an ABT value of 7.2–13.5 !C for

F. sylvatica, and 46.3–78.3 !CÆmonth and 7.1–10.4 !C for

F. orientalis (Table S1). On the other hand, an average Im

greater than 15.4 for all beech sites suggest a perhumid or

humid climate, defined by Thornthwaite (1948) as Im values of

20–100 and > 100, respectively.

Climates and present distribution of East Asianbeeches

As shown in Table 3, the first two PCA components account

for more than 70% of the variance in parameters associated

with the distribution of Asian beech species. No one variable

alone can explain beech distributional patterns; growing season

warmth (WI and ABT), winter low temperature (CI) and

annual mean temperature (AMT) all showed almost equal

loadings (Table S2). Thermal regime is clearly paramount in

the relationships between beech distribution and climatic

factors in East Asia, but the strong correlation among different

climatic elements (see Table S3 in Supplementary Material)

precludes identification of a single, dominant aspect of thermal

regime that affects the distribution of East Asian beech species.

There are a few viewpoints on the relationships between the

present distribution of Chinese beech species and limiting

factors. Hong & An (1993) pointed out that the climatic

factors affecting beech distribution varied from place by place;

for example, in northern regions, coldness and short growing

season were major limiting factors, whereas water deficit was

more important for southward migration. Cao et al. (1995)

demonstrated the importance of the moisture deficit in the

northern range of beech species and the importance of high

temperature and insufficient water supply in the south.

Focusing on the relationship between Fagus- and Tsuga-

dominated forests, Fang et al. (1996) suggested possible effects

of the annual temperature range (ART) and high winter

temperature on beech distribution. They found that the beech-

dominated forests did not appear in places where hemlock

dominates, and that their boundary was consistent with an

ART isotherm of 23 !C; beech-dominated forests lay north of

this isotherm and hemlock-dominated forests lay south. This

implies the importance of high winter temperatures in

determining the distribution of Chinese beech because the

ART is closely correlated with winter temperature in southern

mountain areas in China.

Two effects of high winter temperatures that can influence

the distribution of temperate tree species may be playing a role

in beech distribution in China. First, temperate trees require a

sufficient period of winter cold (a period of chilling) before

warming will induce budburst in spring (Cannell & Smith,

1986; Lechowicz, 2001). Second, higher winter temperatures

can reduce the competitive ability of deciduous trees with

more warmth tolerant evergreen broadleaf trees (Woodward,

1987). These effects of winter temperature may explain an

unresolved question in Asian biogeography: why beech species

do not spread westward into the Himalayas and south-eastern

Tibet where growing season warmth and precipitation appear

satisfactory. Although Asian beech and hemlock have similar

heat requirements during the growing season (Liu & Qiu,

1980; Hou, 1983; Fang et al., 1996), hemlock is favoured by a

warm-winter climate (Sakai, 1975). While Chinese beeches

co-exist with evergreen broad-leaved tree species in genera

such as Lithocarpus, Cyclobalanopsis and Castanopsis (Wu,

1980; Hou, 1983; Fang, 1999), there may be a point where a

warm-winter climate tips the competitive balance to evergreen

tree species. Observations from Woodward (1987), Cao

(1995), Williams-Linera et al. (2000) and Miyazawa &

Kikuzawa (2005) support this hypothesis that warm winters

can favour evergreens and limit range expansion in beech

species.

In Japan, growing season warmth rather than winter

temperatures is generally seen as the control on the distribu-

tions of beech species (Kira, 1945; Miyawaki, 1980–89; and

many others), and Japanese cool-temperate vegetation is

sometimes termed the beech forest zone (e.g. Miyawaki,

1980–89). Precipitation is also used to explain differences in

community composition and structure of Japanese beech

forests (Kure & Yoda, 1984; Hattori & Nakanishi, 1985; Fang &

Yoda, 1990; Matsui et al., 2004). In particular, distribution of

F. crenata along the Pacific Ocean side and the Japan Sea side

of Japan usually has been explained by accumulated snowfall

(Yamazaki, 1983; Maeda, 1991; Matsui et al., 2004), with pure

beech forests found only on the Japan Sea side where snowfall

is extremely abundant. Given the situation in China, however,

we should not discount out of hand the possible influence of

Climatic limits for world beech distribution

Journal of Biogeography 33, 1804–1819 1811ª 2006 The Authors. Journal compilation ª 2006 Blackwell Publishing Ltd

low winter temperatures in the development of pure beech

forests on the Japan Sea side. Winter temperature there is

much lower than on the Pacific Ocean side; this could

strengthen the competitive ability of beech against other tree

species (Tsuga and Quercus) and understorey bamboo (Sasa),

and enable its dominance.

A question remains with regard to Japanese beech distribu-

tion: why is there no beech on Yakushima Island (30!27¢ N,130!30¢ E, 1935 m a.s.l.) in southern Japan where the climate

is suitable for beech growth and there are many species that

co-occur with beech in Kyushu, Shikoku and Honshu

(Miyawaki, 1980–89). This may be related to some topo-

graphic barriers or climatic limitations at the time during

glaciation when Yakushima was part of the major Japanese

islands, or simply to dispersal limitation since sea levels rose

and isolated the island. Another possibility worth investigating

is that a combination of warm winters and a photoperiodic

influence on the timing of budburst in beech (Falusi &

Calamassi, 1996) lead to poor synchrony between spring

budburst and the early part of the growing season that puts

beech at a competitive disadvantage.

Climates and the present distribution of Americanbeech

The PCA showed that MTCM and PET have almost equivalent

loadings to growing-season warmth (WI and ABT) for the

southern limit of F. grandifolia, whereas heat (WI and ABT)

and energy (PET) are most important for the northern limit

(Table S2). Although Huntley et al. (1989) demonstrated the

role of January and July mean temperatures in the present

distribution and abundance of beech species in North America

and Europe using pollen percentages of surface samples, they

used only monthly mean temperatures as thermal parameters.

Our findings based on survey of many more climatic

parameters are generally consistent with their conclusions.

Although our study suggested that the growing season

warmth was associated with the northerly distribution limit,

some physiological observations emphasize the adverse effects

of excessively low winter temperatures for many temperate

North American trees (Sakai & Weiser, 1973; Hicks & Chabot,

1985; Denton & Barnes, 1987; Maycock, 1994). Many studies

stress the influence of low winter temperature, but perhaps

only because it is easier to do experimental manipulations of

chilling effects than warmth during the growing season. We

can, however, consider biogeographic evidence supporting the

importance of growing season temperature. The lack of

American beech in Newfoundland, Canada, where winter

temperatures are much higher than at the northern edge of

beech distribution (Table 4) suggests growing season warmth

is a greater limitation than winter cold. Climatic statistics of

thermal variables at 18 stations located between 47! and 48! Nin Newfoundland where the latitudes were coincident with the

northern limit in east Quebec show far higher winter

temperatures (CI and MTCM) in Newfoundland than at the

beech northern limit (in the former, )34.8 !CÆmonth for CI

and )4.2 !C for MTCM, and the latter )60.5 !CÆmonth and

)11.4 !C). In contrast, the growing season temperatures were

much lower in Newfoundland than at the beech northern

limit; for the former, WI, ABT and MTWM were 36.7 !C,6.1 !C and 15.6 !CÆmonth, and for the latter those are 50.7 !C,7.0 !C and 18.4 !CÆmonth, respectively (Table 4). This sug-

gests that insufficient warmth during the growing season may

be a factor limiting the expansion of beech into Newfound-

land. This hypothesis is supported by eco-physiological studies

of flowering and seed production showing that a certain

minimum degree of heat is required for floral initiation, and

flower and seed production in many temperate tree species

(Matyes, 1969; Owens & Blake, 1985). The comparative study

of masting behaviours of beech species also shows the

importance of summer heat in controlling beech seed

production (Piovesan & Adams, 2001).

Although temperature can account for the distribution

limits of American beech, Fig. 1 suggests that continentality

(K) also is important for limiting the southern and northern

distribution limits. The fact that WI and MTCM at the

southern limit decrease markedly with increasing K value

shows that beech requires more heat and higher winter

temperature in an oceanic climate than in a continental one.

However, growing season warmth tends to increase as K

increases at the northern limit (Fig. 1a), suggesting higher

summer temperatures in the continental than in the oceanic

climate. The relationship between winter temperature and K

values at the northern limit shows the same pattern as at the

southern limit (Fig. 1b). Similar results were found for the

distributions of some tree species and vegetation zones in East

Asia (Ohsawa, 1990; Fang & Yoda, 1991; Fang et al., 1996).

Climates and present distribution of beech species inEurope

The relationships between beech distribution and environ-

ments in Europe have been discussed from the viewpoint of

soil, topography and climate (Ellenberg, 1986; Jahn, 1991).

Table 4 Thermal variables for Newfoundland, Canada, based on18 climatic stations (Atmospheric Environmental Service, Envi-ronment Canada, 1982). For comparison, the estimated meanvalue of climate variables at the northern limit of Fagus grandifoliain North America (‘Mean at northern limit’ column) is alsotabulated. See Table 2 for abbreviations for climatic variables

Variable Mean SD Minimum Maximum

Mean at

northern limit

AMT (!C) 5.2 0.5 4.1 5.8 4.2

WI (!C month) 36.7 3.0 30.2 41.6 50.7

CI (!C month) )34.8 4.2 )42.2 )26.3 )60.5ABT (!C) 6.1 0.3 5.3 6.4 7.0

MTWM (!C) 15.6 0.5 14.7 16.4 18.4

MTCM (!C) )4.2 1.1 )6.1 )1.9 )11.4ART (!C) 19.8 1.1 17.2 22.5 29.8

K 25.3 2.6 19.5 31.4 49.5

J. Fang and M. J. Lechowicz

1812 Journal of Biogeography 33, 1804–1819ª 2006 The Authors. Journal compilation ª 2006 Blackwell Publishing Ltd

These earlier studies supported the importance of growing

season temperatures, but did not focus in any detail on the

array of thermal parameters that might be involved. Both

thermal climate and continentality (K) contributed to Euro-

pean beech distributions, much as in North America. Figure 2

expresses the relationships between the thermal variables (WI

and MTCM) and K value at the northern limit of F. sylvatica.

With an increase of the K values, WI increased (Fig. 2a), and

MTCM decreased (Fig. 2b).

Although beech has been present in south-eastern England

since at least 3000 yr bp (Birks, 1989), its present distribution

in the British Isles does not appear to be in equilibrium with

present climate. Climatic analysis shows that beech still has not

reached its potential northern range limit (Table 5). Compared

with averages of climatic variables at the upper/northern

limits on the European mainland (AMT of 6.6 !C, WI of

47.7 !CÆmonth, and ABT of 7.2 !C), those at the present

northern limit in Britain were much larger (more southerly),

by c. 3.4 !C for AMT, 15 !CÆmonth for WI and 2.8 !C for ABT

(Table 5). Assuming a decrease in mean temperatures of

0.5 !C per degree latitude in higher latitudes (Fang, 1996),

beech should arrive at its range limit c. 6! to the north of its

present range boundary. Spreading north at a rate of 100–

200 m yr)1 (Birks, 1989), beech should reach its potential

natural distribution in Britain 3500–7000 years in the future if

one assumes an unchanging climate scenario. This implies that

most of Britain eventually should be covered by beech.

Comparison of climatic space for world beech species

The present distributions ofmost tree species are strongly related

to climate (Woodward, 1987; Huntley et al., 1989; Francis &

Currie, 2003). Simple isotherm methods have long been used to

assess distributional limits in relation to climate (Hutchinson,

1918; Koppen, 1936; Kira, 1945, 1991; Thornthwaite, 1948;

Table 5 Climatic parameters at the northern limit for Fagussylvatica in England based on 11 climatic stations. For comparison,the estimated mean value of climate variables at the northern limitof F. sylvatica on the European mainland (‘Mean at northern limit’column) is also tabulated. See Table 2 for abbreviations forclimatic variables

Variables Mean SD Minimum Maximum

Mean at

northern limit

AMT (!C) 10.0 0.4 9.1 10.7 6.6

WI (!C month) 62.6 3.4 53.8 69.2 47.7

CI (!C month) )2.3 1.2 )4.2 0.0 )28.3ABT (!C) 10.0 0.4 9.1 10.7 7.2

MTWM (!C) 16.8 0.4 15.8 17.6 16.9

MTCM (!C) 3.9 0.6 3.1 5.5 )2.7ART (!C) 12.9 0.7 10.6 13.9 19.6

K 7.7 1.6 2.8 9.8 25.8

AP (mm) 707.2 148.4 540.0 1068.0 1272.3

PET (mm) 646.8 8.6 625.0 661.0 577.6

AAE (mm) 560.6 44.3 497.0 652.0 496.7

Im 14.7 20.4 )8.8 64.2 119.3

EQ (!C mm)1) 24.7 4.8 15.4 32.4 16.8

Figure 1 Relationships between (a) warmth index (WI) and (b)mean temperature for the coldest month (MTCM) and continen-tality index (K) at the southern (filled circles) and northern (opencircles) limits of Fagus grandifolia in North America. The rela-tionships for the northern limits are fit by a nonlinear regression.

Figure 2 Relationships between (a) warmth index (WI) and (b)mean temperature for the coldest month (MTCM) and conti-nentality index (K) at the northern limit of Fagus sylvatica inEurope.

Climatic limits for world beech distribution

Journal of Biogeography 33, 1804–1819 1813ª 2006 The Authors. Journal compilation ª 2006 Blackwell Publishing Ltd

Bryson, 1966; Tuhkanen, 1980; Grace, 1987; Arris & Eagleson,

1989; and many others), but the nuances of climatic controls on

range limits are not assessed fully by isotherms. In this study, we

used a more comprehensive PCA approach to detect the single

and joint importance of diverse climatic parameters in explain-

ing the distribution of beech species. We are thus able to

compare the climatic space of beech distribution among species

in the three separate geographic regions where beech are major

components of forest ecosystems.

Because the first two PCA axes were most important in

explaining the distribution of beech species around the world,

sample scores of these axes were used to compile scatter

diagrams comparing the climatic spaces (climatic niches) of

the respective beech species (Figs 3 and 4). Because of a large

sample size and rather scattered score values, 50% Gaussian

bivariate confidence ellipses (ELL) were drawn for the species

with a large sample size to more easily compare climatic

conditions among beech species. Also, because four Chinese

beeches and two European beeches have similar moisture and

warmth requirements (see Table 2; Table S1), sample data

were combined.

Figures 3 and 4 show climatic gradients associated with

the lower (southern) limit and the upper (northern) limit of

beech. At its lower or southern limits (Fig. 3), F. grandifolia

extends to warmer regions, while F. crenata requires less

warmth, but both Japanese beeches occur in more moist

climates than F. grandifolia. Chinese and European beeches

occupy similar temperature ranges, but the latter is in a

drier climate. At the upper or northern edges (Fig. 4), both

F. grandifolia and F. crenata occupy colder areas, while

Chinese beeches have similar warmth demand to F. japonica.

Along the moisture axis, F. crenata occurs in the most

humid conditions, and European beech in the driest

habitats. Although the actual influence of climatic factors

on species distributions may be nonlinear and only partly

reflected in the present analyses (Austin, 2002), it is clear

that there is a degree of climatic niche differentiation among

the extant beech species.

CONCLUSIONS

Focusing on distribution limits of the world beech species, we

compare their climatic spaces in three different regions

globally, and explore the climatic correlates of these distribu-

tion patterns. The results suggest that thermal climate is most

important overall in determining the distribution of beech

Figure 3 Climatic spaces for world beech (Fagus) species at their lower/southern distribution limit. The first two principal components areplotted. The first axis indicates a gradient in thermal climate and the second a moisture gradient in the overall distribution of world beechspecies. The 50% ELL is drawn for major beech species to show their primary ranges. Inset graph shows climatic scores of four Chinese beechspecies that have similar climatic ranges.

J. Fang and M. J. Lechowicz

1814 Journal of Biogeography 33, 1804–1819ª 2006 The Authors. Journal compilation ª 2006 Blackwell Publishing Ltd

species, and that moisture effects are secondary. The degree

and duration of low winter temperature (MTCM and CI), and

annually available solar energy (PET) sometimes also played a

role. At the lower or southern limits, F. grandifolia occurred in

much warmer regions, and F. crenata in colder regions;

Chinese and European beeches have similar, intermediate heat

requirements. Along moisture gradients, Japanese beeches

appeared in more moist conditions and Chinese and European

beeches in drier situations. At the upper or northern limits,

F. crenata and American beeches had similar, relatively low

warmth demands, while F. japonica and Chinese beeches were

found only in warmer regions. Along a moisture gradient, the

Japanese beech species again occupied the most moist regions,

with European beech in contrast occupying the most dry

(Fig. 4).

Growing season temperature was most important in

explaining overall distribution of Chinese beeches, but their

northern limits were mainly set by low precipitation. The

climatic factor controlling their westward expansion (south-

east Tibet and Himalaya) may be higher winter temperatures

that influence their budburst in spring and weaken their

competitive ability with evergreen hemlock and broad-leaved

evergreen trees. Although the distribution limits of beech

species in Japan were controlled by summer temperature, their

dominance may depend on regional climatic factors such as

snowfall and winter low temperature. Winter low temperature

may enhance the competitive ability of F. crenata with other

co-existing species, allowing it to form pure beech forests in

western Japan.

High summer temperature was considered to be the limiting

factor for southward extension of American beech, while

adequate growing season warmth was critical for its northward

distribution. Continentality (K) played an important part in

delimiting its range expansion, but lack of growing season

warmth was the most important climatic factor precluding its

migration to the Atlantic Islands (such as Newfoundland,

Canada). Summer temperature is a limiting factor for the

distribution of beeches in Europe, but continentality was also

associated with limits to their north-western distribution. The

northerly distribution of beech in Britain has apparently not

reached its potential limit due to lack of time since deglaci-

ation.

Although the present-day distribution patterns of beech

species showed good correspondence to contemporary climate,

Figure 4 Climatic spaces for world beech (Fagus) species at their upper/northern distribution limit. The second axis, indicated byprecipitation and moisture index for most beech species, shows a negative correlation with beech distribution (Table S2 in SupplementaryMaterial); we have inverted the scale of this axis to more easily compare with Fig. 3. The occurrence of F. grandifolia to the lower-left doesnot indicate its northern limit is set by dry conditions; the second axis indicates low winter temperature, but not moisture regime, with theloadings of )0.98 and )0.91 for MTCM (mean temperature for the coldest month) and CI (coldness index) (Table S2), respectively. Foradditional explanations see Fig. 3.

Climatic limits for world beech distribution

Journal of Biogeography 33, 1804–1819 1815ª 2006 The Authors. Journal compilation ª 2006 Blackwell Publishing Ltd

isolated exceptions exist. For example, despite favourable

climatic conditions there are no records of beech ever having

grown on Yakushima Island in Japan. Similarly, F. mexicana,

isolated in a small mountainous area of north-eastern Mexico,

shows no clear association with contemporary climate. There-

fore, a historical view on beech distribution is an essential

complement to the climatic analyses emphasized in this paper.

ACKNOWLEDGEMENTS

Assistance from many colleagues enabled this study. JYF is

greatly indebted to Y.H. Tang for assistance in collecting beech

data in Japan and Korea, C.F. Hsieh for F. hayatae in Taiwan,

and F. Reygadas for Mexican beech. Thanks are extended to

Z.H. Wang and X.P. Wang for their assistance in data analysis,

and to S.P. Wang for her help in compiling climatic data

sets and checking place locations. We also thank Robert

Whittaker and two anonymous referees for their helpful

comments and suggestions on the earlier version of this paper.

This work was mostly done in MJL’s laboratory when JFY

worked as a postdoctoral researcher in 1996–97, and supported

by a Natural Sciences and Engineering Research Council of

Canada grant to MJL and by the National Natural Science

Foundation of China to JYF.

REFERENCES

Abate, F.R. (ed.) (1994) American places dictionary, Vols 1–4.

Omnigraphics Inc., Michigan.

Anon. (ed.) (1986) Chinese place names. China Map Publisher,

Beijing.

Arakawa, H. (ed.) (1969) Climates of northern and eastern Asia.

World survey of climatology, Vol. 8. Elsevier Publishing Co.,

Amsterdam.

Arris, L.L. & Eagleson, P.S. (1989) Evidence of a physiological

basis of the boreal–deciduous forest ecotone in North

America. Vegetatio, 82, 55–58.

Atmospheric Environmental Service, Environment Canada

(1982) Canadian climate normals, 1951–1980. Atmospheric

Environmental Service, Environment Canada, Ottawa.

Austin, M.P. (2002) Spatial prediction of species distribution:

an interface between ecological theory and statistical mod-

elling. Ecological Modelling, 157, 101–118.

Barnes, B.V. (1991) Deciduous forest of North America.

Temperate deciduous forests. Ecosystems of the world 7 (ed.

by E. Rohrig and B. Ulrich), pp. 219–344. Elsevier Science

Publishers B.V., Amsterdam.

Barry, R.G. (1992) Mountain weather and climate, 2nd edn.

Routledge, London.

Birks, H.J.B. (1989) Holocene isochrone maps and patterns of

tree-spreading in the British Isles. Journal of Biogeography,

16, 503–540.

Braun, E.L. (1967) Deciduous forests of eastern North America.

Hafner Publishing Company, New York.

Bryson, R.A. (1966) Air masses, streamlines, and the boreal

forest. Geographical Bulletin, 8, 228–269.

Camp, W.H. (1951) A biogeographical and paragenetic ana-

lysis of the American beech (Fagus). American Philosophy

Society Yearbook, 1950, 166–199.

Cannell, M.G.R. & Smith, R.I. (1986) Climatic warming,

spring budburst and frost damage of trees. Journal of Applied

Ecology, 23, 177–191.

Cao, K.F. (1995) Fagus dominance in Chinese montane forests:

natural regeneration of Fagus lucida and Fagus hayatae var.

pashanica. PhD Thesis, Wageningen Agricultural University,

Wageningen.

Cao, K.F., Peters, R. & Oldeman, R.A.A. (1995) Climatic

ranges and distribution of Chinese Fagus species. Journal of

Vegetation Science, 6, 317–324.

Central Meteorological Office of Korea (1972) Climatic table of

Korea. Central Meteorological Office of Korea, Seoul.

Chang, D.H.S. (1983) The Tibetan Plateau in relation to the

vegetation of China. Annals of Missouri Botanical Garden,

70, 564–570.

China Meteorological Agency (1984) Climatological data of

China. China Meteorological Agency, Beijing.

Corps of Engineers, US Army (1956) Gazetteer to AMS

1 : 250 000 maps of Japan (Series L506). Army Map Service,

Washington, DC.

Davis, P.H. (ed.) (1982) Flora of Turkey and the east Aegean

Islands, Vol. 7. Edinburgh University Press, Edinburgh.

Denk, T. (2003) Phylogeny of Fagus L. (Fagaceae) based on

morphological data. Plant Systematics and Evolution, 240,

55–81.

Denton, S.R. & Barnes, B.V. (1987) Tree species distributions

related to climatic patterns in Michigan. Canadian Journal of

Forest Research, 17, 613–629.

Editorial Committee for Flora of China (1999) Flora of China,

Vol. 4: Cycadaceae through Fagaceae. Science Press, Beijing,

and Missouri Botanical Garden Press, St Louis.

Editorial Committee of 1/1,000,000 Land-use Map of China

(1990) Land-use map of China. Science Press, Beijing.

Ellenberg, H. (1986) Vegetation Mitteleuropas mit den Alpen,

4th edn. Fischer, Stuttgart.

Falusi, M. & Calamassi, R. (1996) Geographic variation and

bud dormancy in beech seedlings (Fagus sylvatica L).

Annales des Sciences Forestieres, 53, 967–979.

Fang, J.Y. (1989) Distribution of vegetation and climate in

China. PhD Thesis, Osaka City University, Osaka.

Fang, J.Y. (1996) Temperature distribution in the Arctic re-

gions. The Arctic: nature and life (ed. by X.N. Kong and J.Y.

Fang), pp. 145–152. Industry and Commerce Association

Press, Beijing.

Fang, J.Y. (1999) Distribution patterns of natural vegetation in

relation to climate and topography in China. Proceedings of

the 1st International Symposium on the Geoenvironmental

Changes and Biodiversity in the Northeast Asia, Seoul, Korea,

November 16–19, 1998, pp. 231–243.

Fang, J.Y. (2003) Database of global beech distribution. Tech-

nical Report, Center for Ecological Research and Education,

Peking University, Beijing.

J. Fang and M. J. Lechowicz

1816 Journal of Biogeography 33, 1804–1819ª 2006 The Authors. Journal compilation ª 2006 Blackwell Publishing Ltd

Fang, J.Y. & Yoda, K. (1990) Climate and vegetation in China.

III. Water balance in relation to distribution of vegetation.

Ecological Research, 4, 71–83.

Fang, J.Y. & Yoda, K. (1991) Climate and vegetation in China.

V. Effect of climatic factors on the upper limit of distribu-

tion of evergreen broadleaf forests. Ecological Research, 6,

113–125.

Fang, J.Y., Ohsawa, M. & Kira, T. (1996) Vertical vegetation

zones along 30!N latitude in humid East Asia. Vegetatio,

126, 136–149.

Feoli, E. & Lagonegro, M. (1982) Syntaxonomical analysis of

beech woods in the Apennines (Italy) using the program

package IAHOPA. Vegetatio, 50, 129–173.

Francis, A.P. & Currie, D.J. (2003) A global consistent rich-

ness–climate relationship for angiosperms. American Nat-

uralist, 161, 524–536.

Frank, D.A. & Inouye, R.S. (1994) Temporal variation in actual

evapotranspiration of terrestrial ecosystems: patterns and

ecological implications. Journal of Biogeography, 21, 401–

411.

Geographical Survey Institute (1977) The national atlas of

Japan, 1st edn. Japan Map Center, Tokyo.

Gorcynski, W. (1922) Sur le calcul du continentalisme et

son application dans la climatologie. Geografie Annuals, 2,

49–62.

Grace, J. (1987) Climatic tolerance and the distribution of

plants. New Phytologist, 106 (Suppl.), 113–130.

Hattori, T. & Nakanishi, S. (1985) On the distribution limit of

the lucidophyllous forest in the Japanese Archipelago.

Botanical Magazine, Tokyo, 98, 317–333.

Hicks, D.J. & Chabot, B.F. (1985) Deciduous forest. Physiolo-

gical ecology of North American plant communities (ed. by

B.F. Chabot and H.A. Mooney), pp. 257–277. Chapman and

Hall, New York.

Holdridge, L.R. (1947) Determination of world plant forma-

tions from simple climatic data. Science, 105, 367–368.

Hong, B.G. & An, S.Q. (1993) A preliminary study on the

geographical distribution of Fagus in China. Acta Botanica

Sinica, 35, 229–233.

Horikawa, Y. (1972) Atlas of the Japanese flora: an introduction

to plant sociology of East Asia. Gakken Co. Ltd, Tokyo.

Hou, Hsioh-yu (Hou Xue-yu) (1983) Vegetation of China

with reference to its geographical distribution. Annals of

Missouri Botanical Garden, 70, 509–548.

Hou, X.Y. (1988) Vegetation geography of China. Study series

for physical geography of China. Scientific Press, Beijing.

Hsieh, C.F. (1989) Structure and floristic composition of the

beech forest in Taiwan. Taiwania, 34, 28–44.

Huntley, B., Bartlein, P.J. & Prentice, I.C. (1989) Climatic

control of the distribution and abundance of beech (Fagus

L.) in Europe and North America. Journal of Biogeography,

16, 551–560.

Hutchinson, A.H. (1918) Limiting factors in relation to

specific ranges of tolerance of forest trees. Botanical Gazette,

65, 465–493.

Iverson, L.R. & Prasad, A.M. (1998) Predicting abundance of

80 tree species following climate change in the eastern

United States. Ecological Monographs, 68, 465–485.

Jahn, G. (1991) Temperate deciduous forests of Europe. Eco-

systems of the world 7. Temperate deciduous forests (ed. by

E. Rohrig & B. Ulrich), pp. 377–502. Elsevier, London.

Jalas, J. & Suominen, J. (1972–91) Atlas Florae Europaeae:

distribution of vascular plants in Europe, Vols 1–9. Akate-

eminen Kirjakauppa, Helsinki.

Japan Meteorological Agency (1972) Climatic table of Japan.

Japan Meteorological Agency, Tokyo.

Kim, J.W. (1988) The phytosociology of forest vegetation on

Ulreung-do, Korea. Phytocoenologia, 16, 259–281.

Kim, S.D., Kimura, M. & Yim, Y.J. (1986) Phytosociological

studies on the beech (Fagus multinervis Nakai) forest and the

pine (Pinus parviflora S. et Z.) forest of Ulreung Island,

Korea. Korean Journal of Botany, 29, 53–65.

Kira, T. (1945) A new classification of climate in eastern Asia as

the basis for agricultural geography. Horticultural Institute,

Kyoto University, Kyoto.

Kira, T. (1948) On the altitudinal arrangement of climatic

zones in Japan. Kanchi-Nougaku, 2, 143–173.

Kira, T. (1991) Forest ecosystems of east Asia and southeast

Asia in a global perspective. Ecological Research, 6, 185–

192.

Koppen, W. (1936) Das geographische system der klimate.

Handbuch der klimatologie, Vol. I (ed. by W. Koppen and R.

Geiger). Gebr Borntraeger, Berlin.

Kure, H. & Yoda, K. (1984) The effects of the Japan Sea climate

on the abnormal distribution of Japanese beech forests.

Japanese Journal of Ecology, 34, 63–73.

Lechowicz, M.J. (2001) Phenology. Encyclopedia of global

environmental change, Volume 2. The Earth system: biological

and ecological dimensions of global environmental change.

Wiley, London.

Little, E.L., Jr (1965) Mexican beech, a variety of F. grandifolia.

Castanea, 30, 167–170.

Little, E.L., Jr (1979) Checklist of United States trees. Agricul-

ture Handbook No. 541. Forest Service, USDA, Washington,

DC.

Liu, L.H. & Qiu, X.Z. (1980) Studies on geographical dis-

tribution and situation of vertical zone of the Chinese Tsuga

forests. Acta Botanica Yunnanica, 2, 9–21.

Lydolph, P.E. (1985) The climate of the Earth. Rowman &

Allanheld Publishers, Totowa, NJ.

Maeda, F. (1991) Beech forest vegetation. Natural environment

and its conservation on Buna (Fagus crenata) forests (ed. by

H. Murai), pp. 1–15. Soft Science Inc., Tokyo.

Mather, J.R. & Yoshioka, G.A. (1968) The role of climate in the

distribution of vegetation. Annals of Association of American

Geographer, 58, 29–41.

Matsui, T., Yagihashi, T., Nakaya, T., Tanaka, N. & Taoda,

H. (2004) Climatic controls on distribution of Fagus

crenata forests in Japan. Journal of Vegetation Science, 15,

57–66.

Climatic limits for world beech distribution

Journal of Biogeography 33, 1804–1819 1817ª 2006 The Authors. Journal compilation ª 2006 Blackwell Publishing Ltd

Matyes, V. (1969) Weather influence on beech flowering.

Proceedings of the 2nd FAO/IUFRO world consult. Forest tree

breed, Washington, pp. 1407–1418.

Maycock, P.F. (1994) The ecology of beech (Fagus grandifolia

Ehrh.) forests of the deciduous forests of southeastern North

America, and a comparison with the beech (F. crenata)

Forests of Japan. Vegetation in eastern North America (ed. by

A. Miyawaki, K. Iwatsuki and M. Grandtner), pp. 351–410.

University of Tokyo Press, Tokyo.

McCune, B. & Mefford, M.J. (1999) PC-ORD (version 4). MjM

Software Design, Glereden Beach, OR, USA.

Miranda, F. & Sharp, A.J. (1950) Characteristics of the vege-

tation in certain temperate regions of eastern Mexico.

Ecology, 31, 313–333.

Miyawaki, A. (ed.) (1980–1989) Vegetation of Japan. Shiben-

do, Tokyo.

Miyazawa, Y. & Kikuzawa, K. (2005) Winter photosynthesis by

saplings of evergreen broad-leaved trees in a deciduous

temperate forest. New Phytologist, 165, 857–866.

National Climatic Center, NOAA (1983) Climate normals for

the US (Base: 1951–80). National Climatic Center, NOAA,

Michigan.

O’Brien, E.M. (1993) Climatic gradients in woody plant spe-

cies richness: towards an explanation based on an analysis of

southern Africa’s woody flora. Journal of Biogeography, 20,

181–198.

Ohsawa, M. (1990) An interpretation of latitudinal patterns of

forest limits in south and east Asian mountains. Journal of

Ecology, 78, 326–339.

Ohsawa, M. (1991) Structural comparison of tropical montane

rain forest along latitudinal and altitudinal gradients in

south and east Asia. Vegetatio, 97, 1–10.

Okubo, T., Kim, J.M. & Maeda, T. (1988) Cupules and nuts of

Fagus multinervis Nakai (Fagaceae). Journal of Japanese

Botany, 63, 29–31.

Owens, J.N. & Blake, M.D. (1985) Forest tree seed production.

Information Report of Petawawa National Forestry Institute,

Canadian Forestry Services, Agriculture Canada, Canada.

Pederson, N., Cook, E.R., Jacoby, J.C., Peteet, D.M. & Griffin,

K.L. (2004) The influence of winter temperatures on the

annual radial growth of six northern range margin tree

species. Dendrochronologia, 22, 7–29.

Peters, R. (1992) Ecology of beech forests in the northern

Hemisphere. PhD Thesis, Wageningen Agricultural Uni-

versity, Wageningen.

Peters, R. (1995) Architecture and development of Mexican

beech forest. Vegetation science in forestry (ed. by E.O. Box,

R.K. Peet, T. Masuzawa, I. Yamada, K. Fujiwara and P.F.

Maycock), pp. 325–343. Kluwer Academic Publishers,

Dordrecht.

Peters, R. & Poulson, T.L. (1994) Stem growth and canopy

dynamics in a world wide range of Fagus forests. Journal of

Vegetation Science, 5, 421–432.

Piovesan, G. & Adams, J.M. (2001) Masting behaviour in

beech: linking reproduction and climatic variation. Cana-

dian Journal of Botany, 79, 1039–1047.

Prentice, C., Cramer, W., Harrison, S.P., Leemans, R.,

Monserud, R.A. & Solomon, A.M. (1992) A global biome

model based on plant physiology and dominance, soil

properties and climate. Journal of Biogeography, 19, 117–134.

Rzedowski, J. (1983) Vegetacion de Mexico. Editorial Limusa,

Mexico.

Sakai, S. (1975) Freezing resistance of evergreen and deciduous

broadleaf trees in Japan with special reference to their dis-

tributions. Japanese Journal of Ecology, 25, 101–111.

Sakai, A. & Weiser, C.J. (1973) Freezing resistance of trees in

North America with reference to tree regions. Ecology, 54,

118–126.

Shen, C.L. (1986) Climatology of China. Scientific Press,

Beijing.

Shen, C.F. (1992) A monograph of the genus Fagus Tourn. ex

L. (Fagaceae). PhD Thesis, The City University of New York,

USA.

Solomon, A.M. (1986) Transient response of forests to CO2-

induced climate change: simulation modelling experiments

in eastern North America. Oecologia, 68, 567–579.

Stephenson, N.L. (1990) Climatic control of vegetation dis-

tribution: the role of the water balance. American Naturalist,

135, 649–670.

Sykes, M.T., Prentice, I.C. & Cramer, W. (1996) A bioclimatic

model for the potential distributions of north European tree

species under present and future climates. Journal of Bio-

geography, 23, 203–233.

SYSTAT Inc. (1996) Sysgraph/Systat users’ guide. SYSTAR Inc.,

Evanston, IL.

Thornthwaite, C.W. (1948) An approach toward a rational

classification of climate. Geographical Review, 38, 55–94.

Times (1992) Atlas of the World, 9th comprehensive edition.

Times Books, London.

Tsien, C.P., Ying, T.S., Ma, C.G. & Li, Y.L. (1975) The dis-

tribution of beech forests of Mt. Fanchingshan and its sig-

nificance in plant geography. Acta Phytotaxonomica Sinica,

13, 5–18.

Tuhkanen, S. (1980) Climate parameters and indices in

plant geography. Acta Phytogeographica Suecica (Uppsala),

67, 1–110.

USDA Forest Service (1975) Atlas of United States trees, Vol. 1.

United States Government Printing Office, Washington,

DC.

Walter, H. (1979) Vegetation of the earth and ecological systems

of the geobiosphere, 2nd edn. Springer, New York.

Wernstedt, F.L. (1972) World climatic data. Climatic data

Press, Pennsylvania.

Wilks, D.S. (1995) Statistical methods in the atmospheric

sciences. Academic Press, New York.

Williams-Linera, G., Devall, M.S. & Alvarez-Aquino, C.

(2000) A relict population of Fagus grandifolia var.

mexicana at the Acatlan Volcano, Mexico: structure, lit-

terfall, phenology and dendroecology. Journal of Biogeo-

graphy, 27, 1297–1309.

Willis, J.C. (1966) A dictionary of the flowering plants and ferns,

7th edn. Cambridge University Press, Cambridge.

J. Fang and M. J. Lechowicz

1818 Journal of Biogeography 33, 1804–1819ª 2006 The Authors. Journal compilation ª 2006 Blackwell Publishing Ltd

Wolfe, J.A. (1979) Temperature parameters of humid to mesic

forests of Eastern Asia and relation to forest of other regions of

the northern Hemisphere and Australasia. Geological Survey

Professional Paper 1106, Washington, DC.

Woodward, F.I. (1987) Climate and plant distribution. Cam-

bridge University Press, Cambridge.

Wu, Z.Y. (ed.) (1980) Vegetation of China. Scientific Press,

Beijing.

Yamazaki, K. (1983) Plant distribution in Japan. Modern

biology series, 7a, Higher plants (ed. by M. Honda and K.

Yamazaki), pp. 119–155. Nakayama-syoten, Tokyo.

SUPPLEMENTARY MATERIAL

The following supplementary material is available online from

http://www.Blackwell-Synergy.com

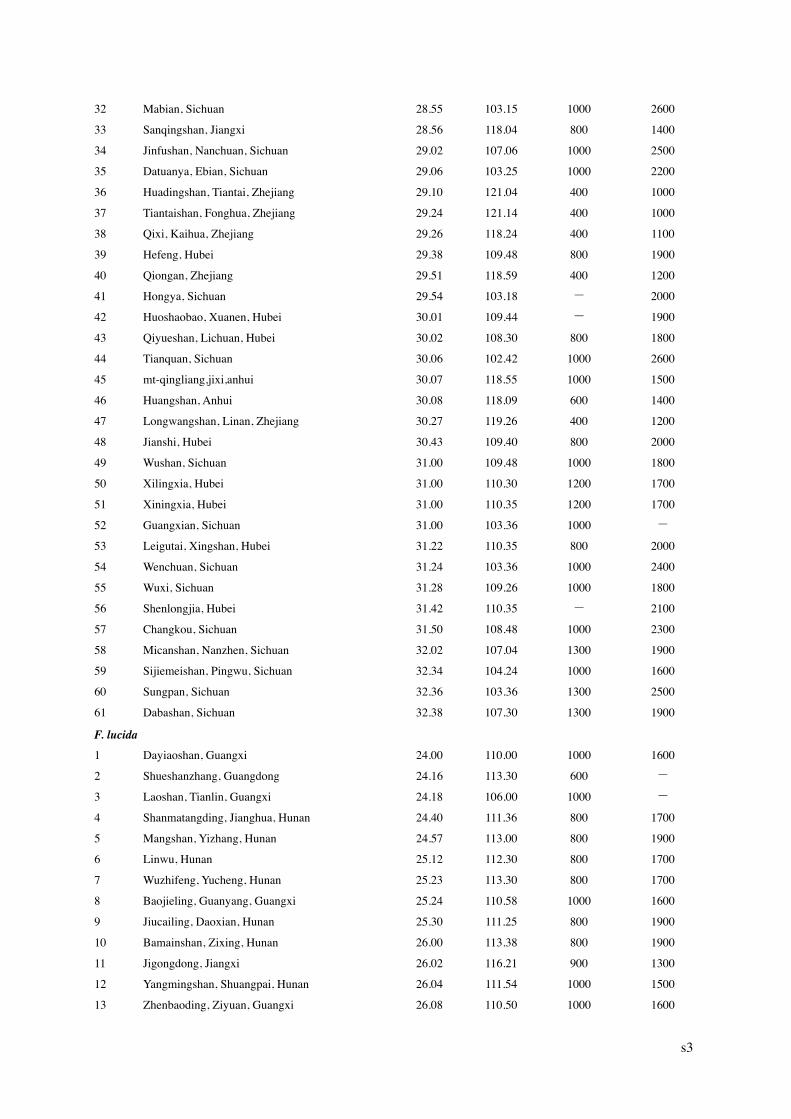
Appendix S1 Location and elevation of distribution limits of

beech (Fagus L.) species in the present study.

Table S1 Statistics for climatic variables at lower (southern)

and upper (northern) limits of distribution for world beech

species.

Table S2 Loadings of climatic variables derived from Princi-

pal Components Analysis for the first three principal compo-

nents associated with the distribution limits of world beech

species.

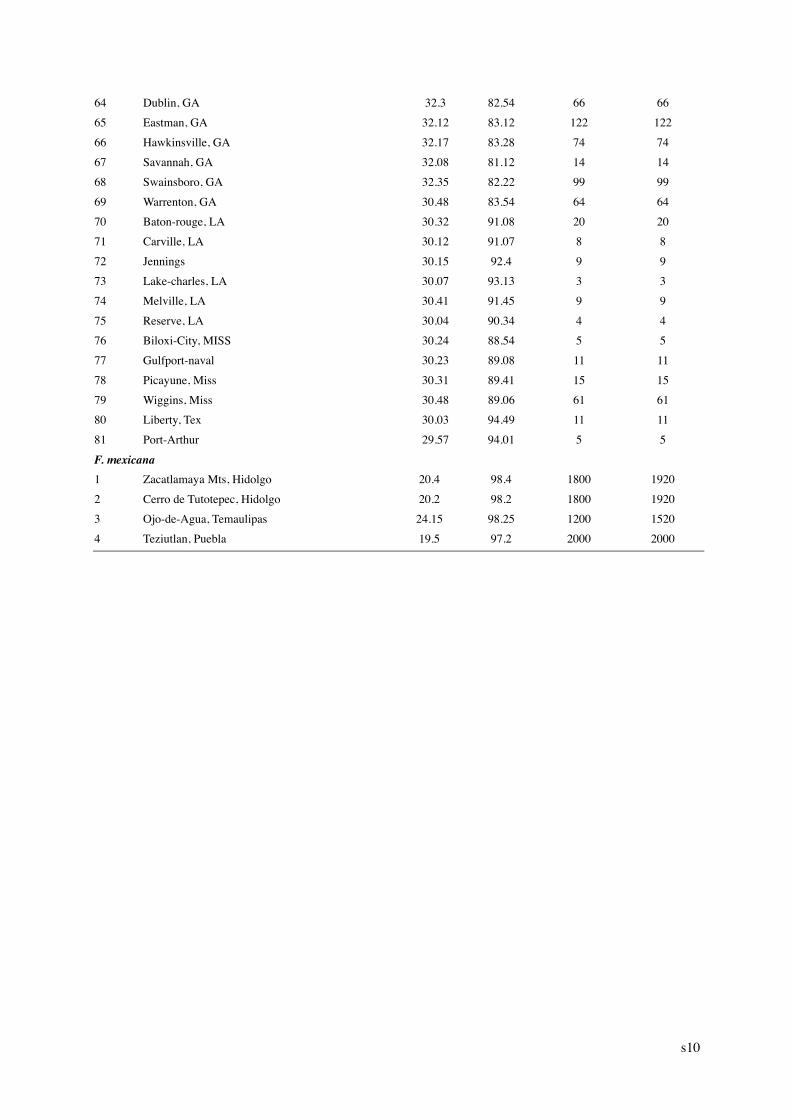
Table S3 Coefficient of correlation between annual mean

temperature (AMT) and other thermal variables across the

global range of beech species.

BIOSKETCHES

Jingyun Fang is a professor and chair of the Department of

Ecology, Peking University. His research interests cover

biogeography of plants, terrestrial ecosystem productivity

and remote sensing of vegetation.

Martin J. Lechowicz is a professor in the Department of

Biology, McGill University, and Director of the University’s

Gault Nature Reserve. His research interests centre on the

comparative ecology of trees and on the ecology and

conservation of forest communities.

Editor: Robert J. Whittaker

Climatic limits for world beech distribution

Journal of Biogeography 33, 1804–1819 1819ª 2006 The Authors. Journal compilation ª 2006 Blackwell Publishing Ltd

Supplementary Material for Paper of Fang and Lechowicz

Climatic limits for the present distribution of beech (Fagus L.) species in the world

Jingyun Fang 1 and Martin J. Lechowicz 2

1 Department of Ecology, College of Environmental Sciences, and Center for Ecological Research & Education, Peking University, Beijing 100871, China 2 Biology Department, McGill University, 1205 Dr. Penfield Avenue, Montreal, Quebec, Canada H3A 1B1. Journal of Biogeography, 2006, 33, 1804–1819 Supplementary Materials Appendix S1 Table S1 Table S2 Table S3 Appendix S1. Locations and elevation of distribution limits of beech (Fagus) species used in the present study. “-“: no available records. No. Location Latitude

(o.’) Longitude

(o.’) Lower limit (m) Upper limit

(m)

F. engleriana

1 Daheshan, Yiliang, Yunnan 27.34 104.20 1200 2500

2 Taiyanggong, Zhenxiong, Yunnan 27.48 104.54 1200 2000

3 Daguang, Yunnan 27.52 103.54 1200 2100

4 Fanjianshan, Guizhou 27.55 108.41 1600 2200

5 Yongshan, Yunnan 28.01 103.36 1200 2500

6 Baimashan, Suichang, Zhejiang 28.12 119.12 800 1000

7 Sanjiangkou, Yunnan 28.15 103.58 ! 2550

8 Daliangshan, Meigu, Sichuan 28.18 103.06 1000 2400

9 Jinfushan, Nanchuan, Sichuan 29.02 107.06 ! 2100

10 Datungyan, Ebian, Sichuan 29.06 103.25 1000 2500

11 Gutianshan, Kaihua, Zhejiang 29.06 118.24 800 !

12 Emeishan, Sichuan 29.31 103.21 1900 2100

13 Qiyueshan, Lichuan, Hubei 30.02 108.30 ! 1800

14 Guniujiang, Shitai, Anhui 30.03 117.28 1100 1600

15 mt-qingliang, jixi, anhui 30.07 118.55 1000 1500

16 Huangshan, Anhui 30.08 118.09 1200 1550

17 Tianquan, Sichuan 30.10 102.34 1000 2400

18 jiuhuashan, Qingyang, Anhui 30.36 117.48 1200 1360

19 Tianzhushan, Qianshan, Anhui 30.40 116.30 1000 1400

20 Daozhijian, Yuexi, Anhui 30.48 116.04 1000 1400

21 Xiningxia, Hubei 31.00 110.35 1300 1800

22 Guanxian, Sichuan 31.00 103.36 1000 2500

23 Tiantangzhai, Dabieshan, Anhui 31.11 115.44 1200 1700

24 Dabao, Penxian, Sichuan 31.14 103.44 1000 2400

25 Leigutai, Xingshan, Hubei 31.22 110.35 1000 2000

s1

26 Wuoxi, Sichuan 31.24 109.36 1000 1800

27 Dafushan, Jinzhai, Anhui 31.36 115.38 1000 1500

28 Shenlongja, Hubei 31.42 110.35 1400 2200

29 Mt-Baimajian 31.44 116.22 900 1600

30 Jiulongshan, Zhenping, Shanxi 31.48 109.30 1100 2100

31 Chengkou, Sichuan 31.50 108.40 1000 2400

32 Tongjiang, Sichuan 31.56 107.14 1500 2200

33 Micangshan, Nanzhen, Sichuan 32.02 107.04 1400 2000

34 Houhekou, Fangxian, Hubei 32.13 110.32 1000 1500

35 North Dabashan, Ziyang, Shanxi 32.15 108.30 1100 2100

36 Cailinbao, Pingwu, Sichuan 32.17 104.20 1000 2400

37 Moutianling, Qingchuan, Sichuan 32.30 104.52 1000 2400

F. longipetiolata

1 Mongci, Yunnan 23.14 103.15 800 !

2 Wenshan, Yunnan 23.20 104.13 800 2000

3 Yuyuan, Guangdong 23.58 113.56 1200 1800

4 Xinchang, Xinyi, Guizhou 24.08 104.48 1000 !

5 Yangshan, Guangdong 24.18 112.29 1200 1800

6 Laoshan, Tianlin, Guanxi 24.18 106.00 1500 1900

7 Yuanbaoshan, Guangxi 25.27 109.12 1300 2200

8 Dupuangling, Daoxian, Hunan 25.30 111.30 1000 1700

9 Miaoershan, Guangxi 25.52 110.28 1000 2200

10 YangMingshan, Shuangpai, Hunan 25.54 111.36 1000 1700

11 Bamienshan, Guidong, Hunan 26.00 113.44 1200 1700

12 Zhengbaoding, Hunan 26.07 110.27 800 1500

13 Leigongshan, Guizhou 26.24 108.12 900 2100

14 Louxiaoshan, Hunan 26.26 113.54 800 1500

15 Jinggangshan, Jiangxi 26.38 113.11 900 1500

16 Baishifong, Wuyi Mts, Fujian 26.47 116.51 1100 1400

17 Chaling, Hunan 27.05 113.38 1200 1400

18 Xuefengshan, Hunan 27.12 110.04 800 1500

19 Zhengxong, Yunnan 27.29 104.59 ! 1900

20 South Yandangshan, Taixun, Zhejiang 27.32 120.06 400 1200

21 Weixing, Yunnan 27.49 105.01 ! 2000

22 MT-fangjinshan 27.55 108.41 1100 1900

23 Guixi, Jiangxi 28.01 117.30 800 !

24 Yunhe, Zhejiang 28.01 119.25 400 1400

25 Zhulong, Longquan, Zhejiang 28.01 118.50 400 1400

26 Suzishan, Songdao, Guizhou 28.06 109.06 1000 1800

27 Daliangshan, Miegu, Sichuan 28.18 103.16 1000 2500

28 Dabaoding, Leibou, Sichuan 28.26 103.37 1000 2400

29 Xushan, Sichuan 28.32 108.50 1000 1600

30 Dalingshan, Shangrao, Jiangxi 28.34 117.54 800 !

31 Baimashan, Suichang, Zhejiang 28.48 119.21 400 1400

s2

32 Mabian, Sichuan 28.55 103.15 1000 2600

33 Sanqingshan, Jiangxi 28.56 118.04 800 1400

34 Jinfushan, Nanchuan, Sichuan 29.02 107.06 1000 2500

35 Datuanya, Ebian, Sichuan 29.06 103.25 1000 2200

36 Huadingshan, Tiantai, Zhejiang 29.10 121.04 400 1000

37 Tiantaishan, Fonghua, Zhejiang 29.24 121.14 400 1000

38 Qixi, Kaihua, Zhejiang 29.26 118.24 400 1100

39 Hefeng, Hubei 29.38 109.48 800 1900

40 Qiongan, Zhejiang 29.51 118.59 400 1200

41 Hongya, Sichuan 29.54 103.18 ! 2000

42 Huoshaobao, Xuanen, Hubei 30.01 109.44 ! 1900

43 Qiyueshan, Lichuan, Hubei 30.02 108.30 800 1800

44 Tianquan, Sichuan 30.06 102.42 1000 2600

45 mt-qingliang,jixi,anhui 30.07 118.55 1000 1500

46 Huangshan, Anhui 30.08 118.09 600 1400

47 Longwangshan, Linan, Zhejiang 30.27 119.26 400 1200

48 Jianshi, Hubei 30.43 109.40 800 2000

49 Wushan, Sichuan 31.00 109.48 1000 1800

50 Xilingxia, Hubei 31.00 110.30 1200 1700

51 Xiningxia, Hubei 31.00 110.35 1200 1700

52 Guangxian, Sichuan 31.00 103.36 1000 !

53 Leigutai, Xingshan, Hubei 31.22 110.35 800 2000

54 Wenchuan, Sichuan 31.24 103.36 1000 2400

55 Wuxi, Sichuan 31.28 109.26 1000 1800

56 Shenlongjia, Hubei 31.42 110.35 ! 2100

57 Changkou, Sichuan 31.50 108.48 1000 2300

58 Micanshan, Nanzhen, Sichuan 32.02 107.04 1300 1900

59 Sijiemeishan, Pingwu, Sichuan 32.34 104.24 1000 1600

60 Sungpan, Sichuan 32.36 103.36 1300 2500

61 Dabashan, Sichuan 32.38 107.30 1300 1900

F. lucida

1 Dayiaoshan, Guangxi 24.00 110.00 1000 1600

2 Shueshanzhang, Guangdong 24.16 113.30 600 !

3 Laoshan, Tianlin, Guangxi 24.18 106.00 1000 !

4 Shanmatangding, Jianghua, Hunan 24.40 111.36 800 1700

5 Mangshan, Yizhang, Hunan 24.57 113.00 800 1900

6 Linwu, Hunan 25.12 112.30 800 1700

7 Wuzhifeng, Yucheng, Hunan 25.23 113.30 800 1700

8 Baojieling, Guanyang, Guangxi 25.24 110.58 1000 1600

9 Jiucailing, Daoxian, Hunan 25.30 111.25 800 1900

10 Bamainshan, Zixing, Hunan 26.00 113.38 800 1900

11 Jigongdong, Jiangxi 26.02 116.21 900 1300

12 Yangmingshan, Shuangpai, Hunan 26.04 111.54 1000 1500

13 Zhenbaoding, Ziyuan, Guangxi 26.08 110.50 1000 1600

s3

14 Mingzhulaoshan, Chengbu, Hunan 26.16 110.50 1200 1950

15 Mingjushan, Chengpu, Hunan 26.18 110.18 1400 1600

16 Nanshan, Chengbu, Hunan 26.22 110.23 1400 1850

17 Louxiaoshan, Hunan 26.24 113.52 1350 1500

18 Leigongshan, Guizhou 26.24 108.12 1000 2100

19 Leigongshan, Guizhou 26.25 108.08 1300 1600

20 Dongan, Hunan 26.38 111.08 800 1600

21 Salaxi, Bijie, Guizhou 27.08 105.04 1300 1600

22 Wugongshan, Jiangxi 27.31 114.10 800 1400

23 South Yandangshan, Taishun, Zhejiang 27.32 120.06 1000 1200

24 Congan, Fujian 27.38 118.18 1100 !

25 Baishanzuo, Qingyuan, Zhejiang 27.46 119.10 1300 1700

26 Huanggang, Zhejiang 27.52 117.49 1300 1700

27 Guankoushui, Suiyang, Guizhou 27.54 107.06 1000 1750

28 Fanjianshan, Guizhou 27.55 108.41 1300 2100

29 Huangmoujian, Longquan, Zhejiang 27.56 119.10 1300 1700

30 Xinjieping, Gulan, Sichuan 28.00 105.42 1300 1800

31 Kuankuoshui, Guizhou 28.11 107.11 1400 1750

32 Daliangshan, Meigu, Sichuan 28.18 103.06 1300 2300

33 Mt-jiulongshan,Zhangjiang 28.21 118.52 1400 1700

34 Dabaoding, Leibuo, Sichuan 28.22 103.36 1300 2300

35 Jiulongshan, Suichang, Zhejiang 28.23 118.56 1300 1700

36 Mabian, Sichuan 28.32 103.15 1300 2300

37 Baimashan, Suichang, Zhejiang 28.36 119.10 1300 1600

38 Daozhen, Guizhou 28.38 107.36 1000 1700

39 Jianshanke, Yongxun, Hunan 29.01 109.38 700 2200

40 Datangyan, Ebian, Sichuan 29.04 103.22 1300 2300

41 Erbian, Sichuan 29.10 103.20 1550 2400

42 Shimen, Hunan 29.36 111.18 700 !

43 Hefeng, Hubei 29.38 109.48 1000 1800

44 Badagongshan, Hunan 29.40 119.49 1400 1850

45 Zhangcui, Hongya, Sichuan 29.40 103.04 1300 1700

46 Tongzi, Shizhu, Sichuan 29.44 107.43 1300 1900

47 Huoshaobao, Xuanen, Hubei 30.01 109.44 1000 2000

48 Longtangba, Hubei 30.02 109.06 1000 1600

49 Qiyueshan, Lichuan, Hubei 30.02 108.30 1000 1800

50 Guniujiang, Shitai, Anhui 30.03 117.28 1300 !

51 Tianmushan, Zhejiang 30.25 119.30 1000 1400

52 Tianzhoushan, Qianshan, Anhui 30.40 116.30 1000 1300

53 Yuexi, Anhui 30.48 116.04 1000 1400

54 Xilingxia, Hubei 31.00 110.35 1300 1800

55 Huoshan, Anhui 31.20 116.05 1000 1600

56 Leigutai, Xingshan, Hubei 31.22 110.35 1000 2000

57 Shenlongja, Hubei 31.42 110.35 1400 2200

s4

58 mt-baimajian, heshan, anhui 31.44 116.22 700 !

59 Guangwushan, Nanjiang, Sichuan 32.38 106.43 1300 2300

60 Pingwu, Sichuan 32.24 104.30 1300 1300

F. hayatae

1 Nanjiang, Sichuan 32.38 106.43 1300 1900

2 Tongjiang, Sichuan 31.50 108.20 1100 1900

3 Dabashan, Sichuan 32.38 107.30 ! 1850

4 Longtangshan, Linan, Zhenjiang 30.28 119.42 900 1300

5 Taiixun, Zhejiang 27.03 120.06 900 1200

6 Shimen, Hunan 29.36 111.18 900 1300

7 Dabashan, Nanzheng, Shanxi 33.00 106.54 ! 1600

8 Lalashan, Taipei 24.45 121.26 1300 2000

9 Sanhsingsan-Tungshan 24.31 121.33 1800 1800

10 Sihaishan, Yongjia, Zhejiang 28.08 120.33 850 1000

F. crenata

1 Tsubamenosawa, Hokkaido 42.47 140.2 ! 620

2 Taiheizan, Hokkaido 42.45 140.18 100 900

3 Oshamanbedake, Hokkaido 42.30 140.18 320 800

4 Shimokita 41.26 141.10 10 850

5 Hakkoda-san 40.40 140.53 200 1200

6 Iwaki-san 40.38 140.18 ! 1150

7 Ashiro-cho, Iwate 40.05 140.00 460 1000

8 Hachimantai 39.58 140.51 500 1100

9 Iwaizumicho, Shimoheigun, Iwate 39.51 141.47 ! 1200

10 Hayachine 39.29 141.31 400 1150

11 Chokai-san 39.06 140.04 450 1120

12 Yakeishi-dake 39.05 140.50 300 1100

13 Kurikoma-yama 38.58 140.49 400 1200

14 Gassa 38.33 140.02 100 1350

15 Funagata-yama 38.25 140.35 ! 1300

16 Asahi-dake 38.15 139.56 300 1200

17 Zao-san 38.09 140.27 250 1375

18 Ihde-san 37.51 139.43 350 1500

19 Azumayama 37.44 140.09 300 1450

20 Asakusa-dake 37.21 139.15 400 1450

21 Aizuasahi-dake 37.13 139.20 600 1550

22 Aizukomagadake 37.02 139.25 ! 1600

23 Hiuchigadake 36.55 139.20 ! 1550

24 Tanigawa-dake, Gumma 36.55 138.55 680 1550

25 jap2 36.53 138.53 ! 1600

26 Naebasan, 36.50 138.41 ! 1640

27 Nikko, Tochigi 36.45 139.35 850 1700

28 jap3 36.34 137.37 400 1600

29 Tsukubasan, Ibaraki 36.10 140.05 820 !

s5

30 Chichibu, Saitama 35.55 138.50 1000 1650

31 Hyonosen, Okayama 35.35 134.30 1150 !

32 Okutama, 35.35 139.20 850 1650

33 jap5 35.30 138.49 ! 1700

34 Ooginosen, Tottori 35.25 134.25 850 !

35 Mt Fuji 35.22 138.44 1000 1580

36 Daisen, Tottori 35.2 133.30 800 !

37 Jap6 35.17 138.01 ! 1550

38 Sanjogatake, Nara 34.15 135.55 ! 1590

39 Hakkenzan 34.15 135.55 900 1760

40 Hakkenzan, Nara 34.10 135.50 ! 1660

41 Ohdaigahara 34.10 136.05 850 1690

42 Hatenashi, Wakayama 33.55 135.4 940 !

43 Miune, Kochi 33.53 133.58 1300 1550

44 Kumosoyama, Tokushima 33.50 134.15 1250 !

45 Tsurugisan, Tokushima 33.50 134.05 1240 1650

46 Ishizuchiyama, Kochi 33.46 133.07 1350 1670

47 Sasagamine, Eihimei 33.45 133.15 1250 1500

48 Kanpuzan, Kochi 33.45 133.25 1380 1660

49 Hikosan 33.35 130.10 650 !

50 Kujusan 33.05 131.10 1000 !

51 Sobosan 32.49 131.22 1200 1700

52 Kunimidake 32.30 131.00 1350 1650

53 Ichifusayama 32.15 131.05 ! 1630

54 Kirishima 31.50 130.50 1150 1400

55 Takakumayama 31.29 130.49 1200 !

F. japonica

1 Yamadamachi, Miyakoshi, Iwate 39.30 141.55 100 600

2 Hanamaki City, Iwate 39.23 141.07 100 !

3 Sendai, Miyagi 38.15 140.53 200 !

4 North Abukuma Santi, Hukushima 37.46 140.42 150 700

5 Central Abukuma Santi, Hukushima 37.20 140.43 200 750

6 Naganuma-mati, Hukushima 37.18 140.13 200 750

7 Mt.Yamizo, Ibaraki 36.54 140.10 450 !

8 Nikko, Tochigi 36.45 139.35 500 1100

9 Okukinu, Tochigi 36.36 139.56 400 1100

10 Numata, Gumma 36.35 139.00 500 1000

11 Chichibu, Saitama 35.55 139.00 500 1100

12 Hyonosen 35.35 134.30 200 800

13 Okutama, 35.35 139.20 600 850

14 Onzui-Mt.Mimuro 35.15 134.25 560 930

15 Hagacho, Hyogo 35.10 134.35 200 810

16 Oozorayama, 35.10 133.50 400 910

17 Hieizan, Shiga 35.07 135.49 500 !

s6

18 Gozaishosan, 35.00 136.25 520 1020

19 Mengamesan, 34.55 132.40 650 !

20 Hikimi-Sandankyo, Hiroshima 34.35 132.10 450 880

21 Osorakanzan, 34.35 132.05 750 !

22 Anzojiyama 34.30 132.00 800 !

23 Jipposan, Hinoshima 34.30 132.05 750 1050

24 Naganoyama 34.15 131.55 800 !

25 Gomadan, Wakayama 34.03 135.29 ! 1050

26 Yazurayama, Tokushima 34.00 134.05 850 1250

27 Miune, Kochi 33.53 133.58 ! 1400

28 Ohtasan, Wakayama 33.44 135.45 500 1000

29 Nomuracho, Ehime 33.25 132.35 900 1000

30 Kunimidake, Shiibamura, Miyazaki 32.30 131.00 1000 1300

F. multinervis

1 Ulreung-do, South Korea 37.29 130.54 300 960

F. sylvatica

1 Pindhos Mts, Greece 39.20 21.35 ! 2000

2 Olympus, Greece 40.05 22.21 ! 2000

3 Harz-Mts, Germany 51.47 10.39 ! 800

4 Campania, Apennines, Italy 40.40 15.02 500 1300

5 Lazio, Apennines, Italy 41.55 13.20 350 1500

6 Abruzzi, Apennines, Italy 42.10 13.30 ! 1500

7 Sicilia, Apennines, Italy 37.50 14.00 950 1750

8 Romagna, Apennines, Italy 44.25 10.00 ! 1600

9 Saphane Da., Kutahya, Turkey 39.02 29.14 ! 1500

10 Simav, Kutahya, Turkey 39.05 28.59 ! 1700

11 Kaz-Dagi, Turkey 39.41 26.52 ! 1300

12 Bergen, Norway 60.24 5.140 43 43

13 Oslo, Norway 59.56 10.44 94 94

14 Jomfruland, Norway 58.52 9.36 45 45

15 Kyrkerud, Sweden 59.23 12.07 110 110

16 Linkoping, Sweden 58.25 15.38 64 64

17 Skara,Sweden 58.24 13.27 115 115

18 Ketrzyn, Poland 54.06 21.23 ! !

19 Blalystok, Poland 53.09 23.09 ! !

20 Lublin, Poland 51.15 22.35 ! !

21 Suwalki, Poland 54.07 22.56 ! !

22 Zamosc, Poland 50.44 23.15 ! !

23 Gorodenka, Ukraine 48.40 25.30 265 265

24 Kamenetz-Podolsk, Ukraine 48.40 26.36 258 258

25 Nemirov, Ukraine 48.58 28.50 285 285

26 Nizhniy, Olchedaev, Ukraine 48.38 27.40 187 187

27 Simferopol, Ukraine 44.57 34.06 205 205

28 Staro, Konstantinov 49.45 27.13 279 279

s7

29 Tarnopol, Ukraine 49.33 25.36 320 320

30 Zdolbunovo, Ukraine 50.30 26.10 20 20

31 Cuenca, Spain 40.05 -2.08 987 987

32 Gerona, Spain 41.59 2.50 95 95

33 Marseille, Observ, France 43.18 5.23 75 75

34 Albertacce, Corsica 42.17 8.55 1074 1074

35 Sartene, Corsica 41.36 8.59 50 50

36 Catanzaro, Italy 38.55 16.37 343 343

37 Enna, Italy 37.34 14.18 950 950

38 Gambarie, Utaly 38.10 15.51 1300 1300

39 Linguaglossa, Italy 37.50 15.10 560 560

40 Petrlia, Sottana, Italy 37.48 14.06 930 930

41 Tindari, Italy 38.08 15.04 280 280

42 Komotini, Greece 41.07 25.24 30 30

43 Trikala, Greece 39.33 21.46 150 150

44 Bourgas, Bulgaria 42.30 27.28 17 17

45 Kazanlak, Bulgaria 42.37 25.24 372 372

46 Kolarovgrad ,Bulgaria 43.16 26.55 ! !

F. orientalis

1 Ulu-dagi, turkey 40.12 29.04 ! 1600

2 Murat Da., Kutahya, Turkey 38.56 29.43 1700 2000

3 Turkmen Da., Turkey 39.50 30.10 1400 1600 4 Duldul Da., Gokcayir to Atlik Y., Adana, Turkey 37.04 36.15 1600 1700

5 Buyukduz, Turkey 41.20 32.30 ! 1450

6 Zonguldak, south Anatolia, Turkey 41.26 31.47 200 !

7 Bolu, south Anatolia, Turkey 40.35 31.50 900 !

8 Yalnizcam Mts, northeast Turkey 41.03 42.28 50 !

F. grandifolia 1 Grand Anse, Cape Breton island, NS 46.49 60.48 11 11 2 Northeast Margaree, Cape Breton Island 46.20 61.00 61 61 3 Barney’s River region, Pictou Co, NS 45.36 62.16 76 76 4 Tignish, Prince Edward Island, NB 46.55 64.02 3 3 5 Richibucto, NB 46.41 64.52 38 38 6 Bonaventure, NB 48.03 65.29 8 8 7 Newcastle, NB 47 65.34 34 34 8 Causapscal, NB 48.22 67.14 26 26 9 NW NEW Brunswick 48 67.55 152 152 10 Rimouski, New Brunswick (NB) 48.26 68.33 411 411 11 Trois-Pistoles, Riviere-du-Loup, PQ 48.05 69.1 61 61 12 Cantons-de-l’ Est, Que 47.21 69.56 15 15 13 Henri, Levis Co 46.42 70.04 351 351 14 Baie-St-Paul, PQ d’orleans, Quebec City 47.25 70.32 15 15 15 d’ orleans, Quebec City 47.2 70.45 15 15 16 Cap-Rouge, Ile d’ orleans, Que 47 70.52 320 320 17 Saint-Joseph-de-la-Pointe, Levis Co 46.48 71.05 145 145

s8

18 Mont Megantic 45.27 71.1 354 354 19 Levis City, Levis Co 46.48 71.11 184 184 20 Saint-Lambert, Levis Co 46.35 71.13 152 152 21 Saint-Nicolas, Levis Co 46.42 71.27 184 184 22 Ste-Agathe, PQ 46.14 73.38 59 59 23 Lac-Cayamant, Que 46.08 76.15 170 170 24 Fort Coulonge, PQ 45.51 76.44 168 168 25 South of Temiskaming, ON 46.45 78.1 172 172 26 Mattawa, ON 46.19 78.42 172 172 27 Temiscaming, Que 46.43 79.06 181 181 28 North Bay City, ON 46.19 79.28 201 201 29 Sturgeon Falls, ON 46.22 79.55 358 358 30 Cache Lake, Algonquin Park, ON 46.22 79.59 198 198 31 Capreol, ON 46.43 80.56 237 237 32 Sudbury, ON 46.3 81 259 259 33 Espanola, ON 46.15 81.46 206 206 34 SE-Shore of Lake Superior 46.55 84.2 212 212 35 Sault Ste. Marie, ON 46.31 84.2 192 192 36 Univ of Michigan Biol Station, MI 45.34 84.42 216 216 37 Bay-Mills TP, Chipperwa Co, MI 46.27 84.46 220 220 38 New-Berry-Luce-co-MI 46.21 85.3 270 270 39 Washington Island, Door Co, Wisconsin 45.23 86.55 189 189 40 Chatham, Alger Co, MI 46.21 86.56 267 267 41 Ishpeming, Marquette Co, Mi 46.29 87.4 431 431 42 Iron Mountain City, Dickinson Co, MI 45.49 88.04 352 352 43 Northern Great Lakes region, Menominee Co, WIS 44.53 88.38 246 246 44 Iron River City, Iron Co, MI 46.06 88.38 452 452 45 Grand-marais, MI 46.4 85.59 230 230 46 Crivitz, high-fall, WIS 45.17 88.12 252 252 47 Fairhope, AL 30.33 87.53 7 7 48 Mobile, AL 30.41 88.15 64.3 64.3 49 Robertsdale, AL 30.32 87.4 47 47 50 Apalachicola 29.44 82.02 4 4 51 De Funiak, FL 30.44 86.07 70 70 52 Gainesville, FL 29.38 82.21 26.2 26.2 53 Lake City, FL 30.11 82.36 59 59 54 Madison, FL 30.28 83.25 58 58 55 Milton, FL 30.47 87.08 66 66 56 monticello, FL 30.32 83.55 45 45 57 Nicelle, FL 30.31 86.3 18 18 58 Pensacola 30.28 87.12 34 34 59 Saint Marks, FL 30.05 84.1 5 5 60 Tallahassee, FL 30.23 84.22 17 17 61 Albany, GA 31.32 84.08 55 55 62 Brooklet. GA 32.23 81.41 58 58 63 Camilla,GA 31.14 84.13 53 53

s9

64 Dublin, GA 32.3 82.54 66 66 65 Eastman, GA 32.12 83.12 122 122 66 Hawkinsville, GA 32.17 83.28 74 74 67 Savannah, GA 32.08 81.12 14 14 68 Swainsboro, GA 32.35 82.22 99 99 69 Warrenton, GA 30.48 83.54 64 64 70 Baton-rouge, LA 30.32 91.08 20 20 71 Carville, LA 30.12 91.07 8 8 72 Jennings 30.15 92.4 9 9 73 Lake-charles, LA 30.07 93.13 3 3 74 Melville, LA 30.41 91.45 9 9 75 Reserve, LA 30.04 90.34 4 4 76 Biloxi-City, MISS 30.24 88.54 5 5 77 Gulfport-naval 30.23 89.08 11 11 78 Picayune, Miss 30.31 89.41 15 15 79 Wiggins, Miss 30.48 89.06 61 61 80 Liberty, Tex 30.03 94.49 11 11 81 Port-Arthur 29.57 94.01 5 5

F. mexicana 1 Zacatlamaya Mts, Hidolgo 20.4 98.4 1800 1920 2 Cerro de Tutotepec, Hidolgo 20.2 98.2 1800 1920 3 Ojo-de-Agua, Temaulipas 24.15 98.25 1200 1520 4 Teziutlan, Puebla 19.5 97.2 2000 2000

s10

Table S1. Statistics for climatic variables at lower (southern) and upper (northern) limits of distribution for world beech species. AMT: annual mean temperature; WI: warmth index; CI: coldness index; ABT: annual biotemperature; MTWM: mean temperature for the warmest month; MTCM: mean temperature for the coldest month; ART: annual range of mean temperature; K: continental index; AP: annual precipitation; PET: annual potential evapotranspiration; AAE: actual annual evapotransporation; Im: moisture index; and EQ: Ellenberg quotient. Symbol “-“ means no estimation.

Distribution limits

Lower or southern limit Upper or northern limit

Climatic index

Mean SD Min Max Mean SD Min Max

F. engleriana

AMT (oC) 12.4 2.51 8.3 17.7 7.3 1.88 3.7 12.8

WI (oC·month) 99.0 22.40 57.6 152.4 56.0 14.19 32.2 99.9

CI (oC·month) -10.1 8.61 -27.3 0.0 -28.1 10.40 -52.9 -6.1

ABT (oC) 12.5 2.37 8.5 17.7 8.1 1.50 5.6 12.8

MTWM (oC) 23.0 1.72 17.1 26.0 17.8 2.23 13.6 23.1

MTCM (oC) 1.1 3.55 -4.1 8.2 -3.9 2.36 -8.9 1.7

ART (oC) 21.9 2.70 17.8 26.1 21.7 2.65 17.8 26.1

K 53.3 8.12 41.3 66.1 52.8 7.75 41.3 66.1

AP (mm) 1229.6 359.34 738.1 2394.5 1366.4 241.65 1180.4 2394.5

PET (mm) 805.4 139.40 421.3 940.8 795.6 137.16 421.3 911.5

AAE (mm) 803.3 137.8 421.3 940.8 793.5 136.0 421.3 908.5

Im 61.4 82.32 0.0 356.4 70.0 76.98 36.3 356.4

EQ (oC/mm) 21.7 5.80 6.1 32.0 19.4 3.98 6.1 22.5

F. hayatae

AMT (oC) 12.8 2.06 9.1 15.4 9.2 2.07 6.3 11.9

WI (oC·month) 99.4 22.36 67.6 132.1 67.0 13.26 52.4 89.2

CI (oC·month) -6.4 6.08 -17.9 0.0 -16.6 13.73 -36.4 0.0

ABT (oC) 12.8 2.00 9.3 15.4 9.5 1.66 7.5 11.9

MTWM (oC) 22.4 4.31 16.9 29.2 18.6 2.14 16.3 21.9

MTCM (oC) 2.1 3.26 -2.3 7.3 -0.7 4.15 -5.9 5.4

ART (oC) 20.3 6.10 11.5 28.3 19.3 4.85 11.5 23.5

K 50.7 16.74 27.1 75.0 46.3 11.21 27.1 56.1

AP (mm) 1669.9 515.72 1141.0 2558.0 2232.5 340.65 1694.5 2558.0

PET (mm) 914.6 188.11 587.0 1133.5 887.0 193.10 587.0 1133.5

AAE (mm) 914.6 188.11 587.0 1133.5 887.0 193.10 587.0 1133.5

Im 85.5 54.20 24.4 182.1 109.8 34.81 84.4 182.1

EQ (oC/mm) 17.0 5.20 10.8 24.1 13.2 1.74 10.8 16.5

F. longipetiolata

AMT (oC) 14.3 2.15 9.6 21.6 8.9 1.76 4.9 13.3

WI (oC·month) 115.9 22.64 75.5 198.9 66.2 13.75 36.5 99.3

CI (oC·month) -4.1 4.20 -19.9 0.0 -19.8 8.42 -39.8 0.0

ABT (oC) 14.3 2.13 9.9 21.6 9.2 1.48 6.1 13.3

MTWM (oC) 24.2 1.69 20.7 27.4 18.9 2.08 14.5 22.4

MTCM (oC) 3.5 3.16 -2.6 15.1 -2.0 2.19 -6.3 6.0

ART (oC) 20.8 2.97 10.7 25.5 20.9 2.47 12.0 25.5

K 54.1 9.81 25.9 72.2 54.2 8.44 31.4 72.2

s11

AP (mm) 1421.0 386.11 729.5 2394.5 1738.2 165.37 1582.8 2394.5

PET(mm) 845.4 163.31 421.3 1190.7 621.2 93.91 421.3 811.6

AAE (mm) 831.8 154.9 421.3 1114.9 619.2 88.5 430.9 798.6

Im 77.5 77.07 -4.4 356.4 132.6 63.35 97.0 356.4

EQ (oC/mm) 19.0 5.08 6.1 29.4 14.7 2.60 6.1 17.2

F. lucida

AMT (oC) 12.7 2.07 8.5 17.6 8.8 1.81 3.6 12.5

WI (oC·month) 100.6 18.45 68.8 150.8 66.4 12.49 35.1 95.3

CI (oC·month) -8.2 7.26 -27.3 0.0 -21.3 10.20 -52.9 -5.3

ABT (oC) 12.8 1.97 9.2 17.6 9.2 1.40 5.7 12.5

MTWM (oC) 23.0 1.40 20.5 25.5 19.1 1.57 14.9 21.7

MTCM (oC) 1.5 2.89 -4.2 8.4 -2.4 2.39 -8.9 1.9

ART (oC) 21.5 2.40 15.3 26.1 21.5 2.12 17.7 25.8

K 57.8 7.91 41.8 72.9 57.8 7.93 41.8 72.9

AP (mm) 1418.6 311.55 822.0 2205.7 1756.7 114.30 1574.9 2205.7

PET(mm) 874.0 145.23 421.3 1190.7 674.4 94.88 421.3 854.4

AAE (mm) 862.7 138.0 421.3 1114.9 671.7 90.1 431.4 842.6

Im 70.0 67.93 -3.8 356.5 168.5 51.14 92.2 356.5

EQ (oC/mm) 19.5 4.82 6.1 32.0 13.8 2.32 6.1 17.0

F. crenata

AMT (oC) 9.5 1.26 5.7 12.0 5.0 1.25 2.3 7.6

WI (oC·month) 74.8 10.21 52.0 95.2 45.1 5.73 31.9 56.1

CI (oC·month) -21.3 6.68 -43.7 -6.9 -45.2 10.21 -66.3 -25.3

ABT (oC) 9.8 1.02 7.3 12.0 6.7 0.68 5.3 8.1

MTWM (oC) 21.8 1.62 19.1 24.8 17.6 0.69 15.6 18.8

MTCM (oC) -2.1 1.57 -6.8 1.8 -6.8 1.81 -10.4 -3.3

ART (oC) 23.9 1.94 19.8 26.9 24.4 1.75 20.9 26.9

K 48.5 3.02 41.2 54.5 48.8 3.34 41.2 55.3

AP (mm) 2047.2 525.76 1135.0 3323.0 2660.3 280.00 1948.6 3323.0

PET(mm) 706.2 85.46 548.3 900.7 606.8 33.30 548.3 688.3

AAE (mm) 706.2 85.5 548.3 900.7 606.8 33.30 548.3 688.3

Im 189.9 64.52 62.9 357.3 241.3 30.11 182.8 357.3

EQ (oC/mm) 12.5 3.10 7.3 20.6 9.5 1.20 7.3 12.8

F. jopanica

AMT (oC) 11.7 1.03 10.3 14.8 9.0 0.99 7.3 11.8

WI (oC·month) 91.8 8.71 81.1 117.5 70.3 7.09 55.3 87.2

CI (oC·month) -12.0 4.09 -19.1 -0.3 -21.9 5.18 -29.1 -6.0

ABT (oC) 11.7 1.00 10.5 14.8 9.4 0.82 7.9 11.8

MTWM (oC) 23.9 1.11 21.9 26.0 21.2 0.84 19.5 22.4

MTCM (oC) 0.3 1.31 -1.8 4.7 -2.2 1.25 -4.1 1.7

ART (oC) 23.7 1.25 20.0 26.8 23.4 1.22 20.0 25.0

K 48.8 3.08 41.3 53.1 48.6 3.03 41.3 53.1

AP (mm) 1805.2 617.07 1148.0 4006.0 2328.7 452.47 1807.0 4006.0

PET(mm) 746.6 62.51 543.5 854.7 716.4 44.50 543.5 752.1

s12

AAE (mm) 746.6 62.51 543.5 854.7 716.4 44.50 543.5 752.1

Im 142.0 78.51 52.1 373.9 206.5 51.49 153.0 373.9

EQ (oC/mm) 15.3 4.21 6.5 22.7 11.5 1.99 6.5 14.7

F. multinervis

AMT (oC) 11.5 - - - 7.6 - - -

WI (oC·month) 90.2 - - - 59.0 - - -

CI (oC·month) -11.9 - - - -27.5 - - -

ABT (oC) 11.5 - - - 8.3 - - -

MTWM (oC) 23.4 - - - 19.5 - - -

MTCM (oC) 0.1 - - - -3.8 - - -

ART (oC) 23.3 - - - 23.3 - - -

K 45.0 - - - 45.0 - - -

AP (mm) 1485.0 - - - - - - -

PET(mm) 702.6 - - - - - - -

AAE (mm) 702.6 - - - - - - -

Im 111.3 - - - - - - -

EQ (oC/mm) 16.1 - - - - - - -

F. grandifolia

AMT (oC) 19.5 0.76 17.2 21.0 4.2 0.88 1.6 6.0

WI (oC·month) 173.4 9.14 146.5 192.0 50.7 4.74 36.1 61.2

CI (oC·month) 0.0 0.00 0.0 0.0 -60.5 8.17 -76.9 -38.1

ABT (oC) 19.5 0.76 17.2 21.0 7.0 0.48 5.5 8.1

MTWM (oC) 27.5 0.41 26.7 28.4 18.4 0.84 16.0 20.1

MTCM (oC) 10.4 1.20 7.2 13.6 -11.4 1.95 -13.7 -6.6

ART (oC) 17.1 1.10 13.8 19.5 29.8 2.13 24.5 32.2

K 36.8 3.04 27.4 45.0 49.5 5.03 37.4 55.3

AP (mm) 1425.7 166.81 1148.0 1668.0 1020.9 168.18 790.3 1426.5

PET (mm) 1024.2 40.43 907.8 1100.3 537.8 19.86 475.9 583.8

AAE (mm) 996.9 69.0 840.5 1100.3 530.5 18.6 475.9 575.5

Im 40.3 14.64 20.6 65.6 91.1 34.34 43.3 168.2

EQ (oC/mm) 19.5 2.27 16.3 23.6 18.5 3.29 12.5 24.9

F. mexicana

AMT (oC) 15.6 1.51 14.3 17.4 14.8 1.79 13.6 17.4

WI (oC·month) 127.3 1.52 111.8 149.0 117.1 1.80 103.4 149.0

CI (oC·month) 0.0 0.0 0.0 0.0 0.0 0.0 0.0 0.0

ABT (oC) 15.6 1.51 14.3 17.4 14.8 1.8 13.6 17.4

MTWM (oC) 19.6 1.59 18.1 21.1 18.7 1.6 17.4 20.8

MTCM (oC) 10.5 2.59 7.9 14.1 9.7 3.1 7.2 14.1

ART (oC) 9.1 2.10 6.7 11.2 9.1 2.1 6.7 11.2

K 22.2 7.46 13.7 13.7 22.2 7.5 13.7 13.7

AP (mm) 1741.0 470.00 1109.0 2240.0 - - - -

PET(mm) 949.0 264.80 715.0 1263.0 - - - -

AAE (mm) 906.0 203.1 715.0 1088.0 - - - -

Im 103.1 89.80 -6.7 200.4 - - - -

s13

EQ (oC/mm) 14.5 7.50 8.6 25.3 - - - -

F. sylvatica

AMT (oC) 13.5 2.23 9.1 17.0 6.6 1.40 4.5 8.9

WI (oC·month) 104.3 23.39 59.3 144.2 47.7 9.75 28.0 65.5

CI (oC·month) -2.7 4.35 -13.9 0.0 -28.3 9.36 -42.7 -12.4

ABT (oC) 13.5 2.22 9.1 17.0 7.2 1.07 5.2 8.9

MTWM (oC) 23.0 2.58 17.4 28.8 16.9 1.75 12.5 20.2

MTCM (oC) 4.7 2.75 -1.0 9.8 -2.7 2.13 -6.3 1.6

ART (oC) 18.2 2.60 14.2 23.0 19.6 2.72 12.8 22.9

K 27.7 6.61 16.1 41.0 25.8 9.74 4.7 41.2

AP (mm) 905.9 387.48 573.0 1864.0 1272.3 492.57 524.0 1958.0

PET(mm) 749.8 82.24 608.4 946.5 577.6 52.29 445.9 652.1

AAE (mm) 497.1 55.8 414.4 625.1 496.7 19.2 466.3 549.0

Im 38.1 65.17 -8.2 211.4 119.3 82.62 -2.7 240.3

EQ (oC/mm) 29.0 9.54 9.3 39.4 16.8 9.55 5.4 34.9

F. orientalis

AMT (oC) 10.2 2.74 7.5 14.3 6.5 1.98 4.9 9.9

WI (oC·month) 78.3 26.52 56.3 126.1 46.3 14.50 29.9 69.1

CI (oC·month) -16.2 10.20 -27.7 -0.8 -28.5 10.45 -37.6 -10.7

ABT (oC) 10.4 2.57 8.0 14.4 7.1 1.68 5.4 9.9

MTWM (oC) 20.5 3.73 17.6 27.8 16.1 1.95 13.3 18.4

MTCM (oC) -1.5 3.64 -6.0 4.2 -3.2 2.26 -5.0 0.7

ART (oC) 22.0 4.88 16.6 29.9 19.3 2.25 16.6 22.2

K 38.1 12.11 22.4 57.0 31.5 6.58 22.4 40.1

AP (mm) 744.8 335.68 526.0 1261.0 911.8 246.55 709.6 1261.0

PET(mm) 717.2 175.77 524.1 1044.1 668.9 9.14 653.8 676.8

AAE (mm) 486.5 144.5 344.7 673.6 460.3 4.9 452.1 464.6

Im 15.4 31.20 -5.1 76.7 23.8 29.93 7.3 76.7

EQ (oC/mm) 32.7 9.77 17.2 44.7 27.9 6.53 17.2 32.4

s14

Table S2. Loadings of climatic variables derived from Principal Component Analysis for the first three principal components for distribution limits of world beech species. For abbreviations of climatic variables see Table S1.

Lower (southern) limit Upper (northern) limit Variable PCA 1 PCA 2 PCA 3 PCA 1 PCA 2 PCA 3

All beech species AMT (oC) 0.97 0.15 0.00 0.98 0.02 -0.12 WI (oC·month) 0.95 0.14 0.03 0.89 0.24 0.13 CI (oC·month) 0.85 0.16 -0.10 0.91 -0.17 -0.31 ABT (oC) 0.97 0.15 0.00 0.93 0.15 0.02 MTWM (oC) 0.73 0.06 0.16 0.59 0.34 0.51 MTCM (oC) 0.96 0.23 -0.14 0.88 -0.25 -0.38 ART (oC) -0.73 -0.26 0.29 -0.61 0.41 0.62 K -0.42 -0.22 0.68 0.22 0.16 0.80 AP (mm) -0.34 0.83 0.35 0.23 -0.83 0.38 PET (mm) 0.54 -0.22 0.68 0.63 0.31 0.22 AAE (mm) 0.42 -0.05 0.84 0.62 0.23 0.37 Im -0.50 0.84 -0.08 0.03 -0.92 0.29 EQ (oC/mm) 0.28 -0.89 -0.25 -0.13 0.89 -0.35 Chinese beeches AMT (oC) 0.96 0.20 0.07 0.99 0.12 0.03 WI (oC·month) 0.93 0.24 0.03 0.92 0.30 0.20 CI (oC·month) 0.90 0.03 0.20 0.95 -0.13 -0.20 ABT (oC) 0.96 0.21 0.06 0.97 0.21 0.08 MTWM (oC) 0.58 0.22 0.01 0.67 0.50 0.52 MTCM (oC) 0.97 0.12 0.09 0.93 -0.17 -0.30 ART (oC) -0.73 0.01 -0.09 -0.39 0.56 0.70 K -0.61 0.07 0.28 -0.09 0.53 0.77 AP (mm) 0.00 -0.69 0.71 0.33 -0.63 0.25 PET (mm) -0.32 0.62 0.70 0.09 0.83 -0.24 AAE (mm) -0.33 0.62 0.69 0.08 0.83 -0.25 Im 0.21 -0.95 0.10 0.14 -0.82 0.42 EQ (oC/mm) -0.27 0.85 -0.41 -0.23 0.86 -0.35 F. crenata AMT (oC) 0.91 0.42 -0.03 0.95 0.31 0.01 WI (oC·month) 0.71 0.68 0.07 0.80 0.44 0.34 CI (oC·month) 0.96 -0.10 -0.17 0.95 -0.21 -0.20 ABT (oC) 0.82 0.55 0.00 0.88 0.39 0.21 MTWM (oC) 0.38 0.89 0.09 0.43 0.58 0.62 MTCM (oC) 0.95 -0.09 -0.21 0.92 0.23 -0.27 ART (oC) -0.45 0.82 0.25 -0.83 -0.02 0.54 K 0.05 0.45 0.50 -0.06 -0.42 0.86 AP (mm) 0.38 -0.70 0.59 0.69 -0.62 0.09 PET (mm) 0.43 -0.70 -0.39 -0.36 0.73 0.08 AAE (mm) 0.43 -0.70 -0.39 -0.36 0.73 0.08 Im 0.25 -0.40 0.87 0.63 -0.51 0.21 EQ (oC/mm) -0.38 0.47 -0.77 -0.69 0.60 -0.10 F. japonica AMT (oC) 0.92 0.38 -0.01 0.93 0.31 -0.18 WI (oC·month) 0.86 0.46 -0.06 0.84 0.47 -0.24 CI (oC·month) 0.96 0.16 0.08 0.98 0.07 0.07 ABT (oC) 0.92 0.38 -0.02 0.92 0.33 -0.19 MTWM (oC) 0.46 0.84 -0.09 0.40 0.80 -0.38

s15

MTCM (oC) 0.97 0.09 0.05 0.97 -0.02 -0.06 ART (oC) -0.61 0.65 -0.14 -0.71 0.57 -0.20 K -0.52 0.08 0.11 -0.40 0.53 0.23 AP (mm) 0.64 -0.68 -0.19 0.71 -0.56 0.32 PET (mm) 0.30 -0.31 0.88 0.33 0.67 0.66 AAE (mm) 0.30 -0.31 0.88 0.33 0.67 0.66 Im 0.55 -0.63 -0.49 0.57 -0.75 -0.02 EQ (oC/mm) -0.43 0.73 0.39 -0.46 0.77 -0.25 F. grandifolia AMT (oC) 0.97 -0.19 0.11 0.75 -0.66 0.08 WI (oC·month) 0.97 -0.19 0.11 0.98 -0.02 0.19 CI (oC·month) -0.08 -0.36 0.24 0.39 -0.91 0.01 ABT (oC) 0.97 -0.19 0.11 0.97 -0.14 0.18 MTWM (oC) 0.54 -0.18 0.79 0.90 0.09 0.33 MTCM (oC) 0.97 -0.14 -0.18 0.15 -0.98 -0.11 ART (oC) -0.86 0.08 0.49 0.26 0.93 0.25 K -0.68 0.19 0.68 0.38 0.88 0.27 AP (mm) 0.57 0.81 0.12 -0.67 -0.35 0.65 PET (mm) 0.91 -0.30 0.27 0.98 -0.05 0.17 AAE (mm) 0.94 0.09 0.00 0.82 -0.16 0.26 Im 0.23 0.97 0.06 -0.78 -0.29 0.55 EQ (oC/mm) -0.57 -0.81 -0.04 0.86 0.25 -0.43 European beeches AMT (oC) 0.95 0.24 0.17 0.63 0.76 -0.11 WI (oC·month) 0.89 0.38 0.20 0.89 0.40 0.06 CI (oC·month) 0.92 -0.26 -0.04 0.04 0.95 -0.29 ABT (oC) 0.94 0.27 0.17 0.79 0.59 -0.02 MTWM (oC) 0.72 0.56 0.38 0.90 0.20 0.16 MTCM (oC) 0.94 -0.23 -0.12 -0.20 0.88 -0.39 ART (oC) -0.44 0.73 0.45 0.73 -0.52 0.39 K -0.43 0.72 0.46 0.56 -0.08 0.82 AP (mm) 0.04 -0.91 0.35 -0.63 0.55 0.46 PET (mm) 0.58 0.02 -0.48 0.37 0.46 0.32 AAE (mm) 0.31 -0.49 -0.07 0.34 -0.32 -0.69 Im -0.13 -0.86 0.44 -0.73 0.44 0.34 EQ (oC/mm) -0.09 0.87 -0.43 0.76 -0.42 -0.34

s16

Table S3. Coefficient of correlation between annual mean temperature (AMT) and other thermal variables in the distribution range of beech species. Sample size is 310 for the upper (northern) limit, and 292 for lower (southern) limit.

Parameter Lower limit Upper limit Warmth index (oC.month) 0.99 0.93 Coldness index (oC.month) 0.88 0.95 Annual biotemperature (oC) 1.00 0.96 Mean temperature for the warmest month (oC) 0.85 0.61 Mean temperature for the coldest month (oC) 0.98 0.93 Minimum mean temperature (oC) 0.95 0.90 Annual range of temperature (oC) -0.79 -0.69

s17


Recommended