Clinical application of the pO 2 —pCO 2 diagram P.-E. PAULEV and O. SIGGAARD-ANDERSEN Institute of Medical Physiology, Panum Institute, University of Copenhagen Based on the classic, linear blood gas diagram a logarithmic blood gas map was constructed. The scales were extended by the use of logarithmic axes in order to allow for high patient values. Patients with lung disorders often have high arterial carbon dioxide tensions, and patients on supplementary oxy- gen typically respond with high oxygen tensions off the scale of the classic diagram. Two case histories illustrate the clinical application of the logarithmic blood gas map. Variables from the two patients were measured by the use of blood gas analy- sis equipment. Measured and calculated values are tabulated. The calculations were performed using the oxygen status algo- rithm. When interpreting the graph for a given patient it is recommended first to observe the location of the marker for the partial pressure of oxygen in inspired, humidified air (I) to see whether the patient is breathing atmospheric air or air with supplementary oxygen. Then observe the location of the arter- ial point (a) to see whether hypoxemia or hypercapnia appears to be the primary disturbance. Finally observe the alveolo-arterial oxygen tension difference to estimate the degree of veno-arterial shunting. If the mixed venous point (v) is available, then observe the value of the mixed venous oxygen tension. This is the most important indicator of global tissue hypoxia. Accepted for publication 7 June 2004 Key words: acid-base status; blood gas tensions; hypercap- nia; hypoxaemia; supplementary oxygen, veno-arterial shunting. # Acta Anaesthesiologica Scandinavica 48 (2004) W ALLACE O. Fenn and Hermann Rahn in 1955 (1) used a diagram with the partial pressure of oxygen (pO 2 ) on the abscissa and the partial pressure of carbon dioxide (pCO 2 ) on the ordinate to illustrate important relationships between these partial pres- sures in inspired air (I), mixed expired air (E), end expired air (eE), and ideal alveolar air (A). The latter represents alveolar air from alveoli with the same ventilation/perfusion ratio as the overall pulmonary ventilation/perfusion ratio, while end expired air represents mixed alveolar air from all alveoli. The diagram also illustrates the relationships between the partial pressures in alveolar air and the gas tensions in arterial and mixed venous blood. The diagram is a useful didactic tool, as elegantly elaborated by John B. West in his classic monograph ‘Ventilation/blood flow and gas exchange’ from 1965 (2). The purpose of this report is to re-emphasize the utility of the pO 2 —pCO 2 diagram, not only for teaching purposes but also for practical clinical application. In the following, we first describe the theory of the dia- gram and then illustrate the clinical application using two selected examples. Normal and extreme blood gas values were taken from Siggaard-Andersen (3) and Siggaard-Andersen, Fogh-Andersen, Gøthgen and Larsen (4). The classic pO 2 —pCO 2 diagram The diagram, shown in Fig. 1, has a linear pO 2 scale as abscissa, extending from 0 to 25 kPa, and a linear pCO 2 scale as ordinate, extending from 0 to 15 kPa. Points ‘A’, ‘eE’, ‘E’, and ‘I’ fall on a straight line: the ‘air line’ (Fig. 1). The total distance (A—I) indicates the tidal volume. The relative distances along the line indicate the relative sizes of the alveolar dead space (A—eE) and the total physiological dead space (A—E) as fractions of the tidal volume. The pO 2 of the inspired air is calculated by multiplying the fraction of oxygen in the dry inspired air (FO 2 I dry ) with the total ambient pressure (Pamb) less the water vapour pressure (pH 2 OI): pO 2 I ¼ FO 2 I dry ðPamb pH 2 OIÞ ð1Þ: Notice that ‘I’ refers to air saturated with water vapour at the temperature of the patient; I dry refers to dry inspired air. The substance fraction of oxygen in dry atmospheric air is 0.2095. Ambient barometric pressure at sea level is 101.325 kPa ¼ 1 atm. The partial pressure of water vapour in humidified inspired air, also called ‘saturated water vapour pressure’, is 6.27 kPa at 37 C. With these values pO 2 I is calculated to be 19.9 kPa. Acta Anaesthesiol Scand 2004; 48: 1105—1114 Copyright # Acta Anaesthesiol Scand 2004 Printed in Denmark. All rights reserved ACTA ANAESTHESIOLOGICA SCANDINAVICA doi: 10.1111/j.1399-6576.2004.00487.x 1105
Transcript
Clinical application of the pO2—pCO2 diagram
P.-E. PAULEV and O. SIGGAARD-ANDERSEN
Institute of Medical Physiology, Panum Institute, University of Copenhagen
Based on the classic, linear blood gas diagram a logarithmicblood gas map was constructed. The scales were extended bythe use of logarithmic axes in order to allow for high patientvalues. Patients with lung disorders often have high arterialcarbon dioxide tensions, and patients on supplementary oxy-gen typically respond with high oxygen tensions off the scaleof the classic diagram. Two case histories illustrate the clinicalapplication of the logarithmic blood gas map. Variables fromthe two patients were measured by the use of blood gas analy-sis equipment. Measured and calculated values are tabulated.The calculations were performed using the oxygen status algo-rithm. When interpreting the graph for a given patient it isrecommended first to observe the location of the marker forthe partial pressure of oxygen in inspired, humidified air (I) tosee whether the patient is breathing atmospheric air or air withsupplementary oxygen. Then observe the location of the arter-
ial point (a) to see whether hypoxemia or hypercapnia appears tobe the primary disturbance. Finally observe the alveolo-arterialoxygen tension difference to estimate the degree of veno-arterialshunting. If the mixed venous point (v) is available, thenobserve the value of the mixed venous oxygen tension. This isthe most important indicator of global tissue hypoxia.
WALLACE O. Fenn and Hermann Rahn in 1955 (1)used a diagram with the partial pressure of
oxygen (pO2) on the abscissa and the partial pressureof carbon dioxide (pCO2) on the ordinate to illustrateimportant relationships between these partial pres-sures in inspired air (I), mixed expired air (E), endexpired air (eE), and ideal alveolar air (A). The latterrepresents alveolar air from alveoli with the sameventilation/perfusion ratio as the overall pulmonaryventilation/perfusion ratio, while end expired airrepresents mixed alveolar air from all alveoli. Thediagram also illustrates the relationships between thepartial pressures in alveolar air and the gas tensions inarterial and mixed venous blood.
The diagram is a useful didactic tool, as elegantlyelaborated by John B. West in his classic monograph‘Ventilation/blood flow and gas exchange’ from 1965 (2).
The purpose of this report is to re-emphasize theutility of the pO2—pCO2 diagram, not only for teachingpurposes but also for practical clinical application. Inthe following, we first describe the theory of the dia-gram and then illustrate the clinical application usingtwo selected examples. Normal and extreme bloodgas values were taken from Siggaard-Andersen (3)and Siggaard-Andersen, Fogh-Andersen, Gøthgenand Larsen (4).
The classic pO2—pCO2 diagram
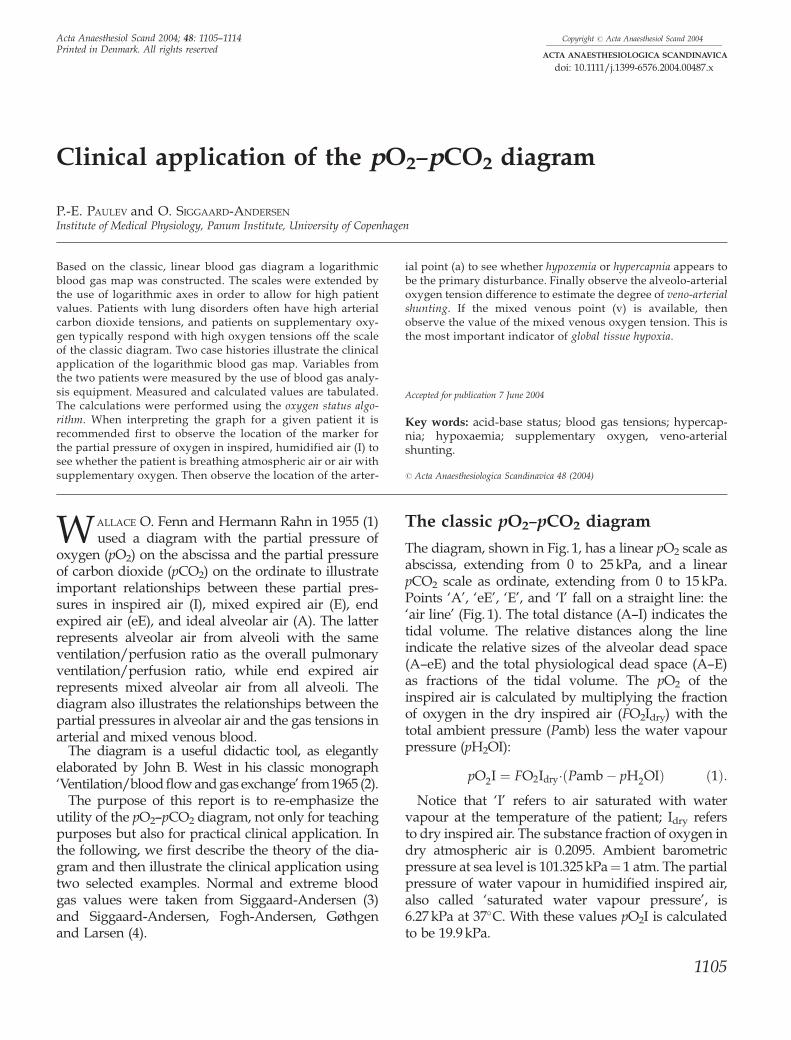
The diagram, shown in Fig. 1, has a linear pO2 scale asabscissa, extending from 0 to 25 kPa, and a linearpCO2 scale as ordinate, extending from 0 to 15 kPa.Points ‘A’, ‘eE’, ‘E’, and ‘I’ fall on a straight line: the‘air line’ (Fig. 1). The total distance (A—I) indicates thetidal volume. The relative distances along the lineindicate the relative sizes of the alveolar dead space(A—eE) and the total physiological dead space (A—E)as fractions of the tidal volume. The pO2 of theinspired air is calculated by multiplying the fractionof oxygen in the dry inspired air (FO2Idry) with thetotal ambient pressure (Pamb) less the water vapourpressure (pH2OI):
pO2I ¼ FO2Idry�ðPamb � pH2OIÞ ð1Þ:Notice that ‘I’ refers to air saturated with water
vapour at the temperature of the patient; Idry refersto dry inspired air. The substance fraction of oxygen indry atmospheric air is 0.2095. Ambient barometricpressure at sea level is 101.325 kPa¼ 1 atm. The partialpressure of water vapour in humidified inspired air,also called ‘saturated water vapour pressure’, is6.27 kPa at 37�C. With these values pO2I is calculatedto be 19.9 kPa.
Printed in Denmark. All rights reservedACTA ANAESTHESIOLOGICA SCANDINAVICA
doi: 10.1111/j.1399-6576.2004.00487.x
1105
The carbon dioxide partial pressure, pCO2, is0.03 kPa in atmospheric air, i.e. virtually zero. There-fore the mark ‘I’ is located on the abscissa(pCO2¼ 0 kPa) at a pO2 of 19.9 kPa.
Mixed total expired air is typically collected in aDouglas bag. End expiratory air, sampled after washout of all inspired air in trachea and bronchi, repre-sents mixed alveolar air. Ideal alveolar air cannot besampled. It represents alveolar air from alveoli withthe same local ventilation-perfusion ratio as the over-all ratio for both lungs.
The pCO2 and pO2 of alveolar air are closely corre-lated: a high pCO2A is associated with a low pO2A,and vice versa. The relationship is given by the ‘alveo-lar air equation’ which expresses the pO2 of idealalveolar air as a function of pCO2A:
pO2A¼ pO2I�pCO2A � ½R�1�FO2Idry � ðR�1�1Þ� ð2Þ:
Not surprisingly, the CO2/O2 exchange ratio, R, is avariable in the equation. On a pure carbohydrate dietR¼ 1.0, pure lipid combustion gives R¼ 0.70, and anormal mixed diet gives R 0.85. When R isunknown, which is generally the case, a defaultvalue of 0.85 is employed. When FO2Idry¼ 1.0 (i.e.breathing pure oxygen) or R¼ 1.0 then the equationsimplifies to pO2A¼ pO2I� pCO2A.
The pCO2A may be replaced by the pCO2 of thearterial blood (pCO2a), the difference being negligible(pCO2a slightly higher than pCO2A depending upon theshunt fraction). Hence the alveolar point ‘A’ may bedetermined when the arterial pCO2 has been measured.
The alveolar air equation shows that when pO2A isplotted as a function of pCO2A, then the relationship is
a straight line with a slope — [R�1� FO2dI � (R�1�1)].Hence, when pCO2A is plotted as a function of pO2A asin Fig. 1, the slope � is the reciprocal:
�¼ �R=½1 � FO2Idry � ð1 � RÞ� ð3Þ:� is the slope of the line connecting the points ‘I’, ‘E’,‘eE’, and ‘A’ in Fig. 1. We call this line the ‘air line’.When the ‘air line’ has been established the value of �is calculated as:
�¼ �pCO2eE=ðpO2I � pO2eEÞ ð4Þ:Rearranging the first equation for � (Eqn 3) providesthe R-value as a function of �
R ¼ �� � ð1 � FO2IdryÞ=ð1þ� � FO2IdryÞ ð5Þ:Hence plotting the ‘air line’ and calculating the slopeallows calculation of the R-value, provided FO2Idry < 1;if FO2Idry¼ 1 then�¼�1 and the denominator becomeszero, i.e. R is undetermined. The slope of the ‘air line’numerically approaches the R-value. If R¼ 1.0 then�¼�1 regardless of the value of FO2Idry. If FO2Idry¼ 1then �¼�1 regardless of the value of R. When R¼ 0.85and FO2Idry¼ 0.2095, then �¼�0.88, i.e. almost, but notquite the same absolute value as R. Several textbooksignore the difference between � and R.
For a patient in steady state, an R-value between 0.7and 1.0 provides information on the composition ofthe diet. If the patient is not at steady state, theR-value may be lower than 0.7, indicating retention ofCO2 in the body, for example due to hypoventilationor developing metabolic alkalosis. A value above 1.0indicates excessive elimination of CO2, for example dueto hyperventilation or developing metabolic acidosis.
Mixed expired air is a mixture of alveolar air andinspired air from the physiological dead space. Therefore‘E’ falls on the line connecting ‘A’ and ‘I’. The positionof ‘E’ gives a visual impression of the relative size ofthe physiological dead space, given by the ratio AE/AI.
As shown in Fig. 1, the composition of ideal alveolarair (point A) and mixed alveolar air (end expiratoryair) is different, the point ‘eE’ being somewhat belowthe point ‘A’ on the air line. The cause of this differ-ence is that neither ventilation nor blood perfusion isuniform throughout the lungs. The regional pulmon-ary blood flow per unit lung volume increases fromalmost zero at the upper parts (apex) to the base of thelungs in a resting, upright person, due to the effect ofgravity on the blood. The regional alveolar ventilationof the lung expressed per unit lung volume alsoincreases from the apex to the base — but to a lesserdegree. Therefore, the regional ventilation/perfusionratio (V/Q) decreases from the apex to the base ofthe lung.
15
Air lines
p CO2
kPa
p O2kPa
10
5
00 5 10 15 20 25
R 0.86 1.0
a
AeE
E
Fig. 1. The pO2—pCO2 diagram. Mark ‘a’ represents arterial bloodand the surrounding ellipse the normal area. Mark ‘I’ indicateshumidified inspired air (tracheal air). The position of mark ‘A’,indicating ideal alveolar air, is calculated from pO2I and thearterial pCO2 using the ‘alveolar air equation’. The mark ‘E’ maybe plotted when mixed expired air has been analyzed, and the mark‘eE’ when a sample of end expiratory air has been analyzed.
P.-E. Paulev et al.
1106
At the apex some alveoli are ventilated but withzero blood flow, i.e. an infinitely high V/Q ratio,equivalent to alveolar dead space (Fig. 2). The averageV/Q ratio at the apex is about 3. At the base somealveoli are perfused but with zero ventilation, i.e. aV/Q ratio of zero, equivalent to true shunting. Theaverage V/Q ratio at the base of the lungs is about0.6. The majority of alveoli are both perfused andventilated and the overall V/Q ratio is about 0.9,with V about 5 and Q about 5.5 l/min in an adult.
The sigmoid cumulated distribution curve (Fig. 2)starts slightly above zero, indicating the fraction ofalveoli with zero ventilation (equivalent to a trueshunt fraction of about 3%). The curve levels offbefore reaching 1, indicating the presence of alveoliwithout any blood flow (equivalent to an alveolardead space of about 3%). However, in a patient withpulmonary disease, the distribution curve is probablyfar from log-normal. It may be bi-modal or multi-modal if different parts of the lungs have widelydifferent V/Q ratios.
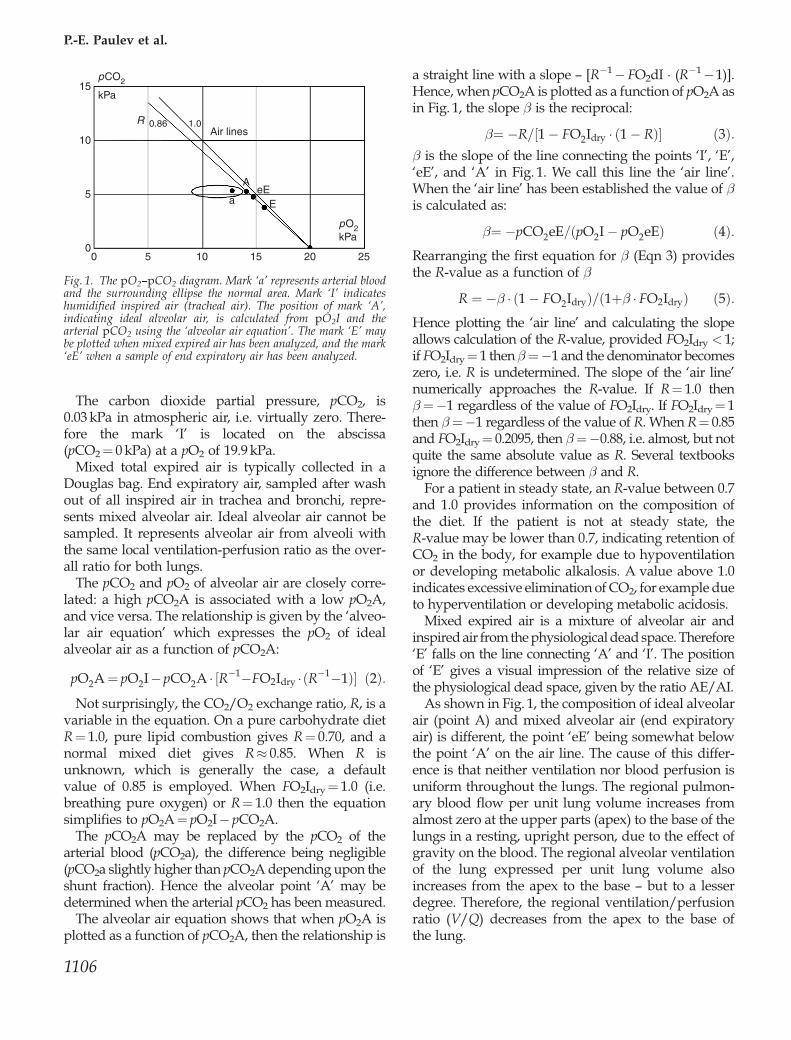
The V/Q dispersion causes a dispersion of the com-position of alveolar air from the individual alveoli.Alveoli with a high V/Q ratio have air compositionsapproaching that of inspired air. The R-value of thesealveoli approaches a value of about 10, because theblood gives off almost all CO2 (about 23 mmol/l) andtakes up O2 corresponding to pO2I¼ 19.9 kPa (about2.3 mmol/l). An R-value of about 10 gives a slope, �,of about �3.5.
Alveoli with a low V/Q ratio have air compositionsapproaching the gas tensions of mixed venous blood,
i.e. pCO2 about 5.3 kPa and pO2 about 5.0 kPa fornormal values. The slope of the air line, �, thereforeis about 5.3/(19.9—5)¼�0.356, corresponding to anR-value of 0.304. Fig. 3 shows the pO2 and pCO2
values for all individual alveoli. The values form acurve starting at ‘I’ with slope �3.5, passing throughA, and ending at the point ‘v’, representing mixedvenous blood. The point eE is slightly below thecurve because it represents the weighted average ofthe dispersion of points along the convex curve.
The composition of capillary blood from differentalveoli also differs. Assuming that there is completediffusion equilibrium for carbon dioxide as well asoxygen, the pCO2 of blood and alveolar air fromeach individual alveolus must be identical and thesame applies to pO2. Nevertheless, mixed alveolarair (end expiratory air) and mixed blood from all thealveoli will have different pCO2 as well as pO2,because the alveolar air predominantly arises fromalveoli with a high V/Q ratio, while the blood pre-dominantly arises from alveoli with a low V/Q ratio.Therefore the blood pO2 is somewhat lower than thealveolar pO2, while the blood pCO2 is only slightlyhigher than the alveolar pCO2. The composition ofmixed blood is more difficult to calculate than thatof mixed alveolar air. Mixing two equal volumes ofblood with different pO2 values does not provide themean value of the two pO2 values. It provides themean value of the concentration of total oxygen inthe two blood volumes. Due to the curvature of theoxygen binding curve the resulting pO2 value is lowerthan the mean pO2.
Three alveoli with or without gas exchangeVariations in ventilation/perfusion ratio
Cumulated Noof lung units
Alveolar dead space
Log V/QTrue shunt
00/10 1 10
Relative Noof lung units
Alveolar dead space
Log V/Q
True shunt0
0/10 1 10KMc
pO2hl
pO2hl
pCO2hl
pCO2hl
unchanged inspired gas
unchanged blood gas
V
Embolus-no bloodflowV/Q =
V/Q = 1
V/Q = 0
V = 0
Mucous plug
Trapped air
Fig. 2. Ventilation—perfusion dispersionamong different alveoli in the upright lung.The upper alveolus is distended while theblood flow is interrupted creating an alveolardead space. The lower alveolus has noventilation, but a high blood flow, creatinga true shunt. Between these extremes allpossible ventilation—perfusion ratios (V/Q)exist. A hypothetical distribution curve forlog (V/Q) is shown (dotted curve), as well asthe sigmoid-cumulated distribution curve.
The blood gas map
1107
While the point ‘eE’ so to say slides down from ‘A’along the ‘air line’ (Fig. 3) in proportion to the V/Qdispersion, the arterial point ‘a’ slides left from thepoint ‘A’ along an almost horizontal curve, whichgradually bends upwards towards the point ‘v’.
The alveolo-arterial pO2 difference reflects the sizeof V/Q dispersion but also increases with true veno-arterial shunting, i.e. blood bypassing functioningalveoli. In special cases, lack of diffusion equilibriumfor oxygen between alveolar air and blood may con-tribute to an increased alveolo-arterial pO2 difference.All three causes of hypoxemia are reflected in thephysiological (apparent) shunt fraction. The latter isdefined as the shunt equation:
Fva¼ ðctO2A � ctO2aÞ=ðctO2A � ctO2vÞ ð6Þ:The ctO2A is the concentration of total oxygen inblood with the same pO2 and pCO2 as the alveolarair, ctO2a is the concentration of total oxygen in arter-ial blood, and ctO2v that of mixed venous blood.
The size of the physiological shunt fraction due toV/Q dispersion can be estimated by calculation.Assuming that the standard deviation of the loga-rithmic V/Q dispersion is 1, corresponding to a 95%interval of V/Q from 1/4 to 4, then the estimatedphysiological shunt fraction is about 3%. In otherwords the V/Q dispersion accounts for only 50% orless of the normal value for the physiological shuntfraction (5.7—13% in Table 1). A very large V/Q dis-persion is required to cause a substantial increase inphysiological shunt fraction. Therefore the main causeof a high physiological shunt fraction remains to betrue veno-arterial shunting, either true intrapulmon-
ary shunting (e.g. atelectases) or true extrapulmonaryshunting (e.g. cardiac veins draining into the leftatrium or veno-arterial shunting due to congenitalcardiac disease).
Model calculationThe V/Q-ratio of one lung is assumed to be 2 (two partsof air and one part of blood) and in the other lung 0.5(one part of air and two parts of blood). Hereby thetotal V/Q is one. Let us further assume that the patientis on a pure carbohydrate diet (R¼ 1.0) and that totaldiffusion equilibrium is established for both oxygenand carbon dioxide in both lungs.
Calculations show an apparent veno-arterial shuntfraction of 5.2% although no true shunt is present. Inthe lung with V/Q¼ 2 the R equals 1.8 and in the lungwith V/Q¼ 0.5 the R is 0.6. The total R is 1.
Although alveoli with a high V/Q ratio have a highCO2/O2 exchange ratio (R-value) compared withalveoli with a low V/Q ratio, there is no relationshipbetween the overall V/Q ratio and the overall CO2/O2 exchange ratio. The overall CO2/O2 exchange ratiodepends on the type of food consumed (carbohydrate,protein or fat). The overall V/Q ratio depends on thecardiac and the pulmonary function. The CO2/O2
exchange ratio remains about 0.85 on a mixed dietregardless of the V/Q ratio. The overall V/Q ratio assuch has only minor clinical interest, but the V/Qdispersion among different alveoli is clinically relevant.A large V/Q dispersion causes an alveolo-arterialpO2 difference and an apparent (physiological) veno-arterial shunting even in the presence of completediffusion equilibrium in each individual alveolus andin the absence of any true veno-arterial shunting.
The logarithmic blood gas map
Patients with obstructive and restrictive lung disor-ders often have rather high arterial carbon dioxide ten-sions. Patients on supplementary oxygen frequentlyrespond with high oxygen tensions. In order to allowfor high patient values, we have extended the scalesby the use of logarithmic axes (Fig. 4).
The pO2 axis now extends from 1 to 300 kPa, thepCO2 axis from 1 to 20 kPa. The mark ‘I’ for humidi-fied inspired air would fall far below the abscissa at apCO2 of 0.03 kPa. Therefore the mark is placed at alevel with the alveolar pCO2 and hence only indicatespO2I. Another mark at the same level, the mark‘Pamb’, indicates ambient barometric pressure. Atsea level ‘Pamb’ will be close to 100 kPa. The positionof ‘I’ in relation to ‘Pamb’ indicates the fraction of
15
Air lines
p CO2kPa
p O2kPa
10
5
00 5 10 15 20 25
R 0.86 1.0
a
AV
V/Q → 0R → 0.30
β → –0.36
V/Q → ∞R → 10
β → –3.5
eEE
l
Fig. 3. The pO2—pCO2 diagram with the ‘alveolar curve’indicating the composition of alveolar air from individual alveoli.The majority of alveoli have compositions close to the mark ‘A’ forideal alveolar air, but alveoli with a very high V/Q ratio havevalues close to the mark ‘I’, while alveoli with very low V/Q ratiohave values close to the mark ‘v’ for mixed venous blood. The mark‘a’ indicates the composition of arterial blood. The slope (b) of theair lines is indicated for V/Q ! 0 and V/Q ! 1.
P.-E. Paulev et al.
1108
oxygen in dry inspired air. The extension of the pO2
scale to 300 kPa allows plotting values during hyper-baric oxygenation.
The point ‘a’ indicates the pO2 and pCO2 values ofthe arterial blood as measured with a blood gas ana-lyzer but referring to the temperature of the patient.When mixed venous blood has been collected simul-taneously with the arterial, the point ‘v’ indicatingmixed venous blood, is also plotted. In the presentcase, mixed venous blood was not available and thepoint ‘v’ is only shown to illustrate possible values.The normal arterial tensions are indicated by thegreen elliptic area, whereas the normal area for themixed venous point is merely outlined (Fig. 4). Thearterial oxygen extraction tension, pO2x, is indicatedby the red mark ‘x’. It predicts the pO2 of the arterialblood after an oxygen extraction of 2.3 mmol/l. Thenormal interval for pO2x is the same as for the mixedvenous pO2 (point ‘v’). If the mixed venous pO2 (bluepoint ‘v’) is lower than pO2x (red mark ‘x’) then thisindicates that the arterio-venous oxygen extraction ishigher than 2.3 mmol/l, which is generally due to alow cardiac output. Similarly a blue point ‘v’ situatedat a higher pO2 than the red ‘x’ mark indicates a high
cardiac output. On the basis of values for fraction ofinspired oxygen, barometric pressure, patient temp-erature, and arterial and mixed venous blood gas datait is possible to calculate the position of the alveolarpoint ‘A’. The alveolo-arterial pO2 difference is due tophysiological veno-arterial shunting and above the A—a interval the value of the calculated shunt fraction iswritten. If mixed venous blood gas data are not avail-able the calculation is based on a standard value forthe arterio-venous oxygen concentration difference of2.3 mmol/l, the normal mean value at rest.
The position of the ‘air curve’ is calculated from thealveolar air equation on the basis of a standard valuefor R of 0.85 unless the true value has been measuredby respiratory gas analysis.
Extending from the arterial normal area are fourreference areas or bands indicating the four maintypes of blood gas disturbances: primary hyper-capnia, primary hypocapnia, primary hyperoxaemia,and primary hypoxemia. The areas of primary hyper-capnia and hypocapnia extend upwards and down-wards along the hyperbolic alveolar pCO2-pO2 curve.An increase in pCO2 causes a fall in pO2, while a fallin pCO2 causes a small rise in pO2. An example of
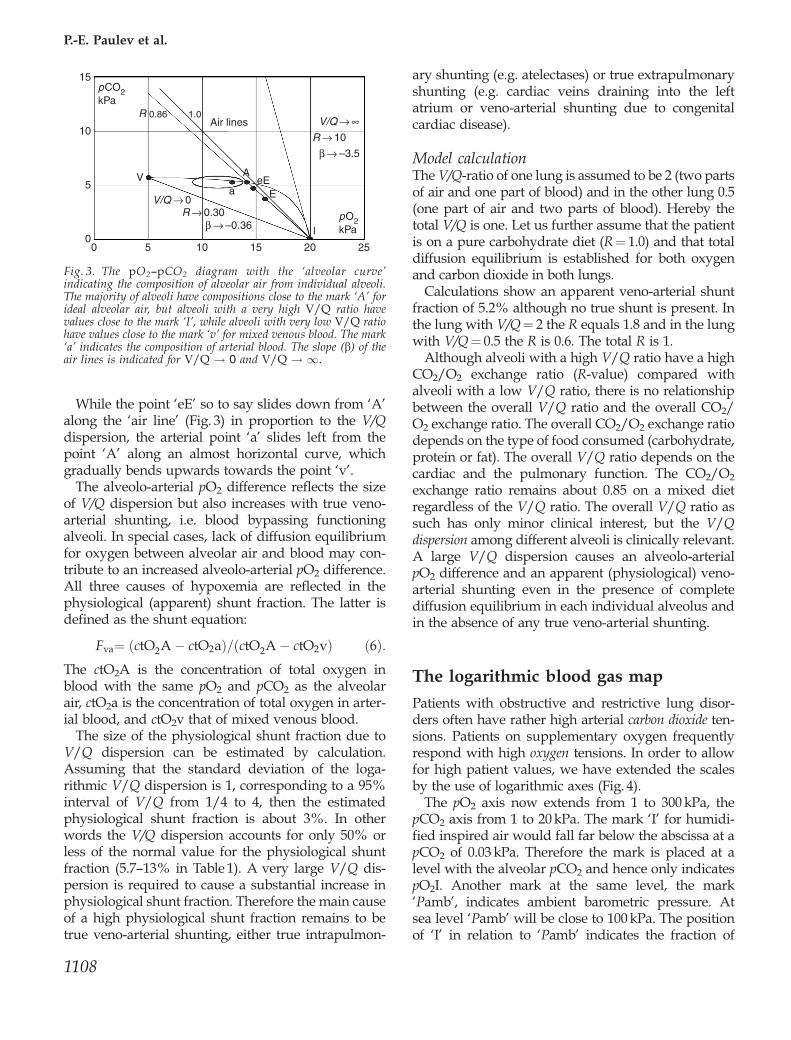
*FO2Idry was estimated on the basis of a flow of pure oxygen of 8 l/min on a Venturi mask (T. Waldau, personal communication).†FO2Idry was set on respirator.‡{R was calculated from pO2eE and pCO2eE (Eqns 4 and 5).§**R was assumed to remain the same as the previously measured value. The fraction of fetal haemoglobin was taken to be 0.005(default value for adults).
The blood gas map
1109
primary hypercapnia is emphysema where alveolarhypoventilation is dominating while veno-arterialshunting may be less pronounced. An example ofprimary hypocapnia is hyperventilation due to anx-iety or fever. The areas of primary hyperoxaemia andhypoxemia extend horizontally from the normal areawith a downward bend of the primary hypoxemiaarea. An increase in arterial pO2 due to increasedinspired oxygen does not cause any change in ven-tilation and hence the pCO2 remains constant. A fall inarterial pO2, however, due to a low barometric pres-sure, low inspired oxygen, or veno-arterial shuntingcauses a stimulation of the peripheral chemoreceptorsand hence a hyperventilation with a reduction inpCO2 as already realized by Rahn & Otis in 1949 (5).
The position of the arterial point in relation to thereference areas and the marks of barometric pressureand inspired oxygen give an immediate visualimpression of the causes and severity of disturbancesin the blood gases.
When interpreting the graph for a given patient firstobserve the location of the marker (‘I’, indicating thepO2 of humidified inspired air) to see whether thepatient is breathing atmospheric air or receives sup-plementary oxygen. Then observe the location of the
arterial point to see whether hypoxaemia or hypercapniaappears to be the primary and most important dis-turbance. Finally observe the alveolo-arterial pO2 dif-ference to estimate the degree of veno-arterial shunting.If the mixed venous point is available, then observethe value of the mixed venous pO2. This is the mostimportant indicator of whole-body or global tissuehypoxia.
The following two case histories illustrate the clin-ical application of the diagram. Variables from thetwo patients were measured by the use of blood gasanalysis equipment. Measured and calculated valuesare shown in Table 1. The calculations were performedusing the oxygen status algorithm (6).
Case 1
A previously healthy male of 39 years was received inthe intensive care unit with high fever, cyanosis, dys-pnoea and thoracic rales. A chest X-ray showed aninfiltrate in the left lung indicating pneumonia. Whilethe patient was breathing ambient air the ventilationwas measured to be 14 l/min using a pneumotacho-graph and a gas monitor, and the end expiratory pO2
and pCO2 were measured to be within the reference
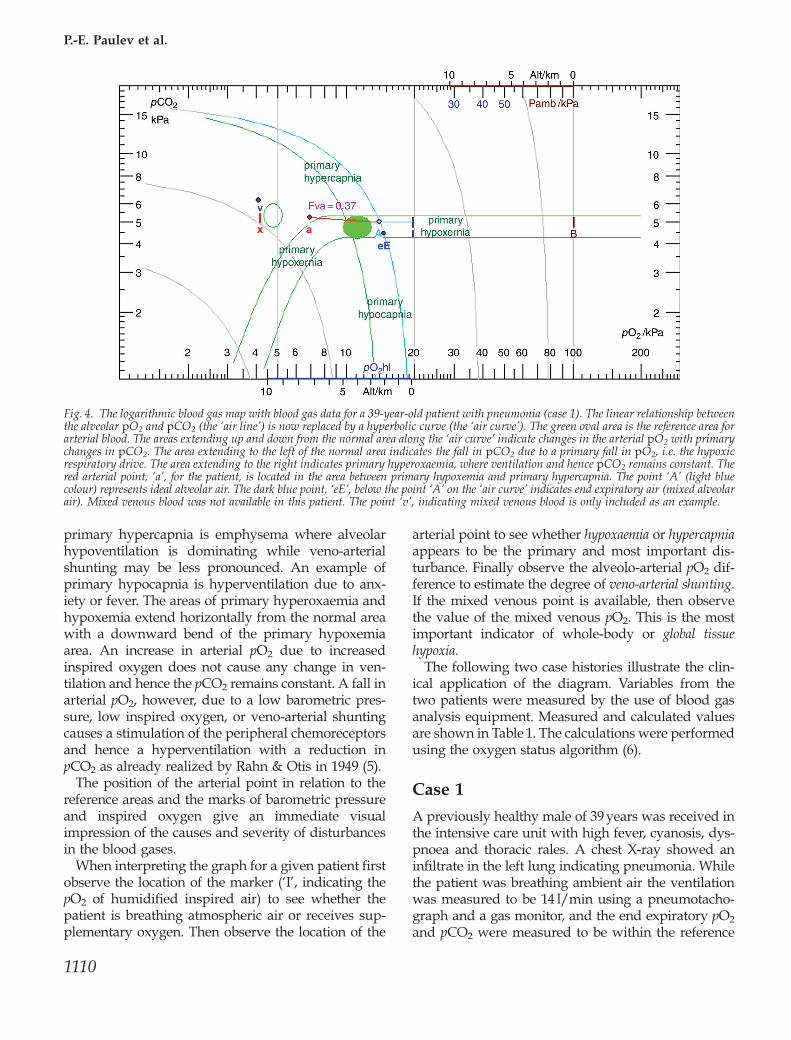
Fig. 4. The logarithmic blood gas map with blood gas data for a 39-year-old patient with pneumonia (case 1). The linear relationship betweenthe alveolar pO2 and pCO2 (the ‘air line’) is now replaced by a hyperbolic curve (the ‘air curve’). The green oval area is the reference area forarterial blood. The areas extending up and down from the normal area along the ‘air curve’ indicate changes in the arterial pO2 with primarychanges in pCO2. The area extending to the left of the normal area indicates the fall in pCO2 due to a primary fall in pO2, i.e. the hypoxicrespiratory drive. The area extending to the right indicates primary hyperoxaemia, where ventilation and hence pCO2 remains constant. Thered arterial point, ‘a’, for the patient, is located in the area between primary hypoxemia and primary hypercapnia. The point ‘A’ (light bluecolour) represents ideal alveolar air. The dark blue point, ‘eE’, below the point ‘A’ on the ‘air curve’ indicates end expiratory air (mixed alveolarair). Mixed venous blood was not available in this patient. The point ‘v’, indicating mixed venous blood is only included as an example.
P.-E. Paulev et al.
1110
interval. An arterial blood sample was obtained fromthe radial artery and the blood was analyzed with ablood gas analyzer. Measured and calculated data andreference values are given in Table 1.
The blood gas map for this patient (Fig. 4) showedmark ‘I’ (for pO2I) at about 20 kPa indicating that hewas breathing atmospheric air at a total pressure ofapproximately 100 kPa (mark ‘B’). The R-value wascalculated from the end expired pO2 and pCO2 valuesto be 0.85 (Eqns 4 and 5). This R-value was used forcalculation of pO2 of the ideal alveolar air (Eq. 2). Thealveolar pCO2 value was estimated from the arterialpCO2 taking the shunt fraction into account by aniterative calculation (6). The alveolar pO2 and pCO2
values are illustrated by point ‘A’ (14.1 and 5.2 kPa,respectively). The arterial point ‘a’ was well outside tothe left of the reference area (9.1—12.4 kPa) due to ahigh alveolo-arterial pO2 difference (14.1—6.9¼7.2 kPa). The physiological veno-arterial shunt frac-tion was estimated to be 37% (Fig. 4). The shunt frac-tion was calculated using an arterio-venous oxygenconcentration difference of 2.3 mmol/l (the defaultvalue used when mixed venous blood was not avail-able for analysis). The oxygen extraction tension was4.17 kPa, i.e. slightly decreased. Titratable hydrogenion of the extended extracellular fluid was normal(0.4 mmol/l), see Table 1.
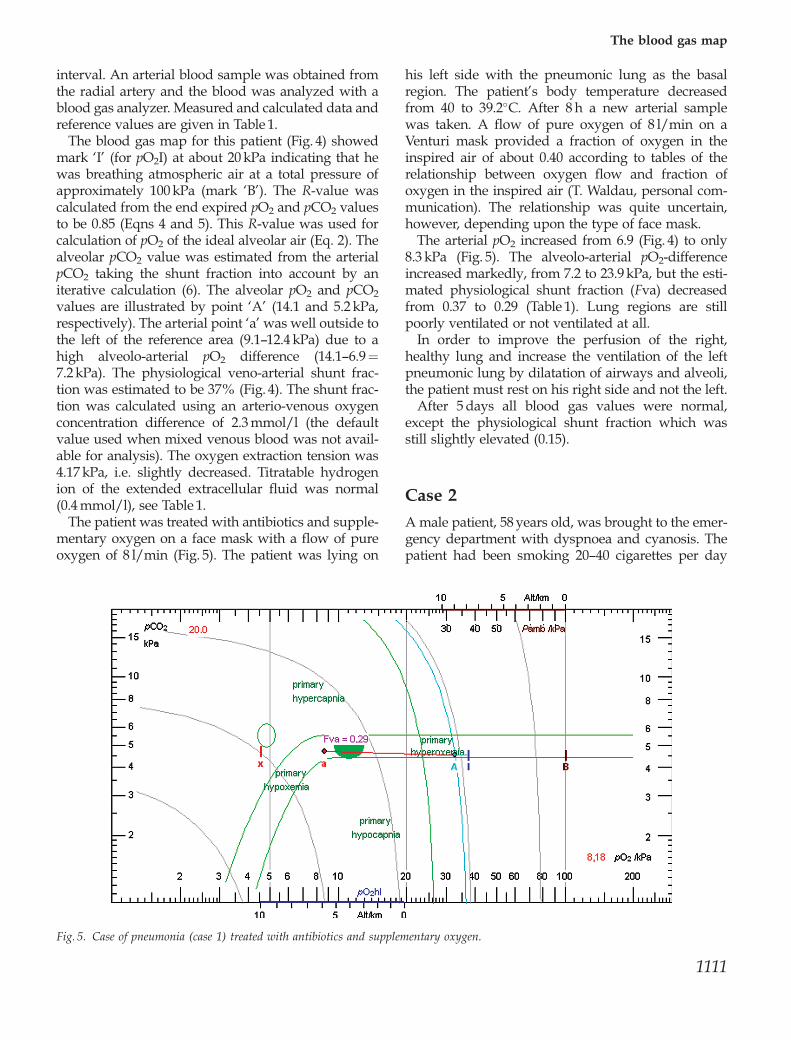
The patient was treated with antibiotics and supple-mentary oxygen on a face mask with a flow of pureoxygen of 8 l/min (Fig. 5). The patient was lying on
his left side with the pneumonic lung as the basalregion. The patient’s body temperature decreasedfrom 40 to 39.2�C. After 8 h a new arterial samplewas taken. A flow of pure oxygen of 8 l/min on aVenturi mask provided a fraction of oxygen in theinspired air of about 0.40 according to tables of therelationship between oxygen flow and fraction ofoxygen in the inspired air (T. Waldau, personal com-munication). The relationship was quite uncertain,however, depending upon the type of face mask.
The arterial pO2 increased from 6.9 (Fig. 4) to only8.3 kPa (Fig. 5). The alveolo-arterial pO2-differenceincreased markedly, from 7.2 to 23.9 kPa, but the esti-mated physiological shunt fraction (Fva) decreasedfrom 0.37 to 0.29 (Table 1). Lung regions are stillpoorly ventilated or not ventilated at all.
In order to improve the perfusion of the right,healthy lung and increase the ventilation of the leftpneumonic lung by dilatation of airways and alveoli,the patient must rest on his right side and not the left.
After 5 days all blood gas values were normal,except the physiological shunt fraction which wasstill slightly elevated (0.15).
Case 2
A male patient, 58 years old, was brought to the emer-gency department with dyspnoea and cyanosis. Thepatient had been smoking 20—40 cigarettes per day
Fig. 5. Case of pneumonia (case 1) treated with antibiotics and supplementary oxygen.
The blood gas map
1111
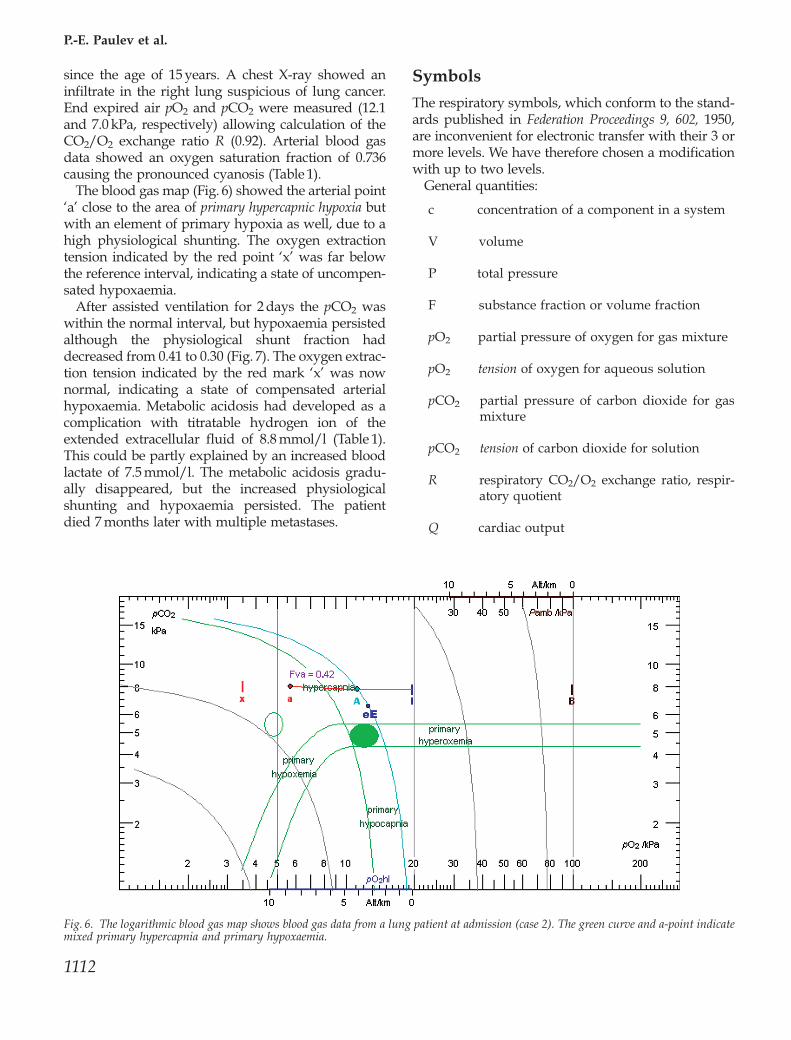
since the age of 15 years. A chest X-ray showed aninfiltrate in the right lung suspicious of lung cancer.End expired air pO2 and pCO2 were measured (12.1and 7.0 kPa, respectively) allowing calculation of theCO2/O2 exchange ratio R (0.92). Arterial blood gasdata showed an oxygen saturation fraction of 0.736causing the pronounced cyanosis (Table 1).
The blood gas map (Fig. 6) showed the arterial point‘a’ close to the area of primary hypercapnic hypoxia butwith an element of primary hypoxia as well, due to ahigh physiological shunting. The oxygen extractiontension indicated by the red point ‘x’ was far belowthe reference interval, indicating a state of uncompen-sated hypoxaemia.
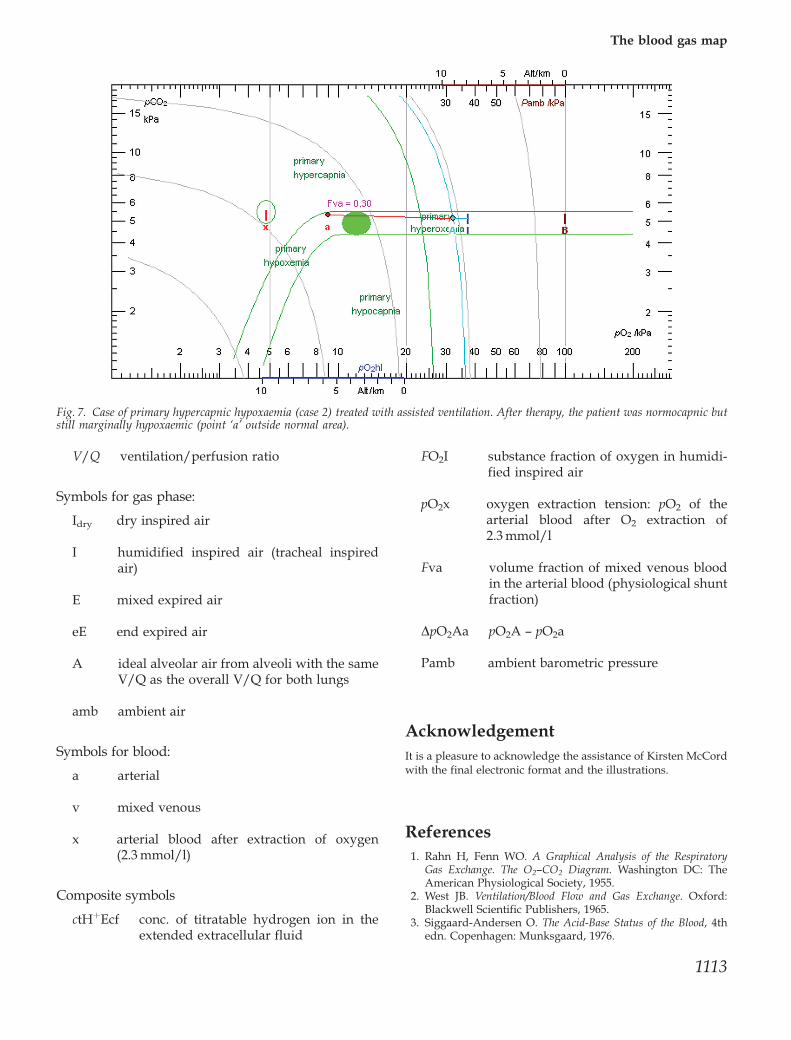
After assisted ventilation for 2 days the pCO2 waswithin the normal interval, but hypoxaemia persistedalthough the physiological shunt fraction haddecreased from 0.41 to 0.30 (Fig. 7). The oxygen extrac-tion tension indicated by the red mark ‘x’ was nownormal, indicating a state of compensated arterialhypoxaemia. Metabolic acidosis had developed as acomplication with titratable hydrogen ion of theextended extracellular fluid of 8.8 mmol/l (Table 1).This could be partly explained by an increased bloodlactate of 7.5 mmol/l. The metabolic acidosis gradu-ally disappeared, but the increased physiologicalshunting and hypoxaemia persisted. The patientdied 7 months later with multiple metastases.
Symbols
The respiratory symbols, which conform to the stand-ards published in Federation Proceedings 9, 602, 1950,are inconvenient for electronic transfer with their 3 ormore levels. We have therefore chosen a modificationwith up to two levels.
General quantities:
c concentration of a component in a system
V volume
P total pressure
F substance fraction or volume fraction
pO2 partial pressure of oxygen for gas mixture
pO2 tension of oxygen for aqueous solution
pCO2 partial pressure of carbon dioxide for gasmixture
pCO2 tension of carbon dioxide for solution
R respiratory CO2/O2 exchange ratio, respir-atory quotient
Q cardiac output
Fig. 6. The logarithmic blood gas map shows blood gas data from a lung patient at admission (case 2). The green curve and a-point indicatemixed primary hypercapnia and primary hypoxaemia.
P.-E. Paulev et al.
1112
V/Q ventilation/perfusion ratio
Symbols for gas phase:
Idry dry inspired air
I humidified inspired air (tracheal inspiredair)
E mixed expired air
eE end expired air
A ideal alveolar air from alveoli with the sameV/Q as the overall V/Q for both lungs
amb ambient air
Symbols for blood:
a arterial
v mixed venous
x arterial blood after extraction of oxygen(2.3 mmol/l)
Composite symbols
ctHþEcf conc. of titratable hydrogen ion in theextended extracellular fluid
FO2I substance fraction of oxygen in humidi-fied inspired air
pO2x oxygen extraction tension: pO2 of thearterial blood after O2 extraction of2.3 mmol/l
Fva volume fraction of mixed venous bloodin the arterial blood (physiological shuntfraction)
DpO2Aa pO2A — pO2a
Pamb ambient barometric pressure
AcknowledgementIt is a pleasure to acknowledge the assistance of Kirsten McCordwith the final electronic format and the illustrations.
References1. Rahn H, Fenn WO. A Graphical Analysis of the Respiratory
Gas Exchange. The O2—CO2 Diagram. Washington DC: TheAmerican Physiological Society, 1955.
2. West JB. Ventilation/Blood Flow and Gas Exchange. Oxford:Blackwell Scientific Publishers, 1965.
3. Siggaard-Andersen O. The Acid-Base Status of the Blood, 4thedn. Copenhagen: Munksgaard, 1976.
Fig. 7. Case of primary hypercapnic hypoxaemia (case 2) treated with assisted ventilation. After therapy, the patient was normocapnic butstill marginally hypoxaemic (point ‘a’ outside normal area).
The blood gas map
1113
4. Siggaard-Andersen O, Fogh-Andersen N, Gøthgen IH,Larsen VH. Oxygen status of arterial and mixed venousblood. Crit Care Med 1995; 23: 1284—93.
5. Rahn H, Otis AB. Mans respiratory response during and afteracclimatization to high altitude. Am J Physiol 1949; 157: 445—62.
6. Siggaard-Andersen M, Siggaard-Andersen O. Oxygen statusalgorithm, version 3, with some applications. Acta AnaesthesiolScand 1995; 39 (Suppl. 107): 13—20. URL http://www.osa.suite.dk
Address:P.-E. PaulevInstitute of Medical PhysiologyThe Panum InstituteUniversity of Copenhagen3 Blegdamsvej, DK-2200Copenhagene-mail: [email protected]