Neurology Clinical Clinical Neurological Imaging on an Open Bore MRI System (MAGNETOM Espree) Robert M. Cargile, M.D. 1 ; Agus Priatna, Ph.D. 2 ; Stefan Huwer 3 ; Tammie L.S. Benzinger, M.D., Ph.D. 1 1 Mallinckrodt Institute of Radiology, Washington University School of Medicine, St. Louis, MO, USA 2 R&D Collaborations, Siemens Medical Solutions, St. Louis, MO, USA 3 Siemens Healthcare, MR PLM AW Advanced Neuro, Erlangen, Germany Introduction An open bore MRI has the practical ad- vantage of accommodating large or claustrophobic patients. Unfortunately, until the advent of the 1.5T MAGNETOM Espree, “open” was often synonymous with inferior image quality. However, in addition to the large 70 centimeter bore, the Espree system offers advanced coil combinations using the Total imaging matrix (Tim) and isocenter imaging tech- nology. Together, these features allow for performance of advanced neuroim- aging protocols in new clinical popula- tions. This article demonstrates neuroimaging applications routinely obtained in our clinical practice at Mallinckrodt Institute of Radiology, Washington University School of Medicine in St. Louis. The open bore Espree delivers excellent image quality, expanding the utility of MRI to meet diagnostic challenges increasingly encountered in clinical neuroimaging. Methods Image acquisitions were performed with a 1.5 Tesla MAGNETOM Espree scanner using the 12-channel head coil and spine coils of the Total imaging matrix. Our standard neurological examination on the Espree system includes common cross-platform protocols such as MPRAGE, FLAIR, T2 TSE, DSC Perfusion, and Spec- troscopy. The Espree also enables ad- vanced imaging sequences, including T2 BLADE [1], Susceptibility-Weighted Imaging (SWI) [2], and Diffusion Tensor Imaging (DTI) [3], for which we use the following protocols: T2 BLADE protocol: TE = 102 msec, TR = 4000 msec, FOV = 240 mm, pFOV = 100%, slice thickness = 5 mm, base resolution = 384 (results in spatial resolution = 0.6 x 0.6 x 5.0 mm), aver- age = 1, concatenations = 2, flip angle = 150°, BLADE coverage = 111%, echo spacing = 6.64 msec, turbo factor = 35, echo train per slice = 20, motion correc- tion = ON, bandwidth = 362 Hx/pixel, acquisition time: 2:50 min. SWI protocol: TE = 40 msec, TR = 50 msec, FOV = 240, pFOV = 100%, slice thickness = 2 mm, slices per slab = 72, base resolution = 256, phase resolution = 79%, slice resolution = 75% (results in spatial resolution = 1.2 x 0.9 x 2.0 mm), average = 1, flip angle = 15, PAT acceler- ation factor = 2, bandwidth = 80 Hz/pix- el, spatial resolution = 1.2 x 0.9 x 2.0 mm, acquisition time 3:34 min. DTI protocol: TE = 107 msec, TR = 3500 msec, FOV = 240 mm, pFOV = 100%, slice thickness = 5 mm, base resolution = 128, phase resolution = 100% (results in spatial resolution = 1.9 x 1.9 x 5 mm), averages = 3, Fatsat, phase partial Fourier = 6/8, PAT acceleration factor = 2, echo spacing = 0.92 msec, EPI factor = 128, BW = 1220 Hz/pixel, b-values = 0, 1000 sec/mm2, 12 diffusion directions. Aver- age ADC map, trace-weighted map, FA map, and tensor data were created In- line. Acquisition time: 2:08 min. Post-processing was performed with the Neuro 3D application package. The package has the capability of processing directional color encoded fractional anisotropy map (blue = SI direction, green = AP direction, and red = RL direc- tion), tensor map, aligned tensor and anatomy data, aligned tensor and frac- tional anisotropy data, and tractography. Clinical cases The following examples demonstrate brain stem pathology which is difficult to image on a non-Tim system due to the position of the lesion and unavail- ability of coil combination. For brain- stem cases examined on the MAGNETOM Espree system, the head coil and cervi- cal spine elements were combined using the Total imaging matrix to better visual- ize the lesions. Tumor cases are also rou- tinely examined on the Espree system. An example is also included in this article. k Visit www.siemens.com/ magnetom-world to read T. Benzinger’s “Clinical Applications of Diffusion Tensor Imaging” published in MAGNETOM Flash 37, p. 74–86.
Clinical Neurological Imaging on an Open Bore MRI System (MAGNETOM Espree) Robert M. Cargile, M.D.1; Agus Priatna, Ph.D.2; Stefan Huwer3; Tammie L.S. Benzinger, M.D., Ph.D.1
1Mallinckrodt Institute of Radiology, Washington University School of Medicine, St. Louis, MO, USA2R&D Collaborations, Siemens Medical Solutions, St. Louis, MO, USA3Siemens Healthcare, MR PLM AW Advanced Neuro, Erlangen, Germany
IntroductionAn open bore MRI has the practical ad-vantage of accommodating large or claustrophobic patients. Unfortunately, until the advent of the 1.5T MAGNETOM Espree, “open” was often synonymous with inferior image quality. However, in addition to the large 70 centimeter bore, the Espree system offers advanced coil combinations using the Total imaging matrix (Tim) and isocenter imaging tech-nology. Together, these features allow for performance of advanced neuroim-aging protocols in new clinical popula-tions. This article demonstrates neuroimaging applications routinely obtained in our clinical practice at Mallinckrodt Institute of Radiology, Washington University School of Medicine in St. Louis. The open bore Espree delivers excellent image quality, expanding the utility of MRI to meet diagnostic challenges increasingly encountered in clinical neuroimaging.
MethodsImage acquisitions were performed with a 1.5 Tesla MAGNETOM Espree scanner using the 12-channel head coil and spine coils of the Total imaging matrix. Our standard neurological examination on the Espree system includes common cross-platform protocols such as MPRAGE, FLAIR, T2 TSE, DSC Perfusion, and Spec-troscopy. The Espree also enables ad-vanced imaging sequences, including T2 BLADE [1], Susceptibility-Weighted Imaging (SWI) [2], and Diffusion Tensor Imaging (DTI) [3], for which we use the following protocols:
T2 BLADE protocol: TE = 102 msec, TR = 4000 msec, FOV = 240 mm, pFOV = 100%, slice thickness = 5 mm, base resolution = 384 (results in spatial resolution = 0.6 x 0.6 x 5.0 mm), aver-age = 1, concatenations = 2, flip angle = 150°, BLADE coverage = 111%, echo spacing = 6.64 msec, turbo factor = 35, echo train per slice = 20, motion correc-tion = ON, bandwidth = 362 Hx/pixel, acquisition time: 2:50 min.
SWI protocol: TE = 40 msec, TR = 50 msec, FOV = 240, pFOV = 100%, slice thickness = 2 mm, slices per slab = 72, base resolution = 256, phase resolution = 79%, slice resolution = 75% (results in spatial resolution = 1.2 x 0.9 x 2.0 mm), average = 1, flip angle = 15, PAT acceler-ation factor = 2, bandwidth = 80 Hz/pix-el, spatial resolution = 1.2 x 0.9 x 2.0 mm, acquisition time 3:34 min.
DTI protocol: TE = 107 msec, TR = 3500 msec, FOV = 240 mm, pFOV = 100%, slice thickness = 5 mm, base resolution = 128, phase resolution = 100% (results in spatial resolution = 1.9 x 1.9 x 5 mm), averages = 3, Fatsat, phase partial Fourier = 6/8, PAT acceleration factor = 2, echo spacing = 0.92 msec, EPI factor = 128, BW = 1220 Hz/pixel, b-values = 0, 1000 sec/mm2, 12 diffusion directions. Aver-age ADC map, trace-weighted map, FA map, and tensor data were created In-line. Acquisition time: 2:08 min.
Post-processing was performed with the Neuro 3D application package. The package has the capability of processing directional color encoded fractional anisotropy map (blue = SI direction, green = AP direction, and red = RL direc-tion), tensor map, aligned tensor and anatomy data, aligned tensor and frac-tional anisotropy data, and tractography.
Clinical casesThe following examples demonstrate brain stem pathology which is difficult to image on a non-Tim system due to the position of the lesion and unavail-ability of coil combination. For brain-stem cases examined on the MAGNETOM Espree system, the head coil and cervi-cal spine elements were combined using the Total imaging matrix to better visual-ize the lesions. Tumor cases are also rou-tinely examined on the Espree system. An example is also included in this article.
k Visit www.siemens.com/magnetom-world to read T. Benzinger’s “Clinical Applications of Diffusion Tensor Imaging” published in MAGNETOM Flash 37, p. 74–86.
1 Normal brain MRI acquired on an open bore 1.5T MAGNETOM Espree using 12-chan-nel head coil and spine coils of the Total imaging matrix:A: Color fractional anisotropy of the normal pontine white matter.B: Axial T2 BLADE demonstrates the corre-sponding pontine anatomy. C: Normal DTI tractography showing the red pontine fiber shown in A (white arrow) and pyramidal decussation (red arrow). These im-ages were generated from a 2 minute scan.
Patient 1 77-year-old man undergoing evaluation for stroke had a normal MRI (Fig. 1). The study exhibits tracts of the normal brain acquired with the 1.5T Espree sys-tem. DTI tractography processed with the Neuro 3D software resolves ponto-
cerebellar fibers and the pyramidal de-cussation with great corresponding anatomic detail [4]. The DTI dataset is acquired in less than 3 minutes, and re-places the standard 3 direction DWI data for clinical stroke imaging on this scanner.
Patient 2 This 39-year-old obese woman present-ed for evaluation of dysphagia and left upper and lower extremity paresthesias. The brain MRI demonstrates a non-en-hancing T2 hyperintense brainstem mass extending from the medulla into
2 A 39-year-old obese woman scanned on an open bore 1.5T MAGNETOM Espree showing brainstem mass extending from the medulla into the cervical cord. Images were acquired using the 12-channel head coil and cervical spine coils of the Total imaging matrix:A: The brainstem mass as shown in MPRAGE.B: T2 hyperintense brainstem mass on Coronal T2 TSE. C: Sagittal STIR TSE demonstrates the extent of the brainstem mass.D: Axial T2 FLAIR demonstrates hyperintensity within the mass.E: DTI tractography reveals spatial distortion of the brainstem white matter tracts.F: 2D CSI (chemical shift imaging, TE 135 ms) exhibits decreased NAA to Choline signal ratio within the lesion (right) as compared to a normal region of this patient’s brain (left).
the cervical cord. Spectroscopy reveals a decreased NAA to choline signal ratio within this lesion. There is no diffusion restriction or T2* abnormality, but diffu-sion tractography is useful in demon-strating the spatial distortion by the ex-
pansile mass without infiltration of the longitudinal brainstem white matter tracts (Fig. 2).
Following radiotherapy and four cycles of Temodar, the MRI study is repeated on the same equipment. There is no in-terval change (Fig. 3).
3 An MRI study was repeated on the same patient as Figure 2 on the 1.5T MAGNETOM Espree following radiotherapy and four cycles of Temodar. DTI tractography nicely demonstrates the radial displacement of major pontine white matter tracts. Pontocerebellar fibers (red) are intact.
Patient 3 This 52-year-old man with a 12 months history of diploplia, dizziness and pro-gressive left facial weakness presented to an outside facility where an MRI re-
vealed a non-enhancing brainstem mass. A more detailed study on the Espree sys-tem demonstrates a mass arising in the posterior pons from midbrain to medulla
4 A 52-year-old man admitted with diplopia, dizziness and hemifacial weakness was scanned with 1.5T MAGNETOM Espree, revealing a non-enhancing brainstem mass. Images were acquired using the head and cervical spine coils of the Total imaging matrix:A: Axial T2 FLAIR shows the brainstem mass extending into the left brachium pontis.B: Sagittal T2 TSE demonstrates T2 hyperintensity of the pontine mass extending from midbrain to medulla.C: Single voxel spectroscopy reveals decreased NAA and elevated Choline signals within the mass.
with extension into the left middle cere-bellar peduncle. Spectroscopy demon-strates decreased NAA and elevated cho-line signal within the lesion (Fig. 4).
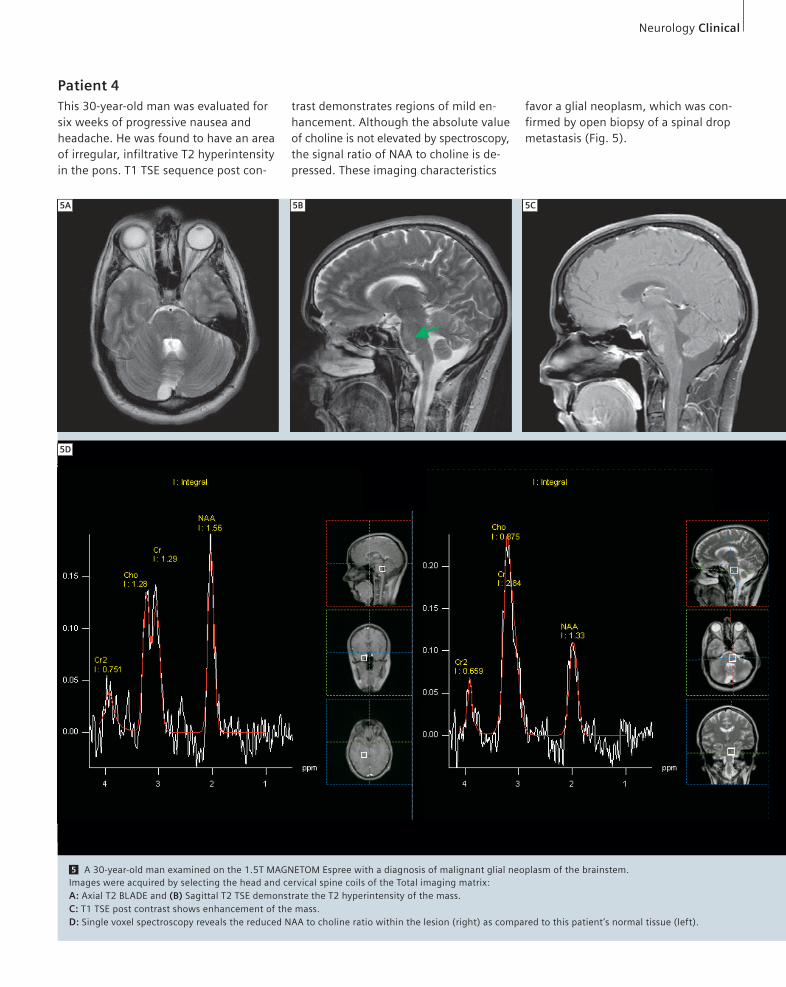
Patient 4 This 30-year-old man was evaluated for six weeks of progressive nausea and headache. He was found to have an area of irregular, infiltrative T2 hyperintensity in the pons. T1 TSE sequence post con-
trast demonstrates regions of mild en-hancement. Although the absolute value of choline is not elevated by spectroscopy, the signal ratio of NAA to choline is de-pressed. These imaging characteristics
5 A 30-year-old man examined on the 1.5T MAGNETOM Espree with a diagnosis of malignant glial neoplasm of the brainstem. Images were acquired by selecting the head and cervical spine coils of the Total imaging matrix:A: Axial T2 BLADE and (B) Sagittal T2 TSE demonstrate the T2 hyperintensity of the mass.C: T1 TSE post contrast shows enhancement of the mass.D: Single voxel spectroscopy reveals the reduced NAA to choline ratio within the lesion (right) as compared to this patient’s normal tissue (left).
favor a glial neoplasm, which was con-firmed by open biopsy of a spinal drop metastasis (Fig. 5).
This 55-year-old man presented with a several week history of right-sided numbness, unsteadiness, and a mild comprehensive and expressive aphasia. Biopsy of a left thalamic glioblastoma multiforme resulted in parenchymal hemorrhage, necessitating open evacua-tion (Fig. 6). T1 TSE sequence post con-trast exhibits avid enhancement at the margins of a centrally necrotic left thal-amic mass. The medial portion of the tumor shows increased perfusion. DTI tractography demonstrates anterior deviation of the posterior limb of the left internal capsule (directionally encoded in blue), but the longitudinal fiber tracts remain intact. The transthalamic white matter tracts (yellow for clarity) are dis-placed radially with abrupt termination. Note inferolateral deviation of the optic radiations [5].
ConclusionIn addition to standard neuroimaging sequences, advanced applications such as spectroscopy, syngo BLADE, syngo SWI, and syngo DTI have produced excellent imaging results on the 1.5T MAGNETOM Espree system at Mallinckrodt Institute of Radiology, Washington University School of Medicine in St. Louis. The Espree scanner enables excellent clinical neurological diagnostics under the most difficult circumstances, including obese and claustrophobic patients as well as difficult imaging anatomy, such as brain stem masses. With the advances of Tim technology, the practicality of an open bore system no longer demands com-promises in image quality.
6 A 55-year-old man with left thalamic glio-blastoma multiforme (GBM) was examined on the open bore 1.5T MAGNETOM Espree: A: Axial T2 BLADE demonstrates the T2 hyperin-tensity of the lesion. B: Susceptibility-weighted imaging (SWI) demonstrates hemorrhage along the biopsy tract. C: PBP map shows increased perfusion in the medial portion of the tumor. D: T1 TSE post contrast demonstrates peripheral enhancement with central necrosis. E: Fractional anisotropy map. F: and (G) are ADC map and trace-weighted images.
6H DTI Tractography demonstrates anterior deviation of the intact posterior limb of the left internal capsule (directionally encoded in blue). The optic radiations of the left hemispere (directionally encoded in green) are displaced inferolaterally. Transthalamic white matter (yellow for clarity) is displaced radially and disrupted at the rostral margin of the tumor.
1965;42:288–292.
4 Mukherjee P, et al. Diffusion tensor imaging and
fiber tractography:Technical considerations. AJNR
2008 May; 29:843–52.
5 Jellison BJ, Field SF, et al. Diffusion tensor imag-
ing of cerebral white matter: A pictorial review of