CME-GEOMETRY AND COSMIC-RAY ANISOTROPY OBSERVED BY A PROTOTYPE MUON DETECTOR NETWORK K. Munakata 1 , T. Kuwabara 1 , J. W. Bieber 2 , P. Evenson 2 , R. Pyle 2 , S. Yasue 1 , C. Kato 1 , Z. Fujii 3 , M. L. Duldig 4 , J. E. Humble 5 , M. R. Silva 6 , N. B. Trivedi 6 , W. D. Gonzalez 6 , and N. J. Shuch 6 1 Physics Department, Shinshu University, Nagano 390-8621, JAPAN 2 Bartol Research Institute, University of Delaware, Newark, DE 19716, USA 3 Solar Terrestrial Environment Laboratory, Nagoya University, Aichi 464-8601, JAPAN 4 Auatralian Antarctic Division, Kingston, Tasmania 7005, AUSTRALIA 5 University of Tasmania, Hobart, Tasmania 7001, AUSTRALIA 6 Southern Regional Space Research Center, National Institute for Space Research, Santa Maria, RS, BRAZIL
Transcript
CME-GEOMETRY AND COSMIC-RAYANISOTROPY OBSERVED BY
A PROTOTYPE MUON DETECTOR NETWORK
K. Munakata1, T. Kuwabara1, J. W. Bieber2, P. Evenson2, R. Pyle2, S. Yasue1, C. Kato1, Z. Fujii3, M. L. Duldig4, J. E. Humble5, M. R. Silva6, N. B. Trivedi6, W. D. Gonzalez6, and
N. J. Shuch6
1Physics Department, Shinshu University, Nagano 390-8621, JAPAN2Bartol Research Institute, University of Delaware, Newark, DE 19716, USA
3 Solar Terrestrial Environment Laboratory, Nagoya University, Aichi 464-8601, JAPAN4Auatralian Antarctic Division, Kingston, Tasmania 7005, AUSTRALIA
5University of Tasmania, Hobart, Tasmania 7001, AUSTRALIA6Southern Regional Space Research Center, National Institute for Space Research,
Santa Maria, RS, BRAZIL
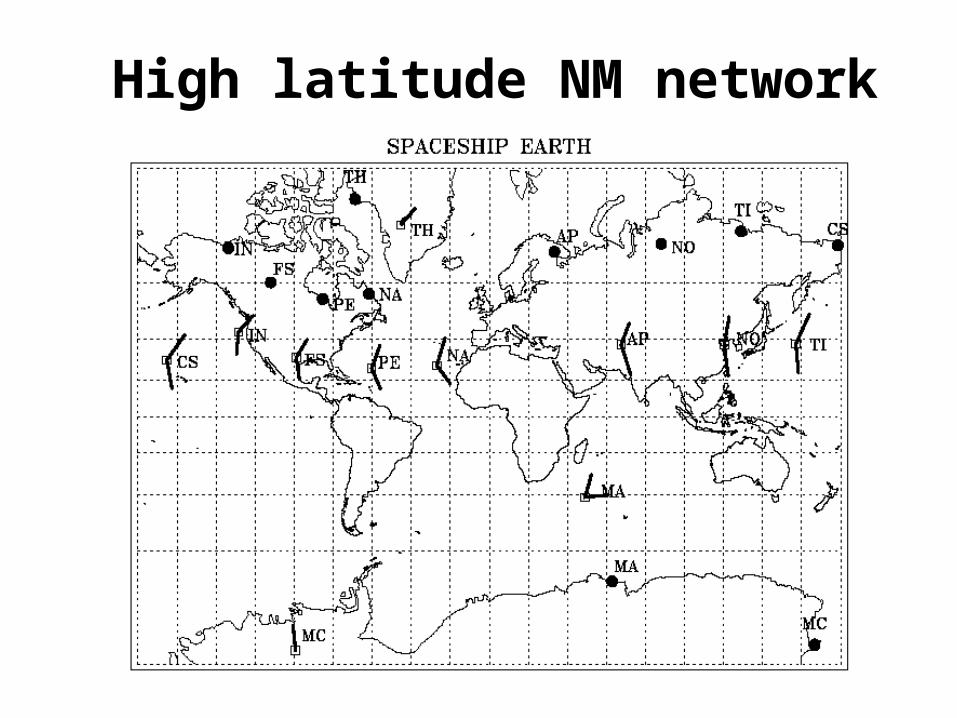
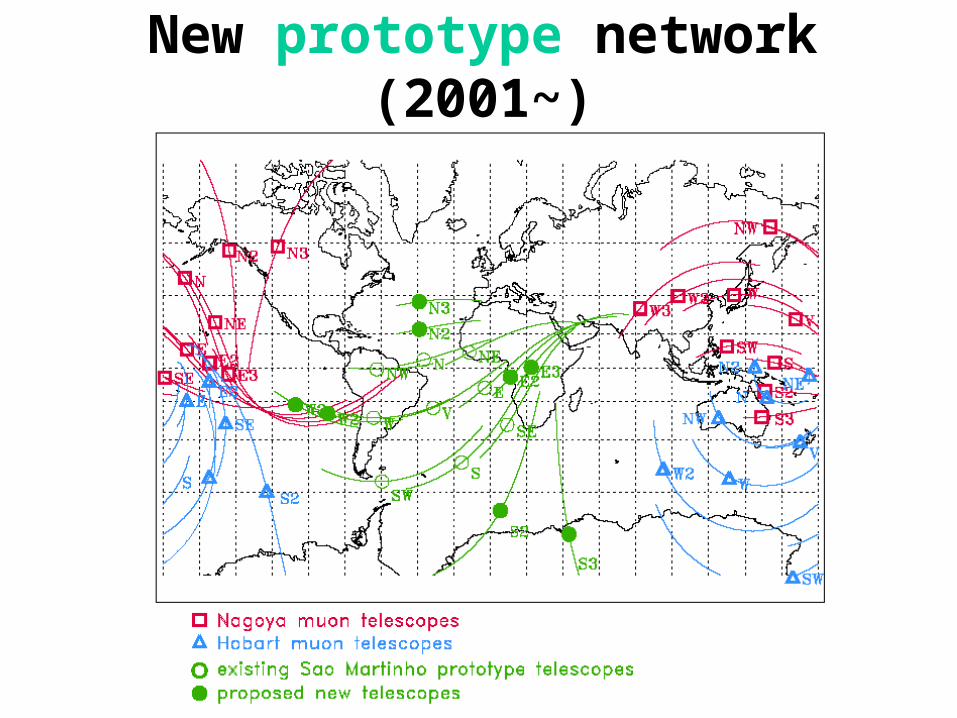
ABSTRACT We analyze the cosmic-ray anisotropy observed by a prototype network of muon detectors during geomagnetic storms associated with CMEs. The network currently consists of multidirectional surface muon detectors at Nagoya (Japan) and Hobart (Australia), together with a prototype detector at São Martinho (Brazil) which has been in operation since March, 2001. In this report, we analyze the anisotropy recorded in both the muon detector and neutron monitor (the Spaceship Earth) networks and find significant enhancements of cosmic-ray anisotropy during geomagnetic storms. Following the analysis by Bieber and Evenson (1998) for the neutron monitor data at ~10 GeV, we also derive cosmic-ray density gradients from muon data at higher-energy (~50 GeV), possibly reflecting the larger-scale geometry of CMEs causing geomagnetic storms. We particularly find in some events the anisotropy enhancement clearly starting prior to the storm onset in both the muon and neutron data. This is the first result of the CME-geometry derived from simultaneous observations of the anisotropy with networks of multidirectional muon detectors and neutron monitors.
DATA ANALYSIS AND RESULTS
Figure 1: The normalized count rates recorded in three vertical telescopes at Nagoya (black), Hobart (blue) and São Martinho (red) as functions of the day of year (DOY) on the horizontal axis over 4 days, including a large geomagnetic storm occurred in 11 (101 DOY) April 2001 (maximum Kp index is 8+). The onset of each SSC is indicated by the vertical line.
The common decrease (~2 %) in these three directional channels is the manifestation of the Forbush decrease of the isotropic intensity. Clearly seen in this figure is the daily variation of counting rate superposed on the Forbush decrease and being enhanced following the SSC. It is also seen that the daily variations at Nagoya and São Martinho are almost out of phase to each other. This is a clear signature of the enhanced anisotropy of cosmic ray intensity.
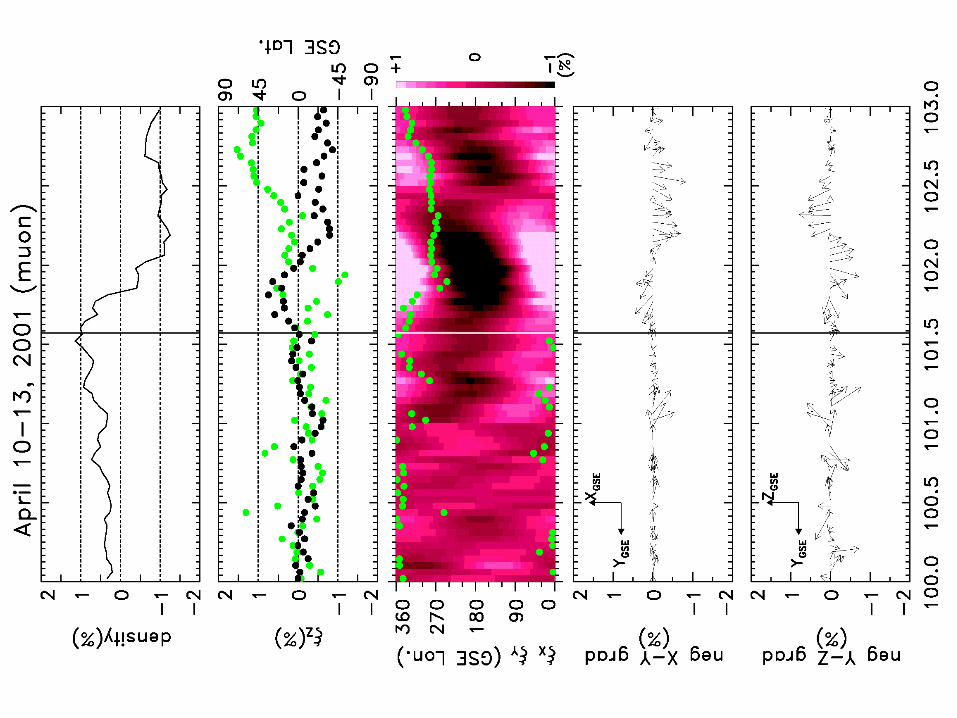
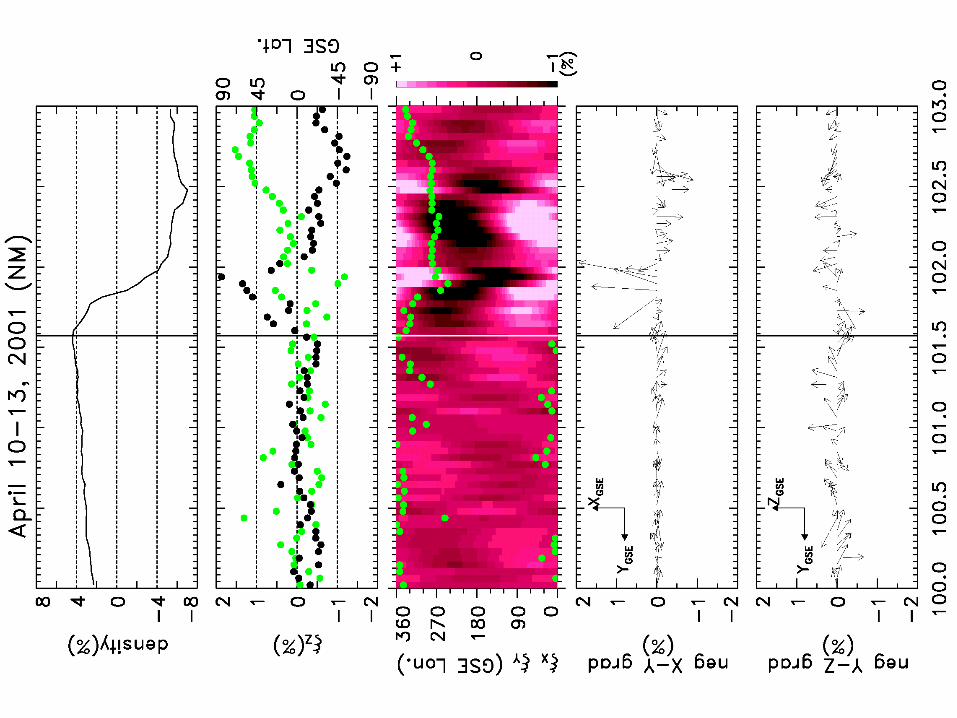
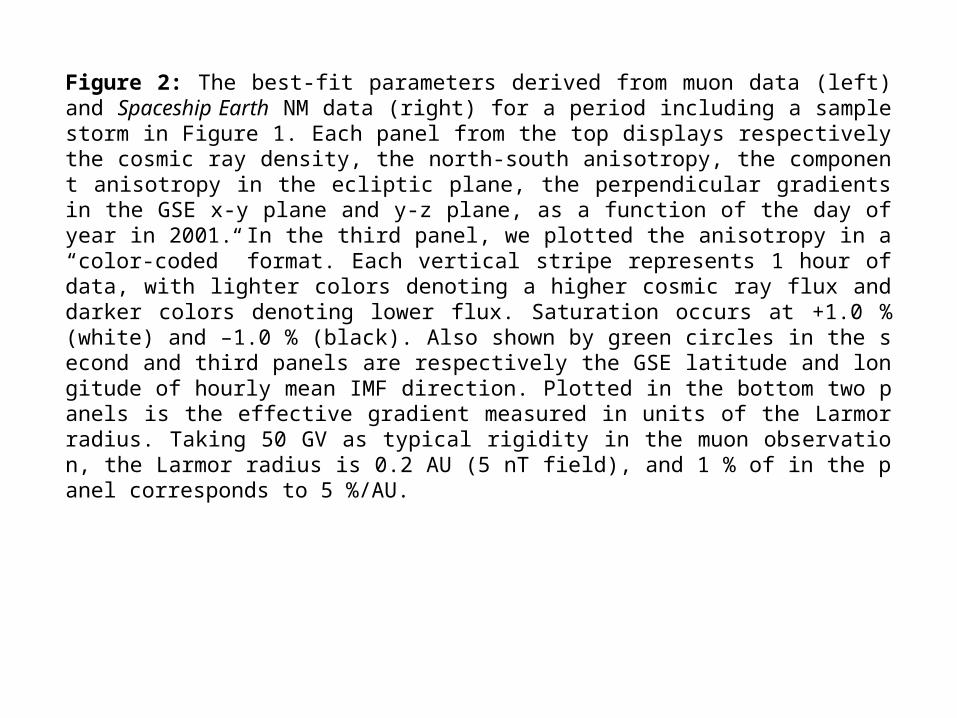
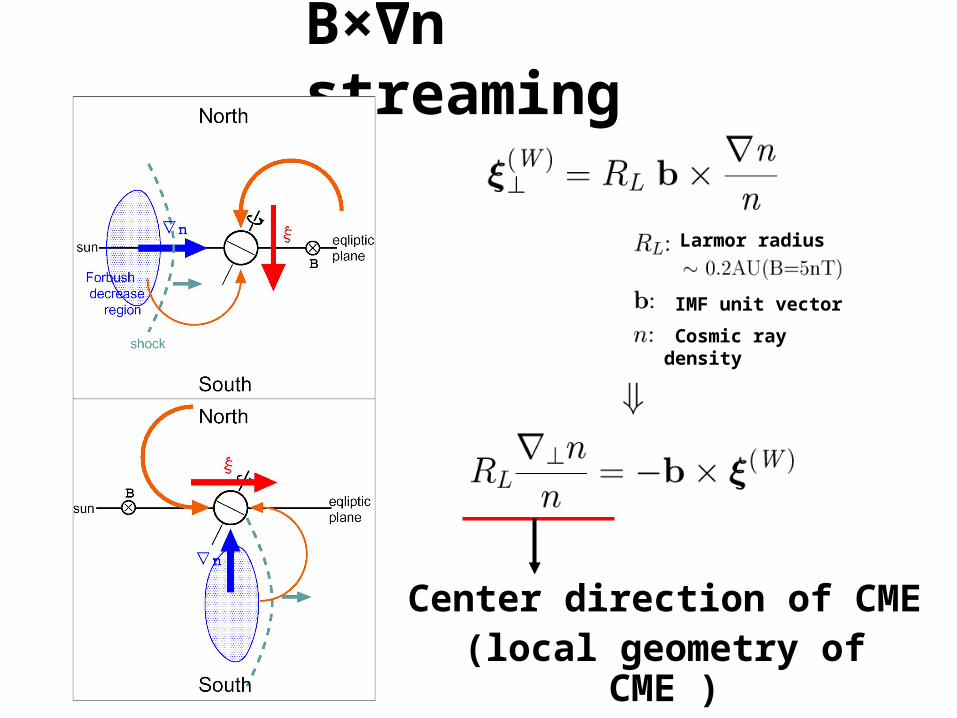
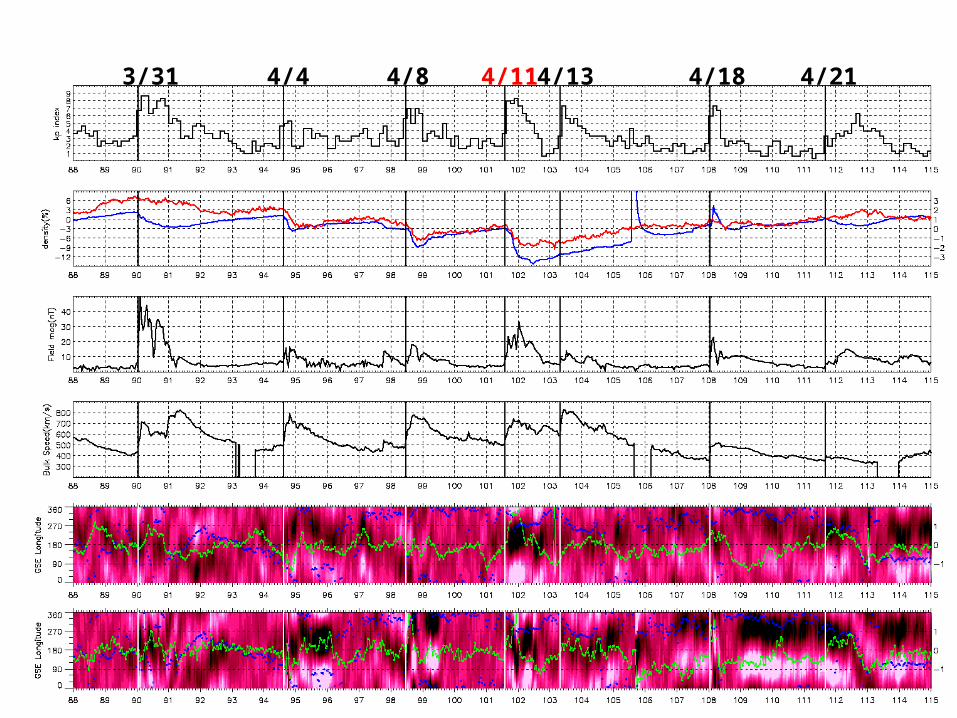
Figure 2: The best-fit parameters derived from muon data (left) and Spaceship Earth NM data (right) for a period including a sample storm in Figure 1. Each panel from the top displays respectively the cosmic ray density, the north-south anisotropy, the component anisotropy in the ecliptic plane, the perpendicular gradients in the GSE x-y plane and y-z plane, as a function of the day of year in 2001. In the third panel, we plotted the anisotropy in a “color-coded” format. Each vertical stripe represents 1 hour of data, with lighter colors denoting a higher cosmic ray flux and darker colors denoting lower flux. Saturation occurs at +1.0 % (white) and –1.0 % (black). Also shown by green circles in the second and third panels are respectively the GSE latitude and longitude of hourly mean IMF direction. Plotted in the bottom two panels is the effective gradient measured in units of the Larmor radius. Taking 50 GV as typical rigidity in the muon observation, the Larmor radius is 0.2 AU (5 nT field), and 1 % of in the panel corresponds to 5 %/AU.
Clearly seen in these figures is the cosmic ray anisotropy being enhanced after the onset of the SSC in both the muon and NM data. As in this example, we often observe the enhanced anisotropy corresponding to an increased flux of particles arriving from somewhere in the 0-90 quadrant in GSE longitude. It is interesting to note that such enhancement can also be seen in the muon data between 101.0-101.5 DOY, more than half a day prior to the SSC. The negative NS anisotropy corresponding to an excess flux from the south of the ecliptic plane is also enhanced around 101.0 DOY in muon data (second panel of Figure 2a), while it is enhanced around 101.4 DOY in NM data.
During the second half of 101 DOY after the SSC, the gradients point anti-sunward, which indicate a cosmic ray depleted region approaching the earth. (Note that the negative of the gradient is displayed in the figure, so that the arroes point towards the region of depleted density.) The gradients then turn sunward at around 102.0 DOY, again indicating the depleted region travels past the earth. The y-z component gradients in muon data also show a clear turning over from +z to -z direction at 102.2 DOY, probably indicating that the depleted region traveled from the south to the north of the earth.
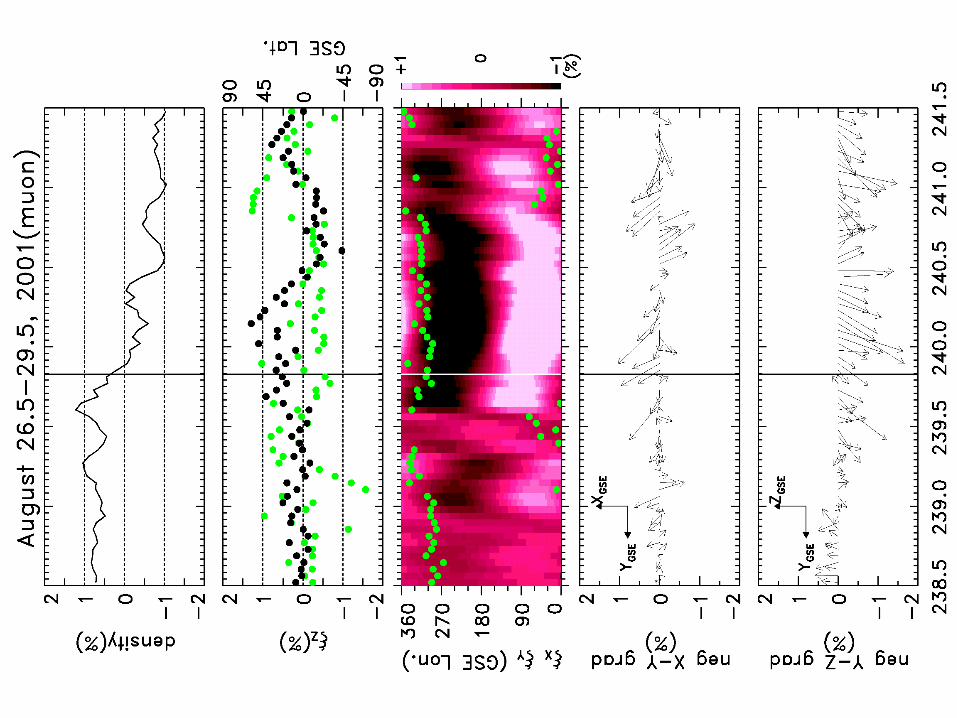
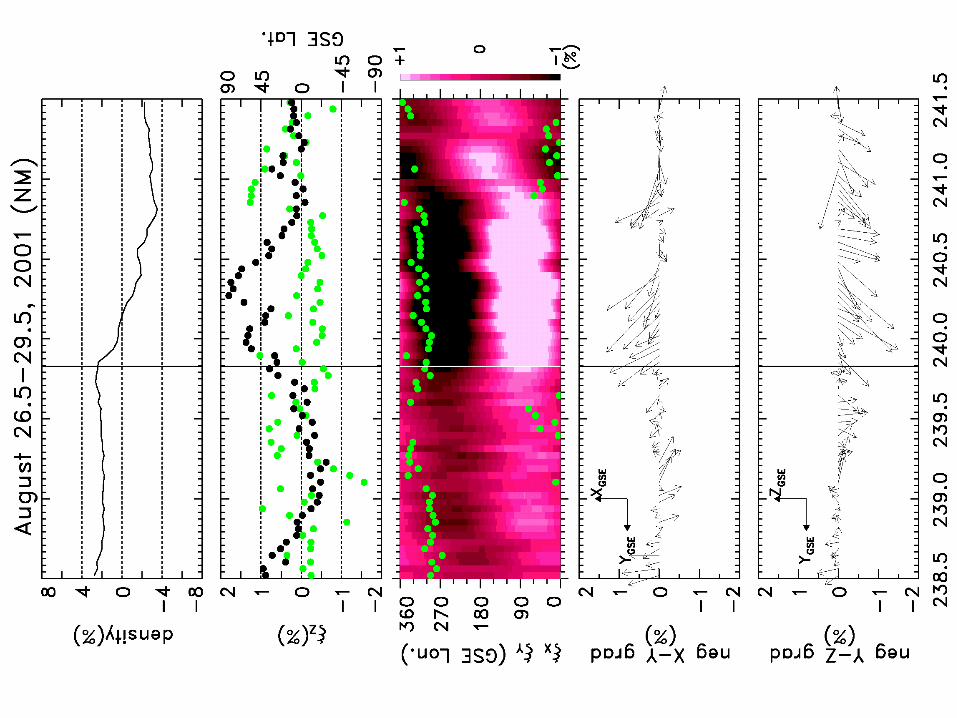
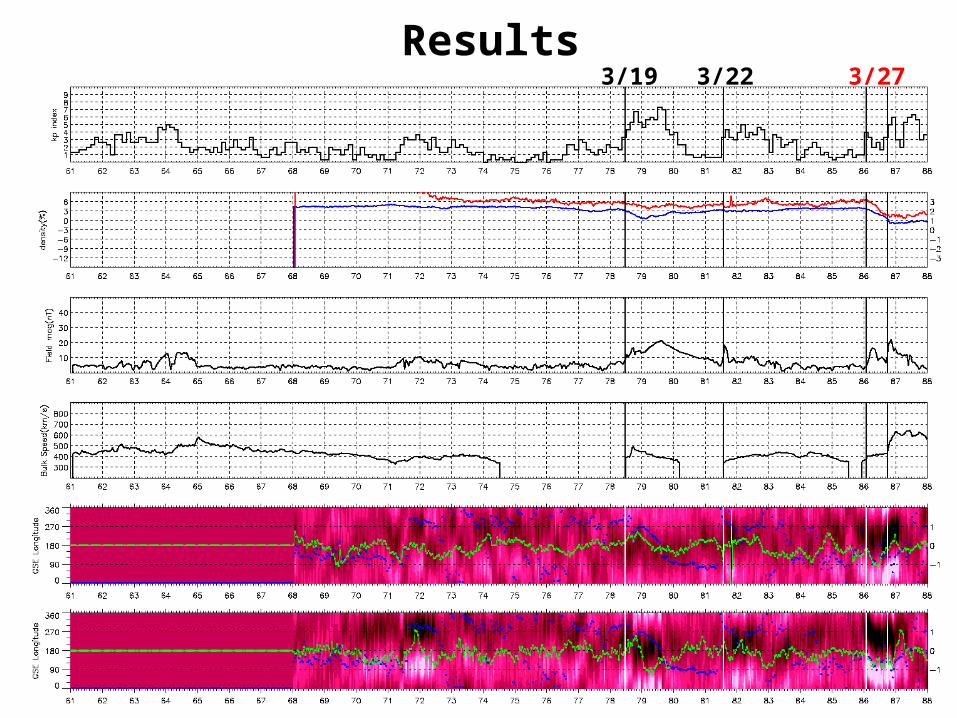
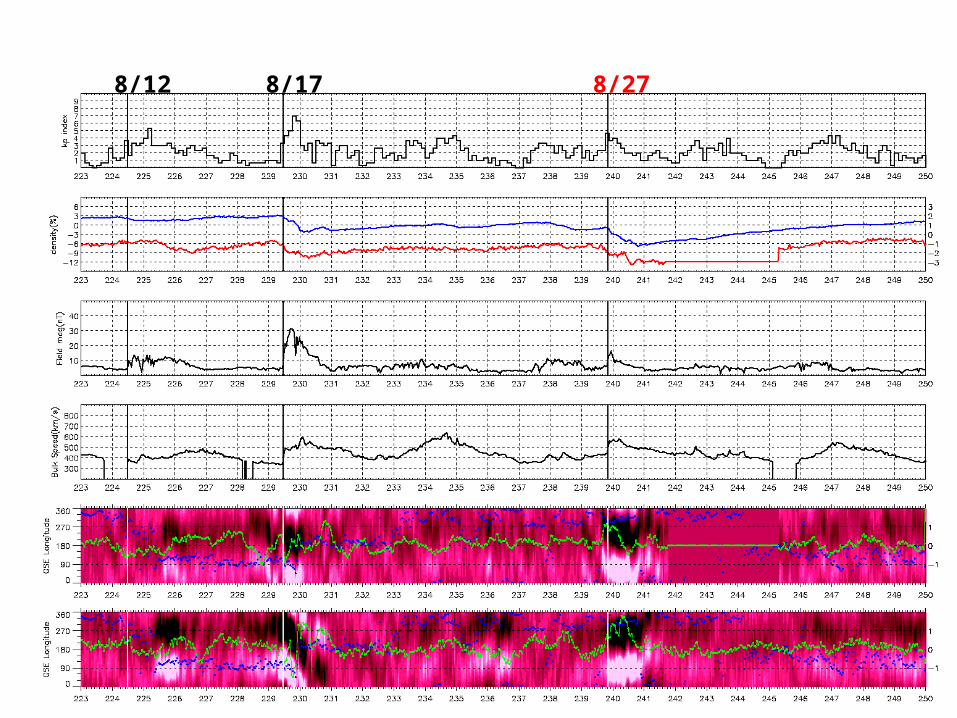
Figure 3: The best-fit parameters derived from a period including a storm in 27 (239 DOY) August, 2001 (maximum Kp index is 5-). Parameters are shown in the same manner as Figure 2.
The strong enhancement is seen again in the anisotropy after the SSC. Most notable in this event is that the enhancement is also clearly seen about 5 hours prior to the SSC in the muon data (the second and third panels in Figure 3a). Though less prominent, close inspection of the third panel reveals that the precursor enhancement is also observed consistently in NM data. Another important feature of this event is that the y-z component gradients persistently point northward in both the muon and NM data, indicating a cosmic ray depleted region passed to the south of the earth.
SUMMARY
We analyzed the cosmic ray anisotropy observed by both the prototype muon detector network and the Spaceship Earth neutron monitor network during periods including geomagnetic storms in 2001. Analyses of two sample periods including respectively large and minor storms reveal strong enhancements of the anisotropy during the storm. Of particular interest is that the enhancement is also seen up to half a day preceding the onset of the storm. The density gradients derived from the anisotropy illustrate interesting features of the cosmic ray depleted region in the CME approaching and traveling past the earth. This is the first result of the CME-geometry derived from simultaneous observations of the anisotropy with networks of multidirectional muon detectors and neutron monitors.
ACKNOWLEDGEMENTS
This work is supported in part by U.S. NSF grant ATM-0000315 and in part by a Grant-in-Aid for Scientific Research from the Ministry of Education, Culture, Sports, Science and Technology in Japan and by the joint research program of the Solar-Terrestrial Environment Laboratory, Nagoya University. The muon observations at Nagoya and Hobart have been carried out by Shinshu University and Nagoya University in Japan, the University of Tasmania and the Australian Antarctic Division in Australia, while the prototype muon detector at São Martinho has been operated under collaboration between Shinshu University and the Southern Regional Space Research Center of National Institute for Space Research in Brazil. Expansion of the São Martinho muon detector is being undertaken with support from the U.S. National Space Weather Program under grant ATM-0207196. We thank N. F. Ness for providing ACE magnetic field data via the ACE Science Center.
REFERENCES
Bieber, J. W., and P. Evenson, CME geometry in relation to cosmic ray anisotropy, Geophys. Res. Lett., 25, 2955-2958, 1998.
Fujimoto, K., A. Inoue, K. Murakami et al., Coupling coefficients of cosmic ray daily variations for meson telescopes, Rep. 9, Cosmic Ray Res., Lab., Nagoya, Japan, 1984.Kawakami, S., K. Fujimoto, S. K. Gupta et al., The first outcome on the 3-D feature of
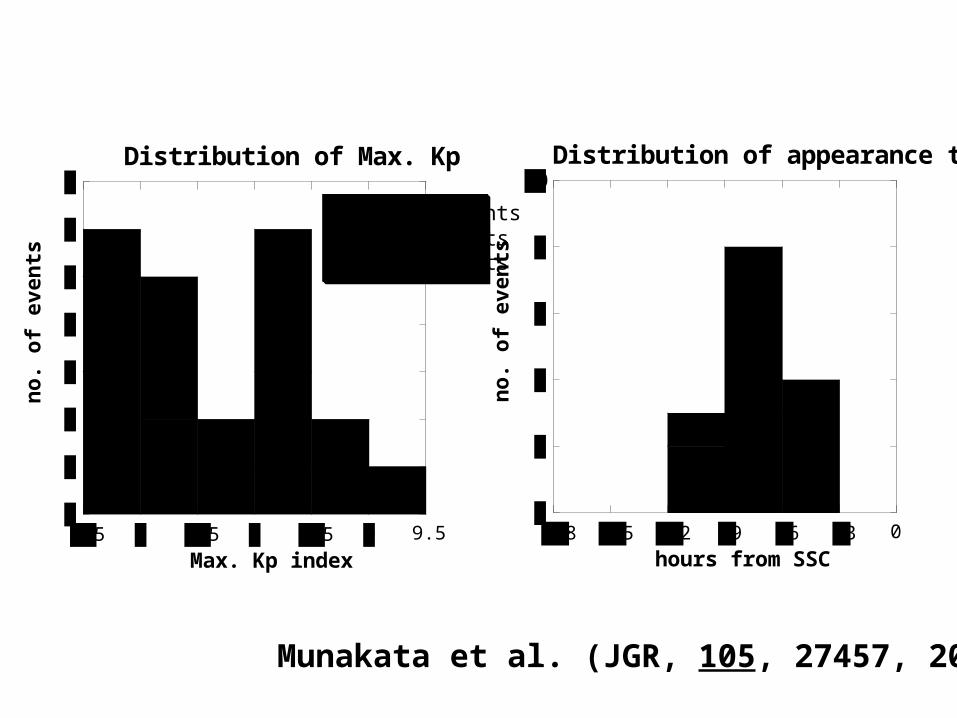
forbush decrease events from large muon telescope of GRAPES III at Ooty, Proc. 27th Int. Cosmic-Ray Conf., 9, 3,473-3,476, 2001.Kawakami, S., private communication, 2002.Munakata, K., J. W. Bieber, S. Yasue et al., Precursors of geomagnetic storms observed
by the muon detector network, J. Geophys. Res., 105, 27,457-27,468, 2000.Munakata, K., J. W. Bieber, T. Kuwabara et al., A prototype muon detector network co
vering a full range of cosmic ray pitch angles, Proc. 27th Int. Cosmic-Ray Conf., 9, 3,494-3,497, 2001.Murakami, K., K. Nagashima, S. Sagisaka et al., Response functions for cosmic-ray mu
ons at various depths underground, IL NUOVO CIMENTO, 2C, 635-651, 1979.