27
CMH Working Paper Series Paper No. WG1 : 10 Date: February 2001 Title The Economic Burden of Malaria Authors John Luke Gallup, Jeffrey D. Sachs

CMH Working Paper Series
Paper No. WG1 : 10
Date: February 2001
Title
The Economic Burden of Malaria
Authors
John Luke Gallup, Jeffrey D. Sachs

The Economic Burden of Malaria
John Luke Gallup – [email protected] D. Sachs – [email protected]
Center for International DevelopmentHarvard University
79 JFK StreetCambridge, MA 02138
February, 2001
Forthcoming in American Journal of Tropical Medicine and Hygiene

Abstract
Malaria and poverty are intimately connected. Controlling for factors such as tropical location,colonial history, and geographical isolation, countries with intensive malaria had income levels in1995 only 33% of countries without malaria, whether or not the countries were in Africa.
The high levels of malaria in poor countries are not mainly a consequence of poverty. Malaria isvery geographically specific. The ecological conditions that support the more efficient malariamosquito vectors primarily determine the distribution and intensity of the disease. Intensiveefforts to eliminate malaria in the most severely affected tropical countries have been largelyineffective. Countries that have eliminated malaria in the past half century have all been eithersubtropical or islands. These countries’ economic growth in the five years after eliminatingmalaria has usually been substantially higher than growth in the neighboring countries.
Cross-country regressions for the 1965-90 period confirm the relationship between malaria andeconomic growth. Taking into account initial poverty, economic policy, tropical location, and lifeexpectancy among other factors, countries with intensive malaria grew 1.3% less per person peryear, and a 10% reduction in malaria was associated with 0.3% higher growth. Controlling formany other tropical diseases does not change the correlation of malaria with economic growth,and these diseases are not themselves significantly negatively correlated with economic growth. Asecond independent measure of malaria has a slightly higher correlation with economic growth inthe 1980-1996 period.
The paper concludes with speculation about the mechanisms that could cause malaria to have sucha large impact on the economy, such as foreign investment and economic networks within thecountry.Keywords: malaria, economic cost of disease, economic growth, burden of disease, tropicaldisease

1
Poverty and malaria
Malaria and poverty are intimately connected. As Nobel Laureate in Medicine T. H. Wellernoted, “It has long been recognized that a malarious community is an impoverishedcommunity.”1 Weller could have said the same for malarious countries. Malaria is mostintractable for countries in the poorest continent, Africa. The only parts of Africa free of malariaare the northern and southern extremes, which have the richest countries on the continent. India,the country with the greatest number of poor people in the world, has a serious malaria problem.Haiti has the worst malaria in the Western Hemisphere, and it is the poorest country in thehemisphere.
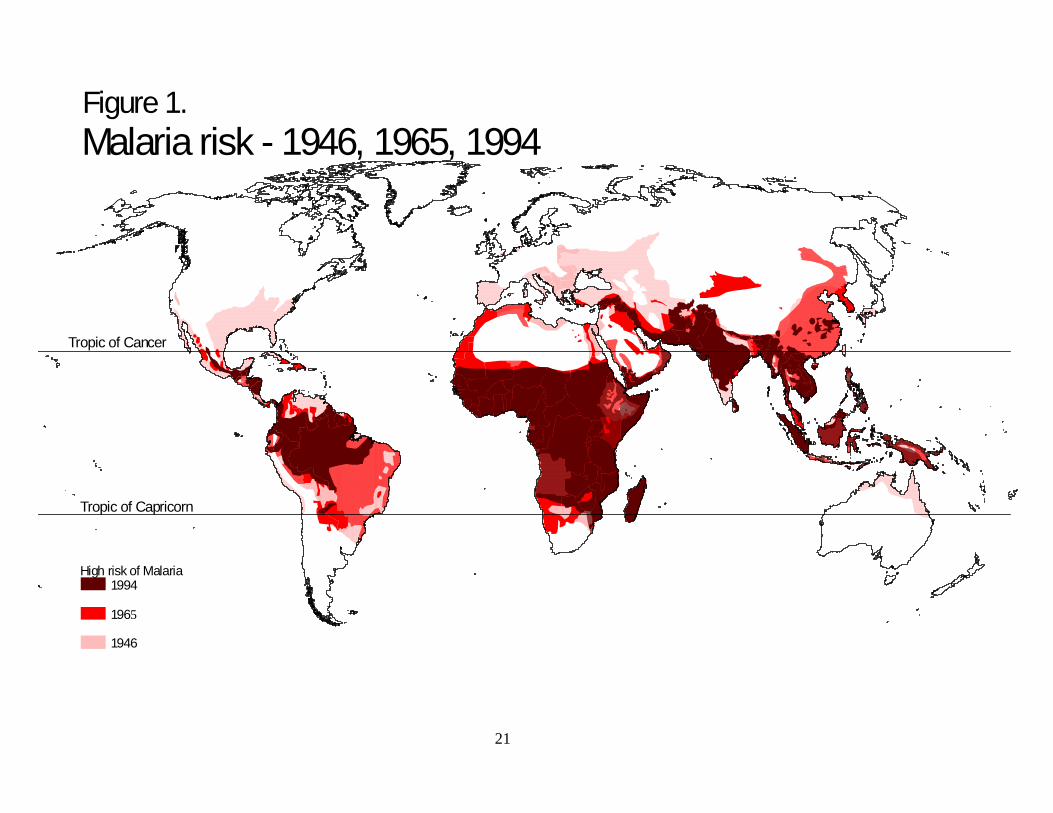
Malaria risk has always been very geographically specific, as shown in Figure 1. Intensivemalaria is confined to the tropical and subtropical zone. Poverty is also geographically specific.As shown in Figure 2, poor countries predominate in the same regions as malaria. Almost all ofthe rich countries are outside the bounds of intensive malaria.
A basic problem when studying the macroeconomic impact of malaria is the lack high qualitydata on malaria incidence or prevalence in the most severely affected countries. This study usesan index of malaria prevalence derived from historical maps of the geographical extent of highmalaria risk shown in Figure 1 (digitized from maps by Pampana and Russell and the WorldHealth Organization (WHO)).3,4,5 Combined with detailed data on the world populationdistribution, one can estimate the fraction of the population in high malaria risk areas in eachcountry.6 Since most malaria mortality and severe morbidity is due to one of the four malariaspecies, the malignant P. falciparum, the index of malaria intensity used in this paper is thefraction of the population at risk of malaria multiplied by the fraction of malaria cases that arefalciparum malaria (from WHO data).7 (A second index of malaria derived from completelydifferent data is described and used below.) For the comparative statistics in this section, severemalaria is defined as having a malaria index greater than 0.5.
After the first draft of this paper was completed, McCarthy and others (unpublished manuscript)have estimated the impact of malaria on economic growth using recently released estimates ofmalaria morbidity from the WHO.2 Using a similar methodology to ours, but a different datasource and a different time period, they find somewhat smaller estimated effects of malaria thanwe find here. The smaller estimates could be due to measurement error in the WHO data, sincethe data “permit only very limited comparison between countries or even between variousperiods for the same country.”2 Because the national reporting systems are systematicallydifferent between countries with high or low levels of malaria, this study does not use the WHOdata on malaria cases, but instead uses the malaria index derived from malaria maps andfalciparum prevalence data.
Take the 150 countries with populations over one million in 1995, which account for over 99percent of the world’s population. Forty-four of the 150 countries, or 29 percent, have intensivemalaria. Thirty-five of these 44 countries are in Africa. The average purchasing-power parityGDP per capita in 1995 for the malarial countries was $1,526, compared to an average income of$8,268 in the countries without severe malaria, more than five times higher. (The 1995 PPP GDPdata are from the World Bank, supplemented by CIA estimates for countries not reported in

2
World Bank data.)8,9,10 Ranking the 150 countries by income per capita, all but three of the 44countries with severe malaria are in the bottom half of the ranking. The exceptions are Omanand Gabon, ranked 34th and 41st, which owe their wealth to oil, and the Philippines, which isbarely in the top half with a rank of 74th out of 150. Of the 119 poorest countries, all but twelvehave some incidence of malaria or are recovering from socialism. The richest 31 countries arefree of malaria as measured by our index.
Not only are malarial countries poor, but economic growth in malarial countries over the pastquarter century has been dismal. Growth of income per capita from 1965 to 1990 for countrieswith severe malaria has been 0.4% per year, while average growth for other countries has been2.3%, over five times higher. (The data for GDP growth from 1965 to 1990 for 95 countries arefrom the Penn World Tables, Mark 5.6.)11 More than a third of the countries with severe malaria(11 out of 29) had negative growth from 1965 to 1990.
The question is whether these dramatic correlations mean that malaria causes poverty and lowgrowth. We will address this question in three ways. First, we consider the correlation ofmalaria with income levels after controlling for other factors that are likely to affect the worlddistribution of income, such as geography, history, and policy. Second, we discuss thedeterminants of malaria risk. Unlike other important diseases in poor countries caused bydeficient living conditions, like diarrhea, tuberculosis, and schistosomiasis, malaria is notprimarily a consequence of poverty; its extent and severity are largely determined by the climateand ecology. Third, we explore the impact of malaria on subsequent economic growth. Thisprovides the most direct evidence on the continuing importance of malaria as a cause of poverty.
Malaria and Income Levels
The coincidence of severe malaria and low incomes could be due to many factors besidesmalaria itself. It could be a general effect of the tropics, caused by poor soils, low agriculturalproductivity, or tropical diseases other than malaria. It may capture geographical trade barriers,since many malarial countries are landlocked and far from the major centers of world trade. Itcould be an accident of history. Many malarial countries were colonies until recently, and theterrible misfortunes of colonization may linger, keeping incomes low. Malaria could simply bea proxy for Africa, which may be poor for other reasons such as weak institutions, pooreconomic policies, or ethnic conflict.
There are strong geographical patterns to income levels around the world. (See Gallup, Sachs,and Mellinger for a wider investigation of the role of geography in economic development, andmore detailed explanation of the variables used in this section.)12 As shown in regression 1 ofTable 1, just four geographical variables account for almost half the variation in the log of GDPper capita income levels in 1995. A country’s accessibility to the coast, measured by the share ofthe population within 100 kilometers of the coast, is an important indicator of success in foreigntrade and integration into the global economy, and hence related to high income levels. Anothermeasure of accessibility, the minimum distance to the core world markets (New York,Rotterdam, and Tokyo), is inversely related to higher incomes. Thirdly, resource deposits,proxied by the log of hydrocarbon reserves per person, are higher in wealthier countries though

3
the effect is very small. Lastly, the tropics, measured by the percentage of a country’s land areain the geographical tropics, is much poorer than the rest of the world. The “penalty” for beingtropical was –0.68, signifying that tropical areas had only 51% (=exp(-0.68)) of the per capitaincome of non-tropical areas controlling for other factors.
The next three regressions in Table 1 add the malaria index to the geographical correlates ofincome per capita in two different years, 1950 and 1995. (The data for purchasing power parity(PPP) GDP per capita in 1950 in Table 1 are from Maddison. 13 The PPP GDP per capita datafor 1995 are those used above.) The malaria index has a strong negative association with incomelevels after controlling for the other four geographical factors. Malaria’s coefficient increasesslightly from 1950 to 1995, suggesting that if anything, malaria has become more important forexplaining income levels over time. The association of income with malaria dominates theassociation with the tropics, which loses statistical significance in the regressions. Thecoefficient on malaria of -1.22 in 1995 implies that malarial countries have a per capita incomeonly 30% as high as non-malarial countries.
Regression 4 includes indicators for former colonies, and socialist countries in the post-WorldWar II era. These new explanatory variables are strongly associated with lower income levels,but taking them into account does not substantially alter the correlation of malaria with lowincomes. Regression 5 adds a measure of economic policy, trade openness in the 1965 to 1990period, and an index of the quality of government institutions. Malaria’s association is stillunaffected, but the socialist and colony variables lose their significance. If malaria is excludedfrom this regression, income levels are significantly lower in countries that have been colonized,which suggests that the economic weakness of countries with malaria might have been a factor intheir colonial subjugation.
The final regression in Table 1 excludes the sub-Saharan African countries. Malaria has just asstrong association with poverty outside of Africa as for the whole world. Malaria is clearlydistinguishable from other problems faced by Africa.
Geography, history, and policy all have clear correlations with income levels, but taking theminto account does not alter the pattern of lower incomes in malarial countries. The associationof malaria with poverty seems to be more than just a mask for other plausible causes of lowincome.
Cause or Effect?
Malaria is prevalent in the poorest countries. Could this be a consequence, rather than a cause,of poverty? Many other serious diseases predominantly found in poor countries clearly are adirect consequence of poverty, caused by inadequate sewage treatment, unsafe drinking water,poor hygiene, or substandard housing. Malaria, though, does not follow this pattern – it’sseverity, and the difficulty in controlling it, are determined mainly by climate and ecology.Personal behavior, such as use of screens and bednets, and the general level of development,especially urbanization, also affect malaria prevalence, but they are not the main determinants.

4
Certain countries with very high incomes still face serious malaria problems due to theirgeographical location. Oman, with an income per capita of almost $10,000, has severe malariathroughout the country except in remote areas of high altitude and desert. United Arab Emirates,next door with one of the highest income levels in the world, also has been unable to eliminatemalaria.
Successful elimination of malaria through vector control requires a well-run organization andfinancial resources. The determining factor in where malaria has been eliminated in the post-warera has not been institutional or financial, though. It has been the susceptibility of malaria andthe vector to control. Figure 1 shows that since 1946 malaria has only been eliminated innontropical regions and certain islands where it foothold is much weaker. Coluzzi writes“Above all, it should be stressed that malaria eradication [in temperate areas in the late nineteenforties and early 1950s] was [only] achieved within more or less marginal ecoepidemiologicalzones, particularly for P. faliparum” due to seaonality of malaria transmission, low nighttimeoutdoor temperatures, and less efficient malaria vectors in temperate regions.14
The large differences in the difficulty of controlling malaria in various climatic zones issupported by Table 7. Those regions with the worst malaria in 1965 had the least reduction inmalaria in the following three decades. Countries with a predominantly humid tropical climateactually saw a small increase in the malaria index. Although the absolute reduction in themalaria index in temperate countries was lower than in other climatic zones, that is because themalaria level is bounded by zero – malaria as measured by the malaria index was completelyeliminated in temperate countries.
Some of the most effective control efforts historically in the worst affected areas have used veryfew material resources other than labor, so they are not constrained by poverty per se. Theelimination of breeding sites for malarial mosquitoes in parts of Panama by Gorgas at the timethe canal was built, the control of the outbreak of Anopheles gambiae mosqitoes in northeasternBrazil in the 1930s, and the malaria-free enclaves around some African mines show what ispossible with a combination of complete monitoring of all open water sources inside and outsidehouseholds, drainage of wetlands, and a military precision in all operations.15,16,17 Unfortunately,such control efforts have never been sustained in more than small areas or for more than shortperiods of time.
The major efforts devoted to malaria control in the building of the Panama canal and at Africanmines demonstrates the economic impact of malaria on workers. Malaria mortality was a majorfactor in the French failure to complete the canal (at least 20,000 people lost in nine years), andthe American efforts were not effective until malaria and yellow fever were brought undercontrol.15 Some tropical African mines created a cordon sanitaire around their operations whereAfrican workers could not regularly leave or enter. The large investments in monitoring,drainage and housing could only have been justified by higher worker productivity in themalaria-free mines.
In addition to differences in malaria intensity due to climate, the world distribution of Anophelesmosquitoes, the malaria vectors, have a major impact on malaria prevalence and severity.Vectorial capacity is a measure of the efficiency with which mosquitoes carry malaria from one
5
human to another, an estimate of the number of secondary cases of malaria generated by oneprimary case. The vectorial capacity of different species of Anopheles varies by orders ofmagnitude. By far the most efficient vector, Anopheles gambiae, is exclusively found in sub-Saharan Africa.
Vectorial capacity has a major impact on the feasibility of controlling or eradicating malaria in aregion. Consequently, malaria eradication through vector control has been orders of magnitudemore difficult in sub-Saharan Africa. According to a recent expert committee report: “Theepidemiology of malaria is driven by the dynamics of the mosquito vectors. Thus, 90% of theworld’s malaria is in Africa because it is home to the three most effective vectors.”18 Not onlydo the mosquito species determine the intensity of transmission, but they also affect the mix ofmalaria between the malignant P. falciparum, and the less severe P. vivax, P. malariae, and P.ovale. Africa is also the only major region of the world where falciparum malaria predominates.
Malaria control in sub-Saharan Africa has been a non-starter. There has been no successfulmalaria control of large regions outside of the temperate southern tip, the controlled environmentof some mining camps, and a few islands. In response to the failure of WHO vector controlprojects in Cameroon, Nigeria, and elsewhere in Africa in the 1960s, the WHO sponsored anintensive malaria control and research project in the district of Garki, Nigeria.19 No resources,manpower, or institutional support were spared. Over the course of seven years, WHO and theNigerian government spent more than $6 million to try to eliminate malaria in 164 villages andcompare the changes to control villages. Insecticide spraying of every hut at least every 10weeks during the course of the study had an average coverage of 99%. A third of the villageswere also given mass drug administration as a prophylaxis against malaria.
The intensity of malaria transmission in Garki was “very high indeed”. During the wet season, aperson in this district would be bitten on average 174 times per night by the Anopheles gambiaes.l.malaria vector and 94 times per night by the Anopheles funestus vector. (Such high biting rateestimates are not unusual. Robert and others estimate that a person in the Kou Valley in BurkinaFaso sleeping without mosquito protection (as most do) receives 158 bites by Anophelesgambiae per night, with total mosquito bites of 35,000 per year.)19 The vectorial capacity, or thetransmission rate of malaria between persons through the vectors, reached 2000 times the criticalvalue required to maintain endemic malaria, with a range of between 18 and 145 malaria-transmitting bites per person per year in the eight villages studied.20 In lay terms, everyone wasconstantly reinfected with malaria.
The vector control efforts reduced the man-biting rate of mosquitoes in the Garki villages by90% from their pre-study level, but despite this huge reduction in mosquito density, there was nosignificant change in the parasite rate among the villagers. The control efforts were defeated bythe vectorial capacity of the mosquitoes, which vastly exceed what was required to maintaintransmission of malaria. The conclusions of the study show that the failure to control malaria insimilar environments was not the consequence of poverty or lack of institutional capacity.According to a conference paper summarizing the Garki study: “The malaria control measuresemployed in the Garki Project failed to have a significant overall impact on malaria transmission,suggesting that these measures are unlikely to be of long-term use in the African dry savannahbelt.” This failure occurred despite the fact that “at all times during this study, it was known that

6
the strategies employed were much too detailed and expensive for long-term use in the studyarea.” (Loutan and others, unpublished summary of Garki conclusions).
At least two biological factors explain the exceptional severity of malaria in Africa. The mostefficient mosquito vector and the most serious malaria strain both most likely came from Africa.The vector Anopheles gambiae s.s. coevolved with humans in the Afrotropical rain forest. Thedevelopment of African agriculture in forest clearings resulted in the vector’s most importantcharacteristic for malaria transmission: it almost exclusively bites humans.14 The explosivepotential of the Anopheles gambiae vector for transmitting malaria in similar climates elsewherewas shown by the accidental introduction of the mosquito into Brazil in the late 1920s, whichwas luckily brought under control soon enough to eliminate it.16 The most pathogenic humanmalaria species, P. falciparum, most likely originated in Africa, probably in the past 5000-10000years with the onset of agriculture.14
With no proven method of controlling malaria in sub-Saharan Africa and other areas of intensetransmission, it is difficult to argue that poverty effectively causes malaria, or determines thesuccess of control efforts. A recent NIH report notes the intractable nature of malaria Africa:“The availability of anti-malaria measures, when correctly integrated and applied withoutfinancial constraints, can probably cope successfully with the malaria problem everwhere in theTropics except in the Afrotropical region.” (emphasis added)
A different sort of evidence that malaria is a cause of poverty comes from evolution. In areaswith the most severe malaria today, sub-Saharan Africa and parts of the Middle East and India,many ethnic groups have developed a partial genetic defense against the ravages of malaria:sickle cell trait. In some parts of Africa, this red blood cell abnormality is carried by 25-30% ofthe population.21 The value of sickle cell’s protection against malaria must be great because itcomes at a very high cost: all children (in developing countries) who inherit the trait from bothmother and father die before the age of childbearing. The Garki project confirmed this cruelequilibrium.19 Sickle cell trait in Garki adults was much higher than in children due to selectivesurvival. The burden of malaria on human wellbeing must have been high indeed for such amutation to be beneficial. (Sickle cell trait also shows the role of climate in determining therelative burden of disease in different regions of the world. “The distribution of sickle cell traitin tropical Africa corresponds almost exactly to the areas of tropical rain forest”.)22 Mildercongenital blood diseases, such as thalassemia in parts of southern Europe and Asia, confer someprotection against malaria in regions where malaria is correspondingly less severe. These blooddiseases highlight the importance of the burden of falciparum malaria relative to other formssince they protect primarily against falciparum infections.23 (Many ethnic groups in Africa alsohave complete protection from P. vivax malaria due to a blood characteristic called the Duffyfactor, which makes vivax malaria rare in Africa. Although this suggests that vivax malaria isalso burdensome, it does not demonstrate that the human burden is large because the Duffyfactor causes no mortality in people who carry it. Africans could easily maintain the Duffyfactor in the face of evolutionary selection even with a low disease burden from vivax malaria.)
The geographical specificity of malaria, the wide biological variation in the capacity of mosquitovectors, the inability to control malaria in Africa under experimental conditions, and thepersistence of fatal blood diseases as a defense all point to a causation from malaria to poverty,

7
not vice versa. Large-scale vector control projects require resources, but if they were clearlyfeasible, the resources would probably be forthcoming from the international community. Muchof the effective malaria control (in subtropical areas) has in fact come from low-technologydrainage and larvaciding, which could be carried out independently by a poor tropical country ifthe technique offered a viable prospect of malaria control. Kriton and Spielman describe themajor role of these simple technologies in many of the successful eradication efforts.24
Anecdotes from countries that have eliminated malaria
A small number of the countries that had severe malaria in the twentieth century eliminated thedisease. Many other changes were simultaneously occurring in the economies of these countriesbefore and after eradication, but in almost all cases for which we have data, the countriesexperienced an acceleration of growth immediately following eradication, and faster growth thanneighboring countries.
Malaria eradication in southern Europe has been a clear success story in the fight against malaria.Major control efforts in Greece, Italy, and Spain were started in the 1930s and completed in thelate 1940s. Greece up to that time had been the most malarial country in Europe, in peak yearstotalling a quarter of the total population.25 Jones argues that the spread of faliparum malariathrough most of Greece in the first millenium AD was the main factor in the decline of ancientGreek civilization.26 Greece was the site of major malaria epidemics in the nineteenth and earlytwentieth century, and the famed plain of Marathon became virtually uninhabited due to malariadespite very fertile soils. The use of DDT starting in 1946 had spectacular results (having amajor influence on the subsequent WHO world eradication campaign), with malaria falling from1-2 million cases per year in the early 1930s to only 5,000 in 1951.27 Although completeeradication would take another twenty years, partly due to vector resistance to DDT, from aneconomic point of view malaria was under control.
The longstanding problem of malaria in Italy contributed to the major role of Italians in earlymalaria research. Just before the control campaign, Italy had over 300,000 cases of malaria peryear with about 20,000 deaths.28 The Pontine Marshes south of Rome were rendereduninhabitable by the disease. P. falciparum was eliminated by the end of the 1940s, with P.vivax and P. malariae disappearing more slowly.
Spain reported 400,000 cases of malaria with 1700 deaths in 1943, but had effectively controlledthe disease by the end of the 1940s.28
The period immediately before effective control of malaria was wartime and the post-warreconstruction. Due to the anomalies of the period and the lack of data, we compare growth inthe post-control years of 1950-1955 to growth in the period 1913-1938 in Table 2. (GDP data forthe 1913-1938 period are from Maddison. All other country GDP data in this section are fromSummers and Heston.)13,11 In all three countries, economic growth in the post-control periodwas much higher than in the prewar period, and higher than growth in rest of Western Europe1950-1955. In the prewar period, Greece and Italy also grew somewhat faster than WesternEurope, but the increment in growth over the European average was also higher in the post-control period than the prewar period.

8
Portugal was another southern European country with severe malaria (over 100,000 cases peryear in the 1940s) that controlled malaria later than Greece, Italy and Spain.28 As shown inTable 3, growth accelerated after eradication in 1958 compared to the period before eradication,and once again the increment of growth over the average in the rest of Western Europe increasedafter eradication.
There are, unfortunately, few success stories for malaria eradication in developing countries, butthe islands of Taiwan and Jamaica are among the few. Tables 4 and 5 show that growthaccelerated in the two countries after eradication, in 1961 for Taiwan and 1958 in Jamaica. Inboth cases, growth also increased by more than growth in their respective regions.
The U. S. South was still very malarious before World War II. 135,000 cases of malaria with4000 deaths were reported in 1935.28 After large-scale drainage projects by the W.P.A. in the1930s were followed by insecticide spraying after the war, malaria was brought under control bythe end of the 1940s. In the decade of the 1950s, the South had its most dramatic catch-up withthe rest of the country, going from 60% of the income per capita of the rest of the U.S. in 1950 to68% in 1960 (calculated from Barro and Sala-i-Martin).29
An exception to prove the rule is Mauritius. A small island off the coast of East Africa,Mauritius was first exposed to malaria in 1865 with castrophic results. In one year, 1867,between an eighth and a quarter of the total population died in the malaria epidemic.30,31 Malariawas finally eliminated in 1963. Economic growthi n a small, closed, sugar-producing economycontinued to be negative until 1973 when Mauritius opened its economy, built export processingzones, and took off economically. Countries do not become prosperous by controlling malariaalone, but the dramatic success of Mauritius in become a manufacturing exporter since 1973 wascertainly made easier by eliminating malaria.
Malaria control within regions of some other countries has had dramatic impacts on agriculturaloutput and settlement patterns. “Until malaria was wiped out [in Corsica], no one farmed [on theeastern plain]. Today this plain accounts for 60 percent of Corsica’s agricultural production.”25
The southern plains of Nepal, the Terai, were virtually uninhabited until the early 1950s becauseof malaria. It is now the richest and most agriculturally productive part of the country.25
These country examples of growth after the control of malaria are merely suggestive. In almostevery country examined economic growth was higher immediately after the eradication ofmalaria, but there were surely many other factors that influenced the economy at the same time.In several of the countries (Greece, Spain, and Jamaica), the rapid development of the tourismindustry was only possible because of malaria eradication. Few tourists thought of basking onshores of the Aegean when Greece was the most malarial country in Europe.
Malaria and economic growth
We have shown that most malarial countries are poor, and certain countries that managed tocompletely eliminate malaria in recent times have had more rapid economic growth than their

9
neighbors. But can we find any general, statistically convincing evidence that initial malariaprevalence and reductions in malaria affect economic growth? Would a reduction in malariasignificantly improve the economic prospects of poor countries?
The most direct way to assess the causal effect of malaria on country economic performance is tolook at the relationship between economic growth, initial malaria levels and change in malariaover same period. Above we saw that countries with severe malaria in 1965 have had muchlower economic growth in the subsequent 25 years, but this did not take into account the initialpoverty of countries, nor did it consider the role of human capital levels, government policies, orgeographical variables. After the role of human capital, policy, and geography are taken intoaccount, it is generally found that poorer countries grow faster than richer countries, so if malariawere really just a proxy for poverty, one would expect malarial countries also to grow faster.32
(In fact, over the 1965 to 1990 period, poor countries on average grew slower than rich countries,but poor countries also had lower initial human capital, followed less successful economicpolicies, and were disadvantaged geographically.)
Table 6 presents a cross-country empirical growth estimation in the style of Barro.33 Growth inGDP per capita over the 1965 to 1990 period is related to initial income levels, initial humancapital stock, policy variables, and geographical variables. Human capital stock is measured bysecondary education and life expectancy at birth. Policy is measured by trade openness over theperiod and an index of the quality of public institutions. The geographical variables include anindicator for the geographical tropics and the fraction of the population within 100 kilometers ofthe coast. (Gallup, Sachs, and Mellinger give a more detailed description of these variables.)12
To these well-researched predictors of economic growth we add the malaria index in 1965 inregression 1.
The malaria index for 1965 is constructed similarly to the malaria index described above. It isthe product of the fraction of the population living in areas with high malaria risk in 1965 timesthe fraction of malaria cases in 1990 that are P. falciparum.4,6,7 This assumes that the relativeshare of P. falciparum cases did not change substantially from 1965 to 1990. The change in themalaria index over the 1965-1994 period was constructed using a similar malaria index for1994.5,6,7
Countries with severe malaria in 1965 had much lower economic growth, amounting to 1.3%lower growth per year, even after other factors like initial income level, overall life expectancyand tropical location are taken into account.
Reductions in malaria over the 1965-1990 period, in addition to malaria levels in 1965, areassociated with much higher economic growth, as shown in regression 2. This corresponds to a0.3% rise in annual economic growth for a 10% reduction in the malaria index. Over the twenty-five year period the average reduction in the malaria index was 7% among countries that hadmalaria in 1965. By extrapolation far outside the observed sample variation, a country with itswhole territory affected by 100% P. falciparum malaria is predicted to raise permanently itsannual growth by 2.6% if it completely eliminates malaria! Unfortunately, no country came nearto accomplishing this. Of the fourteen countries in the sample with a malaria index above 0.9 in1965, only one reduced it significantly: the malaria index in Zimbabwe fell by one-third.

10
Economic growth itself might be a cause of the observed malaria reductions if greater resourceswere made available for malaria control, or a high institutional capacity were responsible bothfor economic growth and successful malaria control. In this case the estimates of the effect ofmalaria reduction on economic growth would be biased. To control for the possible endogeneityof malaria reduction, Regression 3 uses instrumental variables. The instruments are theprevalence of 53 different Anopheles mosqito vectors in each country in 1952. (The Anophelesdata were digitized from an American Geographical Society map and used to calculate thepercent land area in each country affected by each Anopheles species.)34 The differentAnopheles mosqitoes vary widely in their efficacy in transmitting human malaria, so that thedistribution of Anopheles vectors is strongly correlated with malaria intensity and its change (thefirst-stage regression of the change in the malaria index on Anopheles vectors has an R2 of 0.51).There is no reason to think that the distribution of malaria mosquito vectors is a cause ofeconomic growth apart from the direct influence of malaria, making vector prevalence an idealinstrument for malaria change. After correcting for the possible endogeneity of malariareduction, the estimated effect on economic growth essentially unchanged, so it is unlikely thatthe changes in malaria prevalence are a consequence of economic growth. A Hausman test findsno significant difference the ordinary least squares and instrumental variables estimates, rejectingthe endogeneity of the change in malaria.
Regression 4 restricts the sample to non-sub-Saharan African countries. The size of theestimates for malaria are substantially the same. The change of malaria has a statisticallysignificant coefficient, but the estimate for initial malaria loses statistical significance. Evenwithout including the sub-Saharan African countries with the most severe malaria, a reduction inmalaria corresponds to much higher economic growth.
Malaria could be a proxy for a range of tropical diseases that are not adequately controlled for bylife expectancy. One disease that is starting to have major economic impacts in many of thesame countries with severe malaria, AIDS, is not relevant for the time period under study here.By 1990, the end of the period of economic growth studied, the burden of AIDS was stillsufficiently small to cause very minor economic impacts. Other major diseases prevalent in thetropics that may be correlated with malaria are hookworm, onchocerciasis, schistosomiasis,filariasis, dengue fever and trypanosomiasis (sleeping sickness). We have indentified detailedmaps of the geographical extent of all these diseases except for trypanosomiasis from the 1950s,as well as data for ten other less important tropical diseases providing measures of the extent oftwenty different tropical diseases.35,36,37 The other diseases are dengue fever, yellow fever,helminthiases (paragoniumus westermani , fasciolapsis buski opisthorchis felineus,diphyllobothrium latum, and clonorchis sinensis), and leischmaniases (oriental sore, kala azar,and american). The schistosomiasis data are broken down into S. haematobium and S. mansoni,and the filariasis data into loa loa, wucheria bancrofti wucheria malayii, acanthocherlonemaperstons, and mansonella ozzard, giving a total of 20 non-malaria tropical disease variables. Theland area affected by the disease is weighted by detailed population distribution data (in 19945)to provide an estimate of the fraction of the population at risk of each disease. Since the diseasedata preceed the period of economic growth under study, they show the impact of initial diseaseon subsequent economic performance avoiding problems of reverse causation.

11
The large number of diseases make it impractical to include them all as independent correlates inthe economic growth regression due the limited sample of countries. To assess whether the otherdiseases were responsible for the correlation of initial malaria with economic growth, weincluded each of the twenty diseases as an additional regressor separately to the regressionspecification in Regression 1 of Table 6. The estimated impact of malaria was remarkably stableacross these twenty regressions with a point estimate range of just –0.7 to –1.3, and statisticallysignificant at the ten percent level in 17 of 20 regressions (not shown – available from theauthors upon request). Rather surprisingly, none of the other tropical diseases had a significantnegative correlation with economic growth even at the 10 percent level, after controlling formalaria in these regressions. A second way to combine the other disease information is toestimate its principal components and include a linear combination of the other disease variablesin the growth regression. As shown in Regression 5 of Table 6, the first principal component ofthe tropical diseases has an insignificant positive correlation with subsequent economic growth,and malaria has the same significantly negative correlation with economic growth as inRegression 1. Controlling for a range of other tropical diseases does not substantially affect thecorrelation of initial malaria with subsequent growth.
The malaria index, though it is the best measure of malaria burden we could construct, isadmittedly crude. We have also developed an alternative measure of malaria intensity, whichalthough it is also crude, is derived from completely different data sources, and covers a differenttime period. The alternative malaria indicator used qualitative assessments of the severity ofmalaria from the WHO’s country-specific health advice for travellers.38 The earliest descriptionsof malaria in these advisories date from 1980, and the index is set equal to one for countries inwhich malaria affects the whole country or the whole country except for major cities, and zerootherwise. The “WHO Advisory” malaria indicator for 1980 is correlated with economic growthacross countries from 1980 to 1995 using World Bank purchasing power parity GDP per capita.8
Barro and Lee provide data for secondary schooling of those aged fifteen and over in 1980, andthe United Nations provides data for the life expectancy at birth supplemented with governmentyearbook estimates for Taiwan.39,40 The other covariates come from regressions covering the1965-90 period.
In Regression 6 of Table 6, the malaria indicator for 1980 shows a significant negativecorrelation of initial malaria with subsequent growth. Countries with malaria throughout thecountry except for major cities had 1.6% lower growth in GDP per capital in the 1980-95 period.Using malaria data from a completely independent source and assessing a different (thoughoverlapping) time period from the other growth regressions, malaria still has a very large andstatistically significant correlation with economic growth.
A recent study of the macroeconomic impact of malaria (McCarthy and others, unpublished data)uses still different data sources for measuring malaria, and a different period of economic growth(1983-1998), and different independent control variables. The study finds a robust correlationbetween malaria and growth using WHO morbidity data, but of a smaller magnitude than we findhere: just over one quarter of a percent per year of economic growth for about a quarter of thesample. As discussed above, the smaller correlation may be due to high measurement error inthe WHO malaria data.

12
The growth regression results show that countries with severe malaria in 1965 had dramaticallylower economic growth in the subsequent twenty-five years, after controlling for other factorsthat likely influenced growth, like initial poverty, economic policy, initial health and educationlevels, and tropical location. Countries that managed to reduce malaria over the period had muchhigher economic growth. These problems affected sub-Saharan Africa most severely becausemalaria levels are highest there, but the same relationship with economic growth holds in thenon-African world. Using an independent malaria measure over a different time period shows asimilar correlation of malaria and economic growth.
Could malaria have such a large impact on economic growth?
We have presented several kinds of evidence suggesting that malaria has large economic effects.What are the channels through which malaria could be a major drag on the economy?
The traditional medical view of malaria at its most severe, in holoendemic areas, is that malariacontributes significantly to child mortality and can cause acute disease in pregnant women, but itdoes not have large effects on the fitness of other mature adults due to their partial immunityacquired through constant reinfection. McGregor states this clearly: “in adult life...a host-parasite balance resembling commensualism is achieved. Despite sustained infectious challenge,adults constitute an economically viable work-force capable of coping with the strenuousphysical activities that are required to maintain essential food supplies in subsistence agriculturalcommunities.”41 Though this view may be shared by many in the medical field, it has rarelybeen the subject of careful research. One wonders if the medical focus on mortality and acutedisease obscures a general debilitation that could be caused by malaria. At least one articlereports that long-term asymptomatic malaria may be the cause of chronic pains and lassitudeamong Europeans in East Africa.42
Formidable methodological and measurement problems confront any assessment of the impact ofmalaria on individuals and households in areas of stable malaria. There is not even a clearmethod for diagnosing which individuals suffer from malaria. Virtually the whole populationcarries malaria parasites, and the density of parasites is not a reliable measure of disease burdendue to a variable immune response, which is still poorly understood. Fever symptoms are notspecific to malaria. If everyone is infected with malaria, there is no comparison group formeasuring the impact of malaria on diseased individuals relative to the healthy population.
If a clear measure of disease burden were available, one still faces the problem of assessing thecost of illness in extended rural households, accounting for the compensating behavior of otherhousehold members. It is hard to evaluate the cost of lost opportunities of household memberswho help out a person with malaria. Most attempts to directly measure the lost work due tomalaria (which ignore these problems) find small impacts (Chima and Mills, and Malaney, bothunpublished literature reviews). Some recent studies have found larger measurable impacts ofmalaria at the household level (Cropper and others, unpublished).43 However the difficulty inmeasuring who actually suffers from malaria in an environment where most people carry malariaparasites, and the myriad problems of measuring household response to debilitation make all themicroeconomic estimates incomplete.

13
Malaria has life-long effects on cognitive development and education levels through the impactof chronic malaria-induced anemia and time lost or wasted in the classroom due to illness. Theimportance of these effects is speculative, though, since their impact is virtually unstudied. Iron-deficiency anemia per se has been shown to affect the cognitive skills of children as well as theircognitive abilities in later life.44,45
It might be thought that malaria has a large impact in poor countries because of its interactionwith malnutrition. Malaria, along with other childhood infectious diseases, has been found toexacerbate malnutrition. Surprisingly, though, malnutrition probably confers some protectionagainst malaria. McGregor, in his survey of the topic, finds that “the balance of availableevidence indicates that malnutrition in humans is more commonly antagonistic to malaria.”41
In short, the impact of malaria on the productivity of individuals in areas of stable malaria cannotbe assessed with the current state of research.
Whether or not individuals are significantly debilitated by malaria, there are several otherchannels through which malaria could have large impacts on the economy. The first is theimpact of malaria on foreign direct investment and tourism. Malaria, unlike diseases resultingfrom poverty, does not discriminate between rich and poor victims. As long as malariaprotection is imperfect and cumbersome, well-to-do foreign investors and tourists may stay awayfrom malarial countries. A second channel through which malaria may affect the economy islimitation on internal movement. The better educated and the ambitious who move to the largelymalaria-free cities lose their natural protection due to lack of exposure. They may be reluctant tomaintain contact with the countryside for fear of infection. Communities in unstable malariaareas may make people from stable malaria areas unwelcome. In general, the transmission ofideas, techniques, and development of transportation systems may all be stunted by malaria.
ConclusionThe location and severity of malaria are mostly determined by climate and ecology, not povertyper se. Areas with severe malaria are almost all poor and continue to have low economicgrowth. The geographically favored regions that have been able to reduce malaria have grownsubstantially faster afterwards. The estimated impact of malaria on economic growth, using twodifferent measures of malaria, is very large, but the mechanisms behind the impact are not clear.

14
References1. Weller TH, 1958. Tropical Medicine. Encyclopedia Britannica. Chicago: William Bennet, 495-
497.2. WHO, 1999. Malaria, 1982-1997. Wkly Epidemiol Rec 74:265-270.3. Pampana EJ, Russell, PF. 1955. Malaria: A World Problem. Geneva: World Health
Organization.4. WHO, 1966. Malaria Eradication in 1965. WHO Chron 20:286-300.5. WHO, 1997. World Malaria Situation in 1994, Part I. Wkly Epidemiol Rec 72:269-274.6. Tobler W, Deichmann U, Gottsegen J, Maloy K, 1995. The Global Demography Project.
Technical Report TR-95-6, National Center for Geographic Information and Analysis,April.
7. WHO, 1992. World Malaria Situation in 1990, Part II. Wkly Epidemiol Rec 67:169-74.8. World Bank, 1998. World Development Indicators 1998 CD-ROM. Washington, D.C.:
International Bank for Reconstruction and Development.9. CIA, 1996. The World Factbook. Washington, D.C.: Central Intelligence Agency.10. CIA, 1997. The World Factbook. http://www.odci.gov/cia/publications/factbook/index.html.11. Summers R, Heston A, 1994. The Penn World Tables, Mark 5.6.
http://www.nber.org/pwt56.html.12. Gallup JL, Sachs JD, Mellinger AD, 1999. Geography and Economic Development. Pleskovic
B, Stiglitz JE, eds. World Bank Annual Conference on Development Economics 1998.Washington, DC: The World Bank, 127-178.
13. Maddison A, 1995. Monitoring the World Economy, 1820-1992. Paris: OECD.14. Coluzzi M, 1999. The Clay Feet of the Malaria Giant and its African Roots: Hypotheses and
Inferences about Origin, Spread and Control of Plasmodium falciparum. Parassitologia41:277-283.
15. McCullough D, 1977. The Path Between the Seas: The Creation of the Panama Canal, 1870-1914. New York: Simon and Schuster.
16. Soper FL, Wilson DB, 1943. Anopheles gambiae in Brazil, 1930 to 1940. New York: TheRockefeller Foundation.
17. Watson M, 1953. African highway; the battle for health in Central Africa. London: Murray.18. NIH, 1997. Final Report, International Conference On Malaria In Africa: Challenges And
Opportunities For Cooperation. January 6-9, 1997 Dakar, Senegal. Available atwww.niaid.nih.gov/dmid/malafr/.
19. Molineaux L, Gramiccia G, 1980. The Garki Project: Research on the Epidemiology andControl of Malaria in the Sudan Savanna of West Africa. Geneva: World HealthOrganization.
20. Robert V, Ouedraogo V, Carnevale P, 1991. La Transmission du Paludisme Humain dans unVillage au Centre de la Rizière de la Vallée du Kou, Burkina Faso. Robert V, Chippaux J-P, Diomandé L, and collaborators,eds. Le Paludisme en Afrique de l’Ouest: EtudesEntomologiques et Epidémiologiques en Zone Rizicole et en Milieu Urbain. Paris: Editionsde ORSTOM, 5-15.
21. Weatherall DJ, 1984. Common Genetic Disorders in the Tropics. Warren KS, Mahmoud AAF,eds. Tropical and Geographical Medicine. New York: McGraw-Hill, 88-102.
22. Carlson DG, 1984. African Fever: A Study of British Science, Technology, and Politics in WestAfrica, 1787-1864. Canton, MA: Science History Publications.
23. Luzzato L, 1984. Genetic Factors Modifying Tropical Disorders. Warren KS, Mahmoud AAF,eds. Tropical and Geographical Medicine. New York: McGraw-Hill, 77-87.
24. Kriton U, Spielman A. 1989. Supression of Transmission of Malaria Through SourceReduction: Antianopheline Measures Applied in Israel, the United States, and Italy. RevInfect Dis 11:391-406.

15
25. Kamarck AM, 1976. The Tropics and Economic Development: A Provocative Inquity into thePoverty of Nations. Washington, D. C.: World Bank.
26. Jones WHS, 1909. Malaria and Greek History. Manchester: University Press.27. Bruce-Chwatt LJ, de Zulueta J, 1980. The Rise and Fall of Malaria in Europe: A Historico-
Epidemiological Study. Oxford: Oxford University Press.28. Haworth J, 1988. The Global Distribution of Malaria and the Present Control Effort.
Wernsdorfer WH, McGregor I, eds. Malaria: Principles and Practice of Malariology.Edinburgh: Churchill Livingstone, 1379-1419.
29. Barro RJ, Sala-i-Martin X, 1991. Convergence across States and Regions. Brookings Pap EconActivity 1:107-182.
30. Verdrager J, Mamet R, Roche S, Klein JP, 1964. La Campagne d’Éradication du Paludisme àl’Ile Maurice. Port Louis, Ile Maurice: Imprimery Officiel.
31. Ross R, 1910. The Prevention of Malaria. New York: E. P. Dutton.32. Barro RJ, Sala-i-Martin X, 1995. Economic Growth. New York: McGraw Hill.33. Barro RJ, 1991. Economic Growth in a Cross-Section of Countries. Quart J Econ 106:407-43.34. American Geographical Society, 1951. Distribution of Malaria Vectors. Geog Rev 41, map.35. American Geographical Society, 1952. Distribution of Helminthiases. Geog Rev 42, map.36. American Geographical Society, 1952. Distribution of Dengue and Yellow Fever. Geog Rev 42,
map.37. American Geographical Society, 1954. World Distribution of Leischmaniases. New York:
American Geographical Society, map.38. WHO, 1981. Vaccination Certificate Requirements For International Travel and Health Advice
to Travellers. Geneva: World Health Organization.39. Barro RJ, Lee J-W, 1993. International Comparisons of Educational Attainmen. J Monet Econ
32:363-394.40. United Nations, 1996. World Population Prospects 1950-2050 (The 1996 Revision). New
York: United Nations. Computer diskettes.41. McGregor IA, 1988. Malaria and Nutrition. Wernsdorfer WH, McGregor IA, eds. Malaria:
Principles and Practice of Malariology. Edinburgh: Churchill Livingstone, 753-767.42. Wilks NE, Turner PP, Somers K, Markandya OP, 1965. Chronic Ill-Health from Unrecognized
Malaria. East Afr Med J 42:580-583.43. Audibert M, Mathonnat J, Nzeyimana I, Henry M-C, Forthcoming. Rôle du Capital Humain
dans l’Efficience Technique des Producteurs de Coton du Nord de la Côte-d’Ivoire. Revd’Econ Dev.
44. Lozoff B, Jimenez E, Wolf A, 1991. Long-term developmental outcome of infants with irondeficiency. N Engl J Med 325:687-695.
45. Pollit E, Hathirat P, Kotchabharkdi N, Missel L, Valyasevi A, 1989. Iron deficiency andeducational achievements in Thailand. Am J Clin Nutr 50:687-696.

16
Table 1. Level of GDP per capita(1) (2) (3) (4) (5) (6)
Log GDP per capita1995 1950 1995 1995 1995 1995 (non-
Africa)Population within 100km of coast (%) 1.26 0.80 0.57 0.65 0.33 0.40
(6.31)** (5.19)** (2.74)** (3.40)** (2.23)* (2.76)**log Distance to major markets -0.35 -0.12 -0.33
(3.79)** (1.37) (4.03)**log Hydrocarbons per person 0.01 0.01 0.01 0.01 0.00 0.00
(2.28)* (2.56)* (1.86) (2.13)* (1.36) (1.27)Tropical land area (%) -0.68 -0.14 -0.23 -0.59 -0.09 -0.10
(3.97)** (0.89) (1.01) (3.04)** (0.59) (0.83)Falciparum malaria index -1.17 -1.22 -1.16 -1.16 -1.10
(6.28)** (5.67)** (4.73)** (6.41)** (4.34)**Socialist -0.80 -0.10 -0.05
(5.20)** (0.66) (0.30)Colony -0.14 -0.05 -0.12
(2.18)* (0.89) (2.24)*Trade openness (0-1) 0.50 0.43
(2.99)** (2.98)**Quality of public institutions (0-10) 0.22 0.23
(6.85)** (7.82)**Constant 10.50 8.54 10.91 8.75 7.15 7.15
(14.10)** (13.54)** (17.36)** (46.40)** (29.27)** (32.30)**Observations 149 127 127 149 97 66R-squared 0.47 0.59 0.62 0.62 0.88 0.88
Robust t-statistics in parentheses* significant at 5% level; ** significant at 1% level

17
Table 2. GDP per capita growth before and after malaria eradication in southernEuropean countries (late 1940s)
GDP p.c. growth Difference w/W. Europe1913-38 1950-55 1913-38 1950-55
Greece 2.1 3.6 1.1 1.3Italy 1.0 5.3 0.1 3.0Spain -0.4 6.2 -1.4 4.0Western Europe 0.9 2.3 0.0 0.0
Table 3. GDP per capita growth before and after malaria eradication in Portugal (1958)
1953-58 1958-63 ChangePortugal 3.0 5.3 +2.3Western Europe 1.9 3.8 +1.9Difference +1.1 +1.5 +0.4
Table 4. GDP per capita growth before and after malaria eradication in Taiwan (1961)
1956-61 1961-66 ChangeTaiwan 2.8 5.8 +3.0East Asia 3.4 5.5 +2.1Difference -0.6 +0.3 +0.9
Table 5. GDP per capita growth before and after malaria eradication in Jamaica (1961)
1956-61 1961-66 ChangeJamaica 3.4 4.1 +0.7Central America and Caribbean 2.6 3.1 +0.5Difference +0.8 +1.0 +0.2


19
Table 6. Growth of GDP
(1) (2) (3) (4) (5) (6)1965-90 1965-90 1965-90
(IV)1965-90
(non-Africa)
1965-90 1980-95
Log initial GDP per capita -2.6 -2.6 -2.4 -2.5 -2.3 -3.6(8.07)** (7.90)** (7.54)** (6.36)** (8.04)** (7.95)**
Log initial secondary schooling 0.1 0.1 0.1 0.1 0.1 -0.2(1.04) (0.90) (0.60) (0.62) (0.77) (0.62)
Log initial life expectancy 4.4 3.1 3.0 3.8 4.6 9.6(4.46)** (3.41)** (3.51)** (2.34)* (4.19)** (3.44)**
Trade openness (0-1) 1.8 1.7 1.6 1.7 1.7 3.0(4.91)** (4.91)** (4.51)** (4.14)** (4.55)** (5.10)**
Quality of public institutions (0-10) 0.4 0.4 0.3 0.4 0.3 0.6(3.29)** (3.79)** (3.32)** (2.95)** (2.78)** (4.03)**
Tropical land area (%) -0.6 -0.6 -1.0 -0.6 -1.0 -0.6(1.30) (1.31) (2.55)* (1.28) (2.50)* (1.22)
Population within 100km of coast (%) 0.9 0.7 0.7 0.6 0.8 0.9(2.85)** (2.64)* (2.41)* (1.66) (2.36)* (1.80)
Initial falciparum malaria index -1.3 -2.1 -1.8 -1.8 -1.3(2.24)* (3.77)** (3.12)** (1.77) (1.98)*
Change of falciparum malaria index -2.6 -2.5 -2.2(4.07)** (3.48)** (2.24)*
0.1Tropical disease, 1st principle component(1.51)
-1.6Initial “WHO Advisory” malaria index(2.18)*
Constant 1.3 6.1 5.7 3.7 -0.9 -14.8(0.36) (1.68) (1.58) (0.63) (0.21) (1.42)
Observations 75 75 73 60 73 78R-squared 0.77 0.80 0.80 0.76 0.77 0.71
Robust t-statistics in parentheses* significant at 5% level; ** significant at 1% level

20
Table 7. Level and Changes in Malarial Prevalence between 1965 and 1994 byClimate Zone
Predominant ClimateMalaria Index1965 (0-100)
Average Change1965-1994
Temperate(N=57) 0.2 -0.2
Desert(N=23)
27.8 -8.8
Subtropical (N=42)
61.7 -5.0
Tropical(N=21)
64.9 0.5
Note: Countries are classified by their predominant ecozone from the following groupings:Temperate (temperate, boreal and polar ecozones), Desert (tropical and subtropical deserts),Subtropical (non-desert subtropical), and Tropical (non-desert tropical). The index andaverage reduction are unweighted averages over countries. See Gallup and Sachs (1999) forthe sources of climate zone data.
21
Malaria risk - 1946, 1965, 1994
1946
1965
High risk of Malaria1994
Tropic of Cancer
Tropic of Capricorn
Figure 1.

22
GDPper capita 1995
GDPper capita 1995$450 - 999$1,000 - 2,699$2,700 - 3,199$3,200 - 4,399$4,400 - 4,499$4,500 - 6,499$6,500 - 18,099$18,100 - 21,999$22,000 - 31,100No Data
Tropic of Cancer
Tropic of Capricorn
Figure 2.

23
Figure 3.Malaria Index 1965
Tropic of Cancer
Tropic of Capricorn
Malaria index 196500.01 - 0.100.11 - 0.290.30 - 0.470.48 - 0.740.75 - 1.00

24
Figure 4.Malaria Index 1994
Tropic of Cancer
Tropic of Capricorn
Malaria index 199400.01 - 0.180.19 - 0.420.43 - 0.650.65 - 0.800.81 - 1.00


