Available on CMS information server CMS DP -2015/067 CMS Performance Note 19 December 2015 (v2) Electron and Photon performance using data collected by CMS at √ s = 13 TeV and 25ns EGamma POG Abstract This note describes preliminary performances of the electron and photon reconstruction with the CMS experiment using data collected at √ s = 13 TeV and with a LHC bunch spacing of 25ns. Electron and photon key discriminating variables and their data to simulation agreement are shown. The identifica- tion and reconstruction efficiencies are also computed and compared to the ones from the simulation. Performances and data to simulation agreement are expected to improve with future calibrations and reprocessing.
Transcript
Available on CMS information server CMS DP -2015/067
CMS Performance Note
19 December 2015 (v2)
Electron and Photon performance using datacollected by CMS at
√s = 13 TeV and 25ns
EGamma POG
Abstract
This note describes preliminary performances of the electron and photon reconstruction with the CMSexperiment using data collected at
√s = 13 TeV and with a LHC bunch spacing of 25ns. Electron and
photon key discriminating variables and their data to simulation agreement are shown. The identifica-tion and reconstruction efficiencies are also computed and compared to the ones from the simulation.Performances and data to simulation agreement are expected to improve with future calibrations andreprocessing.
Outline
Dielectron mass plot
Electron ID and Isolation Variables (using Z→ee)
Electron Reconstruction and Identification Efficiency
Photon ID and Isolation Variables (using Z→μμγ)
Photon Identification and Electron Veto Efficiency
1
Electrons data / MC agreement, event selection
Data: recorded with single electron trigger, 2.1 fb-1
Simulation: only Drell Yan simulated using madgraph generator
Data/MC agreement shown for probe electrons selected using a tag and probe methods with the following criteria
2
pT(e) > 30 GeV
|η(e)| < 2.1
Tight identification criteria
Trigger matched
Tag electron selectionpT(e) > 10 GeV
|η(e)| < 2.5
Loose identification criteria
Relative isolation (PU corrected) < 0.1
Probe electron selection
Event selection80 < m(ee) < 100 GeV
Leading Electron pT
3
Electron transverse momentum spectrum for the leading electron. Shown for electrons in the ECAL barrel (left) and ECAL endcap (right).
Trailing Electron pT
4
Electron transverse momentum spectrum for the trailing electron. Shown for electrons in the ECAL barrel (left) and ECAL endcap (right).
5
Electron pseudorapidity (left) and phi (right) distributions for the leading electron.
Leading Electron η & φ
6
Electron pseudorapidity (left) and phi (right) distributions for the trailing electron.
Trailing Electron η & φ
7
ECAL-crystal-based shower covariance in the η direction. Shown for electrons in the ECAL barrel (left) and ECAL endcap (right).
σiηiη
barrel endcap
8
The sum of transverse energies of neutral electromagnetic candidates in a ΔR = 0.3 cone around the electron, divided by the electron transverse momentum. Shown for electrons in the ECAL barrel (left) and ECAL endcap (right), isolation cut removed.
Relative Electromagnetic Isolation
barrel endcap
9
The sum of transverse energies of charged hadron candidates in a ΔR = 0.3 cone around the electron, divided by the electron transverse momentum. Shown for electrons in the ECAL barrel (left) and ECAL endcap (right), isolation cut removed.
Relative Charged Hadron Isolation
barrel endcap
10
The sum of transverse energies of neutral hadron candidates in a ΔR = 0.3 cone around the electron, divided by the electron transverse momentum. Shown for electrons in the ECAL barrel (left) and ECAL endcap (right), isolation cut removed.
Relative Neutral Hadron Isolation
barrel endcap
11
The ratio of energy measured in the hadronic calorimeter (HCAL), in a ΔR = 0.15 cone behind the electron seed, over the energy measured in the ECAL. Shown for electrons in the ECAL barrel (left) and ECAL endcap (right).
H / E
barrel endcap
12
The difference in η between the energy-weighted supercluster position in the electromagnetic calorimeter (ECAL) and the track direction at the innermost tracker position. Shown for electrons in the ECAL barrel (left) and ECAL endcap (right). Disagreement in the EE due to Tracker/ECAL misalignment not corrected yet.
Δηin
barrel endcap
13
Δɸin
The difference in ɸ between the energy-weighted supercluster position in the electromagnetic calorimeter (ECAL) and the track direction at the innermost tracker position. Shown for electrons in the ECAL barrel (left) and ECAL endcap (right).
barrel endcap
14
The fraction of momentum lost to bremsstrahlung measured in the tracker, defined as fBrem. Shown for electrons in the ECAL barrel (left) and ECAL endcap (right).
Bremsstrahlung Fraction
barrel endcap
15
Absolute difference between the inverse electron energy measured in the electromagnetic calorimeter (ECAL) and the inverse momentum measured in the tracker. Shown for electrons in the ECAL barrel (left) and ECAL endcap (right).
| 1/E - 1/p |
barrel endcap
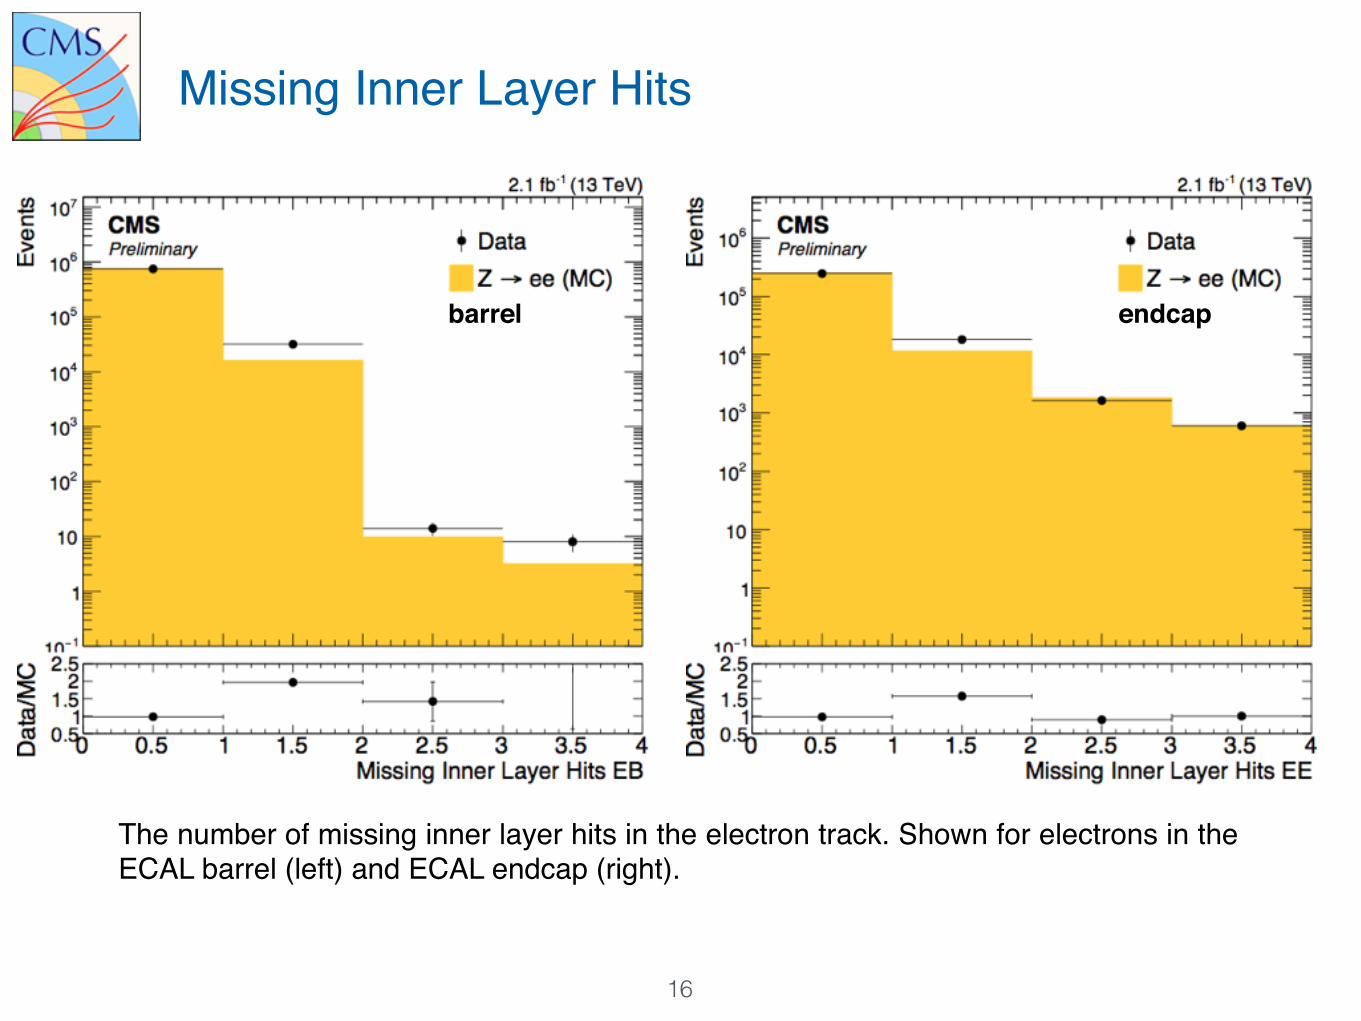
16
The number of missing inner layer hits in the electron track. Shown for electrons in the ECAL barrel (left) and ECAL endcap (right).
Missing Inner Layer Hits
barrel endcap
17
The output of the electron identification MVA, which uses track and supercluster variables as input. Shown for electrons in the ECAL barrel (left) and ECAL endcap (right). The data/MC discrepancy on the left tail is due to background contamination.
MVA
barrel endcap
Data: recorded with single electron trigger, 2.5 fb-1
Efficiency measured in data with the tag and probe method using Z→eenumber of probe electrons obtained from a fit to the dielectron invariant mass
signal modeled by (Z/γ*→ee) simulation
background modeled with ad hoc analytical function
Three different types of efficiency are measured:electron reconstruction criteria
electron cut-based identification criteria
electron mva-based identification criteria (for triggering and non-triggering electrons)
Sources of systematic uncertainties consideredModeling: signal and background modeling
Simulation: kinematics, pile-up
Event selection: tag electron selection
Electron efficiency measurement
18
Electron Reconstruction Efficiency
19
Electron reconstruction efficiency in data (top) and data to MC efficiency ratios (bottom).
The efficiency is measured with the tag and probe method and shown in five pseudorapidity ranges as a function of the electron transverse momentum.
Blue points correspond to the Barrel-Endcap transition region.
[GeV]T
p20 30 40 50 60 70 80 90 100 200
Dat
a / M
C
0.8
0.85
0.9
0.95
1
1.05
1.1
1.15
1.2 210D
ata
effic
ienc
y0.8
0.85
0.9
0.95
1
1.05
1.1
1.15 0.800≤ | η | ≤0.000 1.444≤ | η | ≤0.800 1.566≤ | η | ≤1.444 2.000≤ | η | ≤1.566 2.500≤ | η | ≤2.000
(13 TeV)-12.5 fb
CMSPreliminary
20
Electron cut-based ID
Electron identification efficiency in data (top) and data to MC efficiency ratios (bottom) measured for the tight cut-based work points.
The efficiency is measured with the tag and probe method and shown in five pseudorapidity ranges as a function of the electron transverse momentum.
Blue points correspond to the Barrel-endcap transition region, hence have a much lower efficiency.
[GeV]T
p20 30 40 50 60 70 80 90 100 200
Dat
a / M
C
0.8
0.85
0.9
0.95
1
1.05
1.1
1.15
1.2 210D
ata
effic
ienc
y0.3
0.4
0.5
0.6
0.7
0.8
0.9
1 0.800≤ | η | ≤0.000 1.444≤ | η | ≤0.800 1.566≤ | η | ≤1.444 2.000≤ | η | ≤1.566 2.500≤ | η | ≤2.000
(13 TeV)-12.5 fb
CMSPreliminary
21
Electron triggering MVA ID
Electron identification efficiency in data (top) and data to MC efficiency ratios (bottom) measured for the identification criteria based on a MVA discr iminant wi th an average efficiency of 80%.
The efficiency is measured with the tag and probe method and shown in three pseudorapidity ranges as a function of the electron transverse momentum.
[GeV]T
p20 30 40 50 60 70 80 90 100 200
Dat
a / M
C
0.8
0.85
0.9
0.95
1
1.05
1.1
1.15
1.2 210D
ata
effic
ienc
y0.6
0.65
0.7
0.75
0.8
0.85
0.9
0.95
1
1.05 1.000≤ | η | ≤0.000 1.500≤ | η | ≤1.000 2.500≤ | η | ≤1.500
(13 TeV)-12.5 fb
CMSPreliminary
Photon data/MC agreement, event selection
Data: recorded with double muon trigger, 2.2 fb-1
Simulation: only Drell Yan simulated using MC@NLO generator
Photon sample from Z → μμγ decay selected with
22
pT(μ) > 20, 10 GeV
Tight identification criteria
Muon selectionpT(γ) > 10 GeV
H/E < 0.05
σiηiη < 0.011 (0.031) for EB (EE)
charged isolation (corrected from PU) < 3.0 GeV
Photon selection
Event selection∆R(μ,γ)min < 0.8
m(μμγ) + m(μμ) < 180 GeV
70 < m(μμγ) < 110 GeV
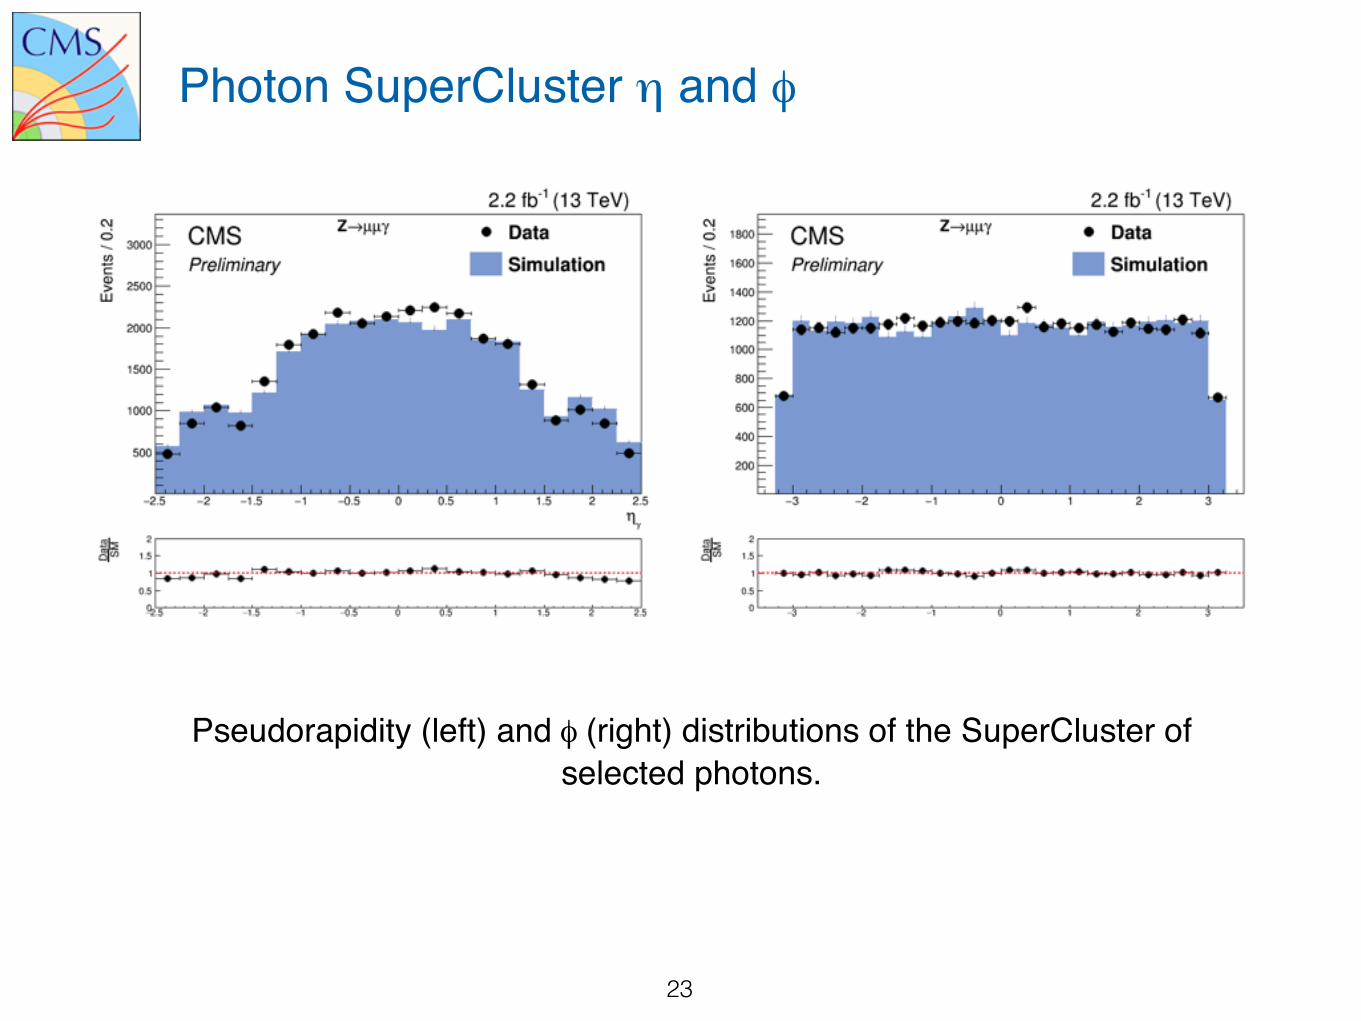
23
Pseudorapidity (left) and φ (right) distributions of the SuperCluster of selected photons.
Photon SuperCluster η and φ
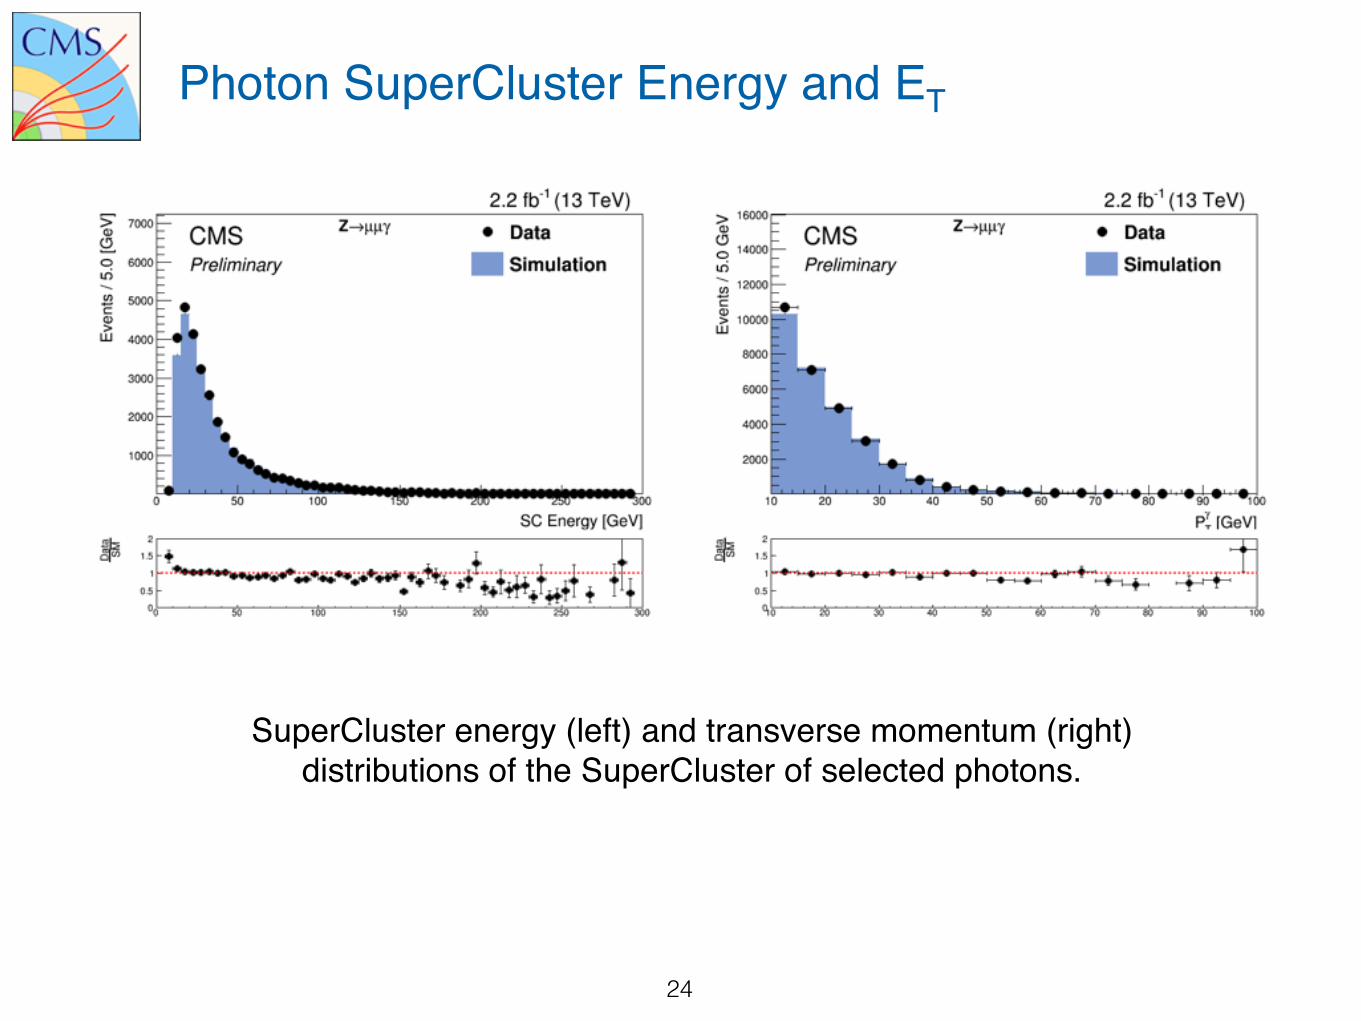
24
SuperCluster energy (left) and transverse momentum (right) distributions of the SuperCluster of selected photons.
Photon SuperCluster Energy and ET
25
ECAL-crystal-based shower width in the η direction for barrel (left) and endcap (right) photons.
σiηiη
26
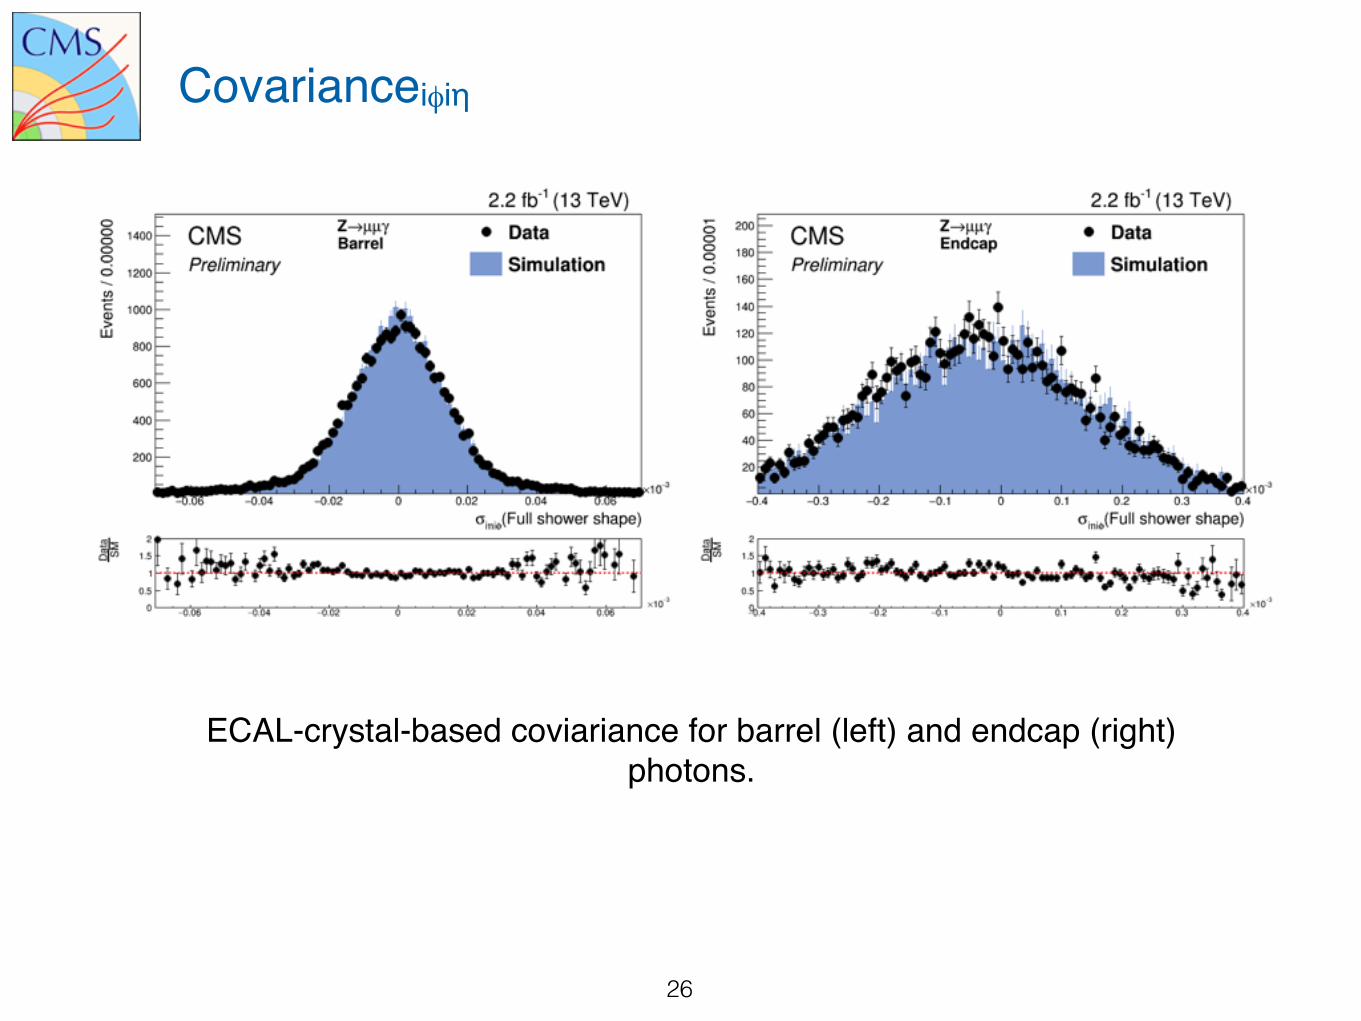
ECAL-crystal-based coviariance for barrel (left) and endcap (right) photons.
Covarianceiφiη
27
Ratio of energy in the HCAL to the energy of the ECAL SuperCluster for barrel (left) and endcap (right) photons.
H/E
28
η (left) and φ width of the SuperCluster of the selected photons.
Width of the Photon SuperCluster in η and φ
29
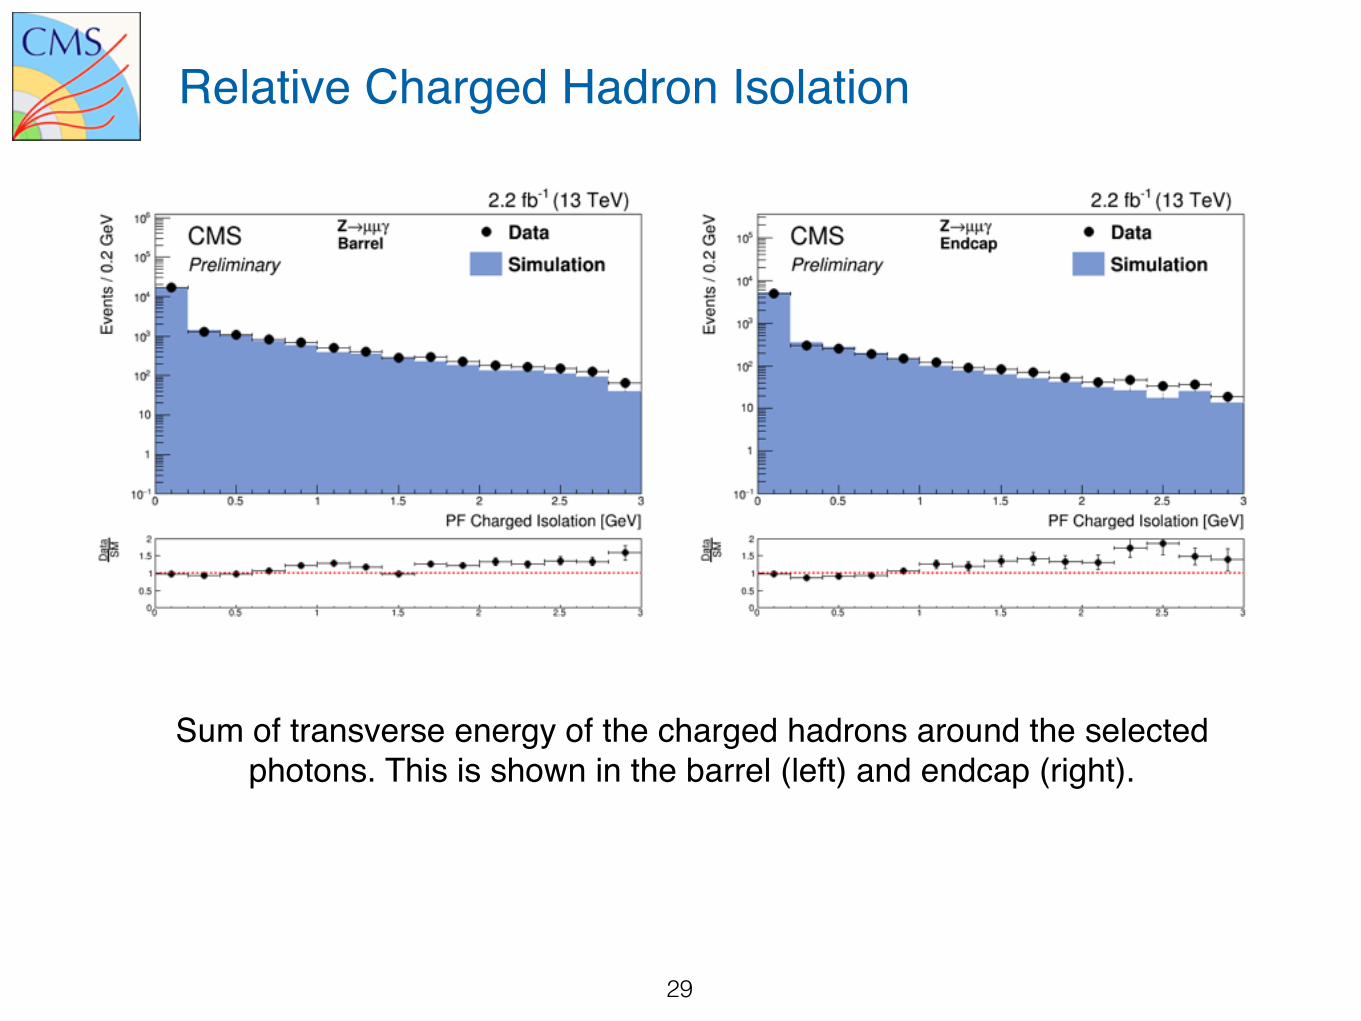
Sum of transverse energy of the charged hadrons around the selected photons. This is shown in the barrel (left) and endcap (right).
Relative Charged Hadron Isolation
30
Sum of transverse energy of the photons around the selected photons. This is shown in the barrel (left) and endcap (right).
Relative Electromagnetic Isolation
barrel endcap
31
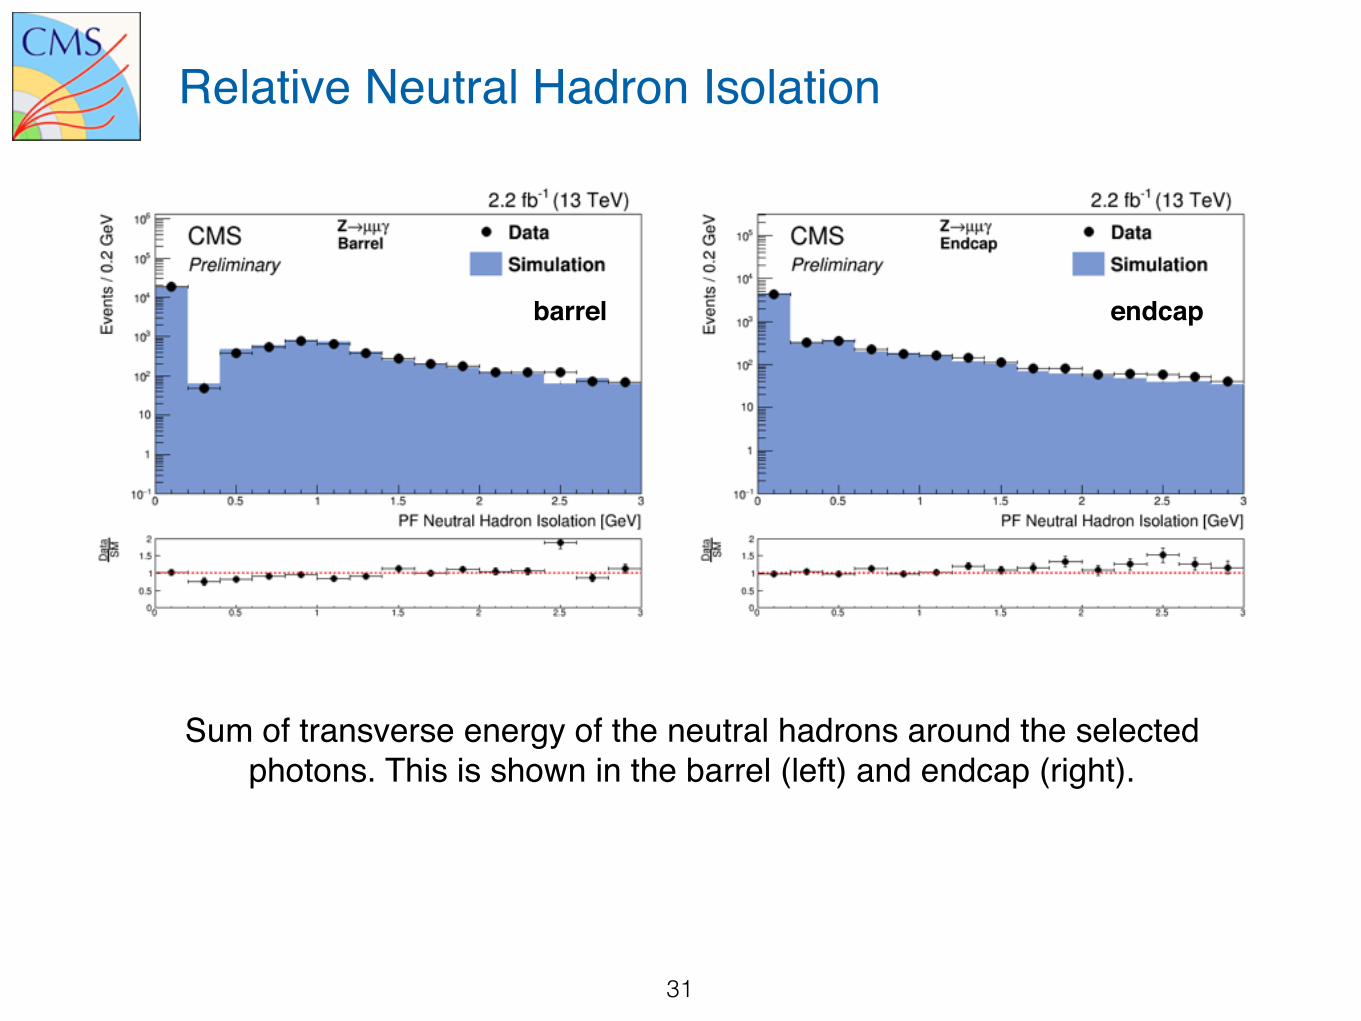
Sum of transverse energy of the neutral hadrons around the selected photons. This is shown in the barrel (left) and endcap (right).
Relative Neutral Hadron Isolation
barrel endcap
32
The output of the photon identification MVA. Shown for photons in the barrel (left) and endcap (right)
MVA
barrel endcap
Data: recorded with single electron trigger, 2.5 fb-1
Efficiency measured in data with the tag and probe method using Z→eeprobe candidates are electrons reconstructed as photons
number of probe photons obtained from a fit to the dielectron invariant mass
signal modeled by (Z/γ*→ee) simulation
background modeled with ad hoc analytical function
Two different types of efficiency are measured:photon cut-based identification criteria
photon mva-based identification criteria
Sources of systematic uncertainties consideredModeling: signal and background modeling
Simulation: kinematics, pile-up
Event selection: tag electron selection
Photon efficiency measurement
33
[GeV]T
p20 30 40 50 60 70 80 90 100 200
Dat
a / M
C
0.8
0.85
0.9
0.95
1
1.05
1.1
1.15
1.2 210
Dat
a ef
ficie
ncy
0.7
0.75
0.8
0.85
0.9
0.95
1
1.05
1.1
1.15 1.000≤ | η | ≤0.000 1.444≤ | η | ≤1.000 2.500≤ | η | ≤1.566
(13 TeV)-12.5 fb
CMSPreliminary
34
Photon ID efficiency
Photon identification efficiency in data and data to MC efficiency ratios measured for the tight cut-based work point (left) and for the identification based on a MVA discriminant (right). The efficiency is measured with the tag and probe method and shown in three pseudorapidity ranges as a function of the photon transverse momentum.
[GeV]T
p20 30 40 50 60 70 80 90 100 200
Dat
a / M
C
0.8
0.85
0.9
0.95
1
1.05
1.1
1.15
1.2 210
Dat
a ef
ficie
ncy
0.5
0.55
0.6
0.65
0.7
0.75
0.8
0.85 1.000≤ | η | ≤0.000 1.444≤ | η | ≤1.000 2.500≤ | η | ≤1.566
(13 TeV)-12.5 fb
CMSPreliminary
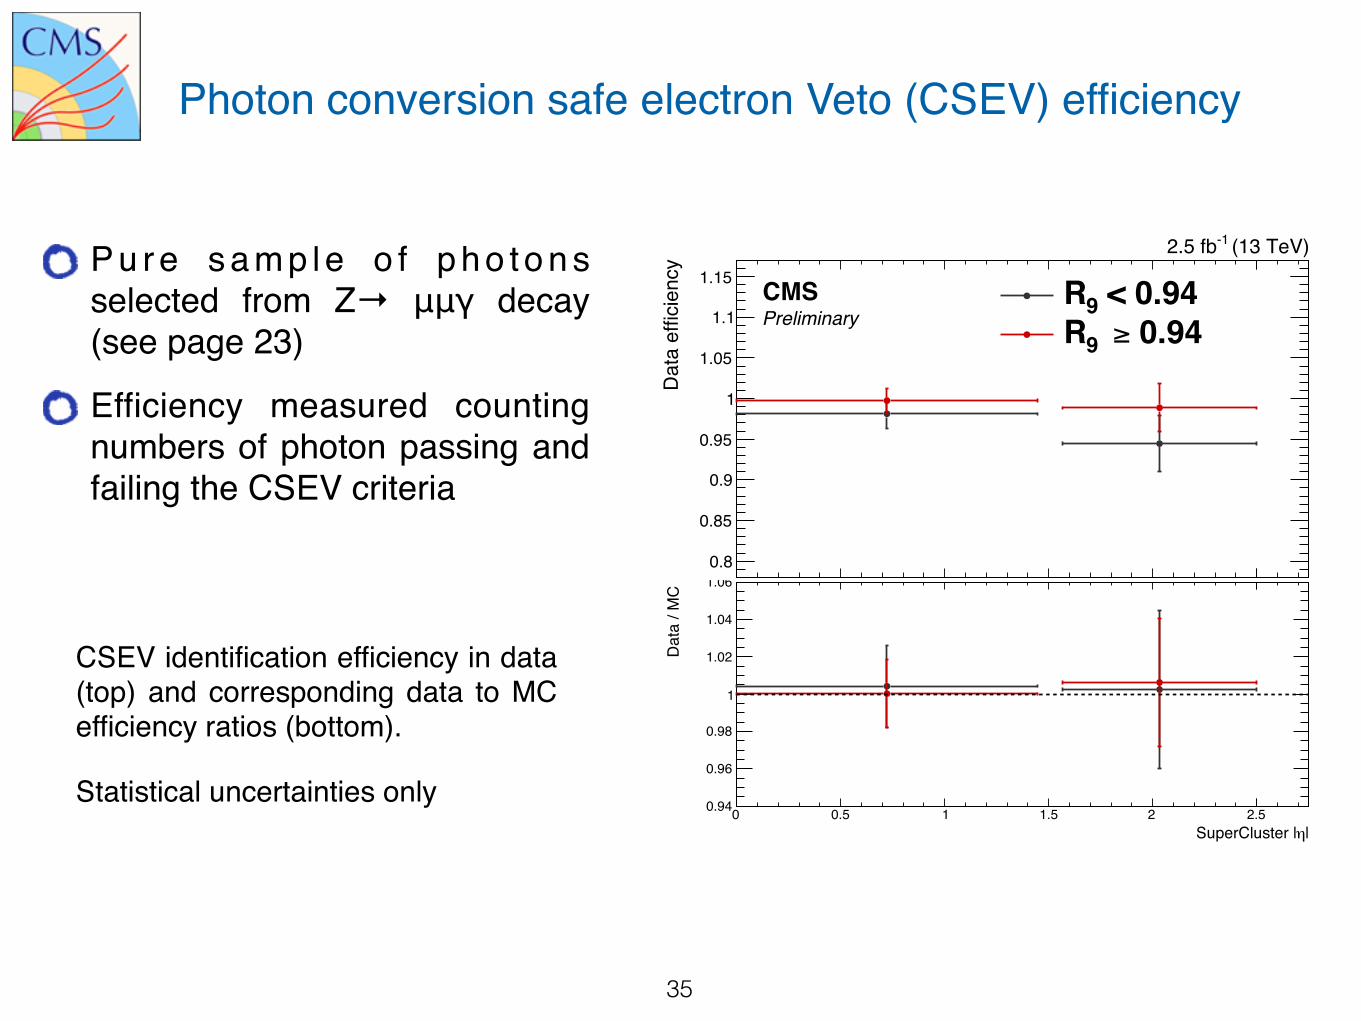
Photon conversion safe electron Veto (CSEV) efficiency
35
P u r e s a m p l e o f p h o t o n s selected from Z→ μμγ decay (see page 23)
Efficiency measured counting numbers of photon passing and failing the CSEV criteria
|ηSuperCluster |0 0.5 1 1.5 2 2.5
Dat
a / M
C
0.94
0.96
0.98
1
1.02
1.04
1.060 0.5 1 1.5 2 2.5
Dat
a ef
ficie
ncy
0.8
0.85
0.9
0.95
1
1.05
1.1
1.15 < 0.949R 0.94≥ 9R
(13 TeV)-12.5 fb
CMSPreliminary
CSEV identification efficiency in data (top) and corresponding data to MC efficiency ratios (bottom).