Page 1
74
Journal of Himalayan Earth Sciences Volume 50, No 2, 2017, pp. 74-92
Co-seismic landslides automatic detection on regional scale with sub-pixel
analysis of multi temporal high resolution optical images: Application to
southwest of Port au Prince, Haiti
Sumbal Bahar Saba 1,2, Muhammad Ali 1, Mark van der Meijde 2 and Harald van der
Werff 2 1 National Center of Excellence in Geology (NCEG), University of Peshawar, Pakistan,
2 International Institute for Geo-Information Science and Earth Observation (ITC), Enschede,
The Netherlands
Corresponding author’s email: [email protected]
Submitted: 20/03/2017, Accepted: 20/10/2017, Published Online: 30/11/2017
Abstract
Customary methods for landslide detection are labor demanding, time consuming and
costly. Moreover, it becomes a real challenge to map event triggered landslides using customary
techniques. Various automatic and semi-automatic techniques have been proposed for landslide
detection. These techniques require extensive technical knowledge and familiarity of the selected
study area for visual interpretation, suitable sampling selection, manual parameterization and the
trial and error approach for selection of thresholds which makes the process irreproducible. In
this context, the purpose of this study is to introduce and investigate the applicability of an
automatic technique of Cosi-Corr (Co-registration of Optically Sensed Images and Correlation)
for landslide identification on regional scale using high resolution orthorectified worldwies 2
images. Unlike, conventional pixel based semi-automatic methods which depends on spectral
properties of pixels, this method is based on pixels shift. The correlation process was performed
by using the Cosi-Corr software. The ground displacement field measured from the correlation
indicates high displacement values for landslides triggered by 2010 Haiti earthquake. The
method automatically identified more than 73% of co-seismic landslides at the threshold value of
3.75. The adopted procedure proposes a quick and economic way for automatic detection of co-
seismic landslides on regional scale if suitable pre- and post-event satellite data is available. One
limitation of this method is that it does not show any unique behavioral characteristics for
different types of landslides so that they could be easily distinguished or classified.
Keywords: Landslides, Landslide detection, COSI-Corr, Haiti.
1. Introduction
Correct and rapid mapping of
landslides is essential to know about the full
amount and range of landslide disaster
(Guzzetti et al., 2004; Tsai et al., 2010) and to
create and validate landslide susceptibility
models (Guzzetti et al., 2006; Rossi et al.,
2010). The ability to effectively detect and
monitor landslides and its potential impacts is
important to the public, transport authorities,
utility companies and the agricultural industry
as such phenomena can threaten life, damage
infrastructure and have long lasting economic
effects.
Customary methods have limitations
as data collection techniques are labor
demanding, time consuming and costly. Also,
accessibility to high mountainous regions is
difficult. Moreover, it becomes a real
challenge to map event triggered landslides
by using customary approaches as happened
lately when thousands of landslides were
triggered by Kashmir earthquake, 2005,
China earthquake, 2008, Haiti earthquake,
2010 and Brazil rainfall, 2011. Therefore, to
provide fast and up-to-date landslide
information over large areas, various
Page 2
75
automatic and semi-automatic landslide
detection techniques have been proposed.
The developed methods could be
grouped on the basis of type and size of
geographical elements used for landslide
mapping, such as, pixel-based group
(Borghuis et al., 2007; Cheng et al., 2004;
Khairunniza-Bejo et al., 2010; Metternicht et
al., 2005; Mondini et al., 2011; Yamaguchi et
al., 2003) and object-oriented group (Martha
et al., 2010; Moine et al., 2009; Park and Chi,
2008; Stumpf and Kerle, 2011). On the basis
of number of images used, such as, mono-
temporal (Borghuis et al., 2007; Haeberlin et
al., 2004) in which single post-event image is
used and multi-temporal (Lee and Lee, 2006;
Mondini et al., 2011; Nichol and Wong, 2005;
Stumpf and Kerle, 2011; Tsai et al., 2010;
Weirich and Blesius, 2007) in which two or
more pre-and post- event imagery are used.
While using Pixel based approaches,
preliminary efforts by Yamaguchi et al.,
(2003), Cheng et al. (2004) and Lin et al.
(2005) focused on semi-automatic landslide
detection using low resolution SPOT 1-3 (10-
20m) images. Yamaguchi et al. (2003)
applied image registration technique using
SPOT HRV 10m data and as a result,
landslide movement was successfully
detected as misregistration vectors between
the two satellite images. Likewise, to
determine land use changes before and after
the landslide occurrence, occurrences, Cheng
et al. (2004) used multi-temporal SPOT (20m
multispectral) data by performing image
classification (image differencing) approach.
Similarly, Lin et al. (2005) applied vegetation
index differencing method using SPOT data
(multispectral 20m). The above cited
techniques have benefits and weaknesses.
Such as Image registration can be used to
measure sub-pixel movement of landslides
correctly, but it has great computational cost
in terms of CPU time. Similarly, Image-
classification reduces the influence of
atmospheric, sensor and environmental
alterations among multi-temporal images, but
it needs proper selection of adequate training
samples to be used for classification.
Vegetation index differencing highlights
changes in spectral response of various
features and decreases influences of
topographic effects and illumination.
Nevertheless, this method also boosts random
noise or coherent noise (Tang and Dai, 2010).
Regardless of the limitations related to
these methods, outcomes are vastly reliant on
the spatial resolution of the data used for
landslide detection. SPOT 1–4 data could
hardly be used for detecting and measuring
landslides due to its vast spatial extent
(Metternicht et al., 2005). Slope failures may
be detected using low spatial resolution
imagery (SPOT 10m, Landsat TM 30m), only
if size and contrast is appropriately large, and
very clear. However, according to previous
researches, determining landslides types and
their causes on spatial scales below 1:25000
are inadequate (Singhroy, 2002). This
explains that SPOT (10m) to Landsat TM
(30m) imagery have only been utilized to
determine landslides related terrain settings,
such as, lithology, soil humidity, land
use/land cover information and vegetation
variation (Cheng et al., 2004; Lin et al., 2002;
Mantovani et al., 1996 and Zhou et al., 2002.
After the availability of high
resolution (spatial) images (for example,
SPOT 5, IKONOS, QuickBird, Cartosat-1 and
2, Worldview1, 2 and ALOS-PRISM data), a
new era of research has been initiated for
preparing better landslide maps. Research
work based on high resolution images include
maximum likelihood classifier based change
detection comparison by Nichol and Wong,
(2005), who proposed the use of medium
resolution, multi temporal satellite images
(SPOT, XS and IKONOS) for landslide
recognition and classification. The results
reported up to 70% detection rates. However,
the application of this technique require
extensive knowledge and familiarity of the
Page 3
76
study area for visual interpretation
(Khairunniza-Bejo et al., 2010), suitable
sampling strategy, and selection of
appropriate quantity of training samples to get
high detection rate.
A very interesting utilization of high
resolution images comes from Hervas et al.
(2003) and Rosin and Hervas (2003) who
suggested to use computer-generated
IKONOS digital imagery at 1-m resolution
from existing aerial photographs to detect
landslides. In the mentioned method, a new
technique for change detection was proposed.
The change detection was based on spatial
filtering, thresholding and image difference
for eliminating pixel clusters related to human
induced land use/land cover changes. In the
same way, Delacourt et al. (2004)
demonstrated semi-automatic approaches to
monitor landslide displacement from high
resolution multi temporal aerial photographs
and Quickbird (0.6m) images. This method
has the potential to detect smaller motions on
two images acquired with the same sensor.
These motions can as low as 0.1 m and gives
a very good example that how high resolution
images can improve monitoring and mapping
of landslides. However, these methods can
only be useful to monitor local scale surface
changes related to moderate velocity
landslides. Major efforts were suggested for
applying in a broad range of landslide
scenarios in large areas or on regional scale.
All the automatic methods described
above are pixel-based methods that depend
mainly on the spectral signal of individual
pixels. In the last decade, an idea was
developed in remote sensing community that
pixel-based methods have major limitations in
addressing individual landslide characteristic
due to finite spatial extent. By applying these
methods, geometric and contextual
information available in the image are
basically ignored (Blaschke, 2010). They
suggested a new semi-automatic technique of
Object based Image Analysis (OBIA) for
landslides detection based on combination of
spectral, morphological, and contextual
characteristics of landslides supported by
expert knowledge (Barlow et al., 2006;
Martha et al., 2010; Moine et al., 2009; Park
and Chi, 2008; Parker et al., 2011; Ping et al.,
2011; Stumpf and Kerle, 2011).
Primarily, Barlow et al. (2003) used a
self-contained classification scheme of OBIA
to detect translational landslide scars with
overall accuracy of 75 percent. However,
landslides below 1 ha in size were ignored in
the accuracy assessment. Then, Martin and
Franklin (2005) proposed OBIA based
approach for detection and separating of soil-
lead slides from bedrock-lead slides. For this
method, Landsat ETM and DEM data was
employed. Approximately 65% classification
accuracy was obtained. Barlow et al. (2006)
further improved the method by
demonstrating an automated classification
technique based on image segmentation for
discriminating classes of repaid mass
movement from SPOT 5 images and a DEM.
The overall accuracy was 75 percent, but the
detection and classification of individual
types have been less successful. To modify
the landslide recognition and classification
results using OBIA, Martha et al. (2010)
developed rules set to synthesize the
diagnostic features for semi-automatic
detection and classification of landslides
using a combination of high resolution image
segmentation with DEM data. The overall
accuracy was 77 percent. However, the
proposed methodology comprises of
numerous steps of discrete manual
parameterization, and the trial and error
nature for selection of thresholds makes the
practice irreproducible, cumbersome and
lengthy.
The above literature review of pixel
based methods illustrates that very few
studies have used pixel based approaches for
landslide mapping by using high resolution
imagery except Delacourta et al. (2004) who
Page 4
77
used real high resolution IKONOS imagery
instead of simulated images and Borghuis et
al. (2007) who employed unsupervised image
classification using SPOT-5 imagery for
automated landslide mapping (detect 63%).
These methods still need to be well explored
due to improved spatial resolution imagery
(SPOT 5, IKONOS, ALOS, QuickBird and
WorldView1-2).
Similarly, the literature review of
object based methods reveal that if a semi-
automated technique based on OBIA has to
be used then the rules set shall be redefined
for every area to convert the regions or
segments into meaningful objects. For good
rules set, good expert based knowledge is
required to formulate rules to be incorporated
on various stages of the analysis, and
introduction of many parameters means
introduction of many errors on various stages.
Additionally, there are different challenges
involved in processing large datasets. OBIA
based landslide detection methods also have
tendency to miss a mark in conditions where
both newly triggered and older landslides are
present and therefore it prevents an accurate
event-related landslide mapping.
In this context, the purpose of this
study is to introduce, explore the applicability
and performance of an automatic technique of
Cosi-Corr (Co-registration of Optically
Sensed Images and Correlation) for landslide
identification on regional scale by using
multi-temporal high resolution optical images.
Unlike, conventional pixel based semi-
automatic methods, which depends on
spectral properties of pixels, this method is
founded on pixels shift. Landslides will be
identified on the basis of displacement if
during the pre- and post-event period pixels
have changed their position. Furthermore, this
method is totally automatic, so no rules set
with many parameters and thresholds are
required to be integrated on different stages of
the analysis.
2. Study area
A magnitude Mw 7.0 earthquake hit
15 km southwest of Port-au-Prince region of
Haiti on January 12, 2010 at 18°27'25"N
latitude and 72°31'59"W longitude. The
earthquake happened at a depth of 13 km
along the Enriquillo-Plaintain Garden fault
zone (EPGFZ. The fault passes west-east
laterally to the northern part of the southern
Haiti peninsula. It is characterized by evident
tectonic geomorphology comprising of long,
linear waterway gorges, extensional basins
along releasing bends, and north- and south-
facing mountain escarpments. Delta fans and
alluvial valleys display marks of speedy
sedimentation and substantial movement of
dynamic drainages over the Quaternary.
Haiti’s has generally hot and humid
tropical climate. Average temperature ranges
from 25°C in January and February to 30°C
in July and August. The average annual
rainfall is 140 to 200 centimeters.
Agricultural practices are common on slope
terraces. Deforestation, erosion, land
fragmentation and poor primitive agricultural
techniques are giving rise to increased land
sliding in the area.
In the epicenter zone and in the
surrounding valleys, thousands of co-seismic
landslides were triggered that caused
widespread damage (Eberhard et al., 2010;
Ellen et al., 2010). Landslide head scarps and
debris avalanche were commonly reported
along the sidewalls of the River Momance
canyon, within the Mio-Pliocene and older
limestone bedrock in steep slopes and road
cuts (Koehler and Mann, 2011). Co-seismic
landslides and debris fall were evident in river
valley with massive debris aprons at the
bottom of slopes that every so often refract
the river, and masses of rocks and debris were
dumped on the river alluvium.
A study site of 120 km2 area is selected in
the south west of Port-au-Prince (Fig. 1). The
Page 5
78
site was selected due to its nearness to the
epicenter, its location along the active fault
zone (EPGFZ), high concentration of co-
seismic landslides and availability of pre-and
post-earthquake imagery. The selected area
has experienced an intricate geologic past of
incursion, tectonics, corrosion, and
sedimentation. The topography of the study
area is relatively rugged ranges from 0 to
1100m above mean sea level. It has steep
mountain ranges and hill-fronts, deeply
incised streams with slope ranges from 15° to
60°. The narrow intermountain stream valleys
include River Momance and Frorse.
In the study area, the Enriquillo fault
system separates basaltic rocks to the south of
the fault and sedimentary rocks which consist
of sandstone and limestone to the north
(Eberhard et al., 2010). The soils in the
mountains are thin. The lower hills on west
side of the study area have abundance of red
clays and loams.
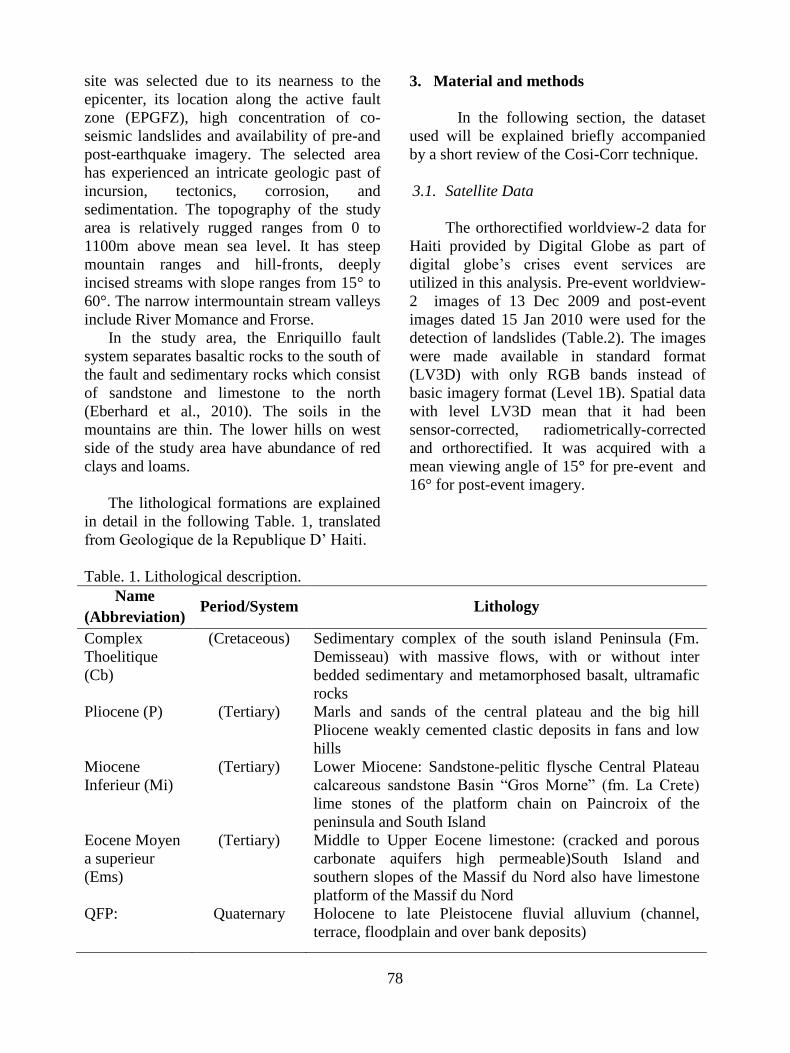
The lithological formations are explained
in detail in the following Table. 1, translated
from Geologique de la Republique D’ Haiti.
3. Material and methods
In the following section, the dataset
used will be explained briefly accompanied
by a short review of the Cosi-Corr technique.
3.1. Satellite Data
The orthorectified worldview-2 data for
Haiti provided by Digital Globe as part of
digital globe’s crises event services are
utilized in this analysis. Pre-event worldview-
2 images of 13 Dec 2009 and post-event
images dated 15 Jan 2010 were used for the
detection of landslides (Table.2). The images
were made available in standard format
(LV3D) with only RGB bands instead of
basic imagery format (Level 1B). Spatial data
with level LV3D mean that it had been
sensor-corrected, radiometrically-corrected
and orthorectified. It was acquired with a
mean viewing angle of 15° for pre-event and
16° for post-event imagery.
Table. 1. Lithological description.
Name
(Abbreviation) Period/System Lithology
Complex
Thoelitique
(Cb)
(Cretaceous) Sedimentary complex of the south island Peninsula (Fm.
Demisseau) with massive flows, with or without inter
bedded sedimentary and metamorphosed basalt, ultramafic
rocks
Pliocene (P) (Tertiary) Marls and sands of the central plateau and the big hill
Pliocene weakly cemented clastic deposits in fans and low
hills
Miocene
Inferieur (Mi)
(Tertiary) Lower Miocene: Sandstone-pelitic flysche Central Plateau
calcareous sandstone Basin “Gros Morne” (fm. La Crete)
lime stones of the platform chain on Paincroix of the
peninsula and South Island
Eocene Moyen
a superieur
(Ems)
(Tertiary) Middle to Upper Eocene limestone: (cracked and porous
carbonate aquifers high permeable)South Island and
southern slopes of the Massif du Nord also have limestone
platform of the Massif du Nord
QFP: Quaternary Holocene to late Pleistocene fluvial alluvium (channel,
terrace, floodplain and over bank deposits)
Page 6
79
In order to orthorectify and co-register
images upto sub-pixel accuracy level, the
availability of data in basic format with the
supporting files like RPB and IMD is a
prerequisite. However, due to the
unavailability of these supporting files, we
used the images in standard format. These
images were already orthorectified and
radiometrically corrected but from the
perception of co-registration, there was a
slight shift between the pre- and post-event
imagery.
Fig. 1. Shows the location of the selected study area overlapped by earthquake triggered
landslides. It is situated in the South of Haiti and adjacent to Portau-Prince. The red color solid
lines represent active fault lines passing through the area.
Table 2. Analyzed Worldview-2 images
Image ID WV02 Level
of data
Acquisition
data (dd-
mm-yyyy)
Avg off-
nadir angle
Spatial
resolution
Time Band
used
09DEC13152914-S3DS_R01C1-
052299729020_01_P001.TIF
LV3D 13/12/2009 15° 2m 23:31 Green
10JAN15152539-S3DS_R01C1-
052300443020_01_P001.TIF
LV3D 15/1/2010 16° 2m 21:50 Green
Usually 3N band is selected for
correlation studies (Ayoub et al., 2008;
Scherler et al., 2008; Vermeesch and Drake,
2008). It usually offers the best SNR (signal
to noise ratio) as it has the largest spectral
bandwidth. In our case, among the three RGB
bands resampled to 2m spatial resolution,
Page 7
80
Green band was selected as it has the largest
bandwidth after the 3N band (Table. 3).
3.2. Cosi-Corr Technique
A set of techniques/software package/
called Co-Registration of Optically Sensed
Images and Correlation (COSI-Corr)
described in detail by Leprince et al. (2007)
and Scherler et al. (2008) has been used in
this study. In this method, precise and
accurate image sub pixel level registration
and correlation have been attained. The main
function of the COSI-Corr is the precise
ortho-rectification, co-registration and
correlation of the remote sensing data. This
software has been developed to detect and
measure sub-pixel movement between optical
images. In this technique errors due to the
imaging system are calibrated and modeled.
Topographic artifacts are characterized and
solutions are proposed to compensate or to
filter them. The technique has been tested and
successfully applied in a number of
applications by using high and medium
resolution data (Avouac et al., 2006; Barisin
et al., 2009; Binet and Bollinger, 2005;
Dominguez et al., 2003; Herman et al., 2011;
Konca et al., 2010; Necsoiu et al., 2009;
Scherler et al., 2008). In most of the analyzed
cases the co-registration accuracy measured
was in the order of 1/50 to 1/20 of the pixel
size (Leprince et al., 2007)
3.3. Correlation
The correlation process was
performed by using the Cosi-Corr (Co-
registration of Optically Sensed Images and
Correlation) software. The pre- and post-
event green band with 2m spatial resolution
captured at 1° apart off nadir sun angle were
used for sub- pixel correlation process.
Horizontal displacements were measured by
using frequential coorelator method with
multi-scale approach where the initial
correlation window size was kept at 32 pixels
(64m) and final window size as 4 pixels (8m).
The step size was set to 2 pixels with 3
iterations. The sub-pixel correlation was
calculated in the east-west, and north–south
components of the surface horizontal
displacement field. In order to correlate the
two pre-and post-event images which were
not co-registered accurately the output
gridded option was deselected. To discard any
potential outliers, values with an SNR lower
than 0.9, were eliminated. A destriping of the
displacement field was executed to suppress
attitude residuals produced by undulations of
the observing platforms (Leprince et al., 2007;
Scherler et al., 2008).
Table 3. Effective band width of WV2.
No Band name Effective bandwidth (µm)
1 Coastal 4.730000 x 10-02
2 Blue 5.430000 x 10-02
3 Green 6.300000 x 10-02
4 Yellow 3.740000 x 10-02
5 Red 5.740000 x 10-02
6 Red Edge 3.930000 x 10-02
7 NIR1 9.890000 x 10-02
8 NIR2 9.960000 x 10-02
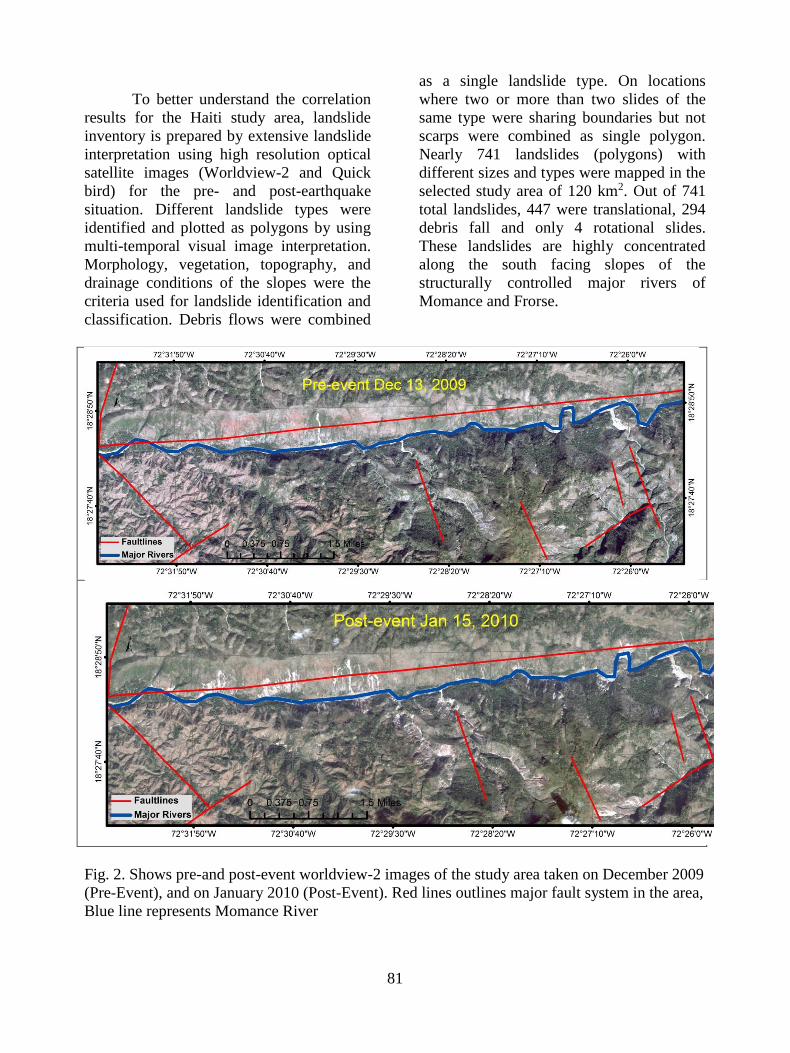
Satellite image data of the selected
study site of Haiti encompassed eleven
separate image tiles in standard WV2 tiff
file format. Supporting data also included a
metadata file. The eleven images (Figure 2)
were combined to make a single three band
image by the mosaic functionality of ENVI
(ITT VIS, 2011).
3.4. Landslide inventory preparation
Page 8
81
To better understand the correlation
results for the Haiti study area, landslide
inventory is prepared by extensive landslide
interpretation using high resolution optical
satellite images (Worldview-2 and Quick
bird) for the pre- and post-earthquake
situation. Different landslide types were
identified and plotted as polygons by using
multi-temporal visual image interpretation.
Morphology, vegetation, topography, and
drainage conditions of the slopes were the
criteria used for landslide identification and
classification. Debris flows were combined
as a single landslide type. On locations
where two or more than two slides of the
same type were sharing boundaries but not
scarps were combined as single polygon.
Nearly 741 landslides (polygons) with
different sizes and types were mapped in the
selected study area of 120 km2. Out of 741
total landslides, 447 were translational, 294
debris fall and only 4 rotational slides.
These landslides are highly concentrated
along the south facing slopes of the
structurally controlled major rivers of
Momance and Frorse.
Fig. 2. Shows pre-and post-event worldview-2 images of the study area taken on December 2009
(Pre-Event), and on January 2010 (Post-Event). Red lines outlines major fault system in the area,
Blue line represents Momance River
Page 9
82
Fig. 3. East-west ground displacement field measured from the cross-correlation worldview-2
images with de-correlated pixels in black. The ground displacement field measured from the
correlation of pre- and post-event images reveals high displacement values and decorrelation
patches inside the cloud areas. Majority of the area shows no displacement (inside the yellow
range of values near to zero displacement).
4. Results and discussion
4.1. Correlation Results
This process produced two correlation
images, demonstrating the east–west and
north–south horizontal components of the
ground displacement field (Fig. 3). The offset
is measured in meters. The final spatial
resolution of the displacement measurement
maps is 6m. The high displacement values
that we assume are landslides corresponding
very well to the location of the mapped
landslides.
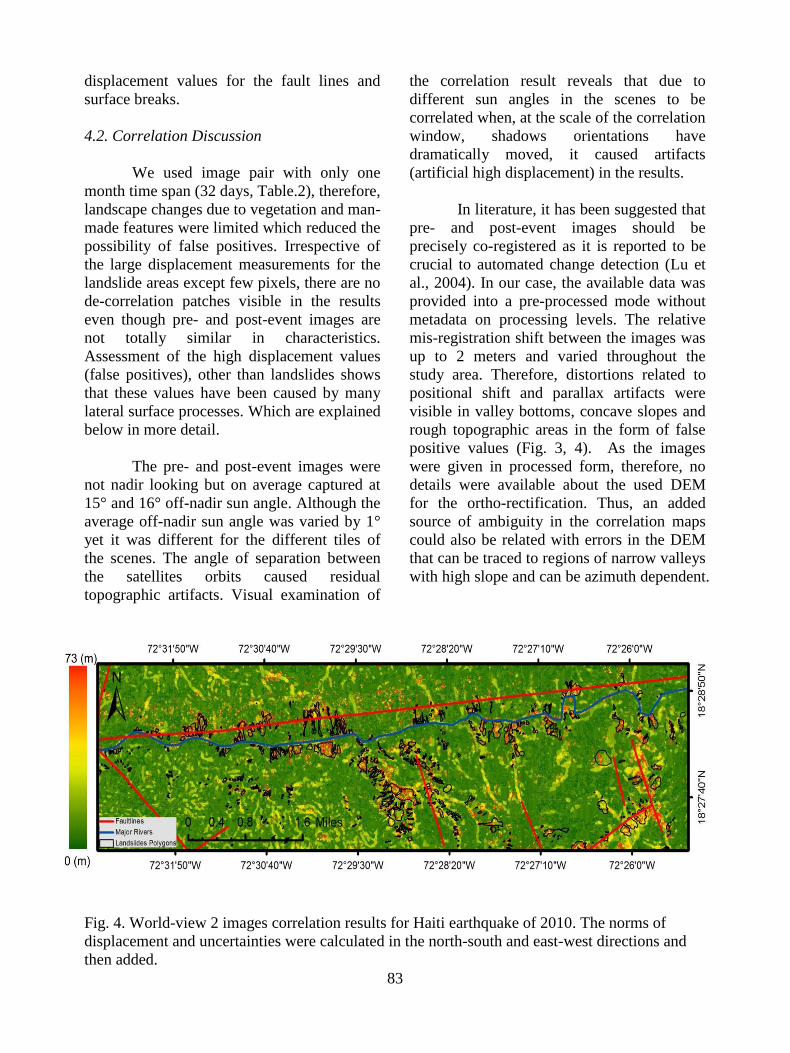
Euclidean norm values were
calculated by combining the displacement
maps for the components of motion in the N‐S and E‐W directions (Fig.4 ).
The ground displacement field
measured from the correlation indicates high
displacement values which agrees very well
with the mapped landslide polygons triggered
by 2010 Haiti earthquake. However, the high
displacement values mostly outspread the
landslide boundaries as during the correlation
process half of the correlation window is
inside the landslide body with totally changed
characteristics due to the seismic activity
while the other half is outside landslide
boundary where things could be recognized
but not adequate enough to close the
correlation for those parts. The large
displacement values mostly coincide with the
head or scarp and toe (depositional zones)
areas of the landslides with few high
displacement values in the center of the
landslide bodies (Fig. 4). It also shows high
Page 10
83
displacement values for the fault lines and
surface breaks.
4.2. Correlation Discussion
We used image pair with only one
month time span (32 days, Table.2), therefore,
landscape changes due to vegetation and man-
made features were limited which reduced the
possibility of false positives. Irrespective of
the large displacement measurements for the
landslide areas except few pixels, there are no
de-correlation patches visible in the results
even though pre- and post-event images are
not totally similar in characteristics.
Assessment of the high displacement values
(false positives), other than landslides shows
that these values have been caused by many
lateral surface processes. Which are explained
below in more detail.
The pre- and post-event images were
not nadir looking but on average captured at
15° and 16° off-nadir sun angle. Although the
average off-nadir sun angle was varied by 1°
yet it was different for the different tiles of
the scenes. The angle of separation between
the satellites orbits caused residual
topographic artifacts. Visual examination of
the correlation result reveals that due to
different sun angles in the scenes to be
correlated when, at the scale of the correlation
window, shadows orientations have
dramatically moved, it caused artifacts
(artificial high displacement) in the results.
In literature, it has been suggested that
pre- and post-event images should be
precisely co-registered as it is reported to be
crucial to automated change detection (Lu et
al., 2004). In our case, the available data was
provided into a pre-processed mode without
metadata on processing levels. The relative
mis-registration shift between the images was
up to 2 meters and varied throughout the
study area. Therefore, distortions related to
positional shift and parallax artifacts were
visible in valley bottoms, concave slopes and
rough topographic areas in the form of false
positive values (Fig. 3, 4). As the images
were given in processed form, therefore, no
details were available about the used DEM
for the ortho-rectification. Thus, an added
source of ambiguity in the correlation maps
could also be related with errors in the DEM
that can be traced to regions of narrow valleys
with high slope and can be azimuth dependent.
Fig. 4. World-view 2 images correlation results for Haiti earthquake of 2010. The norms of
displacement and uncertainties were calculated in the north-south and east-west directions and
then added.
Page 11
84
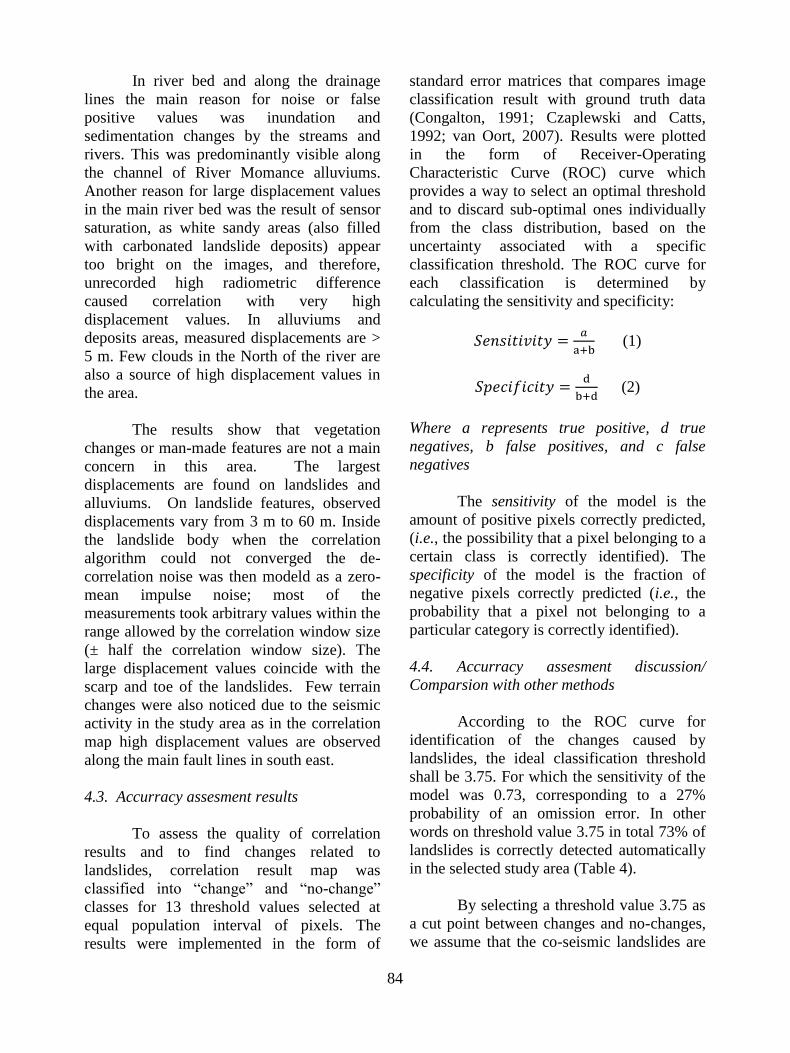
In river bed and along the drainage
lines the main reason for noise or false
positive values was inundation and
sedimentation changes by the streams and
rivers. This was predominantly visible along
the channel of River Momance alluviums.
Another reason for large displacement values
in the main river bed was the result of sensor
saturation, as white sandy areas (also filled
with carbonated landslide deposits) appear
too bright on the images, and therefore,
unrecorded high radiometric difference
caused correlation with very high
displacement values. In alluviums and
deposits areas, measured displacements are >
5 m. Few clouds in the North of the river are
also a source of high displacement values in
the area.
The results show that vegetation
changes or man-made features are not a main
concern in this area. The largest
displacements are found on landslides and
alluviums. On landslide features, observed
displacements vary from 3 m to 60 m. Inside
the landslide body when the correlation
algorithm could not converged the de-
correlation noise was then modeld as a zero-
mean impulse noise; most of the
measurements took arbitrary values within the
range allowed by the correlation window size
(± half the correlation window size). The
large displacement values coincide with the
scarp and toe of the landslides. Few terrain
changes were also noticed due to the seismic
activity in the study area as in the correlation
map high displacement values are observed
along the main fault lines in south east.
4.3. Accurracy assesment results
To assess the quality of correlation
results and to find changes related to
landslides, correlation result map was
classified into “change” and “no-change”
classes for 13 threshold values selected at
equal population interval of pixels. The
results were implemented in the form of
standard error matrices that compares image
classification result with ground truth data
(Congalton, 1991; Czaplewski and Catts,
1992; van Oort, 2007). Results were plotted
in the form of Receiver-Operating
Characteristic Curve (ROC) curve which
provides a way to select an optimal threshold
and to discard sub-optimal ones individually
from the class distribution, based on the
uncertainty associated with a specific
classification threshold. The ROC curve for
each classification is determined by
calculating the sensitivity and specificity:
𝑆𝑒𝑛𝑠𝑖𝑡𝑖𝑣𝑖𝑡𝑦 =𝑎
a+b (1)
𝑆𝑝𝑒𝑐𝑖𝑓𝑖𝑐𝑖𝑡𝑦 =d
b+d (2)
Where a represents true positive, d true
negatives, b false positives, and c false
negatives
The sensitivity of the model is the
amount of positive pixels correctly predicted,
(i.e., the possibility that a pixel belonging to a
certain class is correctly identified). The
specificity of the model is the fraction of
negative pixels correctly predicted (i.e., the
probability that a pixel not belonging to a
particular category is correctly identified).
4.4. Accurracy assesment discussion/
Comparsion with other methods
According to the ROC curve for
identification of the changes caused by
landslides, the ideal classification threshold
shall be 3.75. For which the sensitivity of the
model was 0.73, corresponding to a 27%
probability of an omission error. In other
words on threshold value 3.75 in total 73% of
landslides is correctly detected automatically
in the selected study area (Table 4).
By selecting a threshold value 3.75 as
a cut point between changes and no-changes,
we assume that the co-seismic landslides are
Page 12
85
the only cause for the changes on the land
surfaces. Alterations occurred due to other
reasons, including e.g. phenological
disparities, agronomic practices and
construction, introduce noise which has been
addressed in this paper.
One limitation of this method of co-
seismic landslides identification is that it does
not show any unique behavioral
characteristics for different types of landslides
so that they could be easily distinguished or
classified. This is a limitation, only if the
event-inventory is produced for susceptibility,
hazard, or risk assessment studies. But, then
again in an active circumstance when a
disaster struck, fast production of an
inventory of co-seismic landslides is more
significant than making of a comprehensive
inventory that involves great cost and much
time to be consumed. As an alternate, a semi-
automatic object based image processing
technique could be implemented to detect co-
seismic landslides and the sub-types. The
OBIA techniques will exploit information
extracted from the satellite images and DEMs
(Barlow et al., 2006; Martha et al., 2010), but
then it will involve extra time and precise
expertise to create and tune an appropriate
rules set of criteria. Furthermore, object based
techniques for landslide detection could not
be used for the preparation of event based
landslide inventory as OBIA have a tendency
to fail when both old and newly triggered
landslides are present in the area (Ping et al.,
2011).
Fig. 5. Receiver-Operating Characteristic Curve (ROC) analysis of the displacement values to
observe the shift between true positive and false positive values on each threshold.
Table 4. Accurracy assesment result at threshold value 3.75.
Classification results
slide No-slide Total
Gro
un
d T
ruth
data
Area in pixels
(1pix=6m*6m)
% Area in pixels
(1pix=6m*6m)
% Area in pixels
( 1pix=6m*6m)
%
slide 66176 73.26% 426985 30.89% 493161 33.48%
No-
slide
24158 26.74% 955509 69.11% 979667 66.52%
Total 90334 100% 1382494 100% 1472828 100%
01.331.742.05
2.332.63
3.01213.75
4.93
6.68
9.52
18.33
62
0
0.1
0.2
0.3
0.4
0.5
0.6
0.7
0.8
0.9
1
0 0.2 0.4 0.6 0.8 1
Tru
e P
osi
tive
Rat
e
(Sen
siti
vit
y)
False Positive Rate (1-Specificity)
Page 13
86
4.5. Velocity vectors behavior in different
types of landslides
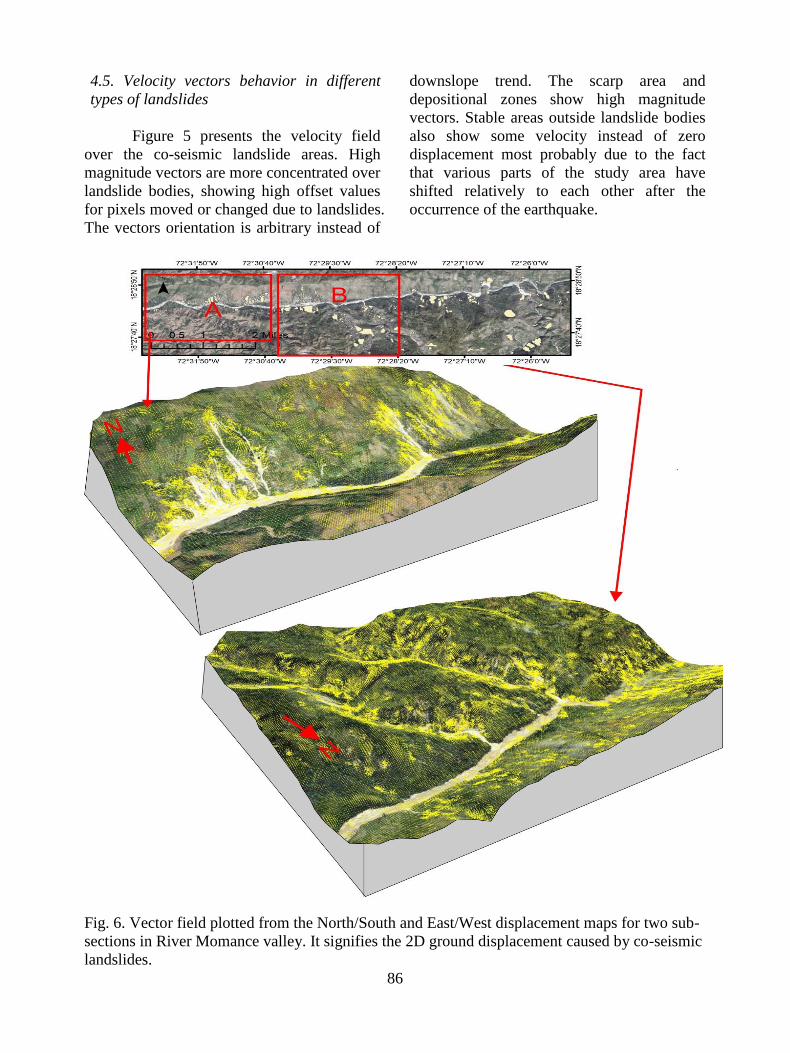
Figure 5 presents the velocity field
over the co-seismic landslide areas. High
magnitude vectors are more concentrated over
landslide bodies, showing high offset values
for pixels moved or changed due to landslides.
The vectors orientation is arbitrary instead of
downslope trend. The scarp area and
depositional zones show high magnitude
vectors. Stable areas outside landslide bodies
also show some velocity instead of zero
displacement most probably due to the fact
that various parts of the study area have
shifted relatively to each other after the
occurrence of the earthquake.
Fig. 6. Vector field plotted from the North/South and East/West displacement maps for two sub-
sections in River Momance valley. It signifies the 2D ground displacement caused by co-seismic
landslides.
Page 14
87
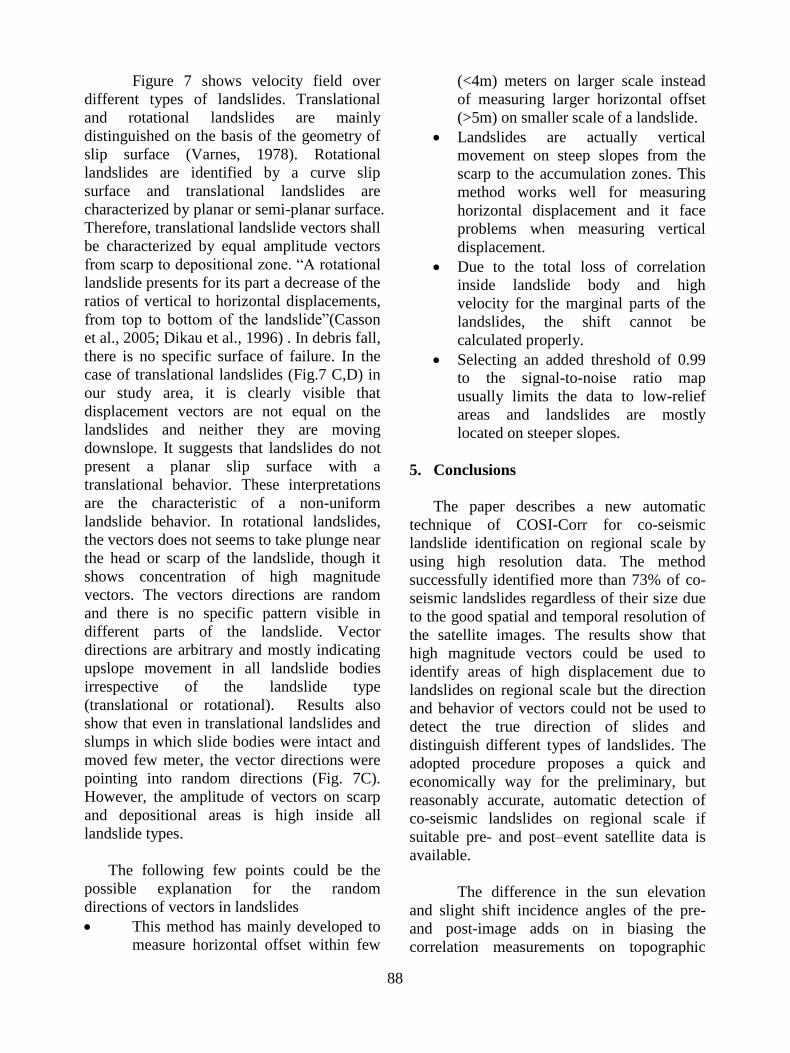
Fig. 7. Magnitude and direction of vectors in different types of landslides
Page 15
88
Figure 7 shows velocity field over
different types of landslides. Translational
and rotational landslides are mainly
distinguished on the basis of the geometry of
slip surface (Varnes, 1978). Rotational
landslides are identified by a curve slip
surface and translational landslides are
characterized by planar or semi-planar surface.
Therefore, translational landslide vectors shall
be characterized by equal amplitude vectors
from scarp to depositional zone. “A rotational
landslide presents for its part a decrease of the
ratios of vertical to horizontal displacements,
from top to bottom of the landslide”(Casson
et al., 2005; Dikau et al., 1996) . In debris fall,
there is no specific surface of failure. In the
case of translational landslides (Fig.7 C,D) in
our study area, it is clearly visible that
displacement vectors are not equal on the
landslides and neither they are moving
downslope. It suggests that landslides do not
present a planar slip surface with a
translational behavior. These interpretations
are the characteristic of a non-uniform
landslide behavior. In rotational landslides,
the vectors does not seems to take plunge near
the head or scarp of the landslide, though it
shows concentration of high magnitude
vectors. The vectors directions are random
and there is no specific pattern visible in
different parts of the landslide. Vector
directions are arbitrary and mostly indicating
upslope movement in all landslide bodies
irrespective of the landslide type
(translational or rotational). Results also
show that even in translational landslides and
slumps in which slide bodies were intact and
moved few meter, the vector directions were
pointing into random directions (Fig. 7C).
However, the amplitude of vectors on scarp
and depositional areas is high inside all
landslide types.
The following few points could be the
possible explanation for the random
directions of vectors in landslides
This method has mainly developed to
measure horizontal offset within few
(<4m) meters on larger scale instead
of measuring larger horizontal offset
(>5m) on smaller scale of a landslide.
Landslides are actually vertical
movement on steep slopes from the
scarp to the accumulation zones. This
method works well for measuring
horizontal displacement and it face
problems when measuring vertical
displacement.
Due to the total loss of correlation
inside landslide body and high
velocity for the marginal parts of the
landslides, the shift cannot be
calculated properly.
Selecting an added threshold of 0.99
to the signal-to-noise ratio map
usually limits the data to low-relief
areas and landslides are mostly
located on steeper slopes.
5. Conclusions
The paper describes a new automatic
technique of COSI-Corr for co-seismic
landslide identification on regional scale by
using high resolution data. The method
successfully identified more than 73% of co-
seismic landslides regardless of their size due
to the good spatial and temporal resolution of
the satellite images. The results show that
high magnitude vectors could be used to
identify areas of high displacement due to
landslides on regional scale but the direction
and behavior of vectors could not be used to
detect the true direction of slides and
distinguish different types of landslides. The
adopted procedure proposes a quick and
economically way for the preliminary, but
reasonably accurate, automatic detection of
co-seismic landslides on regional scale if
suitable pre- and post–event satellite data is
available.
The difference in the sun elevation
and slight shift incidence angles of the pre-
and post-image adds on in biasing the
correlation measurements on topographic
Page 16
89
features by showing high false positive values.
The results could be further improved by
using correctly ortho-rectified and accurately
co-registered nadir looking images.
Auhors contrributions
Sumbal Bahar Saba created the data,
performed image processing and prepared
the manuscript. Muhammad Ali assisted in
image processing and provided valuable
suggestions to improve the manuscript. Mark
van der Meijde and Harald van der Werff
contributed to the concept design and
improvement of the manuscript.
References
Avouac, J.-P., Ayoub, F., Leprince, S., Konca,
O., Helmberger, D. V., 2006. The
2005, Mw 7.6 Kashmir earthquake:
Sub-pixel correlation of ASTER
images and seismic waveforms
analysis: Earth and Planetary Science
Letters, 249 (3-4), 514-528.
Ayoub, F., Leprince, S., Binet, R., Lewis, K.
W., Aharonson, O., Avouac, J. P.
Influence of camera distortions on
satellite image registration and change
detection applications, in Proceedings
Geoscience and Remote Sensing
Symposium, 2008. IGARSS 2008.
IEEE International 7-11 July 2008, 2,
p. II-1072-II-1075.
Barisin, I., Leprince, S., Parsons, B., Wright,
T., 2009. Surface displacements in the
September 2005 Afar rifting event
from satellite image matching:
Asymmetric uplift and faulting:
Geophys. Res. Lett., 36 (7), p. L07301.
Barlow, J., Franklin, S., Martin, Y., 2006.
High spatial resolution satellite
imagery, DEM derivatives, and image
segmentation for the detection of mass
wasting processes: Photogrammetric
Engineering & Remote Sensing, 72
(6), p. 687-692.
Barlow, J., Martin, Y., Franklin, S. E., 2003.
Detecting translational landslide scars
using segmentation of Landsat ETM+
and DEM data in the northern Cascade
Mountains, British Columbia:
Canadian Journal of Remote Sensing,
29, 4, p. 510-517.
Binet, R., Bollinger, L., 2005. Horizontal
coseismic deformation of the 2003
Bam (Iran) earthquake measured from
SPOT-5 THR satellite imagery:
Geophys. Res. Lett., 32 (2) p. L02307.
Blaschke, T., 2010. Object based image
analysis for remote sensing: ISPRS
Journal of Photogrammetry and
Remote Sensing, v. 65 (1) p. 2-16.
Borghuis, A. M., Chang, K., Lee, H. Y., 2007.
Comparison between automated and
manual mapping of typhoon‐triggered
landslides from SPOT‐5 imagery:
International Journal of Remote
Sensing, 28 (8), p. 1843-1856.
Casson, B., Delacourt, C., Allemand, P., 2005.
Contribution of multi-temporal remote
sensing images to characterize
landslide slip surface – Application to
the La Clapi`ere landslide (France):
Natural Hazards and Earth System
Sciences, 5, p. 425-437.
Cheng, K. S., Wei, C., and Chang, S. C., 2004.
Locating landslides using multi-
temporal satellite images: Advances in
Space Research, 33 (3) p. 296-301.
Congalton, R. G., 1991. A review of assessing
the accuracy of classifications of
remotely sensed data: Remote Sensing
of Environment, 37 (1), p. 35-46.
Czaplewski, R. L., Catts, G. P., 1992.
Calibration of remotely sensed
proportion or area estimates for
misclassification error: Remote
Sensing of Environment, 39 (1), p. 29-
43.
Delacourt, C., Allemand, P., Casson, B.,
Vadon, H., 2004. Velocity field of the
“La Clapière”
landslide measured by the correlation
of aerial and QuickBird satellite
images: Geophys. Res. Lett., 31 (15),
p. L15619.
Page 17
90
Dikau, R., Brunsden, D., Schrott, L., Ibsen,
M.-L., 1996. Landslide Recognition.
Identification, Movement and Courses,
Chichester, etc., Wiley & Sons, 251 p.:
Dominguez, S., Avouac, J.-P., Michel, R.,
2003. Horizontal coseismic
deformation of the 1999 Chi-Chi
earthquake measured from SPOT
satellite images: Implications for the
seismic cycle along the western
foothills of central Taiwan: J.
Geophys. Res., 108 (B2), p. 2083.
Eberhard, M. O., Baldridge, S. B., Marshall,
J., Mooney, W., Rix, G. J., 2010. The
MW 7.0 Haiti Earthquake of January
12, 2010: USGS/EERI Advance
Reconnaissance Team Report. US
Geological Survey Open-File Report,
2010: p.–1048.
Ellen, R., Jeff, B., Brady, C., Jim, F., Russell,
G., Scott, O., Glenn, R., Donald, W.,
Oscar, S., 2010. Geotechnical
Engineering Reconnaissance of the
2010 Haiti Earthquake.
Guzzetti, F., Cardinali, M., Reichenbach, P.,
Cipolla, F., Sebastiani, C., Galli, M.,
Salvati, P., 2004, Landslides triggered
by the 23 November 2000 rainfall
event in the Imperia Province,
Western Liguria, Italy: Engineering
Geology, 73 (3-4), p. 229-245.
Guzzetti, F., Reichenbach, P., Ardizzone, F.,
Cardinali, M., Galli, M., 2006.
Estimating the quality of landslide
susceptibility models: Geomorphology,
81 (1-2), p. 166-184.
Haeberlin, Y., Turberg, P., Retière, A.,
Senegas, O., Parriaux, A. Validation
of SPOT-5 satellite imagery for
Geological Hazard Identification and
Risk Assesment for landslides,Mud
and Debris Flows in MataGalpa,
Nicaragua, in Proceedings
Proceedings of the XXth ISPRS
Congress,, Istanbul, Turkey, 2004.
Herman, F., Anderson, B., Leprince, S., 2011.
Mountain glacier velocity variation
during a retreat/advance cycle
quantified using sub-pixel analysis of
ASTER images: Journal of Glaciology,
57, p. 197-207.
Hervás, J., Barredo, J. I., Rosin, P. L., Pasuto,
A., Mantovani, F., Silvano, S., 2003.
Monitoring landslides from optical
remotely sensed imagery: the case
history of Tessina landslide, Italy:
Geomorphology, 54 (1-2), p. 63-75.
Khairunniza-Bejo, S., Petrou, M., Ganas, A.,
2010. Local similarity measure for
landslide detection and identification
in comparison with the image
differencing method: International
Journal of Remote Sensing, 31 (23), p.
6033-6045.
Koehler, R. D., Mann, P., 2011. Field
observations from the January 12,
2010, Haiti earthquake : implications
for seismic hazards and future post-
earthquake reconnaissance
investigations in Alaska, Fairbanks,
Alaska, State of Alaska, Dept. of
Natural Resources, Division of
Geological & Geophysical Surveys.
Konca, A. O., Leprince, S., Avouac, J.-P.,
Helmberger, D. V., 2010. Rupture
Process of the 1999 Mw 7.1 Duzce
Earthquake from Joint Analysis of
SPOT, GPS, InSAR, Strong-Motion,
and Teleseismic Data: A Supershear
Rupture with Variable Rupture
Velocity: Bulletin of the
Seismological Society of America,
100 (1), p. 267-288.
Lee, S., Lee, M.-J., 2006. Detecting landslide
location using KOMPSAT 1 and its
application to landslide-susceptibility
mapping at the Gangneung area,
Korea: Advances in Space Research,
38 (10), p. 2261-2271.
Leprince, S., Barbot, S., Ayoub, F., Avouac, J.
P., 2007. Automatic and Precise
Orthorectification, Coregistration, and
Subpixel Correlation of Satellite
Images, Application to Ground
Deformation Measurements:
Geoscience and Remote Sensing,
Page 18
91
IEEE Transactions on, v. 45 (6), p.
1529-1558.
Lin, M. L., Wang, K. L., Huang, J. J., 2005.
Debris flow run off simulation and
verification – case study of Chen-
You-Lan Watershed, Taiwan: Natural
Hazards and Earth System Sciences, 5,
p. 439-445.
Lin, P.-S., Lin, J.-Y., Hung, J.-C., Yang, M.-
D., 2002. Assessing debris-flow
hazard in a watershed in Taiwan:
Engineering Geology, 66 (3-4), p.
295-313.
Mantovani, F., Soeters, R., van Westen, C. J.,
1996. Remote sensing techniques for
landslide studies and hazard zonation
in Europe: Geomorphology, 15 (3-4),
p. 213-225.
Martha, T. R., Kerle, N., Jetten, V., van
Westen, C. J., Kumar, K. V., 2010.
Characterising spectral, spatial and
morphometric properties of landslides
for semi-automatic detection using
object-oriented methods:
Geomorphology, 116 (1-2), p. 24-36.
Martin, Y. E., Franklin, S. E., 2005.
Classification of soil‐ and bedrock‐dominated landslides in British
Columbia using segmentation of
satellite imagery and DEM data:
International Journal of Remote
Sensing, 26 (7), p. 1505-1509.
Metternicht, G., Hurni, L., Gogu, R., 2005.
Remote sensing of landslides: An
analysis of the potential contribution
to geo-spatial systems for hazard
assessment in mountainous
environments: Remote Sensing of
Environment, 98 (2-3), p. 284-303.
Moine, M., Puissant, A., Malet, J., Philippe.
Detection of landslides from aerial
and satellite images with a semi-
automatic method. Application to the
Barcelonnette basin (Alpes-de-Haute-
Provence, France, in Proceedings
Landslide Processes: from
geomorphological mapping to
dynamic modellin, Strasbourg, France
2009, p. 63-68.
Mondini, A. C., Guzzetti, F., Reichenbach, P.,
Rossi, M., Cardinali, M., Ardizzone,
F., 2011. Semi-automatic recognition
and mapping of rainfall induced
shallow landslides using optical
satellite images: Remote Sensing of
Environment, 115 (7), p. 1743-1757.
Necsoiu, M., Leprince, S., Hooper, D. M.,
Dinwiddie, C. L., McGinnis, R. N.,
Walter, G. R., 2009, Monitoring
migration rates of an active subarctic
dune field using optical imagery:
Remote Sensing of Environment, 113,
(11), p. 2441-2447.
Nichol, J., Wong, M. S., 2005. Satellite
remote sensing for detailed landslide
inventories using change detection and
image fusion: International Journal of
Remote Sensing, 26 (9), p. 1913 -
1926.
Park, N. W., Chi, K. H., 2008. Quantitative
assessment of landslide susceptibility
using high‐resolution remote sensing
data and a generalized additive model:
International Journal of Remote
Sensing, 29 (1), p. 247-264.
Parker, R. N., Densmore, A. L., Rosser, N. J.,
de Michele, M., Li, Y., Huang, R.,
Whadcoat, S., Petley, D. N., 2011.
Mass wasting triggered by the 2008
Wenchuan earthquake is greater than
orogenic growth: Nature Geosci, 4 (7),
p. 449-452.
Ping, L., Stumpf, A., Kerle, N., Casagli, N.,
2011. Object-Oriented Change
Detection for Landslide Rapid
Mapping: Geoscience and Remote
Sensing Letters, IEEE, 8 (4), p. 701-
705.
Rossi, M., Guzzetti, F., Reichenbach, P.,
Mondini, A. C., Peruccacci, S., 2010.
Optimal landslide susceptibility
zonation based on multiple forecasts:
Geomorphology, 114, (3), p. 129-142.
Scherler, D., Leprince, S., Strecker, M. R.,
2008. Glacier-surface velocities in
Page 19
92
alpine terrain from optical satellite
imagery--Accuracy improvement and
quality assessment: Remote Sensing
of Environment, 112 (10), p. 3806-
3819.
Singhroy, V., 2002. The use of earth
Observing Satellites for Hazard
Support:Assesment and Scenarios,
Final report of the CEOS Disaster
Management Support Group.
Stumpf, A., Kerle, N., 2011. Object-oriented
mapping of landslides using Random
Forests: Remote Sensing of
Environment, 115 (10), p. 2564-2577.
Tang, C.-J., Dai, M. R., 2010. Using Data
from an AMI-Associated Sensor
Network for Mudslide Areas
Identification, in Nguyen, N. T., Le,
M. T., Świątek, J., eds., Intelligent
Information and Database Systems:
Second International Conference,
ACIIDS, Hue City, Vietnam, March
24-26, 2010. Proceedings, Part I:
Berlin, Heidelberg, Springer Berlin
Heidelberg, p. 380-389.
Tsai, F., Hwang, J. H., Chen, L. C., Lin, T. H.,
2010. Post-disaster assessment of
landslides in southern Taiwan after
2009 Typhoon Morakot using remote
sensing and spatial analysis: Nat.
Hazards Earth Syst. Sci., 10 (10), p.
2179-2190.
van Oort, P. A. J., 2007. Interpreting the
change detection error matrix: Remote
Sensing of Environment, 108 (1), p. 1-
8.
Varnes, D. J., 1978. Slope movements types
and processes, in Schuster, R. L., and
Krizek, R. L., eds., Special Report 176
on Landslides: Analysis and Control:
Washington, D.C., Transportation
Research Board, National Academy of
Sciences, p. 11-33.
Vermeesch, P., and Drake, N., 2008.
Remotely sensed dune celerity and
sand flux measurements of the world's
fastest barchans (Bodélé, Chad):
Geophys. Res. Lett., 35 (24), p.
L24404.
Weirich, F., and Blesius, L., 2007.
Comparison of satellite and air photo
based landslide susceptibility maps:
Geomorphology, 87 (4), p. 352-364.
Yamaguchi, Y., Tanaka, S., Odajima, T.,
Kamai, T.,Tsuchida, S., 2003.
Detection of a landslide movement as
geometric misregistration in image
matching of SPOT HRV data of two
different dates: International Journal
of Remote Sensing, 24 (18), p. 3523 -
3534.
Zhou, C. H., Lee, C. F., Li, J., Xu, Z. W.,
2002. On the spatial relationship
between landslides and causative
factors on Lantau Island, Hong Kong:
Geomorphology, 43 (3-4), p. 197-207.