31 COCA-COLA AMATIL About Coca-Cola Amatil C oca-Cola Amatil (CCA) is one of the largest bottlers of non-alcoholic, ready-to-drink beverages in the Asia Pacific region and a top-10 global Coca-Cola bottler. It has almost 14,000 employees with access to more than 270 million consumers and more than 700,000 active customers. CCA has operations in Australia, New Zealand, Fiji, Indonesia, Papua New Guinea and Samoa. Ownership CCA has been listed on the ASX since January 1970. CCA is a top 50 ASX listed company. The Coca-Cola Company has a 29% shareholding. Liquidity position As at June 30 2014 CCA had available liquidity of A$1.1 billion, comprising cash at bank and on deposit. The high levels of cash are largely due to prefunding of debt maturities with average deposit rates earning interest income in excess of their related borrowing costs. Debt funding CCA had outstanding gross drawn debt of A$3.0 billion and net debt of A$1.9 billion as at June 30 2014. It has established a diversified debt portfolio through the establishment of AMTN, NZMTN and EMTN programmes, as well as having outstanding issues in the 144A and US private placement markets. CCA has a policy of maintaining its weighted average debt maturity profile of 3-5 years – 4.0 years as at June 30 2014 – and having cash or undrawn bank facilities to cover debt maturing within the next 12 months. All debt facilities are unsecured and operate under a negative pledge and cross default. FOR FURTHER INFORMATION PLEASE CONTACT: Keith Allan Treasurer [email protected]www.ccamatil.com KEY CREDIT METRICS CREDIT RATING BBB+/A3 (S&P/Moody’s) BOND PROTECTION Contains no financial covenants WEIGHTED AVERAGE DEBT MATURITY 4.0 years (as at June 30 2014) KEY DATA FINANCIAL YEAR END 31 DEC BLOOMBERG TICKER CCLAU ASX CODE CCL KEY FINANCIALS HY14 FY13 HY13 FY12 MARKET CAPITALISATION (A$M) 7,224 9,186 9,682 10,205 TRADING REVENUES (A$M) 2,336.2 5036.4 2,323.6 5,097.4 EBIT (BEFORE SIGNIFICANT ITEMS) (A$M) 316.7 833.3 373.9 894.7 NET PROFIT AFTER TAX (BEFORE SIGNIFICANT ITEMS) (A$M) 182.3 502.8 225.1 556.3 EBIT INTEREST COVER (X) 5.2 6.7 6.1 7.8 SHARE PRICE (FY/HY END) (A$) 9.46 12.03 12.68 13.39 OUTSTANDING BONDS ISSUE DATE VOLUME (M) MATURITY FORMAT AUD (DOMESTIC) Nov 12 150 Nov 19 Fixed NZD (DOMESTIC) Aug 11 50 Aug 18 FRN AUD (USPP) Jul 05 3 Jan 15 FRN Jul 05 200 Jul 15 FRN Jun 06 158 Jun 16 FRN Jul 05 32 Jul 17 FRN Jun 06 72 Jun 18 FRN Jul 05 10 Jan 19 FRN USD (USPP) Mar 04 175 Mar 16 Fixed Apr 04 100 Apr 16 Fixed Sep 11 50 Sep 23 USD (144A) Nov 09 400 Nov 14 Fixed AUD (EMTN) Feb 12 250 Feb 17 Fixed Feb 13 100 Feb 18 Fixed Sep 12 200 Sep 18 Fixed Jun 13 205 Jun 20 Fixed Nov 13 100 Nov 20 Fixed May 14 100 May 21 Fixed Jul 11 45 Jul 21 Fixed Sep 11 30 Sep 21 Fixed Jul 12 30 Jul 22 Fixed JPY (EMTN) Aug 06 3,000 Aug 21 Fixed Jun 06 10,000 Jun 36 Fixed SOURCE: COCA-COLA AMATIL JUNE 30 2014 Sally Loane Director of Media & Public Affairs [email protected]DEBT MATURITY PROFILE USPP EMTN USD (144A) NZD (domestic) AUD (domestic) Bank debt VOLUME (A$M) 600 500 400 300 200 100 0 FY14 FY15 FY16 FY17 FY18 FY19 FY20 FY21 FY22 FY23+ 150 445 202 525 250 32 300 72 9 305 309 118 51 77 70 45 30
Transcript
3 1
COCA-COLA AMATIL
About Coca-Cola Amatil
C oca-Cola Amatil (CCA) is one of the largest bottlers of non-alcoholic, ready-to-drink beverages in the Asia Pacific region and a top-10 global Coca-Cola bottler. It has almost 14,000 employees with access to more than 270 million consumers and more than
700,000 active customers. CCA has operations in Australia, New Zealand, Fiji, Indonesia, Papua New Guinea and Samoa.
OwnershipCCA has been listed on the ASX since January 1970. CCA is a top 50 ASX listed company. The Coca-Cola Company has a 29% shareholding. Liquidity positionAs at June 30 2014 CCA had available liquidity of A$1.1 billion, comprising cash at bank and on deposit. The high levels of cash are largely due to prefunding of debt maturities with average deposit rates earning interest income in excess of their related borrowing costs.
Debt fundingCCA had outstanding gross drawn debt of A$3.0 billion and net debt of A$1.9 billion as at June 30 2014. It has established a diversified debt portfolio through the establishment of AMTN, NZMTN and EMTN programmes, as well as having outstanding issues in the 144A and US private placement markets.
CCA has a policy of maintaining its weighted average debt maturity profile of 3-5 years – 4.0 years as at June 30 2014 – and having cash or undrawn bank facilities to cover debt maturing within the next 12 months. All debt facilities are unsecured and operate under a negative pledge and cross default.
3 2 | A U S T R A L A S I A N C O R P O R A T E Y E A R B O O K : B R O U G H T T O Y O U B Y W E S T P A C I N S T I T U T I O N A L B A N K A N D K A N G A N E W S N O V E M B E R 2 0 1 4
ISSUERPROFILES
CONTACT ENERGY
About Contact Energy
C ontact Energy (Contact) is one of New Zealand’s leading electricity generators and energy retailers, providing electricity, natural gas and liquefied petroleum gas (LPG) to customers nationwide. Contact has around 22% of New Zealand’s retail
electricity market. Its diverse mix of power stations generate around a quarter of the country’s electricity from hydro, geothermal, gas and diesel. In addition, Contact has around 43% of the LPG market in New Zealand.
OwnershipContact is a public company, listed on the NZX as CEN since 1999. Contact is one of New Zealand’s largest listed companies. In 2004, Origin Energy (see p58) became Contact’s majority shareholder with a 51% stake. As at June 30 2014, Origin Energy’s stake was 53.1%.
Liquidity positionContact has NZ$600 million of committed bank facilities, of which NZ$377 million were undrawn at June 30 2014.
Debt fundingContact’s asset and revenue base means it is a good candidate for long-term funding solutions, evidenced by successfully refinancing of NZ$905 million of debt maturities in FY14. Net debt as at June 30 2014 was around NZ$1.4 billion. Contact has a diverse portfolio of funding sources, namely: US private placement (NZ$599 million equivalent), retail bond (NZ$222 million), bank facilities (NZ$600 million), wholesale bonds (NZ$200 million) and an export-credit-agency facility (NZ$97 million).
Contact’s borrowings are unsecured, except for finance leases. It borrows under a negative-pledge arrangement which prohibits it from granting any security interest over its assets unless it is an exception permitted within the arrangement.
D BP is the trading name of the privately owned group of entities which owns and operates the Dampier to Bunbury Natural Gas Pipeline (DBNGP) – the key gas-transmission pipeline in Western Australia (WA). The 1,530-kilometre mainline connects the extensive
offshore North West Shelf gas fields from Dampier with the population centres and industry in the south-west of the state through to Bunbury.
DBP’s core business is the operation, maintenance and expansion of the pipeline. Most revenue is derived through long-term contracted capacity of the pipeline to various large and dominant industrial and retail end users in WA.
The pipeline was commissioned in 1985 and has an estimated remaining economic life of at least 50 years. The asset has a strong safety and performance track record and the series of expansion projects under the ownership of DBP has ensured that the pipeline’s capacity remains aligned with the gas needs of the state of WA. The owners’ commitment to meeting the needs of customers in WA is ongoing.
DBP is required to operate the pipeline under an access arrangement approved by the Economic Regulatory Authority (ERA) of WA. The ERA is WA’s independent economic regulator. The access arrangement sets out the basis for accessing spare uncontracted capacity on the pipeline, including the terms and conditions of such access. To date, DBP has only expanded capacity on the DBNGP to meet contracted demand. Due to a recontracting with many of the DBNGP shippers announced on August 7 2014, 85% of the DBNGP full-haul capacity will be subject to long-term revenue streams outside of the ERA-determined regulatory tariff (out to December 31 2020).
OwnershipDBP’s shareholders are DUET Group (80%) and Alcoa of Australia (Alcoa) (20%). DUET Group is an ASX-listed owner
of energy utility assets in Australia. Alcoa operates the largest integrated bauxite mining and alumina refining operations in the world, comprising two bauxite mines and three alumina refineries in WA. The gas used to support these operations makes Alcoa the biggest single user of pipeline capacity on the DBNGP.
Liquidity positionDBP has stable and predictable operating cash flows that involve long-dated shipper contracts with creditworthy counterparties. As of June 30 2014, DBP had in place a A$20 million working-capital facility, A$28 million in cash at hand and A$35 million undrawn capacity in syndicated-debt facilities.
Debt fundingDBP’s finance arm is DBNGP Finance. In 2010, DBNGP Finance issued A$575 million of five-year domestic MTNs – its first-ever bond to come without a credit wrap, and a landmark domestic transaction for a triple-B minus credit. Subsequently, in November 2012 DBNGP Finance issued A$300 million of seven-year domestic MTNs.
KEY DATAFINANCIAL YEAR END 30 JUN
BLOOMBERG TICKER DUEAU
ASX CODE NOT LISTED
KEY FINANCIALS FY14 FY13 FY12
REVENUES (A$M) 428.8 449.1 457.2
EBITDA (A$M) 349.2 369.2 365.8
NET PROFIT AFTER TAX (A$M) 33.1 55.6 39.2
DEBT/EBITDA (X) (SENIOR) 7.25 6.84 6.88
NET DEBT/NET DEBT + EQUITY (%) 67.7 68.0 68.1
OUTSTANDING BONDS
ISSUE DATE VOLUME (M) MATURITY FORMAT COUPON (% OR BPs)
3 4 | A U S T R A L A S I A N C O R P O R A T E Y E A R B O O K : B R O U G H T T O Y O U B Y W E S T P A C I N S T I T U T I O N A L B A N K A N D K A N G A N E W S N O V E M B E R 2 0 1 4
ISSUERPROFILES
DEXUS PROPERTY GROUP
About DEXUS Property Group
D EXUS Property Group (DEXUS) is one of Australia’s leading real-estate groups, investing directly in high-quality Australian office and industrial properties. With over A$17.8 billion of funds under management, DEXUS also actively manages office,
industrial and retail properties located in key Australian markets on behalf of third-party capital partners. With more than 30 years of expertise in property investment, development and asset management, DEXUS has a proven track record in capital and risk management, providing service excellence to tenants and delivering superior risk-adjusted returns for investors.
OwnershipDEXUS is a top-50 entity by market capitalisation (A$6.0 billion as at June 30 2014) listed on the ASX under the stock market trading code DXS. It is supported by more than 32,000 investors from 20 countries.
Liquidity positionDEXUS targets earnings composition of 80-90% from core portfolio income, providing stable cash flows, and is focused on efficient management of working capital and cash. At June 30 2014, DEXUS had surplus liquidity of approximately A$500 million, consisting of undrawn committed facilities and cash. In addition to managing liquidity through a range of debt facilities, DEXUS maintains a distribution payout in line with free cash flow.
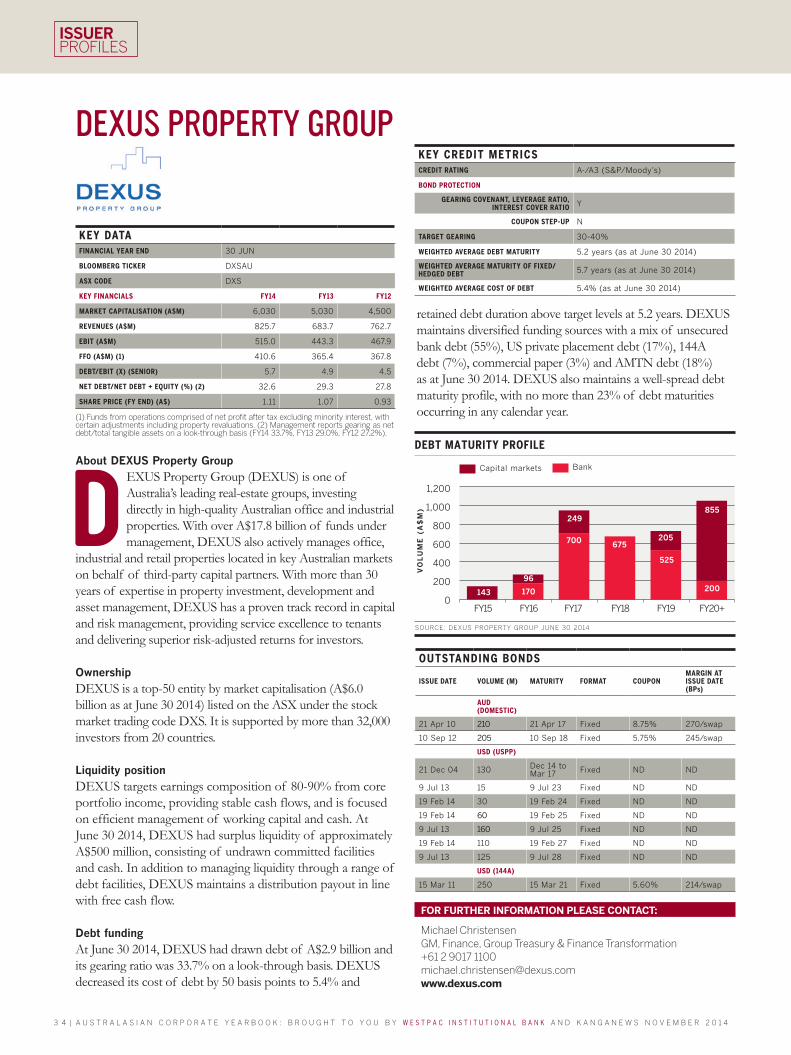
Debt fundingAt June 30 2014, DEXUS had drawn debt of A$2.9 billion and its gearing ratio was 33.7% on a look-through basis. DEXUS decreased its cost of debt by 50 basis points to 5.4% and
FOR FURTHER INFORMATION PLEASE CONTACT:
Michael ChristensenGM, Finance, Group Treasury & Finance Transformation+61 2 9017 [email protected]
GEARING COVENANT, LEVERAGE RATIO, INTEREST COVER RATIO Y
COUPON STEP-UP N
TARGET GEARING 30-40%
WEIGHTED AVERAGE DEBT MATURITY 5.2 years (as at June 30 2014)
WEIGHTED AVERAGE MATURITY OF FIXED/HEDGED DEBT 5.7 years (as at June 30 2014)
WEIGHTED AVERAGE COST OF DEBT 5.4% (as at June 30 2014)
KEY DATAFINANCIAL YEAR END 30 JUN
BLOOMBERG TICKER DXSAU
ASX CODE DXS
KEY FINANCIALS FY14 FY13 FY12
MARKET CAPITALISATION (A$M) 6,030 5,030 4,500
REVENUES (A$M) 825.7 683.7 762.7
EBIT (A$M) 515.0 443.3 467.9
FFO (A$M) (1) 410.6 365.4 367.8
DEBT/EBIT (X) (SENIOR) 5.7 4.9 4.5
NET DEBT/NET DEBT + EQUITY (%) (2) 32.6 29.3 27.8
SHARE PRICE (FY END) (A$) 1.11 1.07 0.93
(1) Funds from operations comprised of net profit after tax excluding minority interest, with certain adjustments including property revaluations. (2) Management reports gearing as net debt/total tangible assets on a look-through basis (FY14 33.7%, FY13 29.0%, FY12 27.2%).
OUTSTANDING BONDS
ISSUE DATE VOLUME (M) MATURITY FORMAT COUPONMARGIN AT ISSUE DATE (BPs)
AUD (DOMESTIC)
21 Apr 10 210 21 Apr 17 Fixed 8.75% 270/swap
10 Sep 12 205 10 Sep 18 Fixed 5.75% 245/swap
USD (USPP)
21 Dec 04 130 Dec 14 to Mar 17 Fixed ND ND
9 Jul 13 15 9 Jul 23 Fixed ND ND
19 Feb 14 30 19 Feb 24 Fixed ND ND
19 Feb 14 60 19 Feb 25 Fixed ND ND
9 Jul 13 160 9 Jul 25 Fixed ND ND
19 Feb 14 110 19 Feb 27 Fixed ND ND
9 Jul 13 125 9 Jul 28 Fixed ND ND
USD (144A)
15 Mar 11 250 15 Mar 21 Fixed 5.60% 214/swap
retained debt duration above target levels at 5.2 years. DEXUS maintains diversified funding sources with a mix of unsecured bank debt (55%), US private placement debt (17%), 144A debt (7%), commercial paper (3%) and AMTN debt (18%) as at June 30 2014. DEXUS also maintains a well-spread debt maturity profile, with no more than 23% of debt maturities occurring in any calendar year.
DEBT MATURITY PROFILE
Capital markets Bank
SOURCE: DEXUS PROPERTY GROUP JUNE 30 2014
VO
LU
ME
(A
$M
)
1,200
1,000
800
600
400
200
0FY15 FY16 FY17 FY18 FY19
170
249855
700
525
200
675
FY20+
205
96
143
3 5
DEXUS WHOLESALE PROPERTY FUND
About DEXUS Wholesale Property Fund
D EXUS Wholesale Property Fund (DWPF) is a A$5 billion, open-ended unlisted property fund which owns interests in a diversified portfolio of office, industrial and retail properties throughout Australia.
The fund’s focus is to drive performance and deliver its investment plan, as well as to improve portfolio quality through strategic acquisitions and the ability to access its development pipeline. DWPF has a strong track record of superior performance through consistent long-term benchmark outperformance.
OwnershipDWPF was established as a wholesale fund in 1995. The responsible entity is DEXUS Wholesale Property Limited, a wholly owned subsidiary of DEXUS Property Group (DEXUS) (see facing page). DEXUS is one of Australia’s leading real-estate groups, with more than A$17.8 billion of funds under management.
Liquidity positionAt June 30 2014, DWPF had surplus liquidity of approximately A$240 million, with a A$100 million MTN settling post balance date and a further A$225 million of forward-start bank facilities to become available over the next 12 months. These facilities and the fund’s distribution reinvestment plan provide a strong liquidity position to fund existing development and fund-through commitments.
Debt fundingDWPF has in place unsecured revolving-credit bank facilities totalling A$665 million, including A$225 million of forward-start facilities, and A$350 million of MTNs maturing in November 2015 and July 2019. During the last financial year,
FOR FURTHER INFORMATION PLEASE CONTACT:
Michael ChristensenGM, Finance, Group Treasury & Finance Transformation+61 2 9017 [email protected]
the fund completed approximately A$200 million of term debt funding to support growth, including A$100 million of MTNs.
All debt facilities are unsecured and contain financial covenants including a maximum level of gearing and a minimum EBITDA interest cover.
KEY CREDIT METRICSCREDIT RATING A (S&P)
BOND PROTECTION
GEARING COVENANT Y
LEVERAGE RATIO N
INTEREST COVER RATIO Y
COUPON STEP-UP N
TARGET GEARING 10-20%
WEIGHTED AVERAGE DEBT MATURITY 2.6 years (as at June 30 2014)
WEIGHTED AVERAGE COST OF DEBT 6.4% (as at June 30 2014)
KEY DATAFINANCIAL YEAR END 30 JUN
BLOOMBERG TICKER DEXUS
ASX CODE NOT LISTED
KEY FINANCIALS FY14 FY13 FY12
REVENUES (A$M) (1) 327.8 310.7 284.3
EBITDA (A$M) 271.7 247.4 215.3
NET PROFIT AFTER TAX (A$M) (2) 361.4 286.9 272.9
DEBT/EBITDA (X) (SENIOR) 1.9 1.8 2.8
NET DEBT/NET DEBT + EQUITY (%) 10.1 10.2 15.9
GEARING (%) (3) 10.0 10.1 15.6
(1) Revenues from ordinary activities.(2) Net profit after tax excluding minority interest.(3) Management reports gearing as debt/total tangible assets.
OUTSTANDING BONDS
ISSUE DATE VOLUME (M) MATURITY FORMAT COUPONMARGIN AT ISSUE DATE (BPs)
AUD (DOMESTIC)
4 Nov 10 250 4 Nov 15 Fixed 7.25% 185/swap
1 Jul 14 100 1 Jul 19 Fixed 4.25% 110/swap
DEBT MATURITY PROFILE
VO
LU
ME
(A
$M
)
350
300
250
200
150
100
50
0
SOURCE: DEXUS WHOLESALE PROPERTY FUND JUNE 30 2014
FY15 FY16 FY17 FY18 FY19 FY20+
Capital markets Bank
200
50
315
100
50
250
50
3 6 | A U S T R A L A S I A N C O R P O R A T E Y E A R B O O K : B R O U G H T T O Y O U B Y W E S T P A C I N S T I T U T I O N A L B A N K A N D K A N G A N E W S N O V E M B E R 2 0 1 4
ISSUERPROFILES
DOWNER EDI
FOR FURTHER INFORMATION PLEASE CONTACT:
Tony Cohen, Group Treasurer +61 2 9240 9044 [email protected]/Investors/Investor-Relations-Contact.aspx
About Downer EDI
D owner EDI (Downer) is a provider of comprehensive engineering and infrastructure management services to the public and private minerals and metals, oil and gas, power, transport, telecommunications, water and property sectors. The
company operates predominantly across Australia and New Zealand with smaller operations in the Asia Pacific region, South America and southern Africa.
Downer, which employs approximately 19,000 people, operates as three divisions: Infrastructure, Mining and Rail.
OwnershipDowner is listed on the ASX under the code DOW. It is a member of the S&P/ASX100 Index of Australia’s 100 leading stocks ranked by market capitalisation and liquidity. Major shareholders are Australian and offshore financial institutions.
Liquidity positionAs at June 30 2014, Downer had total liquidity of A$1.049 billion comprising cash and cash equivalents of A$432 million and committed undrawn debt facilities of A$617 million.
For the financial year ended June 30 2014 Downer reported net cash inflow from operating activities of A$583 million and net investing outflow of A$279 million.
Debt fundingDowner has a diverse portfolio of funding instruments including bank loans – bilateral and syndicated – working capital finance, export-credit finance, US private placements, AUD MTNs and finance leases.
Given the contracting nature of Downer’s businesses, it also has a substantial amount of bank and insurance-company
KEY DATAFINANCIAL YEAR END 30 JUN
BLOOMBERG TICKER DOWAU
ASX CODE DOW
KEY FINANCIALS FY14 FY13 FY12
MARKET CAPITALISATION (A$M) 1,968 1,556 1,343
REVENUE (A$M) (1) 7,735 9,132 8,525
EBITDA (UNDERLYING) (A$M) 607.5 665.1 593.7
NET PROFIT AFTER TAX (UNDERLYING) (A$M) 216.0 215.4 195.3
GROSS DEBT/EBITDA (UNDERLYING) (X) 0.76 1.09 1.12
NET DEBT/NET DEBT + EQUITY (%) 1.60 11.70 18.60
SHARE PRICE (FY END) (A$) 4.52 3.59 3.13
(1) Including JVs and other income.
OUTSTANDING BONDS*
ISSUE DATE VOLUME (M) MATURITY FORMAT COUPONMARGIN AT ISSUE DATE (BPs)
AUD (DOMESTIC)
29 May 13 150 29 Nov 18 Fixed 5.75% 260/swap
USD (USPP)
2004 77 2014 & 2019 Fixed ND ND
* As at June 30 2014.
KEY CREDIT METRICSCREDIT RATING BBB (Fitch)
BOND PROTECTION
GEARING COVENANT Y
LEVERAGE RATIO N
INTEREST COVER RATIO Y
CHANGE OF CONTROL Y (review event)
COUPON STEP-UPY (related to rating change below investment grade)
TARGET GEARING 20-30% (on-balance sheet)
WEIGHTED AVERAGE DEBT MATURITY 2.7 years (as at June 30 2014)
credit facilities required for its contract performance bonding requirements.
As at June 30 2014 Downer had total bonding facilities of A$1.282 billion, of which A$384 million was undrawn.
DEBT MATURITY PROFILE
Syndicated facility extension option
Finance leases
Syndicated facility
USPP
Other secured borrowings
A$MTN ECA finance
Bilateral loans
VO
LU
ME
(A
$M
)
450
400
350
300
250
200
150
100
50
0Dec 14
Jun 15
Dec 15
Jun 16
Dec 16
Jun 17
Dec 17
Jun 18
Dec 18
Jun 19
Dec 19
SOURCE: DOWNER EDI JUNE 30 2014
86
6
7
4 4 9
103
21 40
21
21
95
1515
82
14 13 10
150
3
10
400 400
3
8
9
3 7
EASTERN DISTRIBUTOR
About Eastern Distributor
T he Eastern Distributor is a six-kilometre toll road that links Sydney’s central business district, Harbour Tunnel and Harbour Bridge with the city’s southern suburbs. It connects Sydney Airport, Port Botany (Sydney’s largest container port) and the city centre.
Tolls only apply to northbound traffic and are fully electronic.
OwnershipAs at June 30 2014, Eastern Distributor is owned by Transurban (75.1%) (see profile on p77), with the balance held by IFM Investors and UniSuper. Liquidity positionAs at June 30 2014, Eastern Distributor had A$9 million of cash and cash equivalents and a A$22.7 million maintenance reserve in the form of a bank guarantee.
Debt fundingEastern Distributor has a medium-dated debt profile, diversified by both sources of debt and maturities. It has A$525 million debt financing provided through non-recourse project-finance facilities which comprise a A$225 million bank tranche that matures in July 2018 and A$300 million domestic AMTNs that mature in November 2020. The average maturity was 5.4 years as at June 30 2014.
FOR FURTHER INFORMATION PLEASE CONTACT:
Richard Hills, Assistant Treasurer, Transurban+61 3 9612 [email protected]
WEIGHTED AVERAGE DEBT MATURITY 5.4 years (as at June 30 2014)
WEIGHTED AVERAGE COST OF DEBT 6.4% (as at June 30 2014)
KEY DATAFINANCIAL YEAR END 30 JUN
BLOOMBERG TICKER AIRMOT
ASX CODE NOT LISTED
KEY FINANCIALS FY14 FY13 FY12
REVENUES (A$M) 108 101 93
EBITDA (A$M) 70 72 65
NET PROFIT AFTER TAX (A$M) 31 29 40
DEBT/EBITDA (X) (SENIOR) 8 7 8
OUTSTANDING BONDS
ISSUE DATE VOLUME (M) MATURITY FORMAT COUPONMARGIN AT ISSUE DATE (BPs)
AUD (DOMESTIC)
9 Dec 13 300 9 Dec 20 Fixed 5.5% 145/swap
DEBT MATURITY PROFILE
VO
LU
ME
(A
$M
)
350
300
250
200
150
100
50
0
SOURCE: EASTERN DISTRIBUTOR JUNE 30 2014
FY15 FY16 FY17 FY18 FY19 FY20 FY21 FY22
300
225
Bank debt Domestic A$MTN
3 8 | A U S T R A L A S I A N C O R P O R A T E Y E A R B O O K : B R O U G H T T O Y O U B Y W E S T P A C I N S T I T U T I O N A L B A N K A N D K A N G A N E W S N O V E M B E R 2 0 1 4
ISSUERPROFILES
FEDERATION CENTRES
About Federation Centres
F ederation Centres (FDC) is a fully vertically integrated Australian real-estate investment trust (A-REIT) specialising in the ownership and management of 70 Australian shopping centres (as at June 30 2014). With A$6.9 billion of shopping centres under
management, FDC employs more than 500 people with offices in Melbourne, Sydney, Brisbane and Perth.
OwnershipFDC first listed on the ASX in December 2011. FDC is a stapled group comprised of Federation Limited, Federation Centres Trust No. 1, Federation Centres Trust No. 2 and Federation Centres Trust No. 3. The company is a member of the S&P/ASX200.
Liquidity positionAs at June 30 2014, FDC had available undrawn committed bank facilities of A$662.8 million. FDC has a development pipeline of approximately A$1.3 billion, with the company’s forecast share of its total spend approximately A$673.0 million. In addition, FDC manages four retail direct property syndicates which FDC expects to acquire over the first half of FY15.
Debt fundingAs at June 30 2014, FDC had A$1.225 million of total drawn debt: A$925 million drawn under the bank facilities and the balance under an Australian dollar MTN programme. In August 2014, FDC replaced its syndicated debt facility with a club-style arrangement. At this time, FDC reduced the
FOR FURTHER INFORMATION PLEASE CONTACT:
Ross Tzolakis, Corporate Treasurer+61 3 9236 6522ross.tzolakis@federationcentres.com.auwww.federationcentres.com.au
NET PROFIT AFTER TAX (A$M) (4) 441.3 212.7 (222.9)
DEBT/EBITDA (X) (SENIOR) (4) 4.02 3.83 5.99
BALANCE SHEET GEARING (%) (5) 24.1 25.5 26.3
SHARE PRICE (FY END) 2.49 2.37 1.98
(1) Results shown for the financial year ending 2012 are for seven months from December 1 2011 to June 30 2012.
(2) Disclosed on a segment information basis as total segment income plus net expenses directly attributable to direct property investments deducted in determining direct property investment income.
(3) Segment income statement, total segment income less overheads, net of recoveries. (4) Disclosed on a segment information basis.(5) Segment balance sheet, drawn debt less cash/total assets less intangible assets and
cash. DEBT MATURITY PROFILE
VO
LU
ME
(A
$M
)
600
500
400
300
200
100
0
SOURCE: FEDERATION CENTRES AUGUST 31 2014
Bank facilities AMTN
250
555
150
FY15 FY16 FY17 FY18 FY19 FY20 FY21
150200 200 200
33
total bank facility limit by A$150 million. FDC’s earliest debt maturity is December 2014.
OUTSTANDING BONDS
ISSUE DATE VOLUME (M) MATURITY FORMAT COUPONMARGIN AT ISSUE DATE (BPs)
AUD (DOMESTIC)
13 Dec 13 150 13 Dec 19 Fixed 5.75% 170/swap
27 May 14 150 27 May 21 Fixed 5.00% 150/swap
3 9
FLETCHER BUILDING
About Fletcher Building
F letcher Building is a New Zealand-headquartered building-materials manufacturer, distributor and construction contractor. The company is involved in the residential, commercial and infrastructure construction sectors. It has five divisions: Building
Products, Distribution, Construction, Infrastructure Products, and Laminates and Panels. Its businesses operate across Australasia, Asia, North America, Europe and the rest of the world, with approximately 19,000 employees.
OwnershipFletcher Building is a public company, listed on both the NZX and ASX, as FBU, since 2001.
Liquidity positionAt June 30 2014 Fletcher Building had total available funding of NZ$2,378 million, of which NZ$616 million was undrawn.
Debt fundingOf the company’s total available funding, bank debt accounts for 37%, 46% comes from the US private placement market and 17% comprises capital notes from the New Zealand public debt market. The average maturity of the drawn debt, of NZ$1,762 million, is more than four years. The currency split is 44% AUD, 37% NZD, 10% USD and 9% spread over various other currencies.
Fletcher Building borrows most funds based on a negative pledge and cross-guarantee arrangement from a number of wholly owned subsidiaries. It ensures that external senior indebtedness ranks equally in all respects and includes the covenant that security can be given only in limited circumstances. As at June 30 2014, the group was in compliance with all its covenants.
FOR FURTHER INFORMATION PLEASE CONTACT:
Philip King, Group General Manager, Investor Relations & Capital Markets+64 9 525 [email protected]
KEY CREDIT METRICSCREDIT RATING Not rated
BOND PROTECTION
GEARING COVENANT N
LEVERAGE RATIO N
INTEREST COVER RATIO N
CHANGE OF CONTROL N
COUPON STEP-UP N
TARGET GEARING 30-40% (currently 32.3%)
WEIGHTED AVERAGE DEBT MATURITY 4.2 years (as at June 30 2014)
WEIGHTED AVERAGE COST OF DEBT 6.22% (as at June 30 2014) (1)
(1) Interest rates are inclusive of margins but not of fees.
(1) Earnings before interest, taxation, depreciation, fair-value adjustments and investment in associates.
OUTSTANDING BONDSISSUE DATE VOLUME (M) MATURITY FORMAT COUPON
NZD (DOMESTIC)*
N/A 93 15 Mar 15 Fixed subordinated 8.50%
N/A 19 15 May 16 Fixed subordinated 9.00%
N/A 75 15 May 16 Fixed subordinated 7.75%
N/A 68 15 Mar 17 Fixed subordinated 7.50%
N/A 89 15 Mar 18 Fixed subordinated 7.15%
N/A 75 15 Mar 19 Fixed subordinated 5.40%
N/A 112 15 Mar 19 Fixed subordinated 6.45%
AUD (USPP)
24 Oct 05 132 27 Oct 17 FRN FRN
10 Jan 12 99 10 Jan 22 Fixed 8.36%
NZD (USPP)
24 Oct 05 143 27 Oct 15 FRN FRN
JPY (JPP)
24 Feb 12 10,000 24 Feb 27 Fixed 2.77%
USD (USPP)
20 Sep 07 194 20 Sep 16 Fixed 6.23%
20 Sep 07 132 20 Sep 19 Fixed 6.43%
10 Jan 12 58 10 Jan 22 Fixed 5.17%
10 Jan 12 143 10 Jan 24 Fixed 5.37%
* Convertible notes at the issuer’s option.
DEBT MATURITY PROFILE
Capital notes Long-term debt
VO
LU
ME
(N
Z$
M)
700
600
500
400
300
200
100
0
SOURCE: FLETCHER BUILDING JUNE 30 2014
Bank and other Committed undrawn debt facilities
65
61
252
6674
15
94
143142
150 168 151 130
220
125350
9868
2
2
FY15
FY16
FY17
FY18
FY19
FY20
FY21
FY22
FY23
FY24
FY25
FY26
FY27
1
4 0 | A U S T R A L A S I A N C O R P O R A T E Y E A R B O O K : B R O U G H T T O Y O U B Y W E S T P A C I N S T I T U T I O N A L B A N K A N D K A N G A N E W S N O V E M B E R 2 0 1 4
ISSUERPROFILES
FONTERRA CO-OPERATIVE GROUP
About Fonterra Co-operative Group
F onterra Co-operative Group (Fonterra) is the largest processor of milk in the world, with a sales network spanning more than 100 countries.
Through its integrated ‘grass- to-glass’ supply chain, Fonterra delivers high-quality dairy products
to a portfolio of customers and consumers around the world. Fonterra is organised around three global businesses – Global Operations, Global Ingredients and International Farming – and three regional businesses – Greater China, LatAm and APMEA.
The Global Operations and Global Ingredients businesses are responsible for collecting milk from New Zealand supplier shareholders, manufacturing it into dairy products, and selling dairy ingredients products through Fonterra’s global sales network. Products range from everyday dairy nutrition powders to innovative, advanced dairy nutrition products. Regional businesses focus on branded consumer dairy products (such as yoghurts, milk, butter and ice cream) and food services (supplying customers such as bakeries, restaurants, caterers, hotels and quick-service restaurants).
Fonterra was formed in 2001 when New Zealand’s two leading dairy cooperatives merged and integrated with the industry’s marketing arm, the New Zealand Dairy Board. Following this merger, Fonterra became New Zealand’s largest company by revenue. The company’s scale of operations, cost effectiveness, market leadership and financial flexibility are reflected in Fonterra’s strong credit ratings.
OwnershipAs a cooperative, Fonterra is owned by approximately 10,700 farmer-supplier shareholders in New Zealand. Fonterra is registered under the Companies Act 1993 and the Co-operative
Companies Act 1996. It is also required to comply with the Dairy Industry Restructuring Act 2001.
Liquidity positionFonterra’s liquidity policy ensures that it is aligned with the expectations for an A/AA- issuer, and that cash and available facilities cover at least debt maturities due within the next year. Group treasury manages liquidity by retaining cash and marketable securities, and through funding from committed credit facilities.
Debt fundingAs of July 31 2014 Fonterra had economic net interest-bearing debt of NZ$4.73 billion. Fonterra borrows a mixture of fixed- and variable-rate debt in a range of currencies and tenors, split between bank facilities and debt capital markets.
KEY CREDIT METRICSCREDIT RATING A/AA- (S&P/Fitch)
BOND PROTECTION
GEARING COVENANT, LEVERAGE RATIO, INTEREST COVER RATIO, CHANGE OF
(1) Profit for the period attributable to shareholders of the parent.(2) Economic net interest-bearing debt reflects the effect of debt hedging in place at balance
date.(3) Economic debt to debt plus equity, calculated as economic net interest-bearing debt
including the impact of debt hedging, over economic net interest-bearing debt plus total equity excluding the cash flow hedge reserve.
OUTSTANDING BONDS
ISSUE DATE VOLUME (M) MATURITY FORMAT COUPON (% OR BPs)
F ortescue Metals Group (Fortescue) is engaged in the exploration, development, production and export of iron ore in the Pilbara region of north-western Australia. It is the third-largest iron-ore producer in Australia and the world’s fourth-largest participant
in the seaborne iron-ore market. Fortescue is a significant supplier to the steel mills of Asia, principally China. The company is focused on being a high-margin exporter of iron ore to China and other parts of Asia through its highly efficient mining operations and modern rail and port transportation infrastructure.
Fortescue produces iron ore from multiple mine sites within two mining hubs. Cloudbreak and Christmas Creek are located in the Chichester Hub, and Firetail and Kings Valley are located in the Solomon Hub. Fortescue’s wholly owned and operated port and rail infrastructure includes the railway, comprised of rolling stock and approximately 620 kilometres of mainline track, together with the Herb Elliott Port.
Since the first shipment of iron ore was mined and shipped from Cloudbreak in May 2008, Fortescue’s operational focus has been on increasing iron-ore production levels at the Chichester Hub and the Solomon Hub. Production reached an aggregate annualised run-rate production of approximately 155 million tonnes per annum (Mtpa) of iron ore processed for the quarter ended June 30 2014. Production for the month of June 2014 reached a record annualised rate of 160 Mtpa. For FY14, Fortescue achieved annual shipments of 124.2 million tonnes.
As of June 30 2014, Fortescue employed a total staff of 4,553.
OwnershipFortescue was founded in 2003 and is listed on the ASX with a market capitalisation of A$12.5 billion as at September 3 2014. Fortescue is a member of the S&P/ASX 50 Index.
FOR FURTHER INFORMATION PLEASE CONTACT:
Ian Wells, Group Manager, Treasury & Business Planning +61 8 6218 8601 [email protected]
Liquidity positionAs at 30 June 2014 Fortescue had a very strong liquidity position, represented by cash on hand of US$2.4 billion.
Debt fundingAs at June 30 2014 Fortescue had US$9.6 billion of debt outstanding, including a US$317 million finance-lease liability.
KEY CREDIT METRICS
CREDIT RATING (S&P/MOODY’S/FITCH)
Corporate: BB+/Ba1/BB+Unsecured notes: BB/Ba2/BB+ Secured term loan: BBB/Baa3/BBB-
BOND PROTECTION
GEARING COVENANT N
LEVERAGE RATIO N
INTEREST COVER RATIO N
CHANGE OF CONTROL Y
COUPON STEP-UP N
TARGET GEARING (D/D+E) of 40%
WEIGHTED AVERAGE DEBT MATURITY 4.97 years (as at June 30 2014)
WEIGHTED AVERAGE COST OF DEBT 5.35% (as at June 30 2014)
KEY DATAFINANCIAL YEAR END 30 JUN
BLOOMBERG TICKER FMGAU
ASX CODE FMG
KEY FINANCIALS FY14 FY13 FY12
MARKET CAPITALISATION (A$M) 13,545 9,466 15,258
REVENUES (US$M) 11,753 8,120 6,716
EBITDA (US$M) 5,636 3,575 3,036
NET PROFIT AFTER TAX (US$M) 2,740 1,746 1,559
DEBT/EBITDA (X) (SENIOR) 1.7 3.5 2.8
NET DEBT/NET DEBT + EQUITY (%) 49 67 62
SHARE PRICE (FY END) (A$) 4.35 3.04 4.90
OUTSTANDING BONDS
ISSUE DATE VOLUME (M) MATURITY FORMAT COUPONMARGIN AT ISSUE DATE (BPs)
USD (UNSECURED 144A)
14 Mar 12 1,000 1 Apr 17 Fixed 6.00% 489/UST
10 Dec 10 900 1 Feb 18 Fixed 6.875% 420/UST
25 Oct 11 1,500 1 Nov 19 Fixed 8.25% 648/UST
14 Mar 12 1,000 1 Apr 22 Fixed 6.875% 460/UST
USD (SECURED TERM LOAN B)
Nov 12 4,913 30 Jun 19 Floating3.75% (incl. Libor floor of 1.00%)
275/Libor
DEBT MATURITY PROFILE
VO
LU
ME
(U
S$
M)
6,000
5,000
4,000
3,000
2,000
1,000
0
SOURCE: FORTESCUE METALS GROUP JUNE 30 2014
Senior-secured credit facility Unsecured notes
1,000
4,913
1,500
FY15 FY16 FY17 FY18 FY19 FY20 FY21 FY22FY14
1,000900
4 2 | A U S T R A L A S I A N C O R P O R A T E Y E A R B O O K : B R O U G H T T O Y O U B Y W E S T P A C I N S T I T U T I O N A L B A N K A N D K A N G A N E W S N O V E M B E R 2 0 1 4
ISSUERPROFILES
GENESIS ENERGY
About Genesis Energy
G enesis Energy is New Zealand’s largest energy retailer. It supplies electricity, gas and LPG to more than 647,000 customers across New Zealand. The company’s ability to bring innovative energy solutions to retail and business customers is supported by a
diverse generation portfolio comprising thermal, wind and hydro generation. This supplied approximately 17% of New Zealand’s electricity in 2013. Genesis Energy also owns 31% of the Kupe oil and gas field.
OwnershipGenesis Energy was listed on the NZX and ASX on April 17 2014, following the company’s partial privatisation by the government of New Zealand.
Liquidity positionA conservative liquidity position and moderate financial flexibility have been provided through headroom in the company’s debt facilities and an appropriately managed near-term liability maturity profile. Genesis Energy’s liquidity risk-management policies are conservative and include committed debt facilities that must be maintained at an amount that is the higher of NZ$50 million or 115% of projected peak over the next two years. The company is operating comfortably above its financial covenants.
Debt fundingGenesis Energy accesses a number of markets to provide debt funding for its business. Of the NZ$1.245 billion of debt facilities in place at June 30 2014, NZ$625 million is through arrangements with individual banks (up NZ$150 million from the previous year). The remaining NZ$620 million is funded through a combination of MTNs, retail and capital bonds. During the most recent financial year, a total of NZ$75 million
of capital bonds was repurchased and NZ$120 million of retail bonds matured.
KEY CREDIT METRICSCREDIT RATING BBB+ (S&P)
BOND PROTECTION
GEARING COVENANT, LEVERAGE RATIO, INTEREST COVER RATIO N
CHANGE OF CONTROL Y (capital bonds only) (1)
COUPON STEP-UP Y (capital bonds only) (2)
BANK COVENANTS
GEARING 50%
EBITDAF/INTEREST 2.5x
TARGET GEARING N/A
(1) If a change of control event occurs, Genesis Energy has the right to redeem the capital bonds. If a change of control and an associated ratings downgrade occurs, bondholders may elect to have their capital bond redeemed by Genesis Energy.(2) On July 15 2018 and every five years thereafter, the interest rate will reset to be the sum of the five-year swap on the relevant reset date plus the step-up margin (being the margin set on the minimum rate set date plus the step-up percentage of 0.25%).
(1) Treats capital bonds as 100% equity in FY12 and 50% equity in FY13, in line with bank covenants and rating agency treatment.
OUTSTANDING BONDS
ISSUE DATE VOLUME (M) MATURITY FORMAT COUPON MARGIN AT ISSUE DATE (BPs)
NZD (DOMESTIC)
Bank debt 125 31 Sep 15 N/A N/A ND
Bank debt 75 12 Nov 16 N/A N/A ND
Bank debt 75 12 Nov 17 N/A N/A ND
Bank debt 350 12 Nov 18 N/A N/A ND
Retail Bonds B 105 15 Mar 16 Fixed 7.65% ND
MTNs 75 15 Sep 16 Fixed 7.19% 48/swap
MTNs 50 20 Feb 17 Fixed/FRN ND 240/BKBM
MTNs 50 1 Nov 19 Fixed 5.21% 175/swap
MTNs 70 23 Jun 20 Fixed 8.25% 255/swap
MTNs 70 8 Mar 23 Fixed 5.81% 175/swap
Capital bonds 200 15 Jul 41 Fixed 6.19% 215/swap
DEBT MATURITY PROFILE
Rolling bank debt Bank debt
VO
LU
ME
(N
Z$
M)
400
350
300
250
200
150
100
50
0FY16
FY17
FY18
FY19
FY20
FY21
FY22
FY41
SOURCE: GENESIS ENERGY JUNE 30 2014
Retail bonds Capital bonds
350
75
50125
7550
105
75
Wholesale domestic bonds
70 70
200
4 3
THE GPT GROUP
About The GPT Group
T he GPT Group (GPT) is a property group with broad access to capital invested in quality assets. The group focuses on active ownership of high-quality Australian real estate in the retail, office, and logistics sectors. Total assets grew from A$6 million in 1971
to A$9.6 billion as at June 30 2014, with retail assets comprising about 51% of the asset base, office at 34%, and logistics at 15%. At June 30 2014 the group had assets under management of A$16.7 billion.
OwnershipGPT listed on the ASX in April 1971. The group has a substantial investor base, with over 38,000 investors, and is one of the top-50 stocks by market capitalisation. GPT is internally managed with the responsible entity (GPT RE) being a subsidiary of GPT Management Holdings.
Liquidity positionAt June 30 2014, GPT had A$209 million of liquidity available in cash and through committed, but undrawn, debt facilities.
Debt fundingGPT manages its gearing within the range of 25-35%. As at June 30 2014, gearing on a net basis was 24.8%. Drawn debt was A$2.4 billion, with the average term to maturity increasing to 6.0 years as a result of a further US$175 million, 15-year US private placement (USPP) issuance in the first half of 2014, swapped back at a margin of 144 basis points over BBSW.
GPT’s debt is sourced from a variety of funding sources – including bank debt facilities from domestic and offshore banks, domestic and foreign MTNs, USPPs and inflation-linked bonds. As at June 30 2014, 40% of drawn debt was sourced through the debt capital markets.
NET PROFIT AFTER TAX (A$M) 240.6 571.5 257.0 594.5
DEBT/EBITDA (X) (SENIOR) 4.3 4.0 3.5 3.8
NET DEBT/NET DEBT + EQUITY (%) 25.9 23.2 20.3 22.4
SHARE PRICE (FY OR HY END) (A$) 3.84 3.40 3.84 3.68
OUTSTANDING BONDS
ISSUE DATE VOLUME (M) MATURITY FORMAT COUPON MARGIN AT ISSUE
DATE (BPs)
AUD (DOMESTIC)
19 Nov 12 30 19 Nov 17 FRN ND ND
24 Jan 12 150 24 Jan 19 Fixed 6.75% 235/swap
2 Aug 12 100 24 Jan 19 Fixed 6.75% 220/swap
11 Sep 14 150 11 Sep 20 Fixed 4.50% 120/swap
16 Aug 12 33 16 Aug 22 Fixed 6.25% 225/swap
31 Aug 12 17 16 Aug 22 Fixed 6.25% 225/swap
10 Dec 99 85 10 Dec 29 CPI-linked 5.90%+CPI ND
USD (USPP)
28 May 13 65 19 Jun 25 Fixed 3.60% 170/UST
19 Jun 13 85 19 Jun 25 Fixed 3.60% 170/UST
19 Jun 13 100 19 Jun 28 Fixed 3.80% 190/UST
6 Jun 14 62.5 8 Jul 29 Fixed 4.33% 162/UST
8 Jul 14 112.5 8 Jul 29 Fixed 4.36% 165/UST
HKD
5-22 Feb 13 800 5 Feb 28 Fixed 3.55% 165/swap
GPT’s aim is to ensure that debt maturity is a maximum of A$1 billion on a rolling 12-month basis and A$500 million in any calendar quarter. Upcoming expiries in the forward 12 months are refinanced well in advance, with existing liquidity headroom and forward-start facilities.
DEBT MATURITY PROFILE
Bank debt Bonds USPP
VO
LU
ME
(A
$M
)
600
500
400
300
200
100
0
SOURCE: THE GPT GROUP JUNE 30 2014
28
9
49
8
38
7 325
250
100
50
97
8514
6
30
188
99
FY15
FY16
FY17
FY18
FY19
FY20
FY21
FY22
FY23
FY24
FY25
FY26
FY27
FY28
FY29
FY14
4 4 | A U S T R A L A S I A N C O R P O R A T E Y E A R B O O K : B R O U G H T T O Y O U B Y W E S T P A C I N S T I T U T I O N A L B A N K A N D K A N G A N E W S N O V E M B E R 2 0 1 4
ISSUERPROFILES
GPT WHOLESALE SHOPPING CENTRE FUND
About GPT Wholesale Shopping Centre Fund
G PT Wholesale Shopping Centre Fund (GWSCF) provides investors with exposure to prime regional Australian retail assets located in New South Wales, Victoria, the Northern Territory and the Australian Capital Territory. The fund was established in March
2007 with a A$1.9 billion portfolio consisting of interests in eight shopping centres. At June 30 2014, it had ownership interests in 10 high-quality retail assets with a value of A$3.5 billion. From time to time the fund undertakes developments of its assets in order to enhance portfolio returns.
OwnershipGWSCF is an unlisted Australian-based wholesale property fund. The responsible entity of GWSCF is GPT Funds Management, a wholly owned subsidiary of the GPT Group (GPT) (see p43).
GPT is a public company, listed on the ASX in April 1971 as General Property Trust. With an A$8.8 billion direct property portfolio and total assets under management of A$16.7 billion, GPT is one of Australia’s largest diversified listed-property groups. It owns, develops and actively manages a diversified portfolio of quality Australian property assets on behalf of both listed and wholesale investors.
Liquidity positionAt June 30 2014, GWSCF had A$142 million of liquidity available in cash and through committed but undrawn debt facilities. The fund generally manages cash to a low level in order to reduce outstanding debt. Its capital expenditure programme is partly funded by earnings retained via a distribution-reinvestment plan.
Debt fundingGWSCF has in place A$795 million of unsecured bank facilities – excluding a A$180 million forward-start facility available from August 2014 – with various maturities to April 2019, being A$664 million drawn at June 30 2014. An additional A$200 million of fixed-rate MTNs matures in November 2017.
Covenants and other key terms and conditions for bank loans are standardised in a common-terms deed poll. At June
WEIGHTED AVERAGE DEBT MATURITY 3.1 years (as at June 30 2014)
WEIGHTED AVERAGE COST OF DEBT 4.46% (as at June 30 2014)
KEY DATAFINANCIAL YEAR END 30 JUN
BLOOMBERG TICKER GPTWSC CORP
ASX CODE NOT LISTED
OUTSTANDING BONDS
ISSUE DATE VOLUME (M) MATURITY FORMAT COUPON MARGIN AT ISSUE DATE (BPs)
AUD (DOMESTIC)
13 Nov 12 200 13 Nov 17 Fixed 5.00% 175/swap
30 2014, the fund was well within its covenant limits with gearing at 24.5% against a covenant of 50%.
The fund’s gearing is conservatively managed in the 10-30% range. Since June 2014, GWSCF has acquired a further 8.33% of the Highpoint Shopping Centre (taking its ownership to 58.33%), and has launched a A$400 million equity raising to return gearing to about 17% by October. Average term to maturity of debt was 3.1 years as at June 30 2014.
In order to minimise funding and refinancing risk, GWSCF aims to ensure that debt maturity is no greater than A$200 million at any point in time and a maximum of A$300 million in any calendar quarter. The anticipated A$400 million equity raising proceeds will be used predominately to repay short-dated bank facilities maturing in the second half of 2015.
VO
LU
ME
(A
$M
)
DEBT MATURITY PROFILE
Bank debt MTN
600
500
400
300
200
100
0
SOURCE: GPT WHOLESALE SHOPPING CENTRE FUND JUNE 30 2014
430
50
200
150
345
2015 2016 2017 2018 20192014
4 5
HOLCIM
About Holcim
F ounded in Switzerland in 1912, Holcim is one of the world’s leading suppliers of cement and aggregates. The group also supplies ready-mix concrete and asphalt, and provides related services. Holcim operates in around 70 countries and employs some 71,000
people. It is more globally spread than any other building materials group, with around 1,750 plants around the world.
Holcim’s business strategy is based on continuous growth in both developed economies and emerging, high-growth markets, where around three-quarters of its operational cement capacity is based. As an economy becomes more mature, vertical integration becomes increasingly important for Holcim.
Holcim took the opportunity to move toward vertical integration in Australia in 2009 through the acquisition of Cemex Australia – now Holcim Australia. Holcim operates around 300 cement, aggregates, ready-mix and grinding plants and employs around 4,500 people in the three companies Holcim Australia, Cement Australia and Holcim New Zealand.
On April 7 2014, Holcim announced that it intends to enter into a merger of equals with Lafarge to create LafargeHolcim. Completion of the merger of equals is expected by the end of the first half of 2015, subject to, among other things, obtaining regulatory approvals.
OwnershipHolcim is listed on the SIX Swiss Exchange. As at December 31 2013, 20.11% of its shares was held by Thomas Schmidheiny, 10.82% by Eurocement Holding AG and 5.11% by Harris Associates L.P.
Liquidity positionAt June 30 2014, Holcim had CHF1.9 billion in cash and marketable securities and CHF3.9 billion in undrawn committed credit lines.
Debt fundingAs at June 30 2014, Holcim had a net financial debt position of CHF10.6 billion. A total of 77% of its financial liabilities is financed through capital markets and 23% through banks and other lenders.
Holcim has a strong liquidity position of CHF5.9 billion and has decisively strengthened its balance sheet. The company places great importance on maintaining its solid investment-grade credit rating by complying with financial targets – such as funds from operations to net financial debt (target >25%) or net financial debt to EBITDA (target <2.8x).
Outstanding corporate bank lines and bonds at the parent or financial sub-holding level are free from financial covenants, repeating material adverse-change clauses or rating triggers. These debt instruments also feature limited cross-default provisions, which typically exclude operating subsidiaries. This removes the risk that any covenant breach by the group’s operating subsidiaries would contaminate the parent company’s debt.
Holcim Finance (Australia) is used as a finance vehicle for the group and all its long-term transactions are guaranteed by the parent company.
WEIGHTED AVERAGE DEBT MATURITY 5.0 years (as at June 30 2014)
WEIGHTED AVERAGE COST OF DEBT 4.6% (as at December 31 2013)
KEY DATAFINANCIAL YEAR END 31 DEC
BLOOMBERG TICKER HOLNVX
ASX CODE NOT LISTED IN AUSTRALIA
KEY FINANCIALS HY14 FY13 HY13 FY12
MARKET CAPITALISATION (CHF M) 25,496 21,883 21,539 21,882
REVENUES (CHF M) 9,061 19,719 9,649 21,160
OPERATING EBITDA (CHF M) 1,627 3,896 1,819 3,889
NET PROFIT AFTER TAX (CHF M) 657 1,596 760 1,002
DEBT/EBITDA (X) (SENIOR) ND 2.70 ND 3.09
NET DEBT/NET DEBT + EQUITY (%) 35.94 33.62 36.36 34.93
SHARE PRICE (FY OR HY END) (CHF) 77.95 66.75 65.85 66.9
OUTSTANDING BONDS (HOLCIM FINANCE AUSTRALIA)
ISSUE DATE VOLUME (M) MATURITY FORMAT COUPONMARGIN AT ISSUE DATE (BPs)
AUD (DOMESTIC)
27 Mar 12 250 27 Mar 15 Fixed 7.00% 260/swap
18 Jul 12 250 18 Jul 17 Fixed 6.00% 265/swap
4 Oct 12 200 4 Apr 19 Fixed 5.25% 200/swap
4 6 | A U S T R A L A S I A N C O R P O R A T E Y E A R B O O K : B R O U G H T T O Y O U B Y W E S T P A C I N S T I T U T I O N A L B A N K A N D K A N G A N E W S N O V E M B E R 2 0 1 4
ISSUERPROFILES
INCITEC PIVOT
About Incitec Pivot
I ncitec Pivot is a leading global chemicals company with nitrogen-based manufacturing at its core. The company is the number-one supplier of fertilisers in Australia, a market-leading supplier of explosives products and services in North America – the largest industrial-
explosives market in the world – and number-two supplier of explosives products and services in Australia.
Incitec Pivot has operations throughout the US, Canada, Mexico, Australia, Turkey, Chile, Indonesia and Papua New Guinea, with approximately 5,000 staff worldwide. Its headquarters are in Melbourne.
OwnershipIncitec Pivot was created from the merger between Pivot and Incitec Fertilizers in 2003. It has been listed on the ASX since July 2003, as IPL, and is one of the top-100 listed companies on the exchange.
Liquidity positionIn its 2014 half-year results presentation, Incitec Pivot reported that it has a significant level of funding headroom with undrawn committed funding lines – including cash – of more than A$1.34 billion.
Debt fundingThe consolidated entity has foreign operations with non-AUD functional currencies and so is exposed to translation risk resulting from FX movements. As a result, the consolidated entity has a preference for debt denominated in US dollars.
Incitec Pivot significantly extended the tenor of its debt portfolio with the issue of a US$800 million 144A Reg S bond deal in December 2009 and a US$500 million 144A Reg S bond deal in December 2010. These deals complement
FOR FURTHER INFORMATION PLEASE CONTACT:
Geoff McMurray, General Manager, Treasury+61 3 8695 [email protected]
the company’s A$1.45 billion syndicated facility maturing in October 2016 and September 2018.
In August 2013, the company issued a A$200 million MTN with a maturity date of February 2019.
NET PROFIT AFTER TAX (A$M) 115.7 372.0 110.2 510.7
DEBT/EBITDA (X) (SENIOR) 2.40 2.00 2.26 1.70
NET DEBT/NET DEBT + EQUITY (%) 30.0 23.2 29.1 24.2
SHARE PRICE (FY OR HY END) (A$) 2.96 2.69 3.09 2.98
OUTSTANDING BONDS
ISSUE DATE VOLUME (M) MATURITY FORMAT COUPONMARGIN AT ISSUE DATE (BPs)
AUD (DOMESTIC)
21 Aug 13 200 21 Feb 19 Fixed 5.75% 215/swap
USD (144A)
7 Dec 10 500 7 Dec 15 Fixed 4.00% 275/UST
3 Dec 09 800 10 Dec 19 Fixed 6.00% 270/UST
4 7
INFRATIL
About Infratil
I nfratil owns New Zealand and Australian transport, energy and social-infrastructure businesses. Its businesses mainly operate in predictable and stable sectors, but all are subject to demand and price risk. Key subsidiaries and associates are Trustpower (51%) (see p78), Z Energy (20%), Infratil
Energy Australia/Lumo (100%), NZ Bus (100%), Wellington Airport (66%) (see p81), Perth Energy (80%) and Metlifecare (20%). Infratil has a contracted manager, Morrison & Co.
OwnershipInfratil is an NZX20 company listed on the NZX. It listed on the ASX in 2010. The largest shareholder is a UK-based investment fund, Utilico, which owns 9%. Management owns 9%. NZ institutions own 25%. NZ retail investors own 42%. Offshore investors – other than Utilico – own 15%.
Liquidity positionAs at March 31 2014, Infratil and wholly owned subsidiaries had NZ$784 million of committed bank facilities with NZ$624 million undrawn.
Debt fundingInfratil uses longer-dated, structurally subordinated bonds as its source of core debt, with bank and vendor funding used for working capital and specific asset funding. As at March 31 2014, dated bonds amounted to NZ$754 million, perpetual bonds NZ$235 million, and net bank/vendor funding NZ$73 million.
Infratil has a strategic goal of triple-B calibre metrics. The company has stable and growing operating cash flows, assets for which there is strong demand and a debt structure which ensures there is negligible refinancing risk, even during periods such as the global financial crisis.
Infratil’s debt can be grouped into three categories. (A) Structurally subordinated bonds issued by the parent company. (B) Parent and 100% subsidiary bank debt and vendor financing. (C) Subsidiaries and joint ventures (Wellington Airport, Perth Energy, Trustpower) which have capital structures to reflect their own credit circumstances and shareholder interests. As at March 31 2014 their net debt amounted to NZ$1,424 million.
CHANGE OF CONTROL Y (if a party acquires 90% of Infratil)
COUPON STEP-UPY (for perpetual infrastructure bonds only based on leverage ratio)
TARGET GEARING Metrics consistent with a BBB rating
WEIGHTED AVERAGE DEBT MATURITY 7.9 years (as at March 31 2014)
WEIGHTED AVERAGE COST OF DEBT 6.8 % (as at March 31 2014)
KEY DATAFINANCIAL YEAR END 31 MAR
BLOOMBERG TICKER IFTNZ
NZX/ASX CODE IFT/IFZ
KEY FINANCIALS FY14 FY13 FY12
MARKET VALUE EQUITY (NZ$M) 1,269 1,382 1,109
REVENUES (NZ$M) 2,384 2,400 2,219
EBITDAF (NZ$M) 500 528 520
NET PROFIT AFTER TAX (NZ$M) 199 3 52
NET DEBT (NZ$M) 1,062 1,276 1,222
DEBT/EBITDA (X) 2.1 2.4 2.4
NET DEBT/NET DEBT + EQUITY (%) 35 39 42
SHARE PRICE (FY END) (NZ$) 2.27 2.37 1.89
OUTSTANDING BONDS (PARENT & 100% SUBSIDIARY)ISSUE DATE VOLUME (M) MATURITY FORMAT COUPON
NZD (DOMESTIC)
Dec 04 153 15 Nov 15 Fixed 8.50%
Dec 10 100 15 Jun 16 Fixed 8.50%
Mar 11 66 15 Jun 17 Fixed 8.50%
Feb 12 81 15 Nov 17 Fixed 8.00%
Nov 12 111 15 Nov 18 Fixed 6.85%
Dec 13 69 15 Nov 19 Fixed 6.75%
Dec 05 81 15 Feb 20 Fixed 8.50%
Jun 13 94 15 Jun 22 Fixed 6.85%
Nov 06 235 Perpetual FRN1YR swap +1.5%
DEBT MATURITY PROFILE (INFRATIL AND 100% SUBSIDIARIES)
Bank Bond
VO
LU
ME
(N
Z$
M)
300
250
200
150
100
50
0FY15 FY16 FY17 FY18 FY19 FY20-23 Beyond
SOURCE: INFRATIL MARCH 31 2014
153
73
100147
111
245235
4 8 | A U S T R A L A S I A N C O R P O R A T E Y E A R B O O K : B R O U G H T T O Y O U B Y W E S T P A C I N S T I T U T I O N A L B A N K A N D K A N G A N E W S N O V E M B E R 2 0 1 4
ISSUERPROFILES
INVESTA OFFICE FUND
About Investa Office Fund
I nvesta Office Fund (IOF) is a leading owner of investment-grade office buildings, receiving rental income from a tenant register comprised predominately of government and blue-chip tenants. IOF has total assets under management of A$3.1 billion, with 23 investments
located in core CBD markets throughout Australia and one legacy asset in Brussels, Belgium.
The fund’s overarching strategy is to be Australia’s best-performing CBD office fund with a focus on delivering attractive risk-adjusted returns to its unitholders.
OwnershipThe fund was created on January 1 2000, as a result of a merger between Armstrong Jones Office Trust and Prime Credit Property Trust. IOF is a top-100 ASX-listed entity, and major owners include AMP, CBRE Clarion, Morgan Stanley Investment Management and Mitsubishi UFJ Financial Group.
IOF is managed by Investa Office, a specialist owner and manager of high-quality office buildings in core CBD markets across Australia. The Investa Office portfolio incorporates more than a million square metres of quality office space across 47 buildings, worth more than A$8 billion, accommodating some of the world’s leading companies.
Investa Office operates an integrated real-estate platform that incorporates funds management, portfolio and asset-management services, property services, development, sustainability and research.
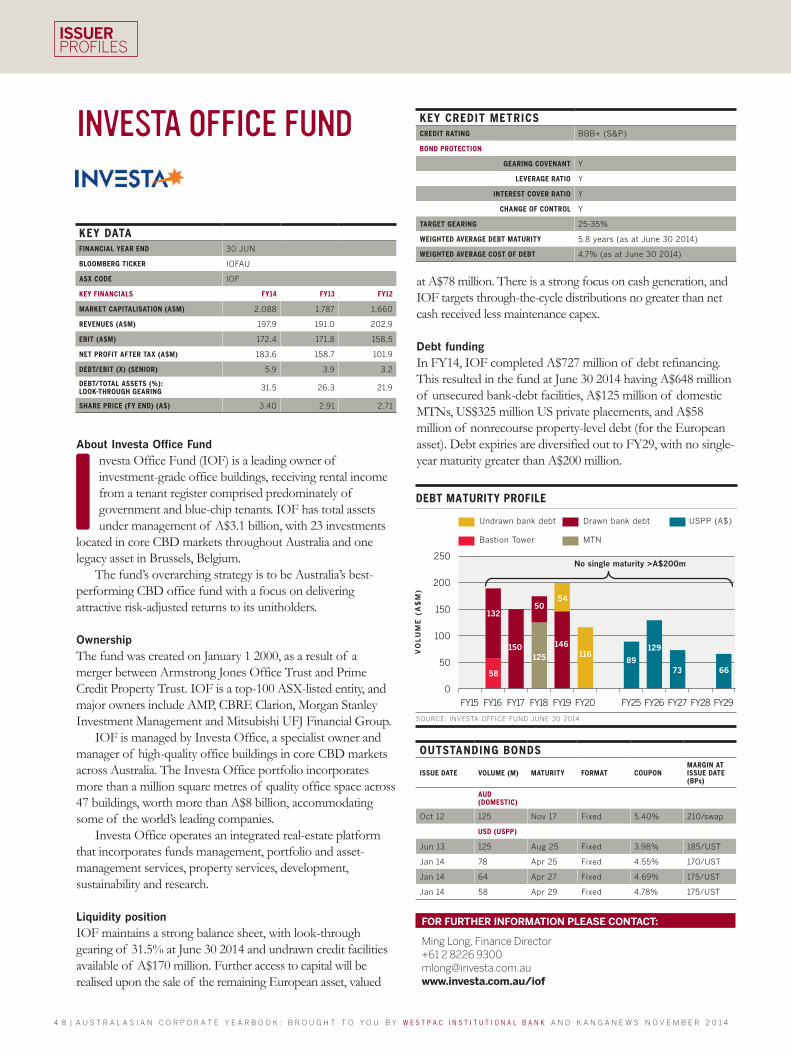
Liquidity positionIOF maintains a strong balance sheet, with look-through gearing of 31.5% at June 30 2014 and undrawn credit facilities available of A$170 million. Further access to capital will be realised upon the sale of the remaining European asset, valued
at A$78 million. There is a strong focus on cash generation, and IOF targets through-the-cycle distributions no greater than net cash received less maintenance capex.
Debt fundingIn FY14, IOF completed A$727 million of debt refinancing. This resulted in the fund at June 30 2014 having A$648 million of unsecured bank-debt facilities, A$125 million of domestic MTNs, US$325 million US private placements, and A$58 million of nonrecourse property-level debt (for the European asset). Debt expiries are diversified out to FY29, with no single-year maturity greater than A$200 million.
KEY CREDIT METRICSCREDIT RATING BBB+ (S&P)
BOND PROTECTION
GEARING COVENANT Y
LEVERAGE RATIO Y
INTEREST COVER RATIO Y
CHANGE OF CONTROL Y
TARGET GEARING 25-35%
WEIGHTED AVERAGE DEBT MATURITY 5.8 years (as at June 30 2014)
WEIGHTED AVERAGE COST OF DEBT 4.7% (as at June 30 2014)
ISSUE DATE VOLUME (M) MATURITY FORMAT COUPON MARGIN AT ISSUE DATE (BPs)
AUD (DOMESTIC)
Oct 12 125 Nov 17 Fixed 5.40% 210/swap
USD (USPP)
Jun 13 125 Aug 25 Fixed 3.98% 185/UST
Jan 14 78 Apr 25 Fixed 4.55% 170/UST
Jan 14 64 Apr 27 Fixed 4.69% 175/UST
Jan 14 58 Apr 29 Fixed 4.78% 175/UST
150
50
11689
132
58
No single maturity >A$200m
125
54
146 129
73 66
4 9
KIWI INCOME PROPERTY TRUST
About Kiwi Income Property Trust
K iwi Income Property Trust (KIPT) is New Zealand’s largest internally managed, listed, diversified property trust by total assets, with NZ$2.1 billion invested in a diversified portfolio of prime office and dominant retail assets located throughout New Zealand. KIPT
was founded in 1992 and became the country’s first listed property trust in 1993.
OwnershipKIPT is a unit trust established under the Unit Trusts Act 1960 by a deed of trust dated August 21 1992 (as amended). KIPT is listed on the NZX as KIP.
Liquidity positionAs at March 31 2014, KIPT had a strong liquidity position with total undrawn bank-debt facilities of NZ$88.5 million. KIPT generates sufficient cash flows from operating activities to meet obligations arising from its financial liabilities.
Debt fundingAt March 31 2014, KIPT had NZ$875 million of debt facilities in place and MCNs on issue totalling NZ$120 million. At March 31 2014, the weighted-average term to maturity of bank-debt facilities was 3.4 years. On June 30 2014, KIPT refinanced NZ$875 million of bank-debt facilities with no bank debt now expiring until KIPT’s 2017 financial year. Additionally, during July and August 2014 the trust issued NZ$125 million of fixed-rate senior-secured bonds. The bonds pay 6.15% interest semi-annually and have a term of seven years. Following completion of the bond offer, the trust cancelled NZ$100 million of bank facilities. The bond issue, in conjunction with the recently
(1) Excludes mandatory convertible notes. (2) Excludes non-operating income and expenses.(3) FY12 and FY13: calculated as bank debt, less MCN proceeds on deposit, over total assets (less MCN proceeds on deposit). FY14: calculated as bank debt over total assets (no MCN proceeds remain on deposit).
* See debt funding section in text for post-balance date update.
announced refinancing of bank-debt facilities, extended the term of KIPT’s debt facilities to 4.3 years (at June 30 2014)from 3.4 years (as at March 31 2014).
DEBT MATURITY PROFILE*
CBAWestpac ANZ BNZ
VO
LU
ME
(N
Z$
M)
350
300
250
200
150
100
50
0
SOURCE: KIWI INCOME PROPERTY TRUST MARCH 31 2014
10040
63
30
100100
28
38
8073
10025
100
FY15 FY16 FY17 FY18 FY19 FY20FY14
* See debt funding section in text for post-balance date update.