Cocos (Keeling) Is. and Christmas Is. - Greer et al. 1 C OCOS (K EELING) I SLANDS AND C HRISTMAS I SLAND: B RIEF HISTORY OF FISHING AND COASTAL CATCHES (1950–2010) 1 Krista Greer, Sarah Harper, Dirk Zeller, and Daniel Pauly Sea Around Us Project, Fisheries Centre, University of British Columbia, 2202 Main Mall, Vancouver, V6T 1Z4, Canada [email protected]; [email protected]; [email protected]; [email protected]ABSTRACT The fisheries statistics systems of many countries are performing poorly, often failing to report small-scale catches, particularly from subsistence and recreational fisheries. These deficiencies, which lead to the underestimation of catches, are particularly evident in overseas territories of developed countries. This study is an attempt to remedy this for the years 1950–2010 for the Australia Indian Ocean Territories, an area from which little reporting is done. The results suggest that the Cocos (Keeling) Islands (which Charles Darwin famously visited in 1836) had a catch of approximately 80 t∙year -1 in the 1950s (subsitence only), which increased, starting in the mid-1980s, to 250 t∙year -1 in recent years mainly due to the introduction of recreational and later large-scale commercial fishing, with signs of overexploitation since 2000. On the other hand, the coastal catch from Christmas Island was tentatively assessed as being higher (40-70 t∙year -1 ) in the 1950s and 1960s than in the 2000s (32 t∙year -1 ). Fisheries managers in these areas should focus on determining primary target species and their vulnerability to overfishing as well as developing island-specific recreational fishing management plans. INTRODUCTION Overexploitation of marine resources continues worldwide despite growing appreciation for the need to maintain marine ecosystem health and biodiversity. Fisheries management has traditionally focused on large-scale commercial operations mainly because of their economic importance and potential for overexploitation. Consequently, fisheries managers have typically ignored a significant portion of the world’s catches – those derived from artisanal, subsistence or recreational fishing (e.g., Zeller et al. 2006; Zeller et al. 2007a; Jacquet et al. 2010; Le Manach et al. 2012). Historically, the importance of subsistence and artisanal fishing operations occurring along much of the world’s coasts has gone unrecognized and subsequently unreported. And in places where reporting has occurred, catch statistics are often too vague to be useful for ecosystem analyses (Watson et al. 2004). The high prevalence of unreported subsistence, artisanal and recreational fisheries represents a critical knowledge gap in fisheries management and subsequent data-users often interpret non-reported or missing data as “zero” catches (Zeller et al. 2007a). Despite the general notion that they are data-poor, small-scale fisheries have recently been demonstrated to play important roles in economics, food security, culture, society and recreation (e.g., Sadovy 2005; Chuenpagdee et al. 2006; Zeller et al. 2007b; Boistol et al. 2011; Lingard et al. 2011; Le Manach et al. 2012). It is thus both necessary and justifiable to retroactively estimate catches using subjective inferences and interpolation methods in order to gain insight into historical catch trends based on the premise that the alternative assumption of zero catch is less desirable (Pauly 2007; Zeller et al. 2007a; Watson et al. 2011). Many small islands, where substantial subsistence fishing occurs, are associated with larger developed countries, for example, Cocos (Keeling) Islands and Christmas Island, which are both Indian Ocean Territories of Australia (Figure 1). Despite this association, these small islands retain much of their traditional way of life, including being heavily dependent on marine resources (Alder et al. 2000). Currently, the small-scale fishing that occurs in these islands is excluded in the reporting of Australian national fisheries statistics. The remote nature of these islands and low urban development often result in them being described as pristine ecosystems (Parks Australia 2005). However, there have been recent reports of local extinctions and significant decreases in the density of highly sought-after marine species, especially in the Cocos (Keeling) Islands (Hender et al. 2001). As such, it is the aim of the present study to apply a “reconstruction approach” 1 Cite as: Greer, K., Harper, S., Zeller, D., and Pauly, D. (2012) Cocos (Keeling) Islands and Christmas Islands: Brief history of fishing and coastal catches (1950-2010). pp. 1-13. In: Harper, S., Zylich, K., Boonzaier, L., Le Manach, F., Pauly, D., and Zeller D. (eds.) Fisheries catch reconstructions: Islands, Part III. Fisheries Centre Research Reports 20(5). Fisheries Centre, University of British Columbia [ISSN 1198-6727]. 100°E 10°S ± 0 300 150 km Cocos (Keeling) Is. Christmas Is. Figure 1. Location of Cocos (Keeling) and Christmas Islands. The gray areas correspond to their respective EEZs.
Transcript
Cocos (Keeling) Is. and Christmas Is. - Greer et al. 1
cocos (Keeling) islands and christmas island: brieF history oF Fishing and coastal catches (1950–2010)1
Krista Greer, Sarah Harper, Dirk Zeller, and Daniel Pauly
Sea Around Us Project, Fisheries Centre, University of British Columbia, 2202 Main Mall, Vancouver, V6T 1Z4, Canada
The fisheries statistics systems of many countries are performing poorly, often failing to report small-scale catches, particularly from subsistence and recreational fisheries. These deficiencies, which lead to the underestimation of catches, are particularly evident in overseas territories of developed countries. This study is an attempt to remedy this for the years 1950–2010 for the Australia Indian Ocean Territories, an area from which little reporting is done. The results suggest that the Cocos (Keeling) Islands (which Charles Darwin famously visited in 1836) had a catch of approximately 80 t∙year-1 in the 1950s (subsitence only), which increased, starting in the mid-1980s, to 250 t∙year-1 in recent years mainly due to the introduction of recreational and later large-scale commercial fishing, with signs of overexploitation since 2000. On the other hand, the coastal catch from Christmas Island was tentatively assessed as being higher (40-70 t∙year-1) in the 1950s and 1960s than in the 2000s (32 t∙year-1). Fisheries managers in these areas should focus on determining primary target species and their vulnerability to overfishing as well as developing island-specific recreational fishing management plans.
introduction
Overexploitation of marine resources continues worldwide despite growing appreciation for the need to maintain marine ecosystem health and biodiversity. Fisheries management has traditionally focused on large-scale commercial operations mainly because of their economic importance and potential for overexploitation. Consequently, fisheries managers have typically ignored a significant portion of the world’s catches – those derived from artisanal, subsistence or recreational fishing (e.g., Zeller et al. 2006; Zeller et al. 2007a; Jacquet et al. 2010; Le Manach et al. 2012). Historically, the importance of subsistence and artisanal fishing operations occurring along much of the world’s coasts has gone unrecognized and subsequently unreported. And in places where reporting has occurred, catch statistics are often too vague to be useful for ecosystem analyses (Watson et al. 2004). The high prevalence of unreported subsistence, artisanal and recreational fisheries represents a critical knowledge gap in fisheries management and subsequent data-users often interpret non-reported or missing data as “zero” catches (Zeller et al. 2007a). Despite the general notion that they are data-poor, small-scale fisheries have recently been demonstrated to play important roles in economics, food security, culture, society and recreation (e.g., Sadovy 2005; Chuenpagdee et al. 2006; Zeller et al. 2007b; Boistol et al. 2011; Lingard et al. 2011; Le Manach et al. 2012). It is thus both necessary and justifiable to retroactively estimate catches using subjective inferences and interpolation methods in order to gain insight into historical catch trends based on the premise that the alternative assumption of zero catch is less desirable (Pauly 2007; Zeller et al. 2007a; Watson et al. 2011).
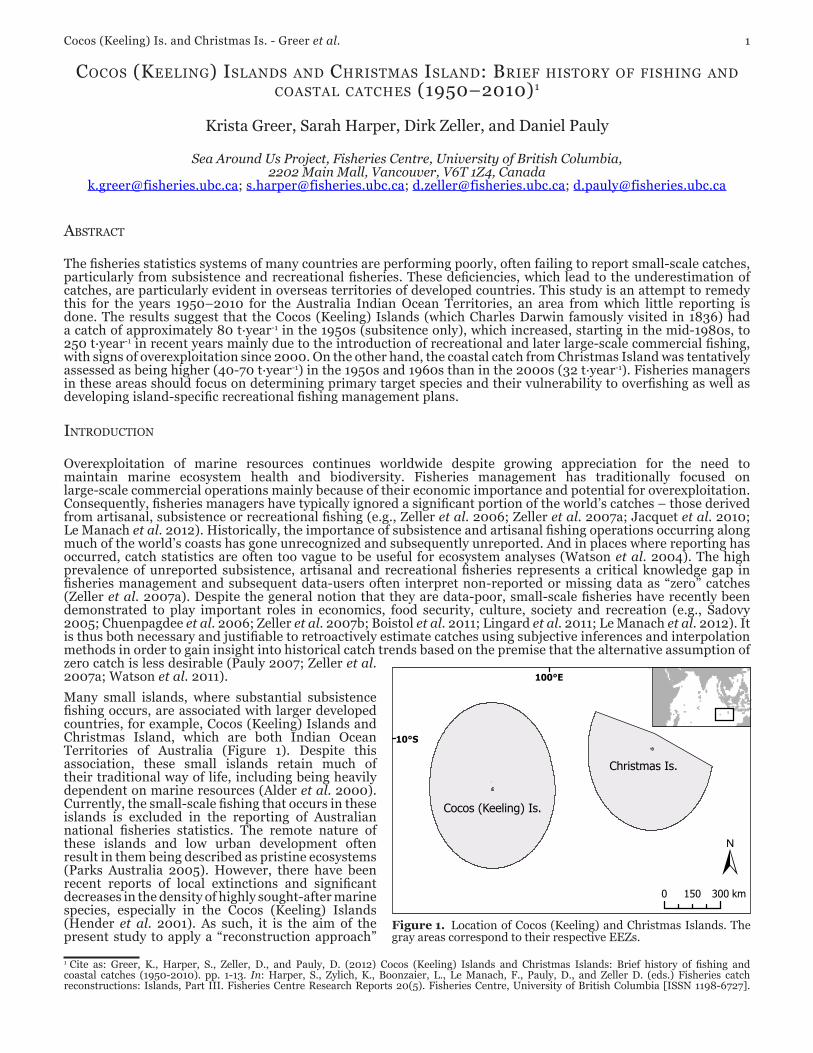
Many small islands, where substantial subsistence fishing occurs, are associated with larger developed countries, for example, Cocos (Keeling) Islands and Christmas Island, which are both Indian Ocean Territories of Australia (Figure 1). Despite this association, these small islands retain much of their traditional way of life, including being heavily dependent on marine resources (Alder et al. 2000). Currently, the small-scale fishing that occurs in these islands is excluded in the reporting of Australian national fisheries statistics. The remote nature of these islands and low urban development often result in them being described as pristine ecosystems (Parks Australia 2005). However, there have been recent reports of local extinctions and significant decreases in the density of highly sought-after marine species, especially in the Cocos (Keeling) Islands (Hender et al. 2001). As such, it is the aim of the present study to apply a “reconstruction approach”
1 Cite as: Greer, K., Harper, S., Zeller, D., and Pauly, D. (2012) Cocos (Keeling) Islands and Christmas Islands: Brief history of fishing and coastal catches (1950-2010). pp. 1-13. In: Harper, S., Zylich, K., Boonzaier, L., Le Manach, F., Pauly, D., and Zeller D. (eds.) Fisheries catch reconstructions: Islands, Part III. Fisheries Centre Research Reports 20(5). Fisheries Centre, University of British Columbia [ISSN 1198-6727].
100°E
10°S
±0 300150 km
Cocos (Keeling) Is.
Christmas Is.
Figure 1. Location of Cocos (Keeling) and Christmas Islands. The gray areas correspond to their respective EEZs.
2 Fisheries catch reconstructions: Islands, Part III
(Zeller et al. 2007a) to derive historic catch time series for the Australian Indian Ocean Territories (AIOT): Cocos (Keeling) Islands (CKI) and Christmas Island (CI). Note that the catch data presented here pertain only to coastal catches, i.e., exclude large pelagic fishes (mainly tuna).
Geographical, environmental and historical review of the island areas
Cocos (Keeling) Islands (12˚12’ S, 96˚54’ E) are situated in the eastern Indian Ocean, lying approximately 2,950 km north-west of Perth, Australia, and about 1,000 km south-west of Java, Indonesia (Figure 1). The CKI consist of 27 low-lying islands, which comprise two atolls: North Keeling and South Keeling. The single island of North Keeling remains uninhabited, and in 1995 was established as Pulu Keeling National Park, where access is by permit only. The park boundaries extend from the coastline to 1.5 km into the surrounding sea (Alder et al. 2000). South Keeling Atoll is comprised of 26 islands, with a total land area of 14 km² (Armstrong 1992). The islands are remote and are thought to have been completely submerged 4,000 years ago, implying that sea level fluctuations have affected shallow water marine biota (Woodroffe and Berry 1994). Endemism is unexpectedly low given the atoll’s isolation.
The South Keeling Islands were first settled in 1827 by John Clunies-Ross and Alexander Hare who brought with them workers from Java and Sumatra (Gibson-Hill 1946). The Clunies-Ross family, which became known as the “King of Cocos,” reigned over the island for more than 150 years (Woodroffe and Berry 1994). The family operated a feudal-style government whereby the Malay population (descendants of the original workforce brought in 1827) worked on the family’s coconut oil plantation in exchange for housing and food. During this period, the islands were annexed by Britain. However, Queen Victoria granted full control of the islands to the Clunies-Ross family “in perpetuity” (Woodroffe and Berry 1994; Kerr 2009).
The CKI are well known among biologists because Charles Darwin on board HMS Beagle visited during the ship’s circumnavigation of the world (Pauly 2004). The Beagle visited the CKI from April 1 to 12, 1836, and this gave Darwin the opportunity to test his theory of coral reef formation, the basic outline of which was thought out well before he had his first (and only) opportunity to study a coral reef during his visit to the CKI (Stoddart 1962; Woodroffe et al. 1990; Armstrong 1991). This theory, which turned out to be correct, was thus developed well before Darwin had all his “facts,” in stark contrast to naïve perceptions of how science works. Here is an observation he recorded in his diary:
I was employed all the day in examining the very interesting yet simple structure & origin of these islands. The water being unusually smooth, I waded in as far as the living mounds of coral on which the swell of the open sea breaks. In some of the gullies & hollows, there were beautiful green & other colored fishes, & the forms & tints of many of the Zoophites were admirable. It is excusable to grow enthusiastic over the infinite numbers of organic beings with which the sea of the tropics, so prodigal of life, teems; yet I must confess I think those naturalists who have described in well-known words the submarine grottoes, decked with a thousand beauties, have indulged in rather extravagant language. (April 4, 1836)
A total of 533 fish species are now reported from the CKI (Allen and Smith-Vaniz 1994), and 11 of those were sampled by Darwin (details in Pauly 2004), who also reported key observations on invertebrates and coral reefs (Armstrong 2004). Referring to “agencies” working against the growth of corals, Darwin also stated that “…some years before our visit unusually heavy rain killed nearly all the fish in the lagoon, and probably the same cause would likewise injure the corals” (in Stoddart 1962).
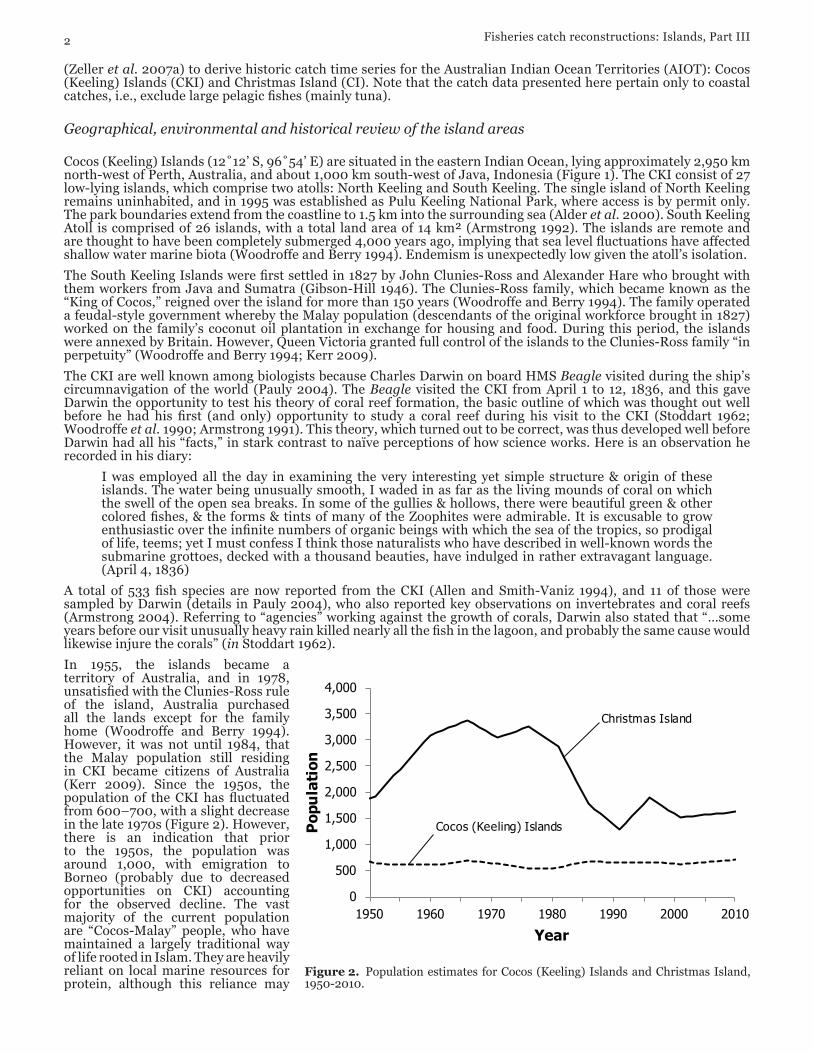
In 1955, the islands became a territory of Australia, and in 1978, unsatisfied with the Clunies-Ross rule of the island, Australia purchased all the lands except for the family home (Woodroffe and Berry 1994). However, it was not until 1984, that the Malay population still residing in CKI became citizens of Australia (Kerr 2009). Since the 1950s, the population of the CKI has fluctuated from 600–700, with a slight decrease in the late 1970s (Figure 2). However, there is an indication that prior to the 1950s, the population was around 1,000, with emigration to Borneo (probably due to decreased opportunities on CKI) accounting for the observed decline. The vast majority of the current population are “Cocos-Malay” people, who have maintained a largely traditional way of life rooted in Islam. They are heavily reliant on local marine resources for protein, although this reliance may
0
500
1,000
1,500
2,000
2,500
3,000
3,500
4,000
1950 1960 1970 1980 1990 2000 2010
Pop
ula
tion
Year
Cocos (Keeling) Islands
Christmas Island
Figure 2. Population estimates for Cocos (Keeling) Islands and Christmas Island, 1950-2010.
Cocos (Keeling) Is. and Christmas Is. - Greer et al. 3
have decreased slightly with mainland Australia’s increasing presence. However, shipped products are expensive and employment opportunities on the island are few. Thus, many locals remain rooted in traditional cuisine and resource use. Culturally important species are the giant clam (Tridacna spp.), spider conch shell (Lambis lambis) and coral trout (Plectropomus leopardus) (Gibson-Hill 1946; Hender et al. 2001). The locals do not consume sharks, but those captured can be sold internationally (Gibson-Hill 1946). Fresh water and land suitable for agriculture are scarce on the islands. A small proportion of the CKI resident population is comprised of Australian expatriates and government workers. It is thought that this portion of the population, relative to the Cocos-Malay people, relies more on resources brought in from mainland Australia, but contributes significantly to a recreational fishing sector. There is a relatively small tourism industry which has been growing, with currently approximately 150 beds available for tourism, and flights occurring 1-2 times a week from Perth, Australia. The main attractions for tourists are fishing and diving.
Christmas Island (10˚30’ S, 105˚40’ E) is located 2,600 km north-west of Perth and 290 km south of Java, Indonesia (Figure 1). Geographically, although part of the same Vening-Meinesz seamount chain, CI differs drastically from CKI. CI is mountainous, surrounded by a fringing reef, which quickly drops off to deep, oceanic water (Hourston 2010). Although less remote than CKI, CI remained unsettled until the late 1800s when the Clunies-Ross family established a permanent settlement to provide lumber for use on CKI (Hourston 2010). Soon after, the settlement expanded to provide workers for phosphate mining. At this time, the islands were annexed by Britain and were later co-managed with Singapore. In 1957, the island was transferred to Australia. The majority of the island has since been designated a national park (Christmas Island National Park).
The population of CI has fluctuated since the 1950s, likely as a result of its boom and bust economy (Roughan et al. 2011), and its current size is approximately 1,600 permanent residents (Figure 2). In addition to phosphate mining, a large casino and resort was opened on the island in 1993, aimed primarily at rich Asian clientele. However, the resort began losing money and was shut down in 1998, causing job losses. The resort has since re-opened without the casino in an attempt to bring jobs and money to the island, but without the potential dire consequences of a casino in a small community. The resort is now one of four, forming the backbone of a small tourism industry. Like the CKI, most tourists come to the island for fishing or diving.
Since the 1970s, boats carrying asylum seekers have come to CI. In 2001, Australia opened the Christmas Island Immigration Detention Centre capable of housing approximately 1,200 asylum seekers (www.immi.gov.au). In 2010, the Australian government reported that there were more than 2,000 asylum seekers residing at the centre (Maley and Taylor 2010). The effect of the detention centre on local resources is unknown.
Much like those of the CKI, the local residents of CI are the descendants of mainly Chinese and Malaysian workers. Resources are brought in from mainland Australia. However, they are expensive and mainly consumed by the small Australian expatriate population. Less is known about the traditional and subsistence needs of the local people on CI than the CKI; however, it is thought that they also rely heavily on local marine resources. The bulk of the research about local biodiversity has focused on the (terrestrial) red crab (Gecarcoidae natalis) and the bird populations. There has been little study on local marine resources, and their level of exploitation and vulnerability remains unknown.
For a detailed description of the Australian acquisition of the CKI and CI, see A Federation of these Seas by Allan Kerr (2009).
methods
The coastal catches of the AIOT have gone unreported; therefore they had to be reconstructed entirely. The methods used in this study were based on the methodology of Zeller et al. (2007). Estimates of marine catches were based on a literature review and utilized single-year anchor points of catch data in tonnes (t), per capita catch rates, human population data, interpolation techniques and anecdotal information. The available coverage in terms of fisheries sectors, targeted species, and culturally important information differed between island areas. Consequently the development of data anchor points also differed between the CKI and CI. The following sections outline, in detail, the methods used for each island territory. It should be noted that this study does not include large-scale commercial catches of high-seas species such as tunas, marlins and sharks.
Cocos (Keeling) Islands
Small-scale fishing
Small-scale fishing on the CKI consists of both subsistence and artisanal fishing. For the purposes of this study, subsistence fishing was defined as any fishing activity that does not generate an income above that needed to live at the most basic subsistence level. In contrast, artisanal fishing is defined as that carried out by individuals or households, involving low investment in technology and gear, whose catch is usually sold locally. A literature search uncovered two anchor points described as subsistence fishing for the years 1992 (Alder et al. 2000) and 1993 (Hender et al. 2001). In order to derive a complete time series of catch estimates we converted these anchor points to an average per capita consumption rate.
4 Fisheries catch reconstructions: Islands, Part III
In order to estimate an average catch rate per capita it was necessary to first estimate the annual human population of the CKI since 1950. The Australian Bureau of Statistics (ABS) has been collecting census data every 5 years since 1986 for the CKI. Prior to 1986, population estimates were found on Populstat (www.populstat.info; accessed: April, 2012) for the following years: 1940, 1951, 1961, 1966, 1971, 1976 and 1981. In order to obtain a complete population time series since 1950, linear interpolation between years of known data was used to estimate the population for unknown years (Figure 2).
The 1992 and 1993 subsistence catch estimates given by Alder et al. (2000) and Hender et al. (2001) were given as ranges. The median for each range was used to calculate an average between the two years. The average population for those two years was also calculated. Therefore the average catch rate in kilograms per capita was calculated by dividing the average catch of 1992 and 1993 by the average population in those years. The average catch rate was found to be 115.11 kg∙person-1∙year-1. We assume that the per capita catch rate in 1950 was the same as for the 1992-1993 period. Thus, we multiplied this average per capita catch rate by the total population size for each year since 1950 to estimate the subsistence catch per year. We also assumed the same catch rate per capita going forward to 2010.
In small communities, it is often difficult to distinguish between fish used strictly for subsistence needs and fish that are sold to generate income for the household. In order to account for artisanal catch, we assumed no market economy existed prior to 1985. The arrival of Australian expatriates and government employees in the mid-1980s, together with a budding tourism industry, stimulated the economy, and hence stimulated the growth of an artisanal sector. As such, it was assumed that 10% of the estimated total subsistence catch turned into artisanal fishing from 1985 onwards. The artisanal catch remained constant at 10%, because resources brought in from mainland Australia are expensive, consequently it is likely that Cocos-Malay people continued to fish for themselves as opposed to transitioning over time to purchasing all their food.
Recreational fishing
Recreational catch can be defined as fishing where the main motivation is not consumption, trade or sale of the catch, but rather enjoyment. It is unlikely that prior to 1985 there was much recreational fishing occurring due to the absence of non-Cocos-Malay people in the CKI. As such, it was assumed that prior to 1985, the recreational catch was zero. For the remaining time period, two anchor points were found; one in 1993 and another in 2001 (Hender et al. 2001). A linear interpolation between a catch of zero tonnes in 1984 and an average recreational catch of 22.5 t in 1992 (Hender et al. 2001) was done to estimate annual recreational catches for the missing years. Similarly, an interpolation was used between the 1992 recreational catch estimate and a 2001 average recreational estimate of 106.2 t (Hender et al. 2001). The observed increase in recreational catches between these two anchor points is large. It is likely erroneous to assume that recreational catches continued to increase at such a rate past 2001, especially when tourism trends are considered (see below).
The tourism industry in the CKI remains relatively small, with regular flights initiated in the early 1990s. In addition, there have been no major developments to increase the tourist capacity on the island within the last decade. As a result, the recreational catch from 2002 until 2010 was estimated using a per tourist catch rate. Hotel occupancy rates for each state since 2001 are available on the ABS website. In order to estimate the occupancy rate for hotels in the CKI, the state of Western Australia’s statistics were used as they are the governing state body of the AIOT. We were able to estimate the number of beds available for tourists on the island (approximately 150) and use the annual average occupancy rate derived from Western Australia statistics to determine the likely number of tourists on the island per year. It was then possible to take the recreational catch known in 2001, divide it by the number of tourists per year to yield a per tourist catch rate of 25 kg assuming that each tourist stays one week. The recreational catch rate from 2002 to 2010 was calculated by multiplying the number of tourists visiting the CKI per year, based on a one-week stay using an average occupancy rate as collected by the Western Australia government. Although the estimated catch of 25 kg per tourist may be high and not all tourists are going to fish, our estimate of recreational catch was considered conservative as the recreational catch of local residents was not estimated in addition to this.
Large-scale commercial fishing
Currently, there appear to be five large-scale commercial fishing licenses on issue, only one of which is considered active and it is a permit for the capture of live aquarium fish (beginning in 1993). Our study does not include fish taken for the aquarium trade, thus these data were excluded. Two more permits (out of the five) were issued beginning in 2002 by the Australian Fisheries Management Authority (AFMA) for exploratory purposes (AFMA 2002). At this time, the total allowable catch (TAC) was set at 20 t per permit annually. It is unknown to the authors whether or not this exploratory fishing continues to occur; the permits are renewed each year, but the fishery may be inactive. When contacted, the AFMA maintained its policy prohibiting the release of catch data to researchers. Thus, we assumed that since the licenses are issued annually, the fishery remains active and catches its total TAC of 20 t. The final two of the five permits issued allow Australian boats to fish for tuna in the CKI and CI offshore longline fisheries. However, these catches were not included here as large pelagic fishes (i.e., tunas) were not considered in this analysis. The total annual catch from 1950 to 2010 was derived by adding the annual catches from subsistence, artisanal, recreational and large-scale commercial fishing sectors.
Cocos (Keeling) Is. and Christmas Is. - Greer et al. 5
Taxonomic breakdown of the catch
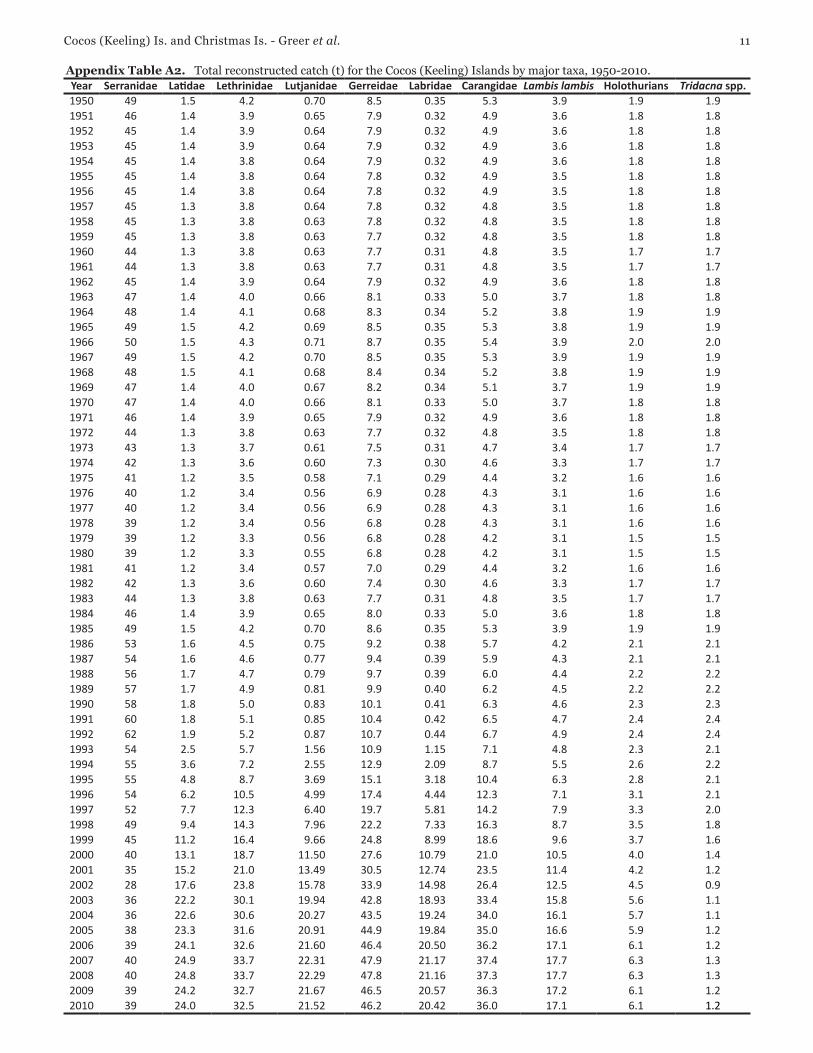
The baseline for determining what species comprise the catch came from an anthropological study completed in the mid-1940s, which outlined the catch supplied to European workers of the Cocos Cable Station over a four-month period by local Cocos-Malay fishers (Gibson-Hill 1946). The lowest taxonomic unit that could be distinguished was the family level, with fish from the families Serranidae, Latidae, Lethrinidae, Lutjanidae, Gerreidae, Labridae and Carangidae all contributing to the catch. The average proportion of each family over the four month period was calculated. When comparing the above list of families with other sources describing fisheries targets, it was found that it was a reasonable representation of reef fish, but failed to incorporate some culturally important species that would have likely been kept and consumed by Cocos-Malay fishers and not given to the European workers (i.e., spider conch shell, giant clam and sea cucumbers). Thus, the proportions were adjusted such that 90% of the catch is comprised of the aforementioned seven reef fish families, with the remaining 10% allocated to spider conch (L. lambis; 5%), sea cucumber (Holothurians; 2.5%) and Tridacna spp. (2.5%).
The above proportions were assumed to be constant from 1950-1992. In 1993 and again in 2001, studies were conducted on the densities of fish on the CKI (Hender et al. 2001). In particular, it was noted that the density of groupers (Serranidae), which made up the highest proportion of the catch in the 1940s, had declined from 136 individuals∙hectare-1 to 36 individuals∙hectare-1 (a decrease of about 75%). It is thus unlikely that the high proportion of Serranidae observed earlier in the catch continued throughout the 1990s. Therefore, we decreased the proportion of Serranidae in the catch in equal increments between the years 1993 and 2002, and increased the contribution of the other reef fish families accordingly. From 2003 onwards, the proportions of the reef fish families were assumed to remain constant.
Similarly, it was found that the giant clam may now be extinct from the near-shore waters of the CKI. According to a study conducted in 2001, there were only two individuals of Tridacna gigas known from the atoll at the time (Hender et al. 2001). In order to account for the change in density of Tridacna spp., the proportion of the total catch was decreased from 2.5% to 0.005% from 1993 to 2002. In order to account for this change, the proportion of spider conch shells increased to make up the difference. The increase in spider conch is justified because prior to contact with mainland Australia, its collection was largely restricted to exposed reefs during low tide whereby women and children would collect them by hand. However, increased access to equipment such as masks and snorkels has made it possible to now access spider conchs in deeper waters (J. Hender, pers. comm., Australian Department of Climate Change and Energy Efficiency).
Christmas Island
Small-scale fishing
Our literature search yielded no quantitative data on subsistence or artisanal fishing on CI. In order to estimate catches for these sectors, a seafood consumption estimate was used. The first step in this approach was to estimate the annual resident population since 1950. This was done in the same manner as for Cocos (Keeling) Island, first using ABS and Populstat (www.populstat.info; accessed: April, 2012) to provide anchor points, followed by linear interpolations between census population estimates (Figure 2). The next step was to determine an estimate of per capita consumption of seafood on CI. The World Health Organization (WHO) suggests that in 1997 the global average was 16 kg of fish per capita with island countries having substantially higher dependence on protein derived from fish (www.who.in.en; accessed: April, 2012). A study conducted by Bell et al. (2009) found fish consumption in the Pacific Islands and territories to be much higher than what was indicated by the WHO. On average, Pacific Island countries and territories consume 50.7 kg per capita per year (Bell et al. 2009). It is likely that CI has fishing habits similar to Pacific countries, but to remain conservative, a per capita consumption rate of 35.5 kg was used for the 1950-1989 time period. Increasing presence from mainland Australia would likely have decreased fish consumption rates due to increased availability of alternative protein sources. Therefore beginning in 1990, we assumed per capita consumption started to decrease so that by the year 2000 it had decreased by 30%. For the remaining years it was assumed that the per capita consumption rate remained constant and the rate for 2000 was thus carried forward, unaltered, to 2010. To remain conservative, only 60% of the population was considered to partake in small-scale fishing throughout the entire time period.
For the purpose of this study, it was necessary to allocate proportions of the total small-scale catch to either subsistence or artisanal sectors. CI has had a stronger presence from mainland Australia than the CKI due to phosphate mining, resort development, asylum seekers, and the development of a large immigration detention centre. Consequently, there has been greater potential for market growth over a longer period of time. Subsistence fishing was considered responsible for 75% of the total small-scale catch and artisanal fishing made up the remaining 25%. These proportions remained unchanged from 1950-2010.
Large-scale commercial fishing
There is one large-scale commercial fishery operating out of CI: the Christmas Island Line Fishery (CILF). It is not known exactly when the fishery opened, but there were six large-scale commercial fishing permits issued as early as 1992 (APH 1997). However, by 2007, there were only three large-scale commercial fishing permits available and only one operating in 2008 (DoF 2009). In keeping with Western Australia’s privacy
Fisheries catch reconstructions: Islands, Part III6
policy, reported catches were not available. As such, catch was estimated since 1992, gradually decreasing the number of boats (assumed to be less than 10 m) fishing for 100 days of the year with a starting catch rate of 30 kg∙day-1. This catch rate was assumed to remain constant for the remainder of the study period.
Recreational fishing
Information on recreational fishing for CI was unavailable. However, it is likely that some recreational fishing does occur, albeit to a lesser extent than on CKI, due to the substantially more inaccessible coast and coastal waters of Christmas Island. It was assumed that recreational fishing in CI also started in 1985 (as in CKI). However, CI did not experience the changes in the tourism industry that CKI did, and therefore does not exhibit the same increase in catches. Catches were assumed to be zero tonnes in 1984, with a conservative estimate of a constant 1 t∙year-1 from 1985-2010.
Taxonomic breakdown of catch
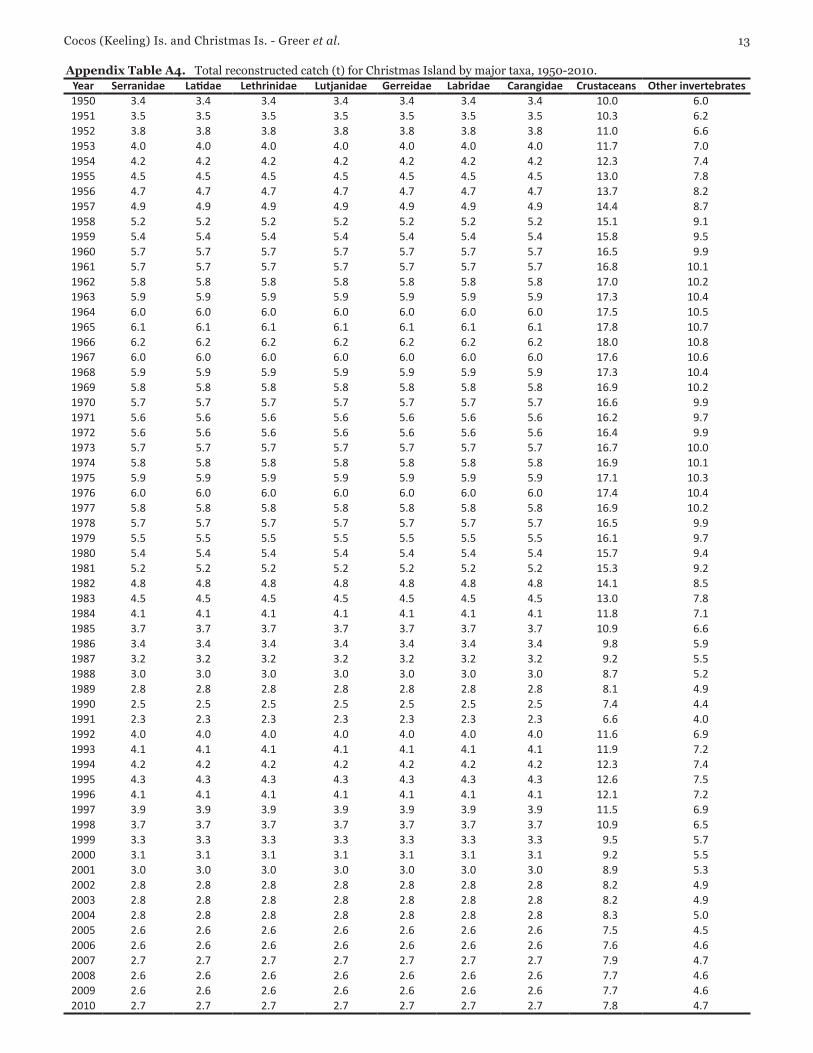
No studies have investigated the species caught from either small-scale fisheries or large-scale commercial fishing on CI. Thus, we used the catch composition established for the CKI, due to similarities between the reef species composition on the two islands, with some small adjustments. We assumed again that seven reef fish families (Serranidae, Latidae, Lethrinidae, Lutjanidae, Gerreidae, Labridae, and Carangidae) comprise 60% of the total catch from 1950–2010, with the remaining 40% divided between crustaceans (25%) and an “other invertebrates” category (15%).
results
Cocos (Keeling) Islands
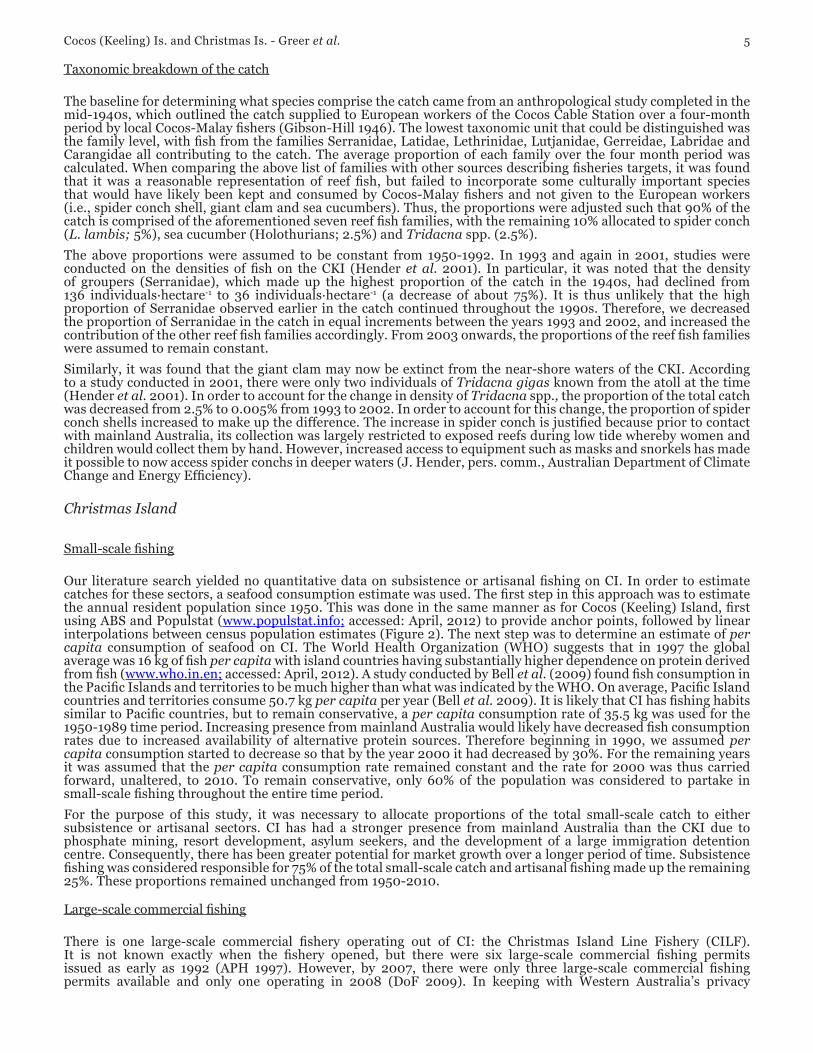
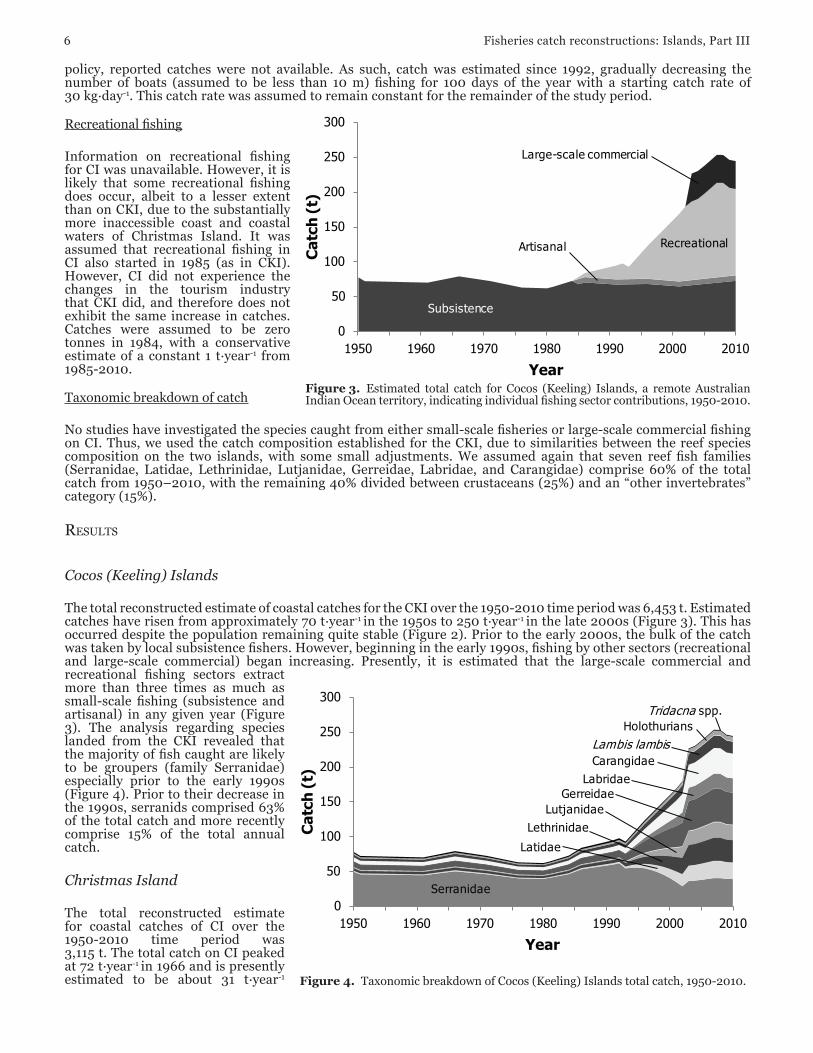
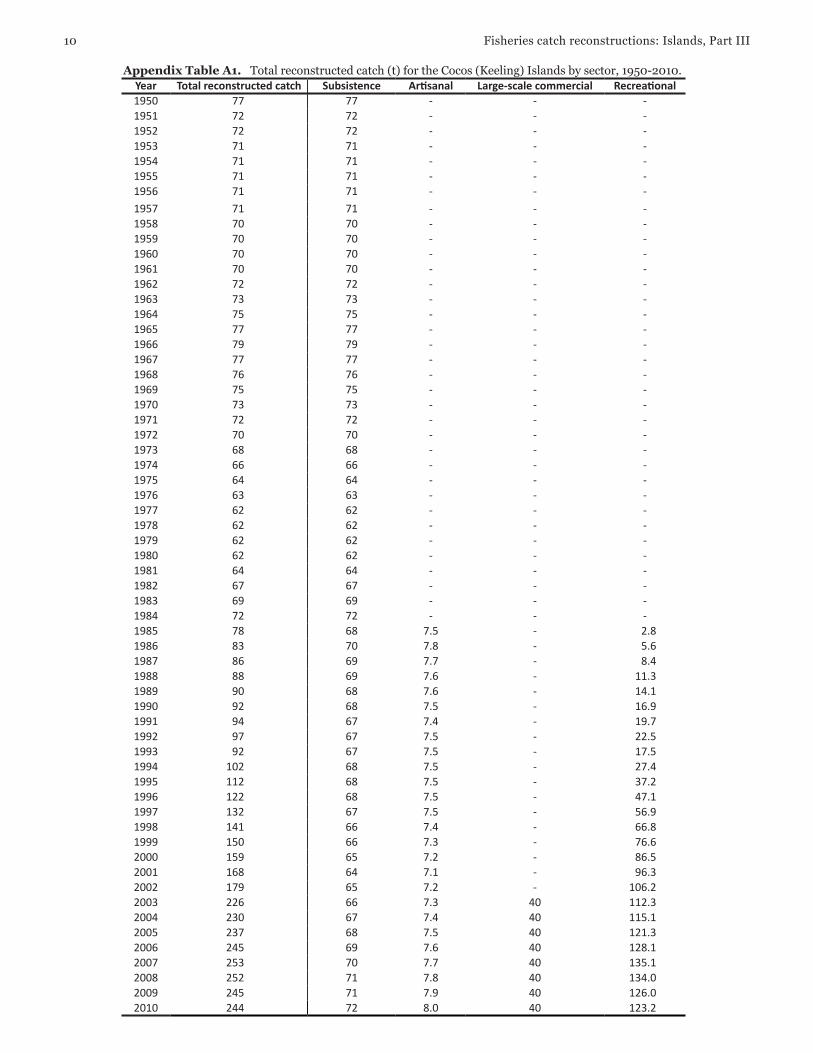
The total reconstructed estimate of coastal catches for the CKI over the 1950-2010 time period was 6,453 t. Estimated catches have risen from approximately 70 t∙year-1 in the 1950s to 250 t∙year-1 in the late 2000s (Figure 3). This has occurred despite the population remaining quite stable (Figure 2). Prior to the early 2000s, the bulk of the catch was taken by local subsistence fishers. However, beginning in the early 1990s, fishing by other sectors (recreational and large-scale commercial) began increasing. Presently, it is estimated that the large-scale commercial and recreational fishing sectors extract more than three times as much as small-scale fishing (subsistence and artisanal) in any given year (Figure 3). The analysis regarding species landed from the CKI revealed that the majority of fish caught are likely to be groupers (family Serranidae) especially prior to the early 1990s (Figure 4). Prior to their decrease in the 1990s, serranids comprised 63% of the total catch and more recently comprise 15% of the total annual catch.
Christmas Island
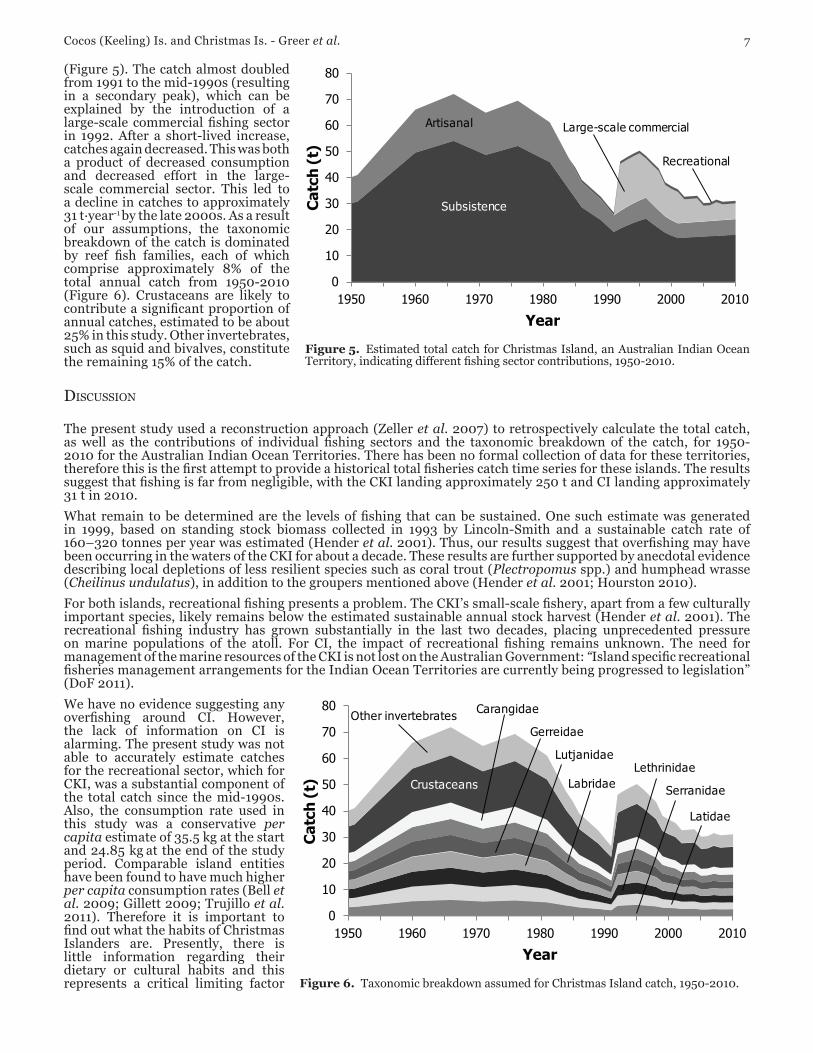
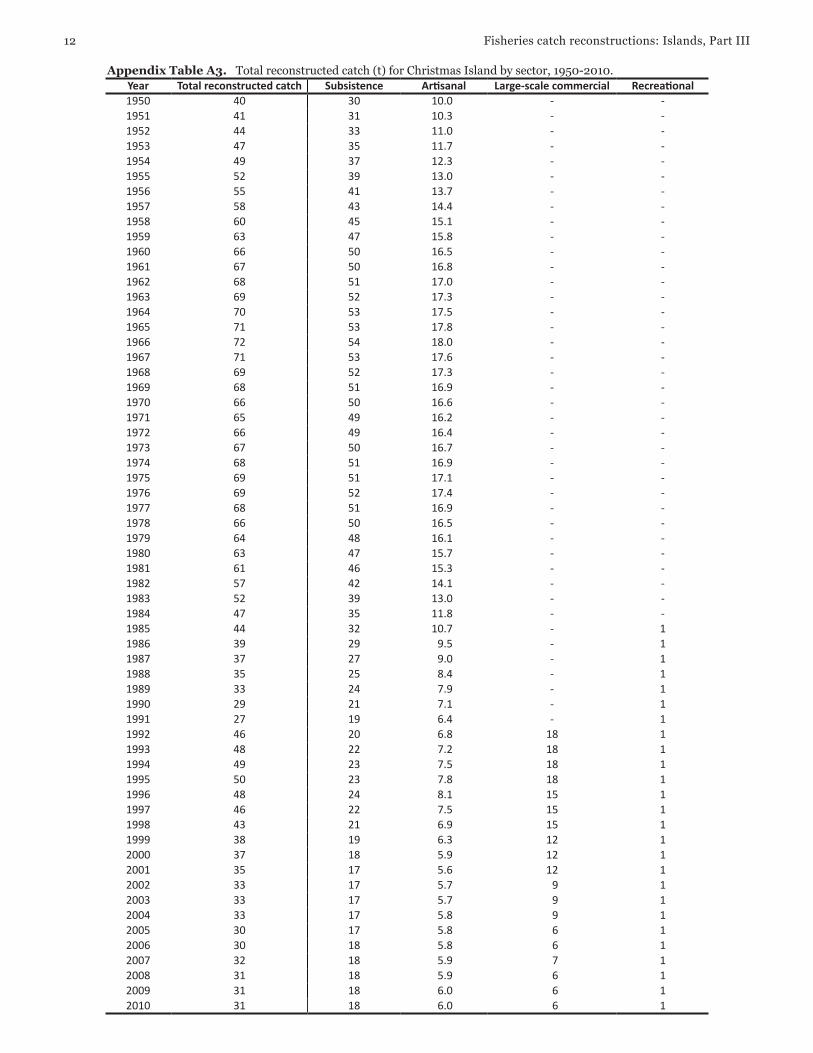
The total reconstructed estimate for coastal catches of CI over the 1950-2010 time period was 3,115 t. The total catch on CI peaked at 72 t∙year-1 in 1966 and is presently estimated to be about 31 t∙year-1
0
50
100
150
200
250
300
1950 1960 1970 1980 1990 2000 2010
Cat
ch (
t)
Year
Latidae
Serranidae
Tridacna spp.Holothurians
Lambis lambisCarangidae
LabridaeGerreidae
LutjanidaeLethrinidae
Figure 4. Taxonomic breakdown of Cocos (Keeling) Islands total catch, 1950-2010.
0
50
100
150
200
250
300
1950 1960 1970 1980 1990 2000 2010
Cat
ch (
t)
Year
Artisanal
Subsistence
Recreational
Large-scale commercial
Figure 3. Estimated total catch for Cocos (Keeling) Islands, a remote Australian Indian Ocean territory, indicating individual fishing sector contributions, 1950-2010.
Cocos (Keeling) Is. and Christmas Is. - Greer et al. 7
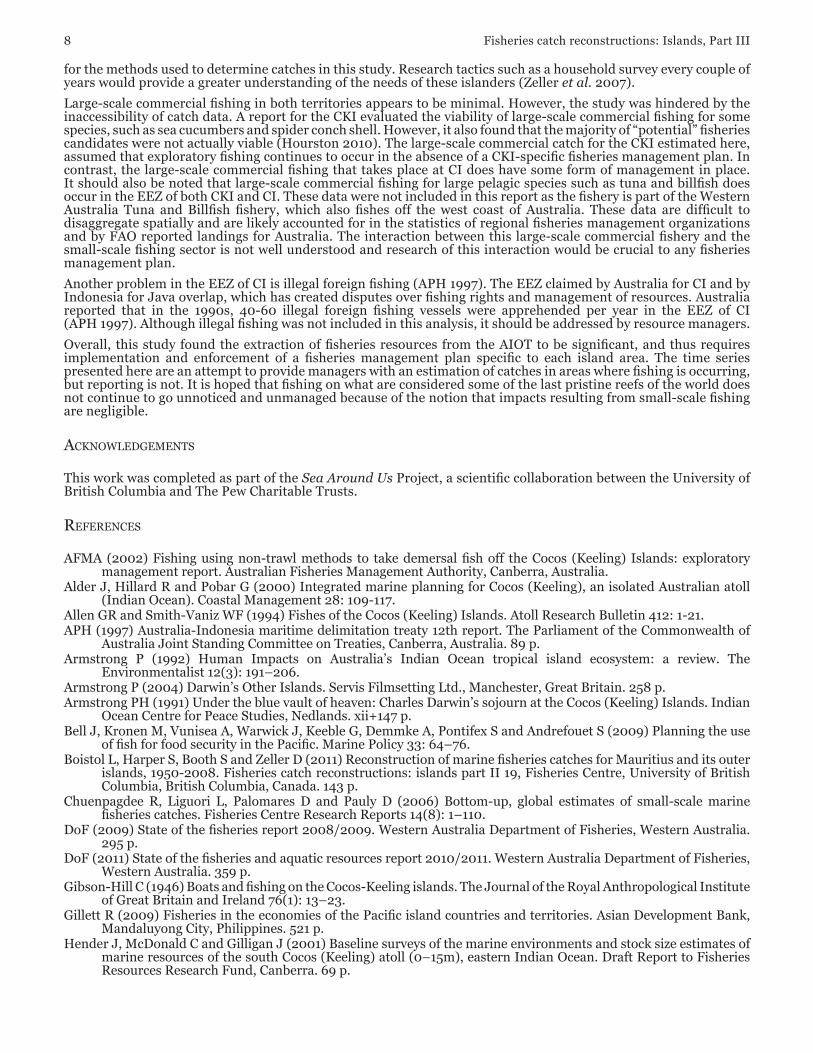
(Figure 5). The catch almost doubled from 1991 to the mid-1990s (resulting in a secondary peak), which can be explained by the introduction of a large-scale commercial fishing sector in 1992. After a short-lived increase, catches again decreased. This was both a product of decreased consumption and decreased effort in the large-scale commercial sector. This led to a decline in catches to approximately 31 t∙year-1 by the late 2000s. As a result of our assumptions, the taxonomic breakdown of the catch is dominated by reef fish families, each of which comprise approximately 8% of the total annual catch from 1950-2010 (Figure 6). Crustaceans are likely to contribute a significant proportion of annual catches, estimated to be about 25% in this study. Other invertebrates, such as squid and bivalves, constitute the remaining 15% of the catch.
discussion
The present study used a reconstruction approach (Zeller et al. 2007) to retrospectively calculate the total catch, as well as the contributions of individual fishing sectors and the taxonomic breakdown of the catch, for 1950-2010 for the Australian Indian Ocean Territories. There has been no formal collection of data for these territories, therefore this is the first attempt to provide a historical total fisheries catch time series for these islands. The results suggest that fishing is far from negligible, with the CKI landing approximately 250 t and CI landing approximately 31 t in 2010.
What remain to be determined are the levels of fishing that can be sustained. One such estimate was generated in 1999, based on standing stock biomass collected in 1993 by Lincoln-Smith and a sustainable catch rate of 160–320 tonnes per year was estimated (Hender et al. 2001). Thus, our results suggest that overfishing may have been occurring in the waters of the CKI for about a decade. These results are further supported by anecdotal evidence describing local depletions of less resilient species such as coral trout (Plectropomus spp.) and humphead wrasse (Cheilinus undulatus), in addition to the groupers mentioned above (Hender et al. 2001; Hourston 2010).
For both islands, recreational fishing presents a problem. The CKI’s small-scale fishery, apart from a few culturally important species, likely remains below the estimated sustainable annual stock harvest (Hender et al. 2001). The recreational fishing industry has grown substantially in the last two decades, placing unprecedented pressure on marine populations of the atoll. For CI, the impact of recreational fishing remains unknown. The need for management of the marine resources of the CKI is not lost on the Australian Government: “Island specific recreational fisheries management arrangements for the Indian Ocean Territories are currently being progressed to legislation” (DoF 2011).
We have no evidence suggesting any overfishing around CI. However, the lack of information on CI is alarming. The present study was not able to accurately estimate catches for the recreational sector, which for CKI, was a substantial component of the total catch since the mid-1990s. Also, the consumption rate used in this study was a conservative per capita estimate of 35.5 kg at the start and 24.85 kg at the end of the study period. Comparable island entities have been found to have much higher per capita consumption rates (Bell et al. 2009; Gillett 2009; Trujillo et al. 2011). Therefore it is important to find out what the habits of Christmas Islanders are. Presently, there is little information regarding their dietary or cultural habits and this represents a critical limiting factor
0
10
20
30
40
50
60
70
80
1950 1960 1970 1980 1990 2000 2010
Cat
ch (
t)
Year
Serranidae
Lutjanidae
Gerreidae
Labridae
Carangidae
Crustaceans
Other invertebrates
Latidae
Lethrinidae
Figure 6. Taxonomic breakdown assumed for Christmas Island catch, 1950-2010.
0
10
20
30
40
50
60
70
80
1950 1960 1970 1980 1990 2000 2010C
atch
(t)
Year
Artisanal
Subsistence
Large-scale commercial
Recreational
Figure 5. Estimated total catch for Christmas Island, an Australian Indian Ocean Territory, indicating different fishing sector contributions, 1950-2010.
Fisheries catch reconstructions: Islands, Part III8
for the methods used to determine catches in this study. Research tactics such as a household survey every couple of years would provide a greater understanding of the needs of these islanders (Zeller et al. 2007).
Large-scale commercial fishing in both territories appears to be minimal. However, the study was hindered by the inaccessibility of catch data. A report for the CKI evaluated the viability of large-scale commercial fishing for some species, such as sea cucumbers and spider conch shell. However, it also found that the majority of “potential” fisheries candidates were not actually viable (Hourston 2010). The large-scale commercial catch for the CKI estimated here, assumed that exploratory fishing continues to occur in the absence of a CKI-specific fisheries management plan. In contrast, the large-scale commercial fishing that takes place at CI does have some form of management in place. It should also be noted that large-scale commercial fishing for large pelagic species such as tuna and billfish does occur in the EEZ of both CKI and CI. These data were not included in this report as the fishery is part of the Western Australia Tuna and Billfish fishery, which also fishes off the west coast of Australia. These data are difficult to disaggregate spatially and are likely accounted for in the statistics of regional fisheries management organizations and by FAO reported landings for Australia. The interaction between this large-scale commercial fishery and the small-scale fishing sector is not well understood and research of this interaction would be crucial to any fisheries management plan.
Another problem in the EEZ of CI is illegal foreign fishing (APH 1997). The EEZ claimed by Australia for CI and by Indonesia for Java overlap, which has created disputes over fishing rights and management of resources. Australia reported that in the 1990s, 40-60 illegal foreign fishing vessels were apprehended per year in the EEZ of CI (APH 1997). Although illegal fishing was not included in this analysis, it should be addressed by resource managers.
Overall, this study found the extraction of fisheries resources from the AIOT to be significant, and thus requires implementation and enforcement of a fisheries management plan specific to each island area. The time series presented here are an attempt to provide managers with an estimation of catches in areas where fishing is occurring, but reporting is not. It is hoped that fishing on what are considered some of the last pristine reefs of the world does not continue to go unnoticed and unmanaged because of the notion that impacts resulting from small-scale fishing are negligible.
acKnowledgements
This work was completed as part of the Sea Around Us Project, a scientific collaboration between the University of British Columbia and The Pew Charitable Trusts.
reFerences
AFMA (2002) Fishing using non-trawl methods to take demersal fish off the Cocos (Keeling) Islands: exploratory management report. Australian Fisheries Management Authority, Canberra, Australia.
Alder J, Hillard R and Pobar G (2000) Integrated marine planning for Cocos (Keeling), an isolated Australian atoll (Indian Ocean). Coastal Management 28: 109-117.
Allen GR and Smith-Vaniz WF (1994) Fishes of the Cocos (Keeling) Islands. Atoll Research Bulletin 412: 1-21.APH (1997) Australia-Indonesia maritime delimitation treaty 12th report. The Parliament of the Commonwealth of
Australia Joint Standing Committee on Treaties, Canberra, Australia. 89 p.Armstrong P (1992) Human Impacts on Australia’s Indian Ocean tropical island ecosystem: a review. The
Environmentalist 12(3): 191–206.Armstrong P (2004) Darwin’s Other Islands. Servis Filmsetting Ltd., Manchester, Great Britain. 258 p.Armstrong PH (1991) Under the blue vault of heaven: Charles Darwin’s sojourn at the Cocos (Keeling) Islands. Indian
Ocean Centre for Peace Studies, Nedlands. xii+147 p.Bell J, Kronen M, Vunisea A, Warwick J, Keeble G, Demmke A, Pontifex S and Andrefouet S (2009) Planning the use
of fish for food security in the Pacific. Marine Policy 33: 64–76.Boistol L, Harper S, Booth S and Zeller D (2011) Reconstruction of marine fisheries catches for Mauritius and its outer
islands, 1950-2008. Fisheries catch reconstructions: islands part II 19, Fisheries Centre, University of British Columbia, British Columbia, Canada. 143 p.
Chuenpagdee R, Liguori L, Palomares D and Pauly D (2006) Bottom-up, global estimates of small-scale marine fisheries catches. Fisheries Centre Research Reports 14(8): 1–110.
DoF (2009) State of the fisheries report 2008/2009. Western Australia Department of Fisheries, Western Australia. 295 p.
DoF (2011) State of the fisheries and aquatic resources report 2010/2011. Western Australia Department of Fisheries, Western Australia. 359 p.
Gibson-Hill C (1946) Boats and fishing on the Cocos-Keeling islands. The Journal of the Royal Anthropological Institute of Great Britain and Ireland 76(1): 13–23.
Gillett R (2009) Fisheries in the economies of the Pacific island countries and territories. Asian Development Bank, Mandaluyong City, Philippines. 521 p.
Hender J, McDonald C and Gilligan J (2001) Baseline surveys of the marine environments and stock size estimates of marine resources of the south Cocos (Keeling) atoll (0–15m), eastern Indian Ocean. Draft Report to Fisheries Resources Research Fund, Canberra. 69 p.
Cocos (Keeling) Is. and Christmas Is. - Greer et al. 9
Hourston M (2010) Review of the exploitation of marine resources of the Australian Indian Ocean Territories: the implications of biogeographic isolation for tropical island fisheries. Fisheries Research Report No. 208, Government of Western Australia, Department of Fisheries. 45 p.
Jacquet JL, Fox H, Motta H, Ngusaru A and Zeller D (2010) Few data but many fish: marine small-scale fisheries catches for Mozambique and Tanzania. African Journal of Marine Science 32(2): 197-206.
Kerr A (2009) Chapter 11: Cocos (Keeling) Islands. pp. 267-315 In Kerr A (ed.) A Federation in these Seas Part 1. Attorney General’s Office, Robert Garrin Offices, Barton, ACT.
Le Manach F, Gough C, Harris A, Humber F, Harper S and Zeller D (2012) Unreported fishing, hungry people and political turmoil: the recipe for a food security crisis in Madagascar. Marine Policy 36: 218-225.
Lingard S, Harper S, Ota Y and Zeller D (2011) Marine fisheries of Palau, 1950-2008: total reconstructed catches. pp. 73-84. In Harper S and Zeller D (eds.) Fisheries catch reconstructions: Islands, Part II. Fisheries Centre Research Reports 19(4), Fisheries Centre, University of British Columbia, Canada.
Maley P and Taylor P (2010) Christmas Island goes over the limit for detainees. The Australian, edition of April 3, 2010. Available at: http://www.theaustralian.com.au/politics/christmas-island-goes-over-the-limit-for-detainees/story-e6frgczf-1225849066781 [Accessed: May, 2012].
Parks Australia (2005) Status of the coral reefs at the Cocos (Keeling) Islands: a report on the status of the marine community at Cocos (Keeling) Islands, east Indian Ocean, 1997–2005. Department of the Environment and Heritage, Australia. 26 p.
Pauly D (2004) Darwin’s fishes: an encyclopedia of ichthyology, ecology and evolution. Cambridge University Press, Cambridge, UK. 340 p.
Pauly D (2007) The Sea Around Us Project: documenting and communicating global fisheries impacts on marine ecosystems. Ambio 36(4): 290-296.
Roughan S, Casement D, Simpson V and Stovell S (2011) A community capacity assessment of the long-term residents of Christmas Island. Rural Solutions, South Australia.
Sadovy Y (2005) Trouble on the reef: the imperative for managing vulnerable and valuable fisheries. Fish and Fisheries 6: 167-185.
Stoddart D (1962) Coral islands by Charles Darwin, with introduction, maps and remarks. Atoll Research Bulletin 88: 1-26.
Trujillo P, Harper S and Zeller D (2011) Reconstruction of Nauru’s fisheries catches: 1950-2008. pp. 63-71. In Harper S and Zeller D (eds.) Fisheries catch reconstructions: Islands, Part II. Fisheries Centre Research Reports 19(4), Fisheries Centre, University of British Columbia, Canada.
Watson R, Kitchingman A, Glechu A and Pauly D (2004) Mapping global fisheries: sharpening our focus. Fish and Fisheries 5: 168-177.
Watson R, Sumaila RU and Zeller D (2011) How much fish is being extracted from the oceans and what is it worth? pp. 55-71 In Christensen V and Maclean J (eds.), Ecosystem approaches to fisheries: a global perspective. Cambridge University Press, Cambridge.
Woodroffe C and Berry P (1994) Scientific studies in the Cocos (Keeling Islands): an introduction. Atoll Research Bulletin 399: 1–16.
Woodroffe C, McLean R and Wallensky E (1990) Darwin’s coral atoll: geomorphology and recent development of the Cocos (Keeling) Islands, Indian Ocean. National Geographic Research 6(3): 262-275.
Zeller D, Booth S, Craig P and Pauly D (2006) Reconstruction of coral reef fisheries catches in American Samoa, 1950-2002. Coral Reefs 25: 144-152.
Zeller D, Booth S, Davis G and Pauly D (2007a) Re-estimation of small-scale fishery catches for U.S. flag-associated island areas in the western Pacific: the last 50 years. Fisheries Bulletin 105: 266-277.
Zeller D, Booth S and Pauly D (2007b) Fisheries contributions to the gross domestic product: underestimating small-scale fisheries in the Pacific. Marine Resource Economics 21: 355-374.
Fisheries catch reconstructions: Islands, Part III10