30 April 2009 CODAR Data Report: Winter 2008-09 1 SMAST Technical Report 09-0206 Transient Tidal Eddy Motion Project CODAR Data Report: WINTER 2008-09 W.S. Brown, S. King, & C. Jakubiak School for Marine Science and Technology University of Massachusetts Dartmouth 1. General Information The Transient Tidal Eddy (TTE) project consisted of field and modeling components that focused on the tidal eddy motion generation and evolution in the region east of Chatham, MA as depicted in Figure 1. The project consisted of a strongly stratified phase in spring 2008 and a weakly stratified phase in winter 2008-09. The winter observation phase of TTE, which spanned 3 November 2008 to 3 February 2009, consisted of shipboard CTD and ADCP surveys, moored ADCP time series measurements, CODAR surface current mapping, and the deployment of a drifter. 0 PGF 1m Figure 1 (right) The site of the field measurement program with elements: the Nauset and Nantucket CODAR sites (triangles), water property measurement transect (black dashed), AUV sampling box (blue), bottom-mounted ADCP/pressure 30m mooring site (diamond); and the NSD mooring site (filled oval); all relative to a schematic eddy and the reference transect (solid red) against a background of regional bathymetry (Courtesy of B. Butman USGS). (left) A model simulation of the full separation of the ebb flow envelop that frames a small clockwise eddy near the coast at 1.55 hr before the “change of tide” from ebb to flood flow. The pressure gradient force vector (PGF; northward arrow) is derived from the model sea level difference between the indicated model mesh nodes (triangles; with PGF–scale below). The current scale and reference transect are shown in red. The filled oval marks the NSD mooring site, at which proxy tidal current predictions are made (see below);
Transcript
30 April 2009 CODAR Data Report: Winter 2008-09
1
SMAST Technical Report 09-0206
Transient Tidal Eddy Motion Project
CODAR Data Report: WINTER 2008-09 W.S. Brown, S. King, & C. Jakubiak School for Marine Science and Technology
University of Massachusetts Dartmouth
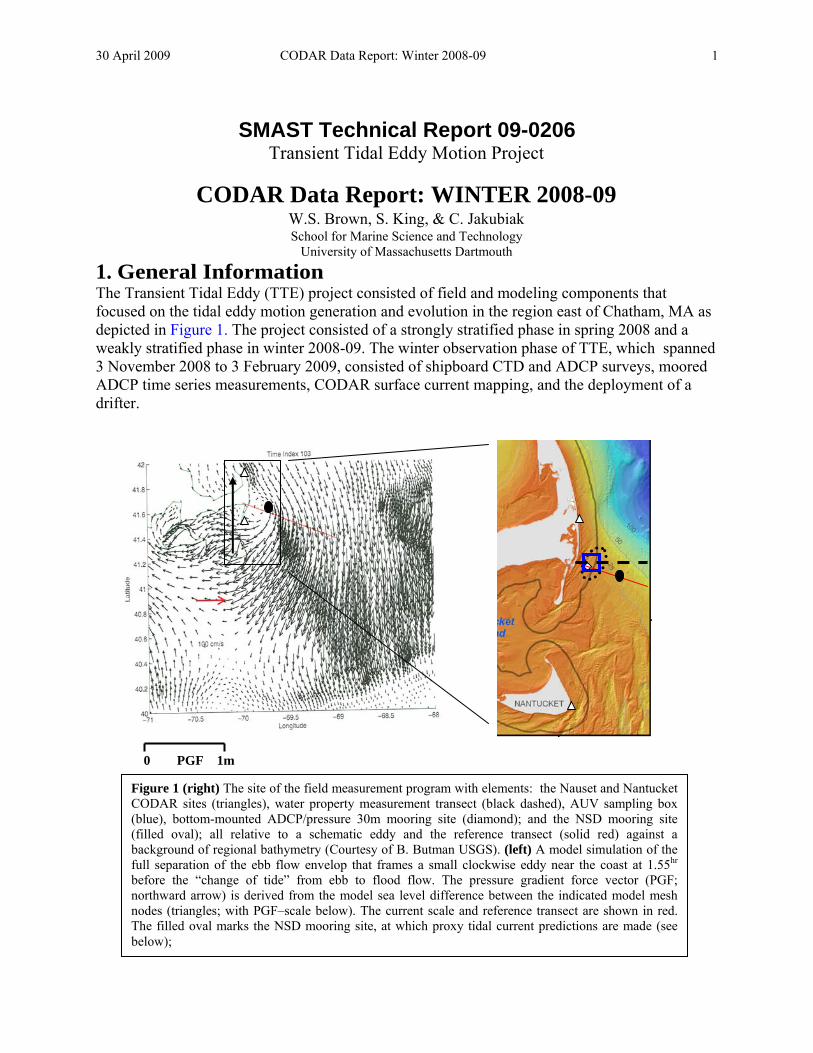
1. General Information The Transient Tidal Eddy (TTE) project consisted of field and modeling components that focused on the tidal eddy motion generation and evolution in the region east of Chatham, MA as depicted in Figure 1. The project consisted of a strongly stratified phase in spring 2008 and a weakly stratified phase in winter 2008-09. The winter observation phase of TTE, which spanned 3 November 2008 to 3 February 2009, consisted of shipboard CTD and ADCP surveys, moored ADCP time series measurements, CODAR surface current mapping, and the deployment of a drifter.
0 PGF 1m
Figure 1 (right) The site of the field measurement program with elements: the Nauset and Nantucket CODAR sites (triangles), water property measurement transect (black dashed), AUV sampling box (blue), bottom-mounted ADCP/pressure 30m mooring site (diamond); and the NSD mooring site (filled oval); all relative to a schematic eddy and the reference transect (solid red) against a background of regional bathymetry (Courtesy of B. Butman USGS). (left) A model simulation of the full separation of the ebb flow envelop that frames a small clockwise eddy near the coast at 1.55hr
before the “change of tide” from ebb to flood flow. The pressure gradient force vector (PGF; northward arrow) is derived from the model sea level difference between the indicated model mesh nodes (triangles; with PGF–scale below). The current scale and reference transect are shown in red. The filled oval marks the NSD mooring site, at which proxy tidal current predictions are made (see below);
30 April 2009 CODAR Data Report: Winter 2008-09
2
Pairs of high frequency radar measurements, such as CODAR, have been shown to provide maps of surface currents over extensive region of the coastal ocean. This report describes CODAR-derived surface current measurements acquired during Winter 2008-09 in support of an MIT Sea Grant-supported investigation of transient tidal eddy motion east of Cape Cod in the Great South Channel section of the western Gulf of Maine (Figure 1). A University of Massachusetts Dartmouth’s (UMassD) CODAR, located at the National Park Service’s Cape Cod National Seashore station near Nauset, MA and a Rutgers University CODAR installation at the Coast Guard station on Nantucket Island are used to produce hourly surface current maps described here. Also described here is the deployment of a surface drifter whose trajectory will be used to evaluate one aspect of the uncertainty of the CODAR-derived surface currents. 2. The CODAR Surface Current Measurements The tidal eddy motion of interest was discovered in surface current maps derived from a pair of 5 MHz long-range CODAR installations facing eastward from Nauset and Nantucket, MA respectively (Figure 2). The CODAR-derived surface current maps are produced as follows.
Figure 2 A schematic of CODAR radials from the Nauset and Nantucket CODAR sites. The nominal spatial resolution of the CODAR surface currents is 6 km. A southeastward-trending “reference transect” (bold line) - to locate tidal eddies - and the 100 m (dot-dash) and 200 m (dotted) isobaths are indicated. The 100-watt CODAR transmits a continuous sequence of 40μsec sweep frequency radar pulse/blank pair eastward from Cape Cod (and Nantucket) through an approximate 150-degree azimuth. Portions of those radar transmissions are backscattered to the CODAR site receiver from surface ocean waves in the “field of view” at ranges between about 5 km beyond the beach to a maximum of about 200 km offshore (depending upon transmission conditions). Using Doppler theory, each site measures the radial components of the ocean surface velocity directed
30 April 2009 CODAR Data Report: Winter 2008-09
3
toward or away from the site (Crombie, 1955; Barrick, 1972; Barrick et al., 1977). Since the systems are using surface gravity waves to estimate these velocity components, the measured currents at this frequency are the weighted average of the currents within the upper one meter of the water column (Stewart and Joy, 1974). The radial data in the region of overlap (Figure 2) were combined into hourly averaged total surface current vector maps on a fixed grid using the CODAR Ocean Sensors software package. Experience (Kohut and Glenn, 2003) has shown that the noise in the returned radar signal can be reduced sufficiently with an hour of averaging to produce meaningful radial surface current estimates. The quality of the UMassD’s CODAR radial current measurements have been assessed through comparisons with measured currents by several investigators including (Chapman et al. 1997). They find that nominal spatial resolution of the surface currents is about 6 km, with an accuracy of about 5 cm/sec when the CODAR beam patterns for the respective sites have been measured (Kohut and Glenn, 2003). See Brown et al. (2009) for the detailed description of the formation of CODAR surface current vectors and issues related to their uncertainties. One approach to assessing the uncertainty of the CODAR surface current maps is to compare pseudo-surface drifter trajectories derived from the CODAR maps with actual drifter trajectories. Toward that end, a surface drifter was deployed at 1630 GMT 27 January 2009 at 41.6907oN and 69.7748oW. The following CODAR-derived surface current maps bracket that deployment and subsequent six hours. CODAR CURRENT MAPS: The CODAR surface current maps bracketing the surface drifter deployment at 1630 GMT 27 January 2009 – a time of changing tidal flow from northward flood to ebb flow- are presented in Figure 3.a through Figure 3.d.
10' 70oW 50' 40' 30' 20' 41oN
10'
20'
30'
40'
50'
42oN
100 cm/s
27 January 2009 1500GMT (1000EST)
10' 70oW 50' 40' 30' 20' 41oN
10'
20'
30'
40'
50'
42oN
100 cm/s
27 January 2009 1600GMT (1100EST)
Figure 3.a The CODAR-derived surface current field for 1500 & 1600GMT 27January2009. The 1600 GMT 27 January 2009 deployment site of the surface drifter is indicated on the 1600 GMT map to the right.
30 April 2009 CODAR Data Report: Winter 2008-09
4
10' 70oW 50' 40' 30' 20' 41oN
10'
20'
30'
40'
50'
42oN
100 cm/s
27 January 2009 1700GMT (1200EST)
10' 70oW 50' 40' 30' 20' 41oN
10'
20'
30'
40'
50'
42oN
100 cm/s
27 January 2009 1800GMT (1300EST)
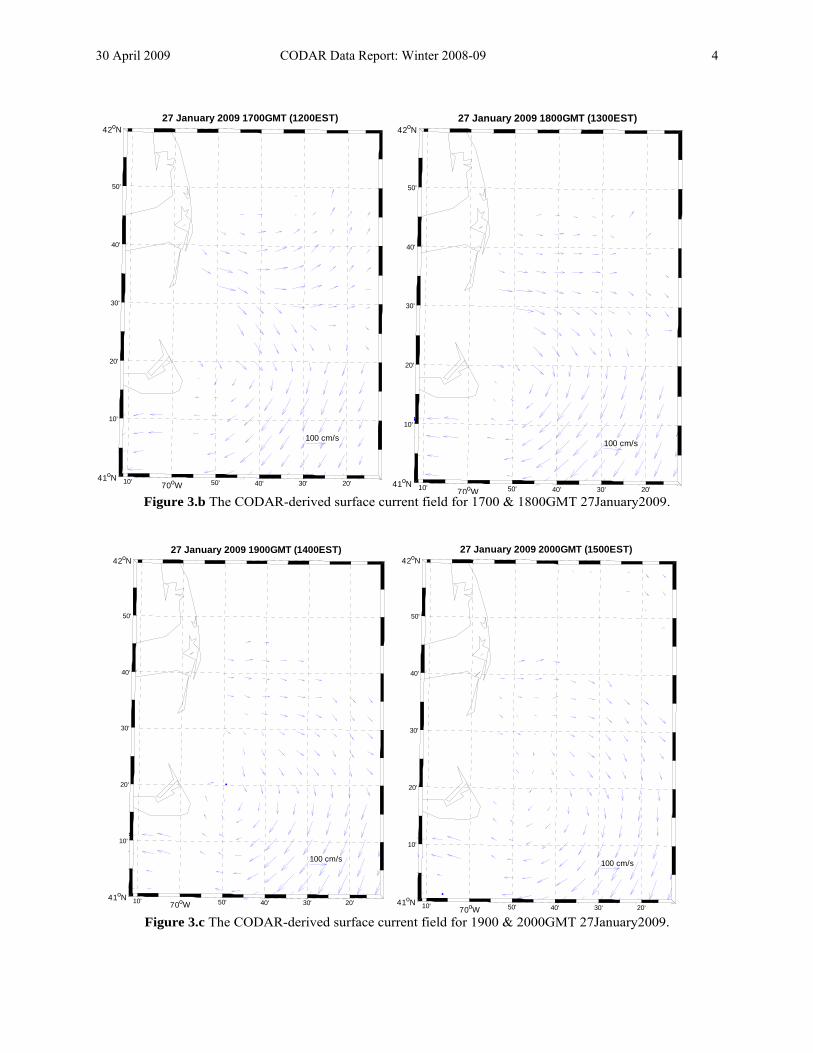
Figure 3.b The CODAR-derived surface current field for 1700 & 1800GMT 27January2009.
10' 70oW 50' 40' 30' 20'
41oN
10'
20'
30'
40'
50'
42oN
100 cm/s
27 January 2009 1900GMT (1400EST)
10' 70oW 50' 40' 30' 20' 41oN
10'
20'
30'
40'
50'
42oN
100 cm/s
27 January 2009 2000GMT (1500EST)
Figure 3.c The CODAR-derived surface current field for 1900 & 2000GMT 27January2009.
30 April 2009 CODAR Data Report: Winter 2008-09
5
10' 70oW 50' 40' 30' 20' 41oN
10'
20'
30'
40'
50'
42oN
100 cm/s
27 January 2009 2100GMT (1600EST)
10' 70oW 50' 40' 30' 20' 41oN
10'
20'
30'
40'
50'
42oN
100 cm/s
27 January 2009 2200GMT (1700EST)
Figure 3.d The CODAR-derived surface current field for 2100 & 2200GMT 27January2009. 3. Surface Drifter Trajectories A surface drifter was deployed at 1630 GMT 27 January 2009 at 41.6907oN and 69.7748oW. The drifter that we deployed was a Manning surface drifter - a Davis-type drifter (Davis, 1985) that was manufactured by students a Southern Maine Community College (SMCC) – to make Lagrangian measurements of the water in the upper meter of the ocean in the TTE study domain. We purchased one Manning drifter and constructed another from parts provided by SMCC. The simple, rugged drifter consists of a PVC pipe that serves as the central mast for a 4 fiberglass arm framework from which four 1m x 0.5m square sails are suspended (Figure 4). A GPS unit transmits its position via the GLOBALSTAR satellite system back to a designated land-based receiver at a user-selected sample interval that can range from a minimum of 35 minutes to 12 hours. (This system was originally designed to track commercial trucks). The movement of all of the ocean-going Manning drifters can be interrogated at http://www.nefsc.noaa.gov/epd/ocean/MainPage/DrifterUpdates.html.
Drifter Deployment – 1600 GMT 27 January 2009 A Manning drifter was deployed about 8 nm east of Chatham, MA at 1600 GMT on 27 January 2009 (see Figure 3a). The drifter was programmed to record its location using GPS every 35 minutes. We note that the time intervals between GPS fixes of the drifter location were very irregular for uncertain reasons over this time; varying between 30 minutes and three days over that time period. However during the first four days between 27 and 31 January 2009 (Figure 5), the interval between of fixes averaged closer to 1 hour.
30 April 2009 CODAR Data Report: Winter 2008-09
6
Figure 4 (left) The Manning Drifter consists of a PVC central mast for 4 fiberglass arms from which four 1m x 0.5m square sails are suspended. A GPS locator unit is contained in a waterproof thin box on the top of the central mast. (right) Fishing net floats are employed to stabilize the sail framework in a wavy ocean.
Figure 5 The surface drifter trajectory between deployment date 27 January (red star) and 31 January 2009.
30 April 2009 CODAR Data Report: Winter 2008-09
7
Over the following 65 days the drifter trajectory tracks southeastward off the shelf (Figure 6a.); taking it out of the CODAR surface current measurement domain (Figure 6b).
We have identified times when the drifter was in the CODAR surface current domain and its fixes were “reasonably regular”. The clusters of CODAR surface current maps for which pseudo-drifter trajectories will be constructed are presented in Appendix A.
Figure 6b Surface drifter trajectory between 27 January and 19 February 2009. Red points show drifter locations within the nominal CODAR coverage region (grey area).
Figure 6a Surface drifter trajectory from 27 January to 19 February 2009.
30 April 2009 CODAR Data Report: Winter 2008-09
8
APPENDIX A. CODAR Current Maps for Drifter Trajectory Estimation Clusters of CODAR surface current maps corresponding to times of satisfactory surface drifter position time series are presented in Figure A.1 through Figure A.6. CODAR maps for Drifter 91191 subset #1
70oW 40' 20' 69oW 40' 20'
30'
45'
41oN
15'
30'
45'
42oN
100 cm/s
27 January 2009 2100GMT
70oW 40' 20' 69oW 40' 20'
30'
45'
41oN
15'
30'
45'
42oN
100 cm/s
27 January 2009 2200GMT
70oW 40' 20' 69oW 40' 20'
30'
45'
41oN
15'
30'
45'
42oN
100 cm/s
27 January 2009 2300GMT
70oW 40' 20' 69oW 40' 20'
30'
45'
41oN
15'
30'
45'
42oN
100 cm/s
28 January 2009 0000GMT
70oW 40' 20' 69oW 40' 20'
30'
45'
41oN
15'
30'
45'
42oN
100 cm/s
28 January 2009 0100GMT
70oW 40' 20' 69oW 40' 20'
30'
45'
41oN
15'
30'
45'
42oN
100 cm/s
28 January 2009 0200GMT
Figure A1.a. The CODAR derived surface current fields corresponding to the first track subset of drifter 91191 (approximately 1/27/09 2100GMT to 1/28/09 1800GMT).
30 April 2009 CODAR Data Report: Winter 2008-09
9
70oW 40' 20' 69oW 40' 20'
30'
45'
41oN
15'
30'
45'
42oN
100 cm/s
28 January 2009 0300GMT
70oW 40' 20' 69oW 40' 20'
30'
45'
41oN
15'
30'
45'
42oN
100 cm/s
28 January 2009 0400GMT
70oW 40' 20' 69oW 40' 20'
30'
45'
41oN
15'
30'
45'
42oN
100 cm/s
28 January 2009 0500GMT
70oW 40' 20' 69oW 40' 20'
30'
45'
41oN
15'
30'
45'
42oN
100 cm/s
28 January 2009 0600GMT
70oW 40' 20' 69oW 40' 20'
30'
45'
41oN
15'
30'
45'
42oN
100 cm/s
28 January 2009 0700GMT
70oW 40' 20' 69oW 40' 20'
30'
45'
41oN
15'
30'
45'
42oN
100 cm/s
28 January 2009 0800GMT
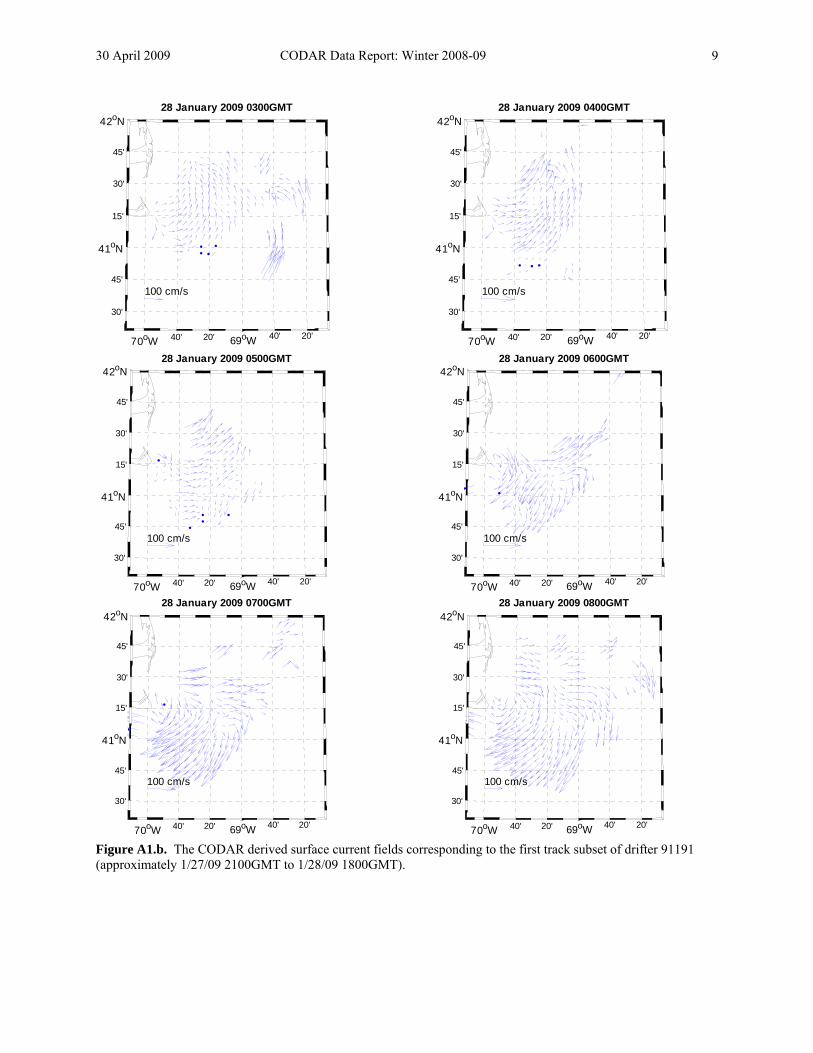
Figure A1.b. The CODAR derived surface current fields corresponding to the first track subset of drifter 91191 (approximately 1/27/09 2100GMT to 1/28/09 1800GMT).
30 April 2009 CODAR Data Report: Winter 2008-09
10
70oW 40' 20' 69oW 40' 20'
30'
45'
41oN
15'
30'
45'
42oN
100 cm/s
28 January 2009 0900GMT
70oW 40' 20' 69oW 40' 20'
30'
45'
41oN
15'
30'
45'
42oN
100 cm/s
28 January 2009 1000GMT
70oW 40' 20' 69oW 40' 20'
30'
45'
41oN
15'
30'
45'
42oN
100 cm/s
28 January 2009 1100GMT
70oW 40' 20' 69oW 40' 20'
30'
45'
41oN
15'
30'
45'
42oN
100 cm/s
28 January 2009 1200GMT
70oW 40' 20' 69oW 40' 20'
30'
45'
41oN
15'
30'
45'
42oN
100 cm/s
28 January 2009 1300GMT
70oW 40' 20' 69oW 40' 20'
30'
45'
41oN
15'
30'
45'
42oN
100 cm/s
28 January 2009 1400GMT
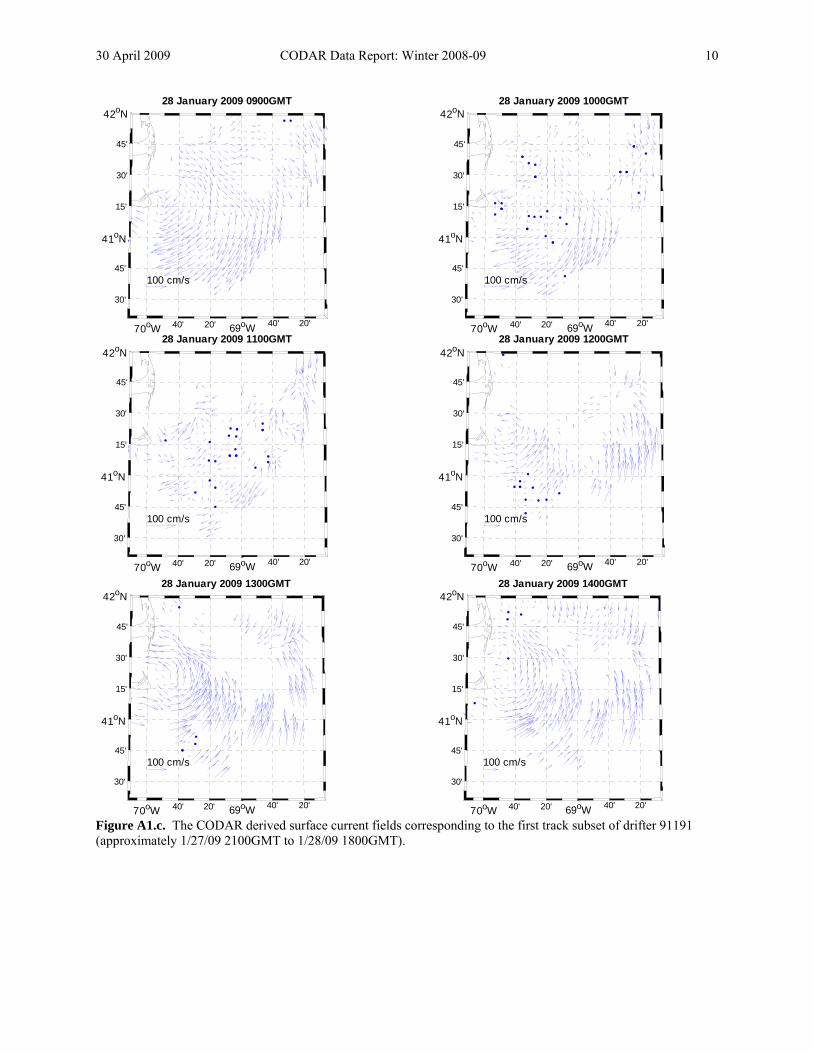
Figure A1.c. The CODAR derived surface current fields corresponding to the first track subset of drifter 91191 (approximately 1/27/09 2100GMT to 1/28/09 1800GMT).
30 April 2009 CODAR Data Report: Winter 2008-09
11
70oW 40' 20' 69oW 40' 20'
30'
45'
41oN
15'
30'
45'
42oN
100 cm/s
28 January 2009 1500GMT
70oW 40' 20' 69oW 40' 20'
30'
45'
41oN
15'
30'
45'
42oN
100 cm/s
28 January 2009 1600GMT
70oW 40' 20' 69oW 40' 20'
30'
45'
41oN
15'
30'
45'
42oN
100 cm/s
28 January 2009 1700GMT
70oW 40' 20' 69oW 40' 20'
30'
45'
41oN
15'
30'
45'
42oN
100 cm/s
28 January 2009 1800GMT
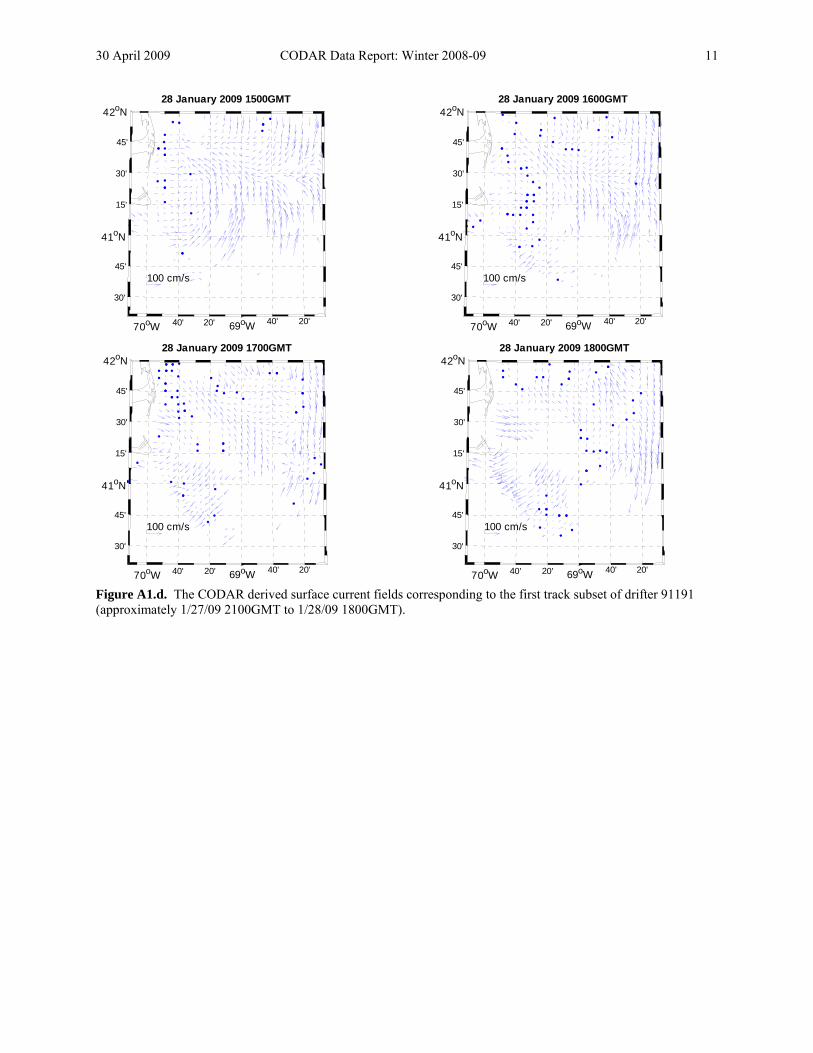
Figure A1.d. The CODAR derived surface current fields corresponding to the first track subset of drifter 91191 (approximately 1/27/09 2100GMT to 1/28/09 1800GMT).
30 April 2009 CODAR Data Report: Winter 2008-09
12
CODAR maps for Drifter 91191 subset #2
70oW 40' 20' 69oW 40' 20'
30'
45'
41oN
15'
30'
45'
42oN
100 cm/s
30 January 2009 1200GMT
70oW 40' 20' 69oW 40' 20'
30'
45'
41oN
15'
30'
45'
42oN
100 cm/s
30 January 2009 1300GMT
70oW 40' 20' 69oW 40' 20'
30'
45'
41oN
15'
30'
45'
42oN
100 cm/s
30 January 2009 1400GMT
70oW 40' 20' 69oW 40' 20'
30'
45'
41oN
15'
30'
45'
42oN
100 cm/s
30 January 2009 1500GMT
70oW 40' 20' 69oW 40' 20'
30'
45'
41oN
15'
30'
45'
42oN
100 cm/s
30 January 2009 1600GMT
70oW 40' 20' 69oW 40' 20'
30'
45'
41oN
15'
30'
45'
42oN
100 cm/s
30 January 2009 1700GMT
Figure A2.a. The CODAR derived surface current fields corresponding to the second track subset of drifter 91191 (approximately 1/30/09 1200GMT to 1/31/09 140000GMT).
30 April 2009 CODAR Data Report: Winter 2008-09
13
70oW 40' 20' 69oW 40' 20'
30'
45'
41oN
15'
30'
45'
42oN
100 cm/s
30 January 2009 1800GMT
70oW 40' 20' 69oW 40' 20'
30'
45'
41oN
15'
30'
45'
42oN
100 cm/s
30 January 2009 1900GMT
70oW 40' 20' 69oW 40' 20'
30'
45'
41oN
15'
30'
45'
42oN
100 cm/s
30 January 2009 2000GMT
70oW 40' 20' 69oW 40' 20'
30'
45'
41oN
15'
30'
45'
42oN
100 cm/s
30 January 2009 2100GMT
70oW 40' 20' 69oW 40' 20'
30'
45'
41oN
15'
30'
45'
42oN
100 cm/s
30 January 2009 2200GMT
70oW 40' 20' 69oW 40' 20'
30'
45'
41oN
15'
30'
45'
42oN
100 cm/s
30 January 2009 2300GMT
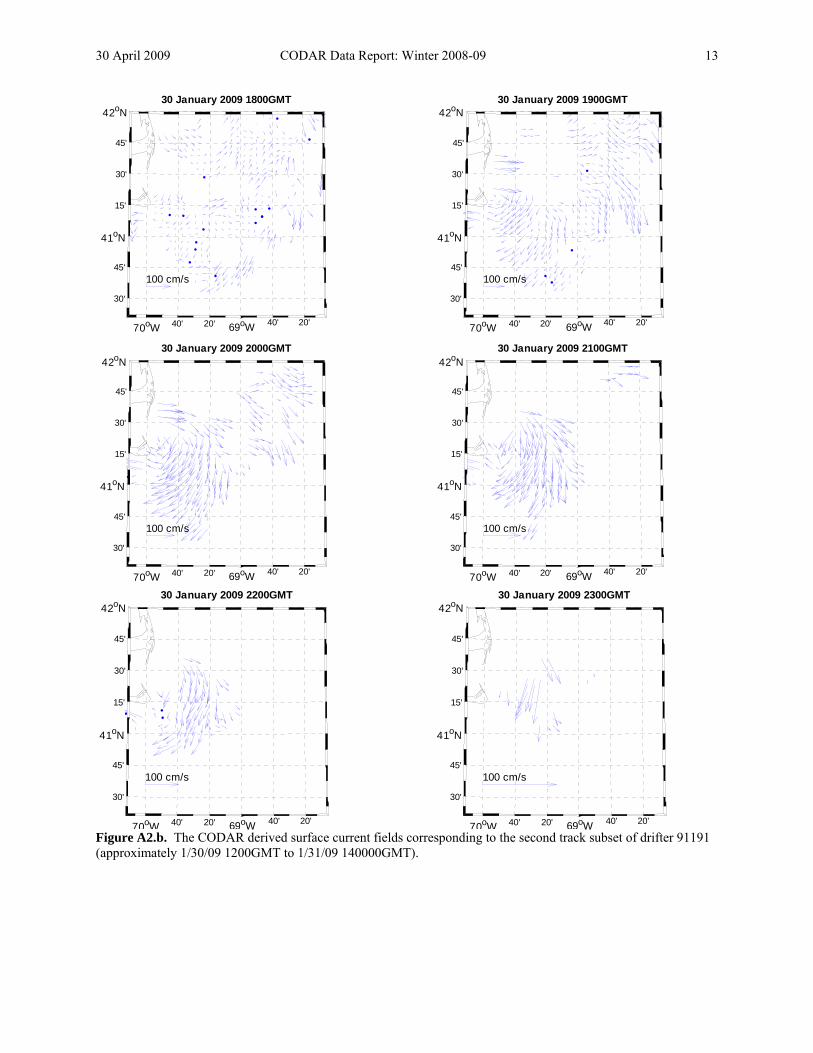
Figure A2.b. The CODAR derived surface current fields corresponding to the second track subset of drifter 91191 (approximately 1/30/09 1200GMT to 1/31/09 140000GMT).
30 April 2009 CODAR Data Report: Winter 2008-09
14
70oW 40' 20' 69oW 40' 20'
30'
45'
41oN
15'
30'
45'
42oN
100 cm/s
31 January 2009 0000GMT
70oW 40' 20' 69oW 40' 20'
30'
45'
41oN
15'
30'
45'
42oN
100 cm/s
31 January 2009 0100GMT
70oW 40' 20' 69oW 40' 20'
30'
45'
41oN
15'
30'
45'
42oN
100 cm/s
31 January 2009 0200GMT
70oW 40' 20' 69oW 40' 20'
30'
45'
41oN
15'
30'
45'
42oN
100 cm/s
31 January 2009 0300GMT
70oW 40' 20' 69oW 40' 20'
30'
45'
41oN
15'
30'
45'
42oN
100 cm/s
31 January 2009 0400GMT
70oW 40' 20' 69oW 40' 20'
30'
45'
41oN
15'
30'
45'
42oN
100 cm/s
31 January 2009 0500GMT
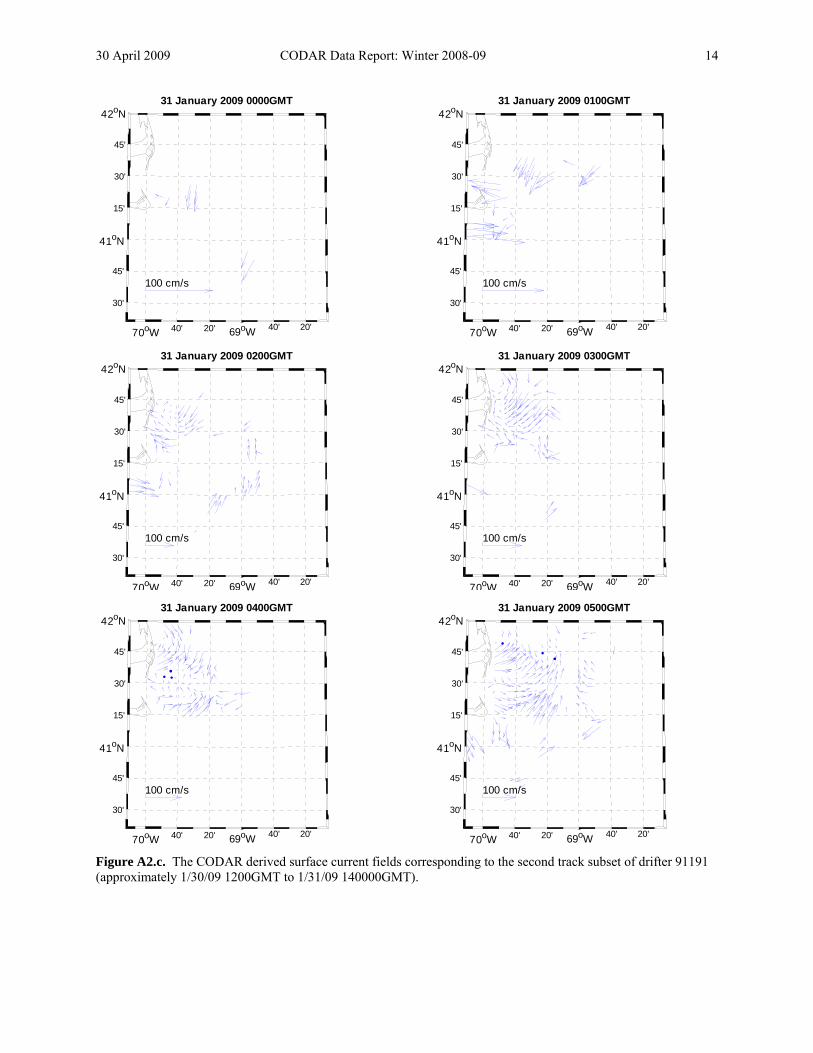
Figure A2.c. The CODAR derived surface current fields corresponding to the second track subset of drifter 91191 (approximately 1/30/09 1200GMT to 1/31/09 140000GMT).
30 April 2009 CODAR Data Report: Winter 2008-09
15
70oW 40' 20' 69oW 40' 20'
30'
45'
41oN
15'
30'
45'
42oN
100 cm/s
31 January 2009 0600GMT
70oW 40' 20' 69oW 40' 20'
30'
45'
41oN
15'
30'
45'
42oN
100 cm/s
31 January 2009 0700GMT
70oW 40' 20' 69oW 40' 20'
30'
45'
41oN
15'
30'
45'
42oN
100 cm/s
31 January 2009 0800GMT
70oW 40' 20' 69oW 40' 20'
30'
45'
41oN
15'
30'
45'
42oN
100 cm/s
31 January 2009 0900GMT
70oW 40' 20' 69oW 40' 20'
30'
45'
41oN
15'
30'
45'
42oN
100 cm/s
31 January 2009 1000GMT
70oW 40' 20' 69oW 40' 20'
30'
45'
41oN
15'
30'
45'
42oN
100 cm/s
31 January 2009 1100GMT
Figure A2.d. The CODAR derived surface current fields corresponding to the second track subset of drifter 91191 (approximately 1/30/09 1200GMT to 1/31/09 140000GMT).
30 April 2009 CODAR Data Report: Winter 2008-09
16
70oW 40' 20' 69oW 40' 20'
30'
45'
41oN
15'
30'
45'
42oN
100 cm/s
31 January 2009 1200GMT
70oW 40' 20' 69oW 40' 20'
30'
45'
41oN
15'
30'
45'
42oN
100 cm/s
31 January 2009 1300GMT
70oW 40' 20' 69oW 40' 20'
30'
45'
41oN
15'
30'
45'
42oN
100 cm/s
31 January 2009 1400GMT
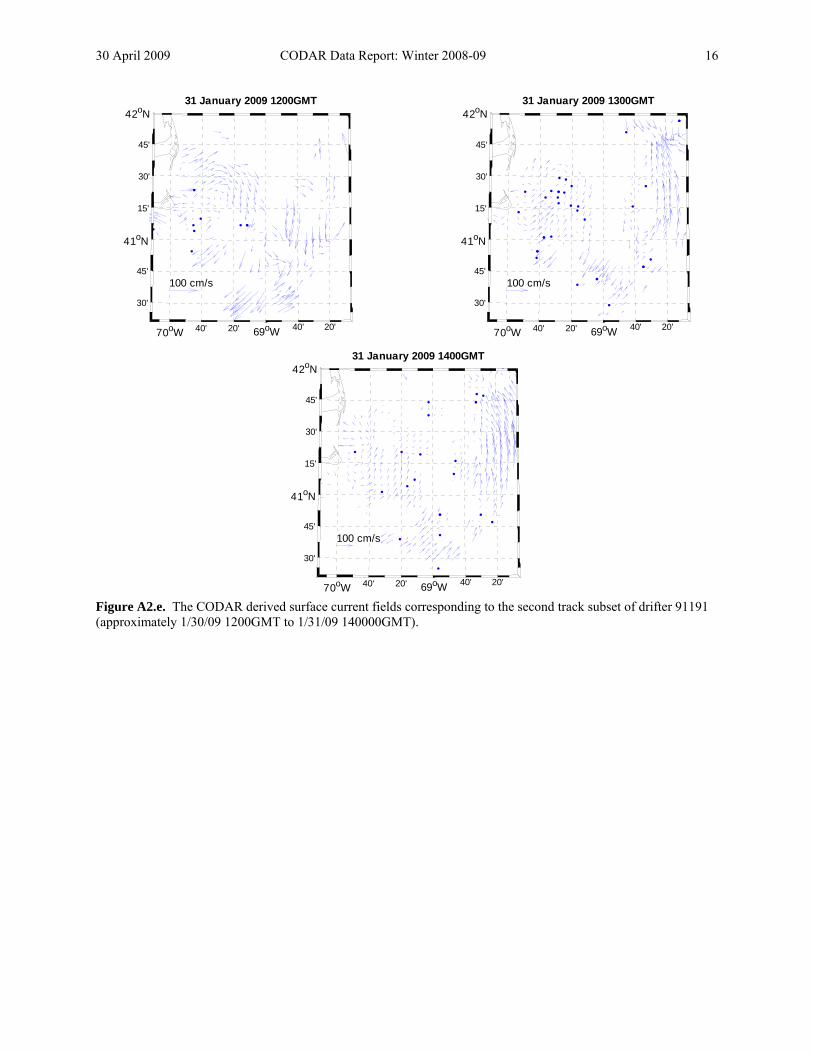
Figure A2.e. The CODAR derived surface current fields corresponding to the second track subset of drifter 91191 (approximately 1/30/09 1200GMT to 1/31/09 140000GMT).
30 April 2009 CODAR Data Report: Winter 2008-09
17
CODAR maps for Drifter 91191 subset #3
70oW 40' 20' 69oW 40' 20'
30'
45'
41oN
15'
30'
45'
42oN
100 cm/s
03 February 2009 0000GMT
70oW 40' 20' 69oW 40' 20'
30'
45'
41oN
15'
30'
45'
42oN
100 cm/s
03 February 2009 0100GMT
70oW 40' 20' 69oW 40' 20'
30'
45'
41oN
15'
30'
45'
42oN
100 cm/s
03 February 2009 020GMT
70oW 40' 20' 69oW 40' 20'
30'
45'
41oN
15'
30'
45'
42oN
100 cm/s
03 February 2009 0300GMT
70oW 40' 20' 69oW 40' 20'
30'
45'
41oN
15'
30'
45'
42oN
100 cm/s
03 February 2009 0400GMT
70oW 40' 20' 69oW 40' 20'
30'
45'
41oN
15'
30'
45'
42oN
100 cm/s
03 February 2009 0500GMT
Figure A3.a. The CODAR derived surface current fields corresponding to the third track subset of drifter 91191 (approximately 2/03/09 0000GMT to 2/04/09 1000GMT).
30 April 2009 CODAR Data Report: Winter 2008-09
18
70oW 40' 20' 69oW 40' 20'
30'
45'
41oN
15'
30'
45'
42oN
100 cm/s
03 February 2009 0600GMT
70oW 40' 20' 69oW 40' 20'
30'
45'
41oN
15'
30'
45'
42oN
100 cm/s
03 February 2009 0700GMT
70oW 40' 20' 69oW 40' 20'
30'
45'
41oN
15'
30'
45'
42oN
100 cm/s
03 February 2009 0800GMT
70oW 40' 20' 69oW 40' 20'
30'
45'
41oN
15'
30'
45'
42oN
100 cm/s
03 February 2009 0900GMT
70oW 40' 20' 69oW 40' 20'
30'
45'
41oN
15'
30'
45'
42oN
100 cm/s
03 February 2009 1000GMT
70oW 40' 20' 69oW 40' 20'
30'
45'
41oN
15'
30'
45'
42oN
100 cm/s
03 February 2009 1100GMT
Figure A3.b. The CODAR derived surface current fields corresponding to the third track subset of drifter 91191 (approximately 2/03/09 0000GMT to 2/04/09 1000GMT).
30 April 2009 CODAR Data Report: Winter 2008-09
19
70oW 40' 20' 69oW 40' 20'
30'
45'
41oN
15'
30'
45'
42oN
100 cm/s
03 February 2009 1200GMT
70oW 40' 20' 69oW 40' 20'
30'
45'
41oN
15'
30'
45'
42oN
100 cm/s
03 February 2009 1300GMT
70oW 40' 20' 69oW 40' 20'
30'
45'
41oN
15'
30'
45'
42oN
100 cm/s
03 February 2009 1400GMT
70oW 40' 20' 69oW 40' 20'
30'
45'
41oN
15'
30'
45'
42oN
100 cm/s
03 February 2009 1500GMT
70oW 40' 20' 69oW 40' 20'
30'
45'
41oN
15'
30'
45'
42oN
100 cm/s
03 February 2009 1600GMT
70oW 40' 20' 69oW 40' 20'
30'
45'
41oN
15'
30'
45'
42oN
100 cm/s
03 February 2009 1700GMT
Figure A3.c. The CODAR derived surface current fields corresponding to the third track subset of drifter 91191 (approximately 2/03/09 0000GMT to 2/04/09 1000GMT).
30 April 2009 CODAR Data Report: Winter 2008-09
20
70oW 40' 20' 69oW 40' 20'
30'
45'
41oN
15'
30'
45'
42oN
100 cm/s
03 February 2009 1800GMT
70oW 40' 20' 69oW 40' 20'
30'
45'
41oN
15'
30'
45'
42oN
100 cm/s
03 February 2009 1900GMT
70oW 40' 20' 69oW 40' 20'
30'
45'
41oN
15'
30'
45'
42oN
100 cm/s
03 February 2009 2000GMT
70oW 40' 20' 69oW 40' 20'
30'
45'
41oN
15'
30'
45'
42oN
100 cm/s
03 February 2009 2100GMT
70oW 40' 20' 69oW 40' 20'
30'
45'
41oN
15'
30'
45'
42oN
100 cm/s
03 February 2009 2200GMT
70oW 40' 20' 69oW 40' 20'
30'
45'
41oN
15'
30'
45'
42oN
100 cm/s
03 February 2009 2300GMT
Figure A3.d. The CODAR derived surface current fields corresponding to the third track subset of drifter 91191 (approximately 2/03/09 0000GMT to 2/04/09 1000GMT).
30 April 2009 CODAR Data Report: Winter 2008-09
21
70oW 40' 20' 69oW 40' 20'
30'
45'
41oN
15'
30'
45'
42oN
100 cm/s
04 February 2009 0000GMT
70oW 40' 20' 69oW 40' 20'
30'
45'
41oN
15'
30'
45'
42oN
100 cm/s
04 February 2009 0100GMT
70oW 40' 20' 69oW 40' 20'
30'
45'
41oN
15'
30'
45'
42oN
100 cm/s
04 February 2009 0200GMT
70oW 40' 20' 69oW 40' 20'
30'
45'
41oN
15'
30'
45'
42oN
100 cm/s
04 February 2009 0300GMT
70oW 40' 20' 69oW 40' 20'
30'
45'
41oN
15'
30'
45'
42oN
100 cm/s
04 February 2009 0400GMT
70oW 40' 20' 69oW 40' 20'
30'
45'
41oN
15'
30'
45'
42oN
100 cm/s
04 February 2009 0500GMT
Figure A3.e. The CODAR derived surface current fields corresponding to the third track subset of drifter 91191 (approximately 2/03/09 0000GMT to 2/04/09 1000GMT).
30 April 2009 CODAR Data Report: Winter 2008-09
22
70oW 40' 20' 69oW 40' 20'
30'
45'
41oN
15'
30'
45'
42oN
100 cm/s
04 February 2009 0600GMT
70oW 40' 20' 69oW 40' 20'
30'
45'
41oN
15'
30'
45'
42oN
100 cm/s
04 February 2009 0700GMT
70oW 40' 20' 69oW 40' 20'
30'
45'
41oN
15'
30'
45'
42oN
100 cm/s
04 February 2009 0800GMT
70oW 40' 20' 69oW 40' 20'
30'
45'
41oN
15'
30'
45'
42oN
100 cm/s
04 February 2009 0900GMT
70oW 40' 20' 69oW 40' 20'
30'
45'
41oN
15'
30'
45'
42oN
100 cm/s
04 February 2009 1000GMT
Figure A3.f. The CODAR derived surface current fields corresponding to the third track subset of drifter 91191 (approximately 2/03/09 0000GMT to 2/04/09 1000GMT).
30 April 2009 CODAR Data Report: Winter 2008-09
23
CODAR maps for Drifter 91191 subset #4
70oW 40' 20' 69oW 40' 20'
30'
45'
41oN
15'
30'
45'
42oN
100 cm/s
10 February 2009 1000GMT
70oW 40' 20' 69oW 40' 20'
30'
45'
41oN
15'
30'
45'
42oN
100 cm/s
10 February 2009 1100GMT
70oW 40' 20' 69oW 40' 20'
30'
45'
41oN
15'
30'
45'
42oN
100 cm/s
10 February 2009 1200GMT
70oW 40' 20' 69oW 40' 20'
30'
45'
41oN
15'
30'
45'
42oN
100 cm/s
10 February 2009 1300GMT
70oW 40' 20' 69oW 40' 20'
30'
45'
41oN
15'
30'
45'
42oN
100 cm/s
10 February 2009 1400GMT
70oW 40' 20' 69oW 40' 20'
30'
45'
41oN
15'
30'
45'
42oN
100 cm/s
10 February 2009 1500GMT
Figure A4.a. The CODAR derived surface current fields corresponding to the fourth track subset of drifter 91191 (approximately 2/10/09 1100GMT to 2/12/09 1500GMT).
30 April 2009 CODAR Data Report: Winter 2008-09
24
70oW 40' 20' 69oW 40' 20'
30'
45'
41oN
15'
30'
45'
42oN
100 cm/s
10 February 2009 1600GMT
70oW 40' 20' 69oW 40' 20'
30'
45'
41oN
15'
30'
45'
42oN
100 cm/s
10 February 2009 1700GMT
70oW 40' 20' 69oW 40' 20'
30'
45'
41oN
15'
30'
45'
42oN
100 cm/s
10 February 2009 1800GMT
70oW 40' 20' 69oW 40' 20'
30'
45'
41oN
15'
30'
45'
42oN
100 cm/s
10 February 2009 1900GMT
70oW 40' 20' 69oW 40' 20'
30'
45'
41oN
15'
30'
45'
42oN
100 cm/s
10 February 2009 2000GMT
70oW 40' 20' 69oW 40' 20'
30'
45'
41oN
15'
30'
45'
42oN
100 cm/s
10 February 2009 2100GMT
Figure A4.b. The CODAR derived surface current fields corresponding to the fourth track subset of drifter 91191 (approximately 2/10/09 1100GMT to 2/12/09 1500GMT).
30 April 2009 CODAR Data Report: Winter 2008-09
25
70oW 40' 20' 69oW 40' 20'
30'
45'
41oN
15'
30'
45'
42oN
100 cm/s
10 February 2009 2200GMT
70oW 40' 20' 69oW 40' 20'
30'
45'
41oN
15'
30'
45'
42oN
100 cm/s
10 February 2009 2300GMT
70oW 40' 20' 69oW 40' 20'
30'
45'
41oN
15'
30'
45'
42oN
100 cm/s
11 February 2009 0000GMT
70oW 40' 20' 69oW 40' 20'
30'
45'
41oN
15'
30'
45'
42oN
100 cm/s
11 February 2009 0100GMT
70oW 40' 20' 69oW 40' 20'
30'
45'
41oN
15'
30'
45'
42oN
100 cm/s
11 February 2009 0200GMT
70oW 40' 20' 69oW 40' 20'
30'
45'
41oN
15'
30'
45'
42oN
100 cm/s
11 February 2009 0300GMT
Figure A4.c. The CODAR derived surface current fields corresponding to the fourth track subset of drifter 91191 (approximately 2/10/09 1100GMT to 2/12/09 1500GMT).
30 April 2009 CODAR Data Report: Winter 2008-09
26
70oW 40' 20' 69oW 40' 20'
30'
45'
41oN
15'
30'
45'
42oN
100 cm/s
11 February 2009 0400GMT
70oW 40' 20' 69oW 40' 20'
30'
45'
41oN
15'
30'
45'
42oN
100 cm/s
11 February 2009 0500GMT
70oW 40' 20' 69oW 40' 20'
30'
45'
41oN
15'
30'
45'
42oN
100 cm/s
11 February 2009 0600GMT
70oW 40' 20' 69oW 40' 20'
30'
45'
41oN
15'
30'
45'
42oN
100 cm/s
11 February 2009 0700GMT
70oW 40' 20' 69oW 40' 20'
30'
45'
41oN
15'
30'
45'
42oN
100 cm/s
11 February 2009 0800GMT
70oW 40' 20' 69oW 40' 20'
30'
45'
41oN
15'
30'
45'
42oN
100 cm/s
11 February 2009 0900GMT
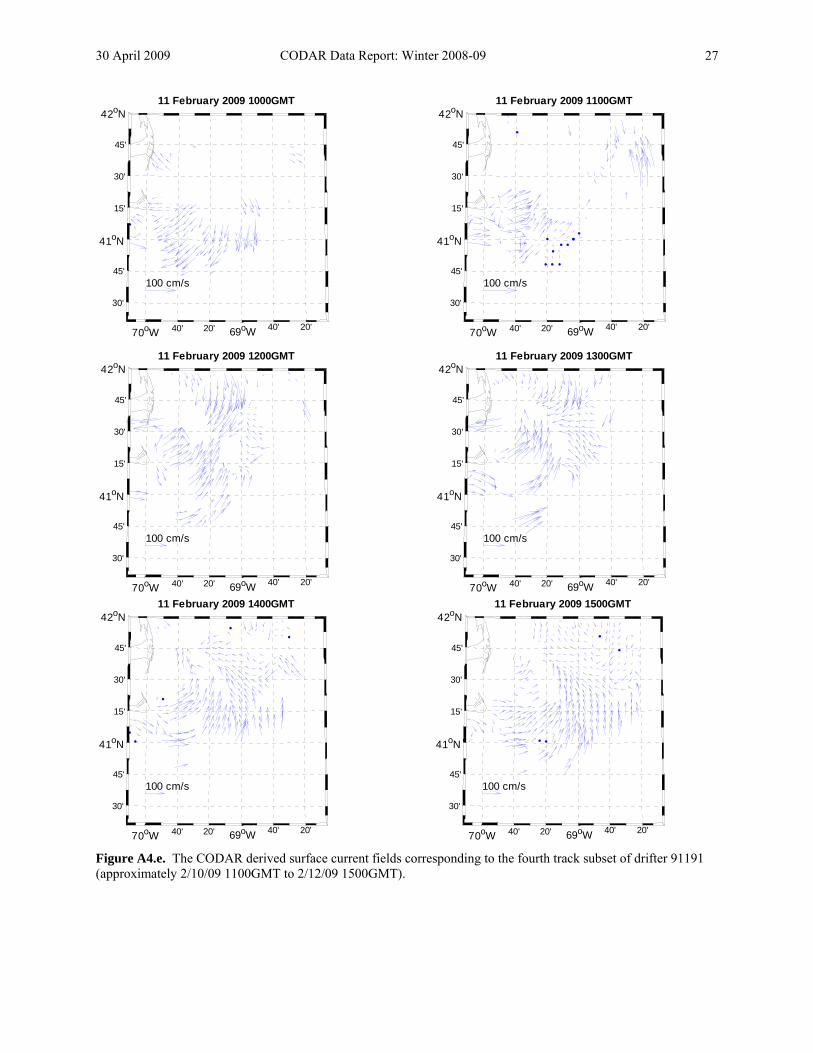
Figure A4.d. The CODAR derived surface current fields corresponding to the fourth track subset of drifter 91191 (approximately 2/10/09 1100GMT to 2/12/09 1500GMT).
30 April 2009 CODAR Data Report: Winter 2008-09
27
70oW 40' 20' 69oW 40' 20'
30'
45'
41oN
15'
30'
45'
42oN
100 cm/s
11 February 2009 1000GMT
70oW 40' 20' 69oW 40' 20'
30'
45'
41oN
15'
30'
45'
42oN
100 cm/s
11 February 2009 1100GMT
70oW 40' 20' 69oW 40' 20'
30'
45'
41oN
15'
30'
45'
42oN
100 cm/s
11 February 2009 1200GMT
70oW 40' 20' 69oW 40' 20'
30'
45'
41oN
15'
30'
45'
42oN
100 cm/s
11 February 2009 1300GMT
70oW 40' 20' 69oW 40' 20'
30'
45'
41oN
15'
30'
45'
42oN
100 cm/s
11 February 2009 1400GMT
70oW 40' 20' 69oW 40' 20'
30'
45'
41oN
15'
30'
45'
42oN
100 cm/s
11 February 2009 1500GMT
Figure A4.e. The CODAR derived surface current fields corresponding to the fourth track subset of drifter 91191 (approximately 2/10/09 1100GMT to 2/12/09 1500GMT).
30 April 2009 CODAR Data Report: Winter 2008-09
28
70oW 40' 20' 69oW 40' 20'
30'
45'
41oN
15'
30'
45'
42oN
100 cm/s
11 February 2009 1600GMT
70oW 40' 20' 69oW 40' 20'
30'
45'
41oN
15'
30'
45'
42oN
100 cm/s
11 February 2009 1700GMT
70oW 40' 20' 69oW 40' 20'
30'
45'
41oN
15'
30'
45'
42oN
100 cm/s
11 February 2009 1800GMT
70oW 40' 20' 69oW 40' 20'
30'
45'
41oN
15'
30'
45'
42oN
100 cm/s
11 February 2009 1900GMT
70oW 40' 20' 69oW 40' 20'
30'
45'
41oN
15'
30'
45'
42oN
100 cm/s
11 February 2009 2000GMT
70oW 40' 20' 69oW 40' 20'
30'
45'
41oN
15'
30'
45'
42oN
100 cm/s
11 February 2009 2100GMT
Figure A4.f. The CODAR derived surface current fields corresponding to the fourth track subset of drifter 91191 (approximately 2/10/09 1100GMT to 2/12/09 1500GMT).
30 April 2009 CODAR Data Report: Winter 2008-09
29
70oW 40' 20' 69oW 40' 20'
30'
45'
41oN
15'
30'
45'
42oN
100 cm/s
11 February 2009 2200GMT
70oW 40' 20' 69oW 40' 20'
30'
45'
41oN
15'
30'
45'
42oN
100 cm/s
11 February 2009 2300GMT
70oW 40' 20' 69oW 40' 20'
30'
45'
41oN
15'
30'
45'
42oN
100 cm/s
12 February 2009 0000GMT
70oW 40' 20' 69oW 40' 20'
30'
45'
41oN
15'
30'
45'
42oN
100 cm/s
12 February 2009 0100GMT
70oW 40' 20' 69oW 40' 20'
30'
45'
41oN
15'
30'
45'
42oN
100 cm/s
12 February 2009 0200GMT
70oW 40' 20' 69oW 40' 20'
30'
45'
41oN
15'
30'
45'
42oN
100 cm/s
12 February 2009 0300GMT
Figure A4.g. The CODAR derived surface current fields corresponding to the fourth track subset of drifter 91191 (approximately 2/10/09 1100GMT to 2/12/09 1500GMT).
30 April 2009 CODAR Data Report: Winter 2008-09
30
70oW 40' 20' 69oW 40' 20'
30'
45'
41oN
15'
30'
45'
42oN
100 cm/s
12 February 2009 0400GMT
70oW 40' 20' 69oW 40' 20'
30'
45'
41oN
15'
30'
45'
42oN
100 cm/s
12 February 2009 0500GMT
70oW 40' 20' 69oW 40' 20'
30'
45'
41oN
15'
30'
45'
42oN
100 cm/s
12 February 2009 0600GMT
70oW 40' 20' 69oW 40' 20'
30'
45'
41oN
15'
30'
45'
42oN
100 cm/s
12 February 2009 0700GMT
70oW 40' 20' 69oW 40' 20'
30'
45'
41oN
15'
30'
45'
42oN
100 cm/s
12 February 2009 0800GMT
70oW 40' 20' 69oW 40' 20'
30'
45'
41oN
15'
30'
45'
42oN
100 cm/s
12 February 2009 0900GMT
Figure A4.h. The CODAR derived surface current fields corresponding to the fourth track subset of drifter 91191 (approximately 2/10/09 1100GMT to 2/12/09 1500GMT).
30 April 2009 CODAR Data Report: Winter 2008-09
31
70oW 40' 20' 69oW 40' 20'
30'
45'
41oN
15'
30'
45'
42oN
100 cm/s
12 February 2009 1000GMT
70oW 40' 20' 69oW 40' 20'
30'
45'
41oN
15'
30'
45'
42oN
100 cm/s
12 February 2009 1100GMT
70oW 40' 20' 69oW 40' 20'
30'
45'
41oN
15'
30'
45'
42oN
100 cm/s
12 February 2009 1200GMT
70oW 40' 20' 69oW 40' 20'
30'
45'
41oN
15'
30'
45'
42oN
100 cm/s
12 February 2009 1300GMT
70oW 40' 20' 69oW 40' 20'
30'
45'
41oN
15'
30'
45'
42oN
100 cm/s
12 February 2009 1400GMT
70oW 40' 20' 69oW 40' 20'
30'
45'
41oN
15'
30'
45'
42oN
100 cm/s
12 February 2009 1500GMT
Figure A4.i. The CODAR derived surface current fields corresponding to the fourth track subset of drifter 91191 (approximately 2/10/09 1100GMT to 2/12/09 1500GMT).
30 April 2009 CODAR Data Report: Winter 2008-09
32
CODAR maps for Drifter 91191 subset #5
70oW 40' 20' 69oW 40' 20'
30'
45'
41oN
15'
30'
45'
42oN
100 cm/s
16 February 2009 0800GMT
70oW 40' 20' 69oW 40' 20'
30'
45'
41oN
15'
30'
45'
42oN
100 cm/s
16 February 2009 0900GMT
70oW 40' 20' 69oW 40' 20'
30'
45'
41oN
15'
30'
45'
42oN
100 cm/s
16 February 2009 1000GMT
70oW 40' 20' 69oW 40' 20'
30'
45'
41oN
15'
30'
45'
42oN
100 cm/s
16 February 2009 1100GMT
70oW 40' 20' 69oW 40' 20'
30'
45'
41oN
15'
30'
45'
42oN
100 cm/s
16 February 2009 1200GMT
70oW 40' 20' 69oW 40' 20'
30'
45'
41oN
15'
30'
45'
42oN
100 cm/s
16 February 2009 1300GMT
Figure A5.a. The CODAR derived surface current fields corresponding to the fifth track subset of drifter 91191 (approximately 2/16/09 0700GMT to 2/16/09 2100GMT).
30 April 2009 CODAR Data Report: Winter 2008-09
33
70oW 40' 20' 69oW 40' 20'
30'
45'
41oN
15'
30'
45'
42oN
100 cm/s
16 February 2009 1400GMT
70oW 40' 20' 69oW 40' 20'
30'
45'
41oN
15'
30'
45'
42oN
100 cm/s
16 February 2009 1500GMT
70oW 40' 20' 69oW 40' 20'
30'
45'
41oN
15'
30'
45'
42oN
100 cm/s
16 February 2009 1600GMT
70oW 40' 20' 69oW 40' 20'
30'
45'
41oN
15'
30'
45'
42oN
100 cm/s
16 February 2009 1700GMT
70oW 40' 20' 69oW 40' 20'
30'
45'
41oN
15'
30'
45'
42oN
100 cm/s
16 February 2009 1800GMT
70oW 40' 20' 69oW 40' 20'
30'
45'
41oN
15'
30'
45'
42oN
100 cm/s
16 February 2009 1900GMT
Figure A5.b. The CODAR derived surface current fields corresponding to the fifth track subset of drifter 91191 (approximately 2/16/09 0700GMT to 2/16/09 2100GMT).
30 April 2009 CODAR Data Report: Winter 2008-09
34
70oW 40' 20' 69oW 40' 20'
30'
45'
41oN
15'
30'
45'
42oN
100 cm/s
16 February 2009 2000GMT
70oW 40' 20' 69oW 40' 20'
30'
45'
41oN
15'
30'
45'
42oN
100 cm/s
16 February 2009 2100GMT
Figure A5.c. The CODAR derived surface current fields corresponding to the fifth track subset of drifter 91191 (approximately 2/16/09 0700GMT to 2/16/09 2100GMT).
30 April 2009 CODAR Data Report: Winter 2008-09
35
CODAR maps for Drifter 91191 subset #6
70oW 40' 20' 69oW 40' 20'
30'
45'
41oN
15'
30'
45'
42oN
100 cm/s
18 February 2009 0000GMT
70oW 40' 20' 69oW 40' 20'
30'
45'
41oN
15'
30'
45'
42oN
100 cm/s
18 February 2009 0100GMT
70oW 40' 20' 69oW 40' 20'
30'
45'
41oN
15'
30'
45'
42oN
100 cm/s
18 February 2009 0200GMT
70oW 40' 20' 69oW 40' 20'
30'
45'
41oN
15'
30'
45'
42oN
100 cm/s
18 February 2009 0300GMT
70oW 40' 20' 69oW 40' 20'
30'
45'
41oN
15'
30'
45'
42oN
100 cm/s
18 February 2009 0400GMT
70oW 40' 20' 69oW 40' 20'
30'
45'
41oN
15'
30'
45'
42oN
100 cm/s
18 February 2009 0500GMT
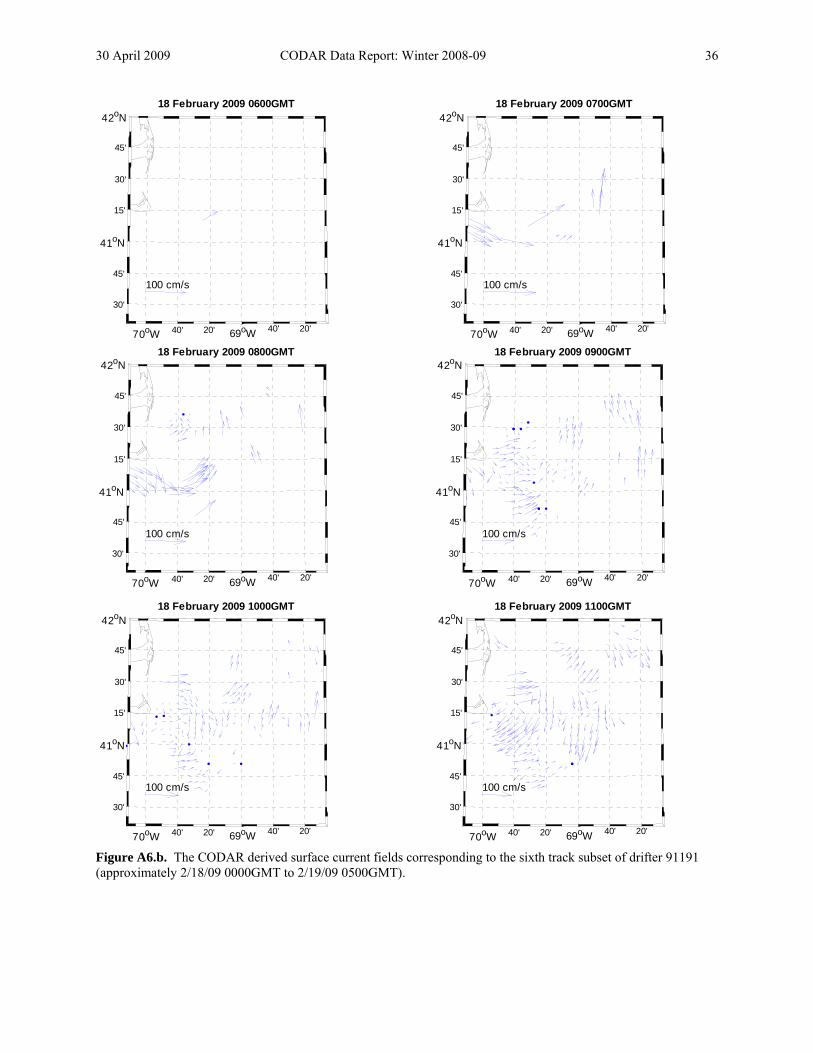
Figure A6.a. The CODAR derived surface current fields corresponding to the sixth track subset of drifter 91191 (approximately 2/18/09 0000GMT to 2/19/09 0500GMT).
30 April 2009 CODAR Data Report: Winter 2008-09
36
70oW 40' 20' 69oW 40' 20'
30'
45'
41oN
15'
30'
45'
42oN
100 cm/s
18 February 2009 0600GMT
70oW 40' 20' 69oW 40' 20'
30'
45'
41oN
15'
30'
45'
42oN
100 cm/s
18 February 2009 0700GMT
70oW 40' 20' 69oW 40' 20'
30'
45'
41oN
15'
30'
45'
42oN
100 cm/s
18 February 2009 0800GMT
70oW 40' 20' 69oW 40' 20'
30'
45'
41oN
15'
30'
45'
42oN
100 cm/s
18 February 2009 0900GMT
70oW 40' 20' 69oW 40' 20'
30'
45'
41oN
15'
30'
45'
42oN
100 cm/s
18 February 2009 1000GMT
70oW 40' 20' 69oW 40' 20'
30'
45'
41oN
15'
30'
45'
42oN
100 cm/s
18 February 2009 1100GMT
Figure A6.b. The CODAR derived surface current fields corresponding to the sixth track subset of drifter 91191 (approximately 2/18/09 0000GMT to 2/19/09 0500GMT).
30 April 2009 CODAR Data Report: Winter 2008-09
37
70oW 40' 20' 69oW 40' 20'
30'
45'
41oN
15'
30'
45'
42oN
100 cm/s
18 February 2009 1200GMT
70oW 40' 20' 69oW 40' 20'
30'
45'
41oN
15'
30'
45'
42oN
100 cm/s
18 February 2009 1300GMT
70oW 40' 20' 69oW 40' 20'
30'
45'
41oN
15'
30'
45'
42oN
100 cm/s
18 February 2009 1400GMT
70oW 40' 20' 69oW 40' 20'
30'
45'
41oN
15'
30'
45'
42oN
100 cm/s
18 February 2009 1500GMT
70oW 40' 20' 69oW 40' 20'
30'
45'
41oN
15'
30'
45'
42oN
100 cm/s
18 February 2009 1600GMT
70oW 40' 20' 69oW 40' 20'
30'
45'
41oN
15'
30'
45'
42oN
100 cm/s
18 February 2009 1700GMT
Figure A6.c. The CODAR derived surface current fields corresponding to the sixth track subset of drifter 91191 (approximately 2/18/09 0000GMT to 2/19/09 0500GMT).
30 April 2009 CODAR Data Report: Winter 2008-09
38
70oW 40' 20' 69oW 40' 20'
30'
45'
41oN
15'
30'
45'
42oN
100 cm/s
18 February 2009 1800GMT
70oW 40' 20' 69oW 40' 20'
30'
45'
41oN
15'
30'
45'
42oN
100 cm/s
18 February 2009 1900GMT
70oW 40' 20' 69oW 40' 20'
30'
45'
41oN
15'
30'
45'
42oN
100 cm/s
18 February 2009 2000GMT
70oW 40' 20' 69oW 40' 20'
30'
45'
41oN
15'
30'
45'
42oN
100 cm/s
18 February 2009 2100GMT
70oW 40' 20' 69oW 40' 20'
30'
45'
41oN
15'
30'
45'
42oN
100 cm/s
18 February 2009 2200GMT
70oW 40' 20' 69oW 40' 20'
30'
45'
41oN
15'
30'
45'
42oN
100 cm/s
18 February 2009 2300GMT
Figure A6.d. The CODAR derived surface current fields corresponding to the sixth track subset of drifter 91191 (approximately 2/18/09 0000GMT to 2/19/09 0500GMT).
30 April 2009 CODAR Data Report: Winter 2008-09
39
70oW 40' 20' 69oW 40' 20'
30'
45'
41oN
15'
30'
45'
42oN
100 cm/s
19 February 2009 0000GMT
70oW 40' 20' 69oW 40' 20'
30'
45'
41oN
15'
30'
45'
42oN
100 cm/s
19 February 2009 0100GMT
70oW 40' 20' 69oW 40' 20'
30'
45'
41oN
15'
30'
45'
42oN
100 cm/s
19 February 2009 0200GMT
70oW 40' 20' 69oW 40' 20'
30'
45'
41oN
15'
30'
45'
42oN
100 cm/s
19 February 2009 0300GMT
70oW 40' 20' 69oW 40' 20'
30'
45'
41oN
15'
30'
45'
42oN
100 cm/s
19 February 2009 0400GMT
70oW 40' 20' 69oW 40' 20'
30'
45'
41oN
15'
30'
45'
42oN
100 cm/s
19 February 2009 0500GMT
Figure A6.e. The CODAR derived surface current fields corresponding to the sixth track subset of drifter 91191 (approximately 2/18/09 0000GMT to 2/19/09 0500GMT).
30 April 2009 CODAR Data Report: Winter 2008-09
40
4. Acknowledgements We gratefully acknowledge the cooperation and support of the US National Park Service, who provides space and infrastructure support for the CODAR instrumentation at their Cape Cod National Seashore station at Eastham, MA - near Nauset, MA. This publication is the result in part of research sponsored by The MIT Sea Grant College Program, under NOAA grant number NA06OAR4170019, project number 2007-R/RC-104.This research has also been supported in part through a subcontract to Rutgers University who is the prime funded under NOAA grant NA07NOS4730221. 5. References Barrick, D. E. (1972), First-order theory and analysis of mf/hf/vhf scatter from the sea, IEEE
Trans. Antennas Propag., AP-20, 2-10. Barrick, D.E., Geometrical dilution of statistical accuracy (GDOSA) in Multi-Static
HF radar networks, CODAR report, revised 24 January 2006. Barrick, D. E., M. W. Evens, and B. L. Weber (1977), Ocean surface currents mapped by radar,
Science, 198, 138-144. Brown, W.S., S. King, and C. Jakubiak, 2009. CODAR Data Report: SPRING 2008, SMAST Technical
Report 09-0205, pp 12. Chapman, R. D., L. K. Shay, H. C. Graber, J. B. Edson, A. Karachintsev, C. L. Trump, and D. B.
Ross (1997), On the accuracy of HF radar surface current measurements: Intercomparisons with ship-based sensors, J. Geophys. Res., 102, 18,737-18,748.
Crombie, D. D. (1955), Doppler spectrum of sea echo at 13.56 Mc/s, Nature, 175, 681-682. Davis, R. E. (1985), Drifter observations of coastal surface currents during CODE: The method
and descriptive view, J. Geophys. Res., 90(C3), 4741–4755. Stewart, R. H., and J. W. Joy (1974), HF radio measurement of surface currents, Deep Sea Res.,