39
Cold Chain Development for Fruits & Vegetables in India Kinnow Cold Chain Study
Cold Chain Development for Fruits & Vegetables in India Kinnow Cold Chain Study
FOREWORD
The cold chain, and the solutions it represents, is frequently misunderstood. Some view the cold chain as a caretaking activity under refrigerated environs, as a method to safely store food or as a method of preservation. Many others refer to the cold chain as an option to buy time to defer transactions. However, all of these are tactical advantages that the cold chain brings to the food supply chain and, as a norm, the tactics of the day tend to overshadow the strategic aims. The strategy behind applying the cold chain is, primarily, to connect food with consumers across geographies and make food production more sustainable and more profitable.
The cold chain is a logistics bridge, built on systemic pillars of preconditioning, transporting, warehousing and merchandising. Like all bridges, it improves upon connectivity; and thereby in turn, empowers gainful productivity. The cold chain is the sole enabler that allows us to deliver high nutrition and high value farm produce to those who need it. The cold chain is logistics for perishable foods and the answer to the increasing constraints in the delivery of foods around the world.
It is telling that 30% of global food production is lost, as it points to a large supply chain failure, or the inability to handle more than two-thirds of the food being produced. Food produced in surplus to what the global supply chain can safely deliver, is in fact, a 100% loss. Effective delivery systems to improve market access is the answer to reducing global food loss, across all kinds of agricultural produce. It is to beware that all food, even under safe storage, will eventually perish - a wasted resource, unless it is delivered to consumers for gainful end-use as food.
This pilot study is not a simplistic paper exercise but was designed and executed as a front line demonstration of the costs and benefits from deploying a cold chain bridge. This bridge was between Punjab and Karnataka and served not only to increase the selling season, but also the selling range of the farmer. This brings forth scope to spur legitimate growth in the producing areas. This pilot study ably demonstrates the socio-economic gains that are fostered through cold chain implementation. It lifts the veil on some misconceptions and educates in real terms.
Importantly, the study has also demonstrated the immediate environmental benefits that accrue from this cold chain connectivity exercise. The future environmental gains through follow-up productivity are beyond the scope of this pilot, but I envisage those to be yet in larger multiples.
Kinnow cold chain study | 2016

This pilot study has clearly shown how the cold chain is used intelligently to counter the inherent limitations of perishability to connect farms-to-consumers, both over large distances or over extended periods of time. In using the cold chain intelligently, food comes to gainful end-use and food losses are no longer due to the failure of bridging demand with supply.
I commend the team at Carrier Transicold for taking up the challenge and implementing this important pilot project, for truly demonstrating that they are responsible global citizens, committed to reducing food loss, hunger and climate change through implementation of the cold chain, and for wholeheartedly being part of the knowledge dissemination network in this important sector.
Pawanexh Kohli Chief Advisor & Chief Executive Officer
National Centre for Cold-chain Development, IndiaDecember 2016
Kinnow cold chain study | 2016
ACKNOWLEDGEMENTS
The pilot for this project was conceptualised by Pawanexh Kohli, Chief Advisor & CEO of the National Centre for Cold-chain Development (NCCD), and we thank Pawanexh Kohli for his guidance and many helpful comments that have greatly improved this report. We would like to thank Carrier Transicold for planning and funding this study and by introducing us to some of the key informants. The keen interest of the Horticulture Mission in Punjab as well as that of the Ministry of Agriculture & Farmers Welfare, India provided motivation.
In particular, we thank Eric Prieur at Carrier for his detailed and helpful comments across many versions of this report as well as Pankaj Mehta and Tarun Malhotra, also at Carrier, for helping the team understand issues pertaining to the cold chain. We are particularly grateful to Sh. Surinder Charaya, Managing Director of Balaji Cold Store who made this study possible by hosting us at Balaji for this case study and also thank Kamal Arora at IG International and Mohan Das at KTM Traders.
ISB Team
Professor Man Mohan S. Sodhi, Principal Investigator Cass Business School,
City, University of London
Sukhmeet Singh, Project Manager Indian School of Business
Chetna Agnihotri, Analyst Indian School of Business
Kinnow cold chain study | 2016 1

TABLE OF CONTENTS
EXECUTIVE SUMMARY 4
1. INTRODUCTION 5
5. IMPLICATIONS 26
FURTHER READING 28
APPENDIX: A GENERIC FRAMEWORK FOR COLD CHAIN INVESTMENT 29
Glossary of Cold-Chain 33
2. A KINNOW SUPPLY CHAIN STUDY 6 2.1 WHY KINNOW? 6 2.2 RESEARCH METHODOLOGY 7
3. THE SUPPLY CHAIN 9 3.1 PICKING 10 3.2 PROCESSING IN PACK-HOUSE 11 3.3. PRE-COOLING AND COLD STORAGE 11 3.4 TRANSPORTATION FROM ABOHAR TO BANGALORE 12 3.5 DISTRIBUTION AND RETAIL IN BANGALORE 13
4. FINDINGS 15 4.1 REVENUES AND COSTS IN THE SUPPLY CHAIN 15 4.2 PROFITABILITY AND PAYBACK FOR AGGREGATOR 18 4.3 PROFITABILITY FOR TRANSPORTER 20 4.4 PROFITABILITY FOR DISTRIBUTOR 21 4.5 PROFITABILITY FOR RETAILER 22 4.6 ENVIRONMENTAL IMPACT 22
Kinnow cold chain study | 20162

INDEX OF TABLES
Table 1: Overview of research methodology by supply-chain actor 8
Table 2: Parameters for revenues and costs and the source for this information
16
Table 3: Revenues at costs at different levels 17
Table 4: Profitability for Balaji Aggregator 18
Table 5: Payback period calculations for pre-cooling equipment at Balaji 19
Table 6: Payback period calculations for cold storage equipment at Balaji 20
Table 7: Profitability calculations from a transporter owning a reefer truck 21
Table 8: Profitability for Distributor 22
Table 9: Profitability for retailer 22
Table 10: Carbon emission in supply chain 24
Table A1: Generic model for evaluating cold chain viability for fruits and vegetables
29
Table A2-1: Investment-related costs for pre-cooler 30
Table A2-2: Fixed costs for cold storage 30
Table A2-3: Payback for pre cooler 30
Table A2-4: Payback for cold storage 31
Table A2-5: Payback period calculation for Transporter 32
Kinnow cold chain study | 2016 3

EXECUTIVE SUMMARY
Fruit-and-vegetable distribution in India suffers significant post-harvest losses in the supply chain primarily due to the perishable nature of fresh produce and its sensitivity to handling damages. Cold chain is one possible solution for reducing post-harvest losses. Moreover, cold chain can help increase value of the produce by enabling sales out of season and in far-away markets. However, the stakeholders in the value chain may be deterred by setup complexity, dependence on other stakeholders investing along the supply chain, and high cost of investment, despite government incentives. This report assesses investment in cold chain by analyzing profitability in a particular supply chain to encourage stakeholders along the entire supply chain to make similar assessments.
Our study focuses on a particular supply chain for kinnow, a citrus fruit. The supply chain we studied originates from Abohar in Punjab in northern India to Bangalore in southern India. This supply chain allows us to analyze the time- and distance-related aspects of cold chain investment. We conclude that with cold chain intervention:
• x10 profit by reefer truck
• -16% CO2 emissions
• ÷4 spoilage of kinnow
Cold chain has the potential for increasing volume of flows, which can result in better returns for farmers. The benefits really come through when the cold chain is a refrigerated chain all the way from the farmer to the retailer so any inducements the government wishes to give to investors by way of subsidies should consider all stakeholders along the supply chain.
Eventually, we have also provided a general decision framework for aggregators and distributors to analyze profitability for any crop when using the cold chain.
Kinnow cold chain study | 20164

1. INTRODUCTION
India is the second largest producer of fruits and vegetables amongst all countries in the world after China. Fruits and vegetables are traditionally consumed close to where they are grown, but with urbanization and changing consumer preferences across India, cold chain connectivity is the solution needed to enable farmers and aggregators to distribute produce over a wider area and in off-season months. Moreover, besides expanding the domestic market in the country, cold chain can help with exports, considering that India currently exports merely 1% of the production.
Despite potential benefits, there is a noticeable lack of investment in the cold chain infrastructure. According to the National Centre for Cold-chain Development’s (NCCD) 2015 study of the status of the nation’s cold chain infrastructure, India has a shortage of reefer transportation vehicles- having fewer than 10,000 vehicles against an estimated 62,000 needed vehicles. There are at least two possible reasons for this reluctance for investment. One reason is that cold chain investment may be perceived as being too high with benefits that are questionable. The second reason may be the complexity of the investment: A complete cold chain solution requires investing in pre-cooling and cold storage, in refrigerated vehicles for transporting food and in the refrigerated distribution centres. To get benefits pertaining to reaching distant markets, the entire supply chain needs to be refrigerated – hence the phrase ‘cold chain’ – requiring investment by all the stakeholders along the supply chain from aggregator to distributors to retailers as well as the transporters linking them.
To shed light on cold chain investment, we investigated a particular supply chain for kinnow, a particular citrus fruit grown primarily in Punjab, India. This supply chain begins with aggregation in Abohar, Punjab and ends with retail in Bangalore in southern India under four scenarios. Two scenarios are base or status quo scenarios of no cold chain for the months of January and February respectively with no cold chain. The two other scenarios, for February and March respectively, entail intervention by way of the introduction of cold chain to shed light on cold chain economics and environmental impact across this particular supply chain. Under these scenarios, we analyzed the profitability of investing in and/or using the cold chain for all the stakeholders in this particular supply chain.
Kinnow cold chain study | 2016 5

This study deals with the business viability of cold chain applied to kinnow supplied from Abohar in Punjab in north India to Bangalore in south India. Doing so enables us to assess any benefits of the cold chain pertaining to distributing over long distances as Bangalore is 2,530 km away from Abohar and it takes approximately four-five days to get from Abohar to Bangalore by truck. It also allows us to look into the value generated during off-season sales because, as we found, there is high demand for kinnow as well as freshly-squeezed kinnow juice in Bangalore in the months of March and April, well after harvesting ends in January or February.
We selected kinnow as the fruit for this study for following reasons:
Geographically concentrated cultivation and saturated local markets: Kinnow is a high-yield variety of mandarin orange grown primarily in Punjab region of North India. It requires five years before first harvest. Punjab is India’s leading producer of kinnow with 29% of total national production. Kinnow orchards are in five locations in Punjab: Abohar, Hoshiarpur, Mansa, Muktsar and Bathinda (Exhibit “District Map”). In 2014-15 farmers in Punjab produced 1.1 million tonnes of kinnow, with about 48,000 hectares or two-thirds of the total acreage devoted to fruit production in Punjab. Local markets cannot consume all the production. Growing yield over time has only exacerbated the price pressure on farmers. Kinnow farmers earned Rs. 12-13 per kg in Dec. 2013, but only Rs. 6-7 per kg in Dec. 2014 and Rs. 7-8 per kg in Dec. 2015 in wholesale markets in Punjab. In January 2016, Punjab Agro (of the State Government) had to intervene to stabilize the price by buying 5,000 tonnes of kinnow.
2. A KINNOW COLD CHAIN STUDY
Kinnow fruit, grown primarily in Punjab India
2.1 Why Kinnow?
District map of Punjab as well as the map of India showing the state of Punjab and
the city of Bangalore
Kinnow cold chain study | 20166

Post-harvest losses and compatibility with cold chain: Like many other fruits, kinnow deteriorates rapidly after harvest and needs to be kept cool at 4-5° and a relative humidity of 85-90% to keep spoilage at a minimum. Post-harvest losses in kinnow from Abohar to Bangalore are estimated at 28% in the supply chain from the orchard to the retailer. Such losses reduce the potential revenues for farmers, aggregators, transporters, distributors and retailers. Storage life is about five to seven days at ambient conditions in winter months of December and January but can be extended to about 20 days if the fruit is waxed or wrapped. The cold chain makes a significant increase to life in storage for up to two months, which enables sale of kinnow off-season from March and April and even as late as May well after harvest ends in January or February.
Popular and low value: Other fruits that could have been used are, say, kiwi or strawberry, but the
Distribution of kinnow in India mainly relies on open trucks. As such, a typical supply chain goes from the farmer to the aggregator, then to the mandi or to the distributor via open truck transportation, and then on to the retailer. We observed the supply chain for the months of January 2016 and February 2016 as the two base or status quo scenarios (1) & (2) Furthermore, our study entailed two interventions: (3) use of pre-cooling and then use of refrigerated or “reefer” trucks in-season to transport from a pack-house to distributors without using cold storage in February 2016, and, (4) taking kinnow from cold storage (having pre-cooled it earlier) and then transporting with reefer trucks for out-of-season transportation to distributors in March 2016. Thus, we made our observations under four scenarios.
2.2 Research methodology
CULTIVATION AGGREGATION OPEN TRUCK TRANSPORTATION
MANDI/ DISTRIBUTION
RETAIL
BASE MODE: (1) January and (2) February
IN-SEASON INTERVENTION MODE 1: (3) February
CULTIVATION AGGREGATION PRE-COOLIING REEFER TRANSPORTATION
MANDI/ DISTRIBUTION
RETAIL
business case for cold chain investment for these is obvious due to their high perishability as well as the high prices they command in the market. In contrast, kinnow is a popular low-cost fruit. Therefore, if a business case could be made for cold chain investment using kinnow, then the results could be generalized to many other types of fruits.
Possibility for export: Kinnow has potential for export, but organized export from Punjab has yet to develop as of this writing, even from designated Agro-Export Zones. Kinnow from Punjab currently does reach Bangladesh via markets in Kolkata in eastern India. And in 2016, aggregators from Punjab exported directly to Russia, Ukraine and the UAE but these sales were opportunistic. Cold chain could help in exporting kinnow on a regular and predictable basis by preserving quality of the fruit across long distances.
CULTIVATION AGGREGATION PRE-COOLIING REEFER TRANSPOR-
TATION
COLD STORAGE
MANDI/ DISTRIBUTION
RETAIL
POST-SEASON INTERVENTION MODE 2: (4) March
Kinnow cold chain study | 2016 7

Data collection was based on interviews of different managers at different nodes in the supply chain and on some third party data. We interviewed the following for this study:
Four scenarios with the first two using the traditional supply chain with open-truck transportation in season (Jan’16 and Feb’16), and the next two with
intervention: one using reefer trucks in-season (Feb’16) and the other using both cold storage and reefer-truck transportation out of season (Mar’16).
Farmers at festival organized by Punjab Agriculture University (PAU)
Retailers in Bangalore - D-Mart, METRO and Namdhari Fruits & Vegetables
Aggregator in Abohar - Balaji Cold Store
Distributor of trucks - PASCO Motors, Chandigarh
Distributors in Bangalore - IG International, KTM Fruit Traders
Distributors of reefer equipment - Coolways Conditioning Pvt. Ltd, Chandigarh
We also visited the sites of Balaji Cold Store in Abohar and those of the distributors and retailers in Bangalore to understand the operations and the overall context.
We calculated the costs and revenues in the supply chain at different points from Abohar orchard to retailers in Bangalore for the two base scenarios (January and February) using open trucks as well as the two intervention scenarios (February and March) using the cold chain. We included costs of aggregation; pack-house processing like waxing and grading; pre-cooling and cold-storage; transport to Bangalore in open and reefer trucks, food loss and carbon footprint in the four scenarios. Then we analyzed the profits for the aggregator, distributor, transporter and retailer and also estimated the payback period for cold chain investment. Finally, we estimated CO2 emissions to quantify the environmental impact.
Besides primary data, we used third party research to identify the relevant parameters for our analysis, especially for estimating spoilage and CO2 emissions.
Aggregator
Site visit
Primary data collection
Profitability Analysis
Payback period of investment
Distributor Retailer Transporter
Table 1: Overview of research methodology by supply-chain actor
Kinnow cold chain study | 20168

The ‘orchestrator’ of the supply chain of interest is a fruit aggregator, Balaji Cold Store, who is also a wholesaler, a fruit exporter, as well as fruit importer involved in nearly all stages of the supply chain from the orchard to retail. The company is based at Abohar, Punjab, and is privately owned and managed by Sh. Surinder Charaya. Balaji supplies kinnow and other fruits to local markets in Punjab, and in a limited way to markets in other parts of India including Bangalore and Gujarat. Occasionally, he would also supply for export to markets in Dubai, Russia and Ukraine.
Sh. Charaya sees the benefit of the cold chain investment in being able to reach markets in southern India selling high-quality kinnow in season as well as off-season, and reducing spoilage substantially. He hopes to establish Bangalore as a primary centre for distributing fruits in southern India, for which he believes proper integration of his supply chain with pre-coolers and refrigerated trucks would be required. Also he believes he can get more value from using a complete cold chain solution as it will increase the reach to new markets and also help maintain quality.
3. THE SUPPLY CHAIN
“Reefer trucks are required for supply chain to Bangalore- that makes a huge difference and extends the kinnow market for us even off-season. We use reefer trucks, along with pre-cooling and cold storage facilities to supply kinnow.
- Sh. Surinder Charaya, Managing Director of Balaji Cold Store Pvt. Ltd., Abohar”
Sh. Surinder Charaya, Managing Director of Balaji Cold Store
Kinnow cold chain study | 2016 9

The post-harvest supply chain process for Balaji for this particular pilot study comprises:
The precooling and cold store is used to buffer produce intended supply beyond the peak season, while in season market continued to be supplied in the cool winter months without needing to use the pre-cooling system.
Balaji Aggregators get kinnow from multiple farmers and orchards in Abohar, covering an area of about 2,000 acres. Sh. Charaya himself owns 14 acres of kinnow farms. For picking, the aggregator incurs the cost of labor and of transportation to one of four pack-houses that Balaji have in Abohar or in the vicinity. Traditionally, fruit is harvested with pruning shears, letting the fruit drop to the ground. In orchards owned by Balaji, the fruit is harvested with clipper and is collected in crates without letting the fruit drop to the ground to keep spoilage to a minimum. However, most of the kinnow that Balaji sells is obtained from other orchards so the fruit in this supply chain is primarily picked from the ground after using shears.
The harvested fruit is then transported to the aggregator’s pack house.
1. Picking the fruit from the orchard in Abohar or vicinity
5. Distribution and retail in Bangalore
4. Open-truck or reefer-truck transportation to Bangalore
2. Processing in Abohar pack-house, including grading/sorting, waxing and packing
3. Pre-cooling and cold storage in Abohar pack-house
3.1 Picking
Kinnow trees in orchards in Abohar Kinnow fruit being handpicked
Kinnow cold chain study | 201610

Upon arrival at the pack-house, the fruit is processed. There are about 200 employees per pack-house, in charge of processing and packaging facilities. Processing of the fruit includes waxing, grading, sorting, and packing. Balaji have installed a mechanical waxing and grading machine for supply intended for far-away markets including exports.
Workers pack the fruit manually in corrugated fiberboard (CFB) boxes, each carrying approximately 10 kg of fruit. Balaji had started looking into smaller plastic containers that allow for improved circulation of air and hence more effective cooling; these containers also have the benefit of not requiring unpacking for retail sales.
3.2 Processing in pack-house
Processing (grading, waxing and sorting) equipment at Balaji
Packing operations at Balaji pack-house in Abohar
3.3. Pre-cooling and cold storageBalaji has been using cold storage for fruits since 2000 at their storage facility in Ludhiana in Punjab, and have installed cold storage at the Abohar pack-house as well. In 2015, Balaji initiated cold storage trials for kinnow for a period of three months and in 2016, installed pre-cooling for kinnow for staging prior to cold storage or cold transportation. At a part of this pilot study, they had already bought pre-cooling and had committed to using reefers for the interventions under consideration for this study. Fruit is not pre-cooled throughout the season at Balaji. But once the temperature starts to rise around February end, and it becomes difficult to maintain the quality of fruit for supply to a distant distributor. To supply far away customers in proper quality and quantity, pre-cooling the fruit becomes imperative but this was not being done in the past. Storing the produce in a cold store without precooling, resulted in moisture losses, poor quality and shorter holding life. The pre-cooling unit at Balaji has a capacity of 30 tonnes per batch and load of 22 kWh. The kinnow at point of input is typically at 15° C and the temperature is brought down to 4-5° C within 6 hours.
Cold storage unit at Balaji had a capacity of 1,500 tonnes initially and a load of 65 kWh. As part of the intervention, part of this capacity gave way to a pre-cooling unit leaving the cold storage with a capacity of 1,000 tonnes. The unit runs for 10-12 hours a day.
Kinnow cold chain study | 2016 11

Pre cooling at Balaji pack house at Abohar
Cold storage at Balaji in Abohar
3.4 Transportation from Abohar to BangaloreAfter packing, Balaji sends the supply across to different distributors within and outside Punjab, and for this study in particular, to distributors in Bangalore. Prior to the start of this study, Balaji used only conventional open trucks vehicles for sending fruits by road. During this study, Balaji rented reefers for the first time as intervention. Open trucks have a holding capacity of 15 tonnes with a length of 25 feet, and reefers have a reduced holding capacity of 13.5 tonnes and 24-feet length to accommodate the cooling equipment. For the initial phase of the intervention, Balaji rented a truck with 28ft long container equipped with an Oasis 350 – 10,300 watts refrigeration unit from Carrier Transicold. After this phase, Balaji purchased a truck with a 30ft long container equipped with Supra 1150 – 10,500 watts refrigeration unit from Carrier.
Kinnow cold chain study | 201612
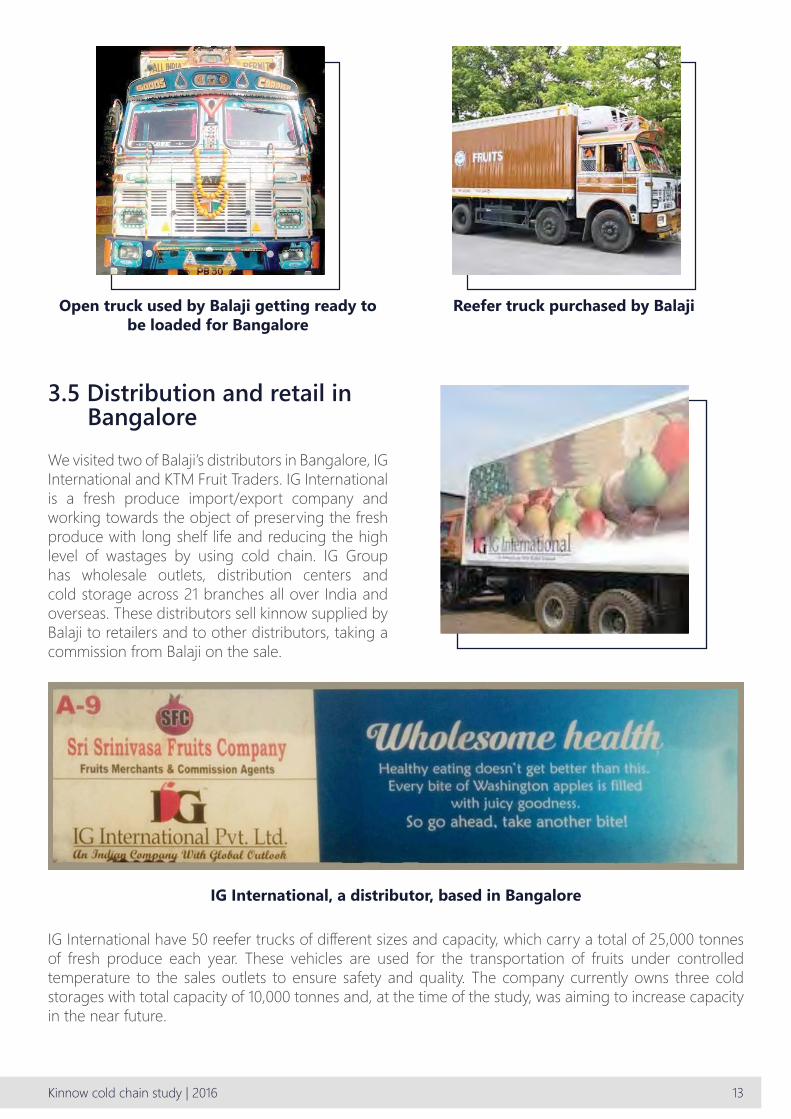
3.5 Distribution and retail in BangaloreWe visited two of Balaji’s distributors in Bangalore, IG International and KTM Fruit Traders. IG International is a fresh produce import/export company and working towards the object of preserving the fresh produce with long shelf life and reducing the high level of wastages by using cold chain. IG Group has wholesale outlets, distribution centers and cold storage across 21 branches all over India and overseas. These distributors sell kinnow supplied by Balaji to retailers and to other distributors, taking a commission from Balaji on the sale.
Open truck used by Balaji getting ready to be loaded for Bangalore
Reefer truck purchased by Balaji
IG International, a distributor, based in Bangalore
IG International have 50 reefer trucks of different sizes and capacity, which carry a total of 25,000 tonnes of fresh produce each year. These vehicles are used for the transportation of fruits under controlled temperature to the sales outlets to ensure safety and quality. The company currently owns three cold storages with total capacity of 10,000 tonnes and, at the time of the study, was aiming to increase capacity in the near future.
Kinnow cold chain study | 2016 13

The other distributor, KTM Fruit Traders, received kinnow only from Balaji Aggregators for supply to the local retailers. In past years, they received kinnow from Balaji Aggregators in open trucks from December only till mid-February. Having experienced considerable spoilage with the supply coming in non-refrigerated trucks, they have felt the need to invest in reefer trucks for increasing profits. Along with Balaji, they have tried using open trucks with thermcol, a common lightweight packing material that provides good insulation but doing so did not reduce spoilage much in their experience.
“We earn higher profits if kinnow market is extended after March. The quality of kinnow received in reefer truck even in the month of Feb is much better that the quality of kinnow received in open truck. The price difference reflects the same.
- Mr. Kamal Arora, IG International, Bangalore”
“Without reefer trucks, I incurred considerable spoilage in February 2016. The use of reefer trucks for transport can reduce that.
- Mr. Mohan Das, Manager, KTM Fruit Traders, Bangalore”
We visited two retailers in Bangalore for the case study, D-MART and METRO. These retailers sold kinnow at prices ranging from Rs. 79-149 per kg, with higher prices in March compared to those in the cooler months of January or February. These retailers felt that the high prices of kinnow in March indicate huge demand, and the continued supply off-season would be beneficial. Another retailer confirmed the popularity and price of kinnow both in- and off-season in Bangalore. While the kinnow was no longer available in April, orange from Valencia, Spain was available at Rs. 90-110 per kg. As such, the retailers felt they could achieve that same price for kinnow if it were available in April.
Retailers D-Mart and Metro in Bangalore
Orange from Valencia, Spain on sale in Bangalore in April
Kinnow cold chain study | 201614
4. Findings
We first estimated the revenues and costs across the supply chain for comparison of the four scenarios taken up for this study. For the calculations, we started with the retailer selling 1 metric tonne (MT) of kinnow and then go upstream from the retailer to the aggregator and identify the quantity sold, operational costs, revenues and spoilage at each level- retailer, distributor and aggregator to make this one 1 MT of retail possible in Bangalore. Next, we estimated the profitability for the retailer, distributor, transporter and aggregator and also calculated the payback period for the cold-chain investment used in the intervention scenarios.
The interviews provided us with selling prices and transport costs at various levels across the supply chain. We also use third party data for parameters such as spoilage, cross-checking these data to the extent possible with the information from the interviews. As mentioned earlier, the capacity for cold storage at Balaji was 1,500 tonnes but was reduced to 1,000 tonnes to make room for pre-cooling. So for the profitability analysis, we took the capacity as 1,000 tonnes. However, for the purpose of calculating return on the investment, we took 1,500 tonnes as the investment was made in getting a 1,500 tonnes cold storage, not a 1,000 tonnes cold storage. So the calculations for payback will have 1,500 tonnes capacity (with Rs. 4 crore investment) and for running costs for profitability and CO2, will have 1,000 tonnes. For the spoilage estimates, we started with numbers from a 2007 study that provides these at different stages of the supply chain from orchard in Abohar to retailers in Delhi and Bangalore; we then adjusted these numbers for the intervention scenarios. Thus we obtained parameters for profitability analysis; Table 2 indicates the parameters and the source of our information.
4.1 Revenues and costs in the supply chain
Kinnow cold chain study | 2016 15

UnitsS.no. Parameters taken for profitability calculations (source)
1.
2.
4.
9.
10.
11.
12.
13.
14.
15.
8.
7.
6.
3.
Retailer ’s selling price (in Bangalore)
Spoilage at retailer (adapted from Gangwar et al. 2007)
Retailer ’s purchase price = aggregator’s selling price (from Balaji)
Spoilage at orchard and packhouse
Procurement cost for aggregator (our choice – actual prices vary)
Operational cost(harvesting till shipment) (our estimate)
Pre-cooling cost (25 kWh for 30 MT for 6 hours at Rs. 7 per kWh)
Pre-cooling loading and unloading cost (our estimate for labour costs)
Cold storage cost (based on 39 kWh and Rs. 7 per kWh)
Cold storage loading and unloading cost (same as for pre-cooling above)
Transportation cost (Abohar-Bangalore)(taken from Balaji with Rs 80,000 for an open truck of 15 tonne capacity and a reefer at Rs 1.25 lakhs with13.5 tonne capacity)
Cold storage cost for distributor (estimate based on Rs. 7 per unit electricity cost)
Labour cost for distributor (our estimates based on time and daily cost of labour)
Operational costs for retailer (estimated using a 1% normal margin for the retailer in the base scenarios)
(Rs/MT)
%
(Rs/MT)
%
(Rs/MT)
(Rs/MT)
(Rs/MT) - -
(Rs/MT) - -
(Rs/MT) - - -
(Rs/MT)
Rs/MT
Rs/MT
(Rs/MT) 38,000 38,000
2,000 2,000 2,000 2,000
70,000
27,000
75,000
13.7% 13.7%
30,000
5,333 5,333
80,000
5%
35,000
42,000
9,259 9,259
4242- - -
100,000
5%
40,000
5. Spoilage from transportation/distribution (adapted from Gangwar et al. 2007)
% 5.7% 15% 1% 1%
2.5% 3% 3% 3%
12,000 12,000 12,000 12,000
4,900 4,900 4,900 4,900
35 35
250 250
273
250250--
50,000
Sell in cold season open truck (Jan’16)
Sell in cold season open truck (Feb’16)
Sell in cold season reefer truck (Feb’16)
Sell post season from cold storage and reefer truck (Mar’16)
Table 2: Parameters for revenues and costs and the source for this information
Kinnow cold chain study | 201616

These parameters are the basis for calculating the supply chain surplus – the revenues from selling 1 MT at the retail end of the supply chain less the supply chain costs and procurement costs at the orchard and other costs incurred (Table 3).
Table 3: Revenues and costs at different levels
S.no.Level Activity for one MT sold by retailer
Sell in cold season open truck (Jan’16)
Sell in cold season open truck (Feb’16)
Sell in cold season reefer truck (Feb’16)
Sell post season from cold storage and reefer truck (Mar’16)
1. Retailer ’s revenues
Retailer level
70,000 75,000 80,000 100,000
2. Spoilage 13.7% 13.7% 5% 5%
4. Operational costs for retailer 38,000 38,000 42,000 50,000
5. Procurement cost adjusted for spoilage/Revenues from distribution
31,286 34,762 36,842 42,105
3. Quantity purchased 1.16 1.16 1.05 1.05
6. Spoilage from transportation/distribution
Distributor level
5.7% 15% 1% 1%
7. Quantity received 1.23 1.36 1.06 1.06
9. Labour cost 2,458 2,726 2,127 2,127
10. Cold storage cost - - 45 45
8. Distributor’s commission at 9% 2,816 3,129 3,316 3,789
11.
16
Quantity transported
Operational cost (Harvesting till shipment)
Aggregator Level
1.23
6175
1.36
6886
1.06
5371
1.06
5484
12. Transportation cost 6,554 7,271 9,845 9,845
17. Pre-cooling cost 0 - 37 37
14. Quantity purchased 1.26 1.41 1.10 1.12
19. Cold Storage cost - - - 290
15. Procurement cost 15124 16865 13154 13431
13. Spoilage at orchard and pack-house 2.5% 3% 3% 3%
18. Pre-cooling loading and unloading cost
- - 266 266
20. Cold Storage loading and unloading cost
- - 266 266
21. Cumulative losses 22% 32% 9% 9%
Kinnow cold chain study | 2016 17

With the revenues and costs estimated for the supply chain as a whole, we used these numbers to estimate profitability for the individual players and the payback on the cold chain investment. While these numbers are only indicative because of assumptions around the parameters we used, they do afford comparison of revenues and costs in the cold chain intervention scenarios vis-à-vis the base scenarios without cold chain.
35
30
25
20
15
10
5
0Open truck,
Jan’16Open truck,
Feb’16Reefer truck,
Feb’16Cold storage and
reefer truck, Mar’16
22%
32%
9% 9%
Cum
ulat
ive
spoi
lage
in %
For the two base scenarios in January and February season and with open truck transportation- the aggregator earns 2% and 1.8% respectively. Continued supply in open trucks in later months would likely reduce the profits further due to high spoilage even if this were at all possible. In contrast, in the intervention scenarios, when using reefer truck for transport in February 2016, the margin of profits increased to 12%. This continued in March when Kinnow was shipped from cold storage via reefer trucks and was selling now out-of-season in Bangalore and the margin increases to 20% (Table 4).
4.2 Profitability and Pay back for Aggregator
Table 4: Profitability for Balaji AggregatorS.no. Profit based on one MT sold by
aggregator (Rs/MT)
Sell in cold season open truck (Jan’16)
Sell in cold season open truck (Feb’16)
Sell in cold season reefer truck (Feb’16)
Sell post season from cold storage and reefer truck (Mar’16)
1. Profit for aggregator per tonne shipped
Aggregator Level
503 449 4315 8179
2. Revenues for aggregator per tonne shipped
25,461 25,500 34,650 39,600
3. Aggregator’s margin 2.0% 1.8% 12.5% 20.7%
Kinnow cold chain study | 201618

Table 5: Payback period calculations for pre-cooling equipment at BalajiPayback for pre cooler Units
Pre-cooler capital cost
Annual costs including depreciation @1.5% / month
Annual operating profits
Rs
Rs
Rs/year
2,500,000
720,000
2,477,260
Installation
No. of reefers shipped per year to Bangalore
Operating profit per MT
Annual profits net of depreciation and maintenance
Rs
No.s
Rs
Rs/year
1,500,000
40
4,185
1,757,260
Total investment
Quantity shipped in year @ 13.5 MT/reefer
Payback in years
Rs
MT/year
years
4,000,000
540
2.28
Estimating the payback period for cold storage is more complicated because cold storage is used for much of the year and for storing many other types of produce, including for rental to other aggregators or farmers. To make our estimates, we assumed 20 trips and 270 MT as quantity shipped per year using cold storage. We also took the cold storage usage for other fruits and vegetables throughout the year and calculate profits based on rental value only. The payback period in this case turns out to be 16 years without kinnow but only 9 years with kinnow (Table 6). These numbers are indicative only but they do show that making cold storage part of the cold chain, rather than it being stand-alone, can unlock tremendous value from this investment.
9000
8000
7000
6000
5000
4000
3000
2000
1000
0
503 449
4315
8179
Profi
t in
Rs fo
r agg
rega
tor p
er to
nne
ship
ped
Open truck, Jan’16
Open truck, Feb’16
Reefer truck, Feb’16
Cold storage and reefer truck, Mar’16
The increased margin is based solely on operational profits without taking capex or investment costs into account. Therefore, we separately calculated the payback period for investment in pre-cooling and cold storage by considering fixed costs, straight-line depreciation and maintenance. Assuming that Balaji invests Rs. 40 lakhs in pre-cooling and taking 40 trips and 540 MT as quantity shipped per year using pre-cooling, the payback period for pre-cooling is only 2.3 years (Table 5). This suggests that investing in pre-cooler can be quite attractive for kinnow even if these were used for just a few months a year.
Kinnow cold chain study | 2016 19

Our indicative calculations assuming two trips a month from Abohar to Bangalore and the rental income on the outbound journey with kinnow to be Rs. 1,25,000 show that the transporter would make an annual profit of Rs. 12.5 lakh on an investment of Rs. 29.5 lakhs. This gives a payback period of just above 4 years (Table 7).
Table 6: Payback period calculations for cold storage equipment at Balaji
Payback for cold storage Units
Cold storage capital cost
Annual costs including depreciation over 20 years
Annual operating profits from renting space for other produce
Quantity shipped in year @ 13.5 MT/reefer
Payback in years without kinnow (base)
Rs
Rs
Rs/year
MT/year
years
3,25,00,000
20,00,000
44,73,000
270
16
Installation
Operating profit per MT of kinnow
Annual profits net of depreciation-other produce only
Annual operating profits from kinnow
Payback in years with kinnow (with cold chain intervention)
Capital cost of infrastructure is not validated and as reported by the promoter.
Rs
Rs
Rs/year
Rs/year
years
75,00,000
7,770
24,73,000
20,97,982
9
Total investment (as per Balaji, without taking any subsidies into account)
Cost of electricity (50kW x 6hours/day x 30days/month x 9 months/year x Rs. 7 per kWh)
No. of reefers shipped per year to Bangalore
Annual profits net of depreciation - including kinnow
Annual revenues from renting space for other produce (Capacity x70% loading x Rs. 15/month rental for 50kg of vegetables x 9 months of usage)
Rs
Rs/year
Nos.
Rs/year
Rs/year
4,00,00,000
5,67,000
20
45,70,982
50,40,000
4.3 Profitability for Transporter
Kinnow cold chain study | 201620

The distributor earns a commission of 9% on the revenues it generates in Bangalore for the aggregator. In doing so, the distributor incurs labor and cold storage costs. Spoilage is also observed when the truck arrives from the aggregator, depending on scenario. The resulting calculations show that the profit for the distributor triples for in-season shipments when using reefers and becomes more than four times the initial profits when using cold storage and reefers (Table 8).
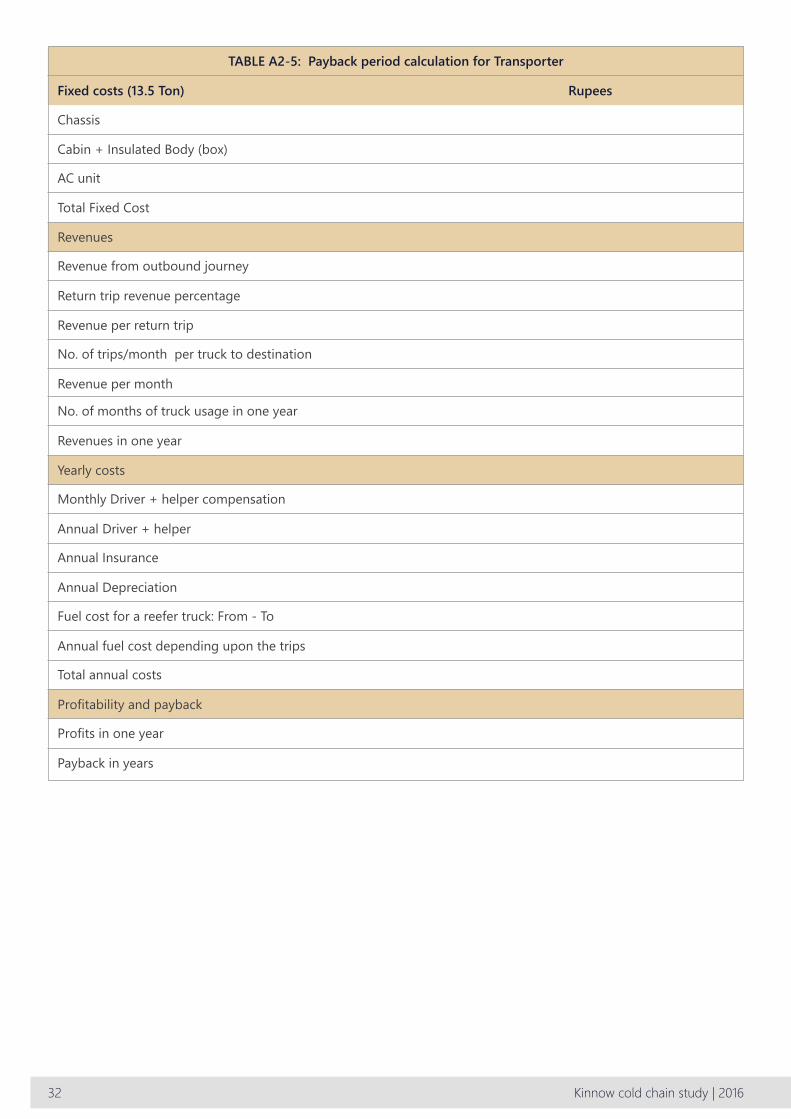
Table 7: Profitability calculations from a transporter owning a reefer truck
Transporter
Fixed costs (13.5 Ton) Rupees
No. of months of truck usage in one year
Annual fuel cost depending upon the trips
Return trip revenue percentage (our assumption)
Annual insurance (Balaji)
Monthly Driver + helper compensation (Pay of Rs 25,000 to driver + helper. Rs 8,000 as allowance for two trips (Rs 4,000 per trip)
Profits in one year
8
15,40,800
50%
65,000
33,000
7,03,200
Revenues in one year
Total annual costs
Revenue per return trip
Annual depreciation
Annual driver + helper
Payback in years
30,00,000
22,96,800
187,500
2,95,000
3,96,000
4.20
Revenue per month
Revenue from outbound journey (source: Balaji)
Yearly costs
Profitability and payback
No. of trips/month per truck to Bangalore (based on time taken and on expected utilization)
Fuel cost for a reefer truck: Abohar to Bangalore (Distance/Avg of truck + reefer fuel usage * cost of per liter diesel)
3,75,000
1,25,000
2
48,150
Chassis (data from truck dealer)
Total investment (from truck dealer)
21,00,000
29,50,000
Cabin + Insulated Body (box) (from truck dealer)
Revenues
4,00,000
AC unit (from AC unit dealer) 4,50,000
4.4 Profitability for Distributor
Kinnow cold chain study | 2016 21

Table 8: Profitability for DistributorS.no. Profit based on one MT sold
by distributor (Rs/MT)
Sell in cold season open truck (Jan’16)
Sell in cold season open truck (Feb’16)
Sell in cold season reefer truck (Feb’16)
Sell post season from cold storage and reefer truck (Mar’16)
1.
Distributor level
309 347 1,087 1,537
2. 27,000 30,000 35,000 40,000
3.
Profit for distributor per MT shipped
Revenues for distributor per MT shipped
Distributor’s margin 1.14% 1.16% 3.11% 3.84%
Table 9: Profitability for retailer
S.no. Profit based on one MT sold by retailer (Rs/MT)
Sell in cold season open truck (Jan’16)
Sell in cold season open truck (Feb’16)
Sell in cold season reefer truck (Feb’16)
Sell post season from cold storage and reefer truck (Mar’16)
1.Retailer level
70,000 75,000 80,000 100,000
2. 714 2,238 1,158 7,895
3.
Revenues/MT sold by retailer
Profit/MT sold by retailer
Retailer ’s margin 1.02% 2.98% 1.45% 7.89%
4.5 Profitability for RetailerA retailer earns a profit of Rs. 7,895 per tonnes when using a complete cold chain. Calculating retailer ’s profit is not straightforward as retailers sell many categories of items, not just kinnow. We estimated operational costs to ensure margins were about 1 percent in the base scenario overall (see Table 2 for parameters) and then adjusted these costs upwards for the intervention scenarios to take cooling and reduced space into account. The results show that the cold chain intervention can increase the margin for the retailer (Table 9).
4.6 Environmental ImpactEnvironmental impact is an important consideration as regards the cold chain. We considered all the activities from harvesting at orchards to the retailer in Bangalore. Even though there is further downstream spoilage in the consumers’ homes, the present study is limited up to retail. The numbers for the CO2 based on spoilage without cold chain are taken from the interviews and third party sources.
Kinnow cold chain study | 201622

As with the profitability calculations, we started out with 1 tonne at the retailer and then adjusted quantities for spoilage. We also took into account the impact of the refrigerant leaked from reefer trucks. This increases CO2 for the two intervention scenarios in February and March. This is because the refrigerant being R404a, leaked refrigerant has a multiplier of 3,940 for CO2 equivalence as regards greenhouse impact. We did not take the leakage from cold storage at retail because there are less moving parts at retail as compared to reefer, so the leakage is quite low compared to that associated with a reefer truck. Also, the quantity is stored for a short period in the retail store, where sometimes it is sold within a day and this reduces the impact on a per tonne basis.
Another source of CO2 is the methane (CH4) produced by rotting kinnow. This increases the (equivalent) CO2 quantity for the scenarios with high spoilage. Estimation of the CO2-equivalent emissions from spoilage is not straightforward. We have assumed 324 kg C02 equivalent per tonne of spoilage in the calculations here. This is computed as follows: we took a typical figure of 20.8 kg of methane emitted per tonne of food waste for perfectly managed anaerobic decomposition. To this we applied a methane conversion factor of 0.21, extrapolated from IPCC suggested numbers to get 4.5 kg methane per tonne of spoilage for open-dump disposal. Our reasoning is that the conversion factor recommended by the IPCC for unmanaged storage below 5 metres is 0.8 and that for unmanaged storage shallower than 5 metres is 0.4. We took 0.21 (given the state of open-dump disposal observed in this supply chain) to get 4.5 kg methane per tonne of spoilage. Next we sought to choose the CO2 equivalent of methane, which varies from 72 over a 20-year period to 25 for a 100-year period. We took the impact for the shorter 20-year period given the global urgency around greenhouse gases rather than the lower 100-year number. This means the methane produced has an impact of 324 kg per tonne of rotting kinnow in our calculation.
We further assumed that 1 kWh of electricity produces 1 kg CO2 for coal thermal power stations as in the state of Punjab. Even though there is hydroelectric power in the state, recent power plants use coal. For transportation using diesel, we took 1 liter of diesel to produce 2.68 kg of CO2. Further, the cold storage at Balaji, where fruit is stored for two months, has the load of 65 kWh, and taking electricity cost at Rs. 7/kWh and Assuming it runs for 10 hours a day, we calculated the units. For the environmental impact of cultivation, we assumed that 123 kg CO2 is emitted per tonne of citrus fruit cultivation, adapting these numbers from the cultivation of orange in Brazil.
There are second-order effects that we did not take into account owing to their impact being negligible. Rotting fruit produces CO2 as well, in roughly 1:1 proportion to methane and other gases depending on aerobic or anaerobic decomposition but we ignore this given that the impact of methane is 72 times more. Another second-order effect, the emissions from transporting spoilage to open dump/landfill via diesel truck, was not included as quantities obtained turn out to be less than 1 kg CO2 per tonne of kinnow retailed across the supply chain. Given the small size of the impact relative to other sources and the heroic assumptions involved in choosing among different ways such a number can be computed, we dropped this from consideration. We also mentioned not including refrigerant leakage from cold storage or pre-cooling earlier as a second-order effect relative to refrigerated trucks.
The results show that cold chain can reduce CO2 emissions overall. For February, the figures are readily comparable: without cold chain the emissions are 486 kg per tonne of kinnow sold in retail and with the intervention of reefer trucks, the number reduces to 408 kg. (Table 10; Exhibit “CO2 emissions”).
Kinnow cold chain study | 2016 23

Activity
Retail quantity sold
Spoilage (source: Gangwar et al., 2007)
Quantity spoiled
Transportation diesel (4+1) lts/14 km trip (Assuming 14 kms of travel: truck diesel consumption 4 lts and reefer 1 lt)
Distributor quantity shipped
CO2 equivalent for CH4 from spoilage (4.5 kg CH4 from 1 tonne spoilage, factor of 72 for CH4)
Quantity received
Quantity transported
Transportation leakage of R404a (Cooling unit- “Oasis 350” with 6.8 kg of R404a refrigerant with a GWP of 3,940, annual leak at 11% and assuming 20 round trips)
CO2 for cooling at retailer (1KW/MT * 24 hours * Quantity)
CO2 for diesel consumed
Quantity spoiled
Transportation diesel consumed (200 lts for AC cooling)
Pre-cooling at aggregator (5 units for cooling 1 MT for 6 hours)
Spoilage
CO2 for cooling at distributor (Assuming 6 hours of cold storage)
Transportation CO2 for diesel consumed(2.68 kg CO2/lts)
Cold storage at aggregator (Rs 273 for cold storage/ Rs 7 per unit)
Quantity purchased
CO2 equivalent for CH4 from spoilage (4.5 kg CH4 from 1 tonne spoilage, factor of 72 for CH4)
Units
MT
%
MT
lts diesel
MT
kg CO2
MT
MT
kg CO2
kg CO2
kg CO2
MT
lts
kg CO2
%
kg CO2
kg CO2
kg CO2
MT
kg CO2
1
0.16
13.7%
51.43
0.31
1.16
22.69
1.23
1.23
-
-
0.83
0.07
722.86
-
5.7%
-
158.70
-
Sell in cold season open truck (Jan’16)
1.16
1
13.7%
0.16
51.43
0.31
1.16
66.25
1.36
1.36
-
-
0.83
0.20
722.86
-
15.0%
-
176.06
-
Sell in cold season open truck (Feb’16)
1
5%
0.05
1.051.16
17.05
0.39
1.05
3.44
1.06
1.06
5.46
25.26
1.04
0.01
922.86
5.32
1.0%
6.32
194.79
-
Sell in cold season reefer truck (Feb’16)
1
5%
0.05
17.05
0.39
1.05
3.44
1.06
1.06
5.46
25.26
1.04
0.01
922.86
5.32
1.0%
6.32
194.79
41.47
1.05
Sell post season from cold storage and reefer truck (Mar’16)
Table 10: Carbon emission in supply chain
Kinnow cold chain study | 201624

Activity
Operational (Harvesting to shipment) CO2 @4 kg/MT (1 person * 2 days * 2 kWh/day * 1 KgCO2/ 1 kWh)
Spoilage during picking
Quantity spoiled
Harvesting @123 kg/MT
Quantity harvested
CO2 equivalent for CH4 from spoilage (4.5 kg CH4 from 1 tonne spoilage, factor of 72 for CH4)
Units
kg CO2
%
MT
kg CO2
MT
-
4.92
0.03
2.50%
10.21
155.02
Sell in cold season open truck (Jan’16)
1.26
5.45
3%
0.04
13.66
172.86
Sell in cold season open truck (Feb’16)
4.25
3%
0.03
1.101.41
10.65
134.83
Sell in cold season reefer truck (Feb’16)
4.25
3%
0.03
10.65
134.83
1.10
Sell post season from cold storage and reefer truck (Mar’16)
Total CO2 per MT sold at retailer kg CO2 403.79 486.56 408.42 449.89
600
500
400
300
200
100
0.00 1 2 3 4
403.79
486.56
408.42449.89
kg C
O2
CO2 emissions in the supply chain per tonne of Abohar kinnow retailed in Bangalore for the four scenarios: (1) Open truck, Jan’16, (2) Open truck, Feb’16, (3) Reefer truck, Feb’16 and (4) Cold storage and reefer truck, Mar’16.
Kinnow cold chain study | 2016 25

5. IMPLICATIONS
For the specific supply chain, we studied, cold chain investment is beneficial to all of the stakeholders. These findings can be summarized as follows:
• As an aggregator using the cold chain, Balaji benefits a great deal, getting attractive payback periods for the investments needed. Making the cold storage part of a cold chain greatly reduces the payback period thus unlocking value in a highly capital intensive investment.
• Transporting the supply to Bangalore in reefer trucks reduces spoilage of the fruit supply and prevents considerable losses to aggregators. Investment in reefer trucks is profitable for a transporter with a fairly short payback period.
• For the aggregator’s investment of Rs. 40 lakhs in pre-cooling, the payback period is only 2.3 years. For an investment of Rs. 4 crore in cold storage, the payback period for aggregator is 16 years in the base mode without kinnow (with cold storage space rented for other fruits and vegetables) but reduces to 9 years when this cold storage becomes part of the kinnow cold chain using reefers and pre-cooling.
• Commission-based distributors in the supply chain also increase their profitability and margins by becoming part of the cold chain.
• For the transporter, an investment of Rs. 29.5 lakhs in reefer trucks gets paid back in just above 4 years.
• Note that we did not assume any government incentives that are available – these would only further the attractiveness of the investment.
Therefore, there is a strong business case for all the stakeholders to invest in the cold chain for supplying kinnow to Bangalore in off-season. This is not just hypothetical: we have already seen that Balaji have moved from renting to purchasing reefers along with investing in pre-cooling. The distributors and retailers at the Bangalore end are strong advocators for cold-chain for kinnow supply and one distributor had already made investment in reefers and cold storage while the other one was beginning to invest in cold chain towards the end of this study.
Kinnow cold chain study | 201626

This type of profitability analysis can be readily extended to other fruits and vegetables. In general, for other supply chains with other origins and destinations and other fruits and vegetables, our approach shows one way to do profitability analysis for all the commercial entities in the supply chain. We have developed a generic framework for any fruit or vegetable for estimating the business case for an aggregator. For quantity, any applicable volume or weight based unit can be used (kg, case, crate, etc.). These calculations assume operating costs and the resulting operational profits can allow computation of payback period on investment in cold storage, pre-cooling and reefer trucks. As in our approach, the calculations can take all these activities at each level in the supply chain and for different scenarios: (1) – In the peak season, with no cold chain intervention, (2) – Towards the end of season, with no cold chain intervention, (3) – Towards the end of season and using reefer trucks for transportation and (4) - Out of season, with complete cold chain i.e. cold storage and reefer trucks. The spoilage content at different levels of supply chain needs to be considered carefully: in our reading of the literature, these numbers based on overall estimates can vary quite a bit so it is worthwhile examining stage-by-stage spoilage from the farmer to the retailer. See the Appendix (Table A1) for a generic model for the different considerations to include (or not) in any scenario.
The process to decide whether cold chain is viable or not for a specific crop can be the following:
1. Identify crop volume and cold infrastructure that would be needed and when
2. Assess holding life extension of the fruit/vegetable using cold storage
3. Identify potential new markets reach with cold chain – in-season with pre-cooling and
reefer and off-season with cold storage and then shipment with reefer trucks
4. Assess crop potential on those new markets in terms of prices
5. Apply the cold chain framework provided above to determine operational profitability and payback period of the investment
6. Rollout the cold in a structured manner (starting from the field with pack house to the reefer), keeping in mind that the cold chain unlocks the value of the investment when used in its entirety from the pack-house to the retailer.
The Appendix (Table A2, 1-4) provides a framework for calculation of payback periods for any aggregator investing in cold chain (pre-cooler and cold storage) and payback period for a transporter wishing to invest in reefers (Table A2-5).
Besides the implications for aggregators, distributors and transporters, there are implications for farmers and the government. Our interviews with farmers clearly pointed to price and its volatility as a major challenge. Cold chain has the potential for increasing volume of flows, which will result in better returns for farmers. Improved quality results in better prices too. With contract farming, prices could be settled in advance, thus lowering price volatility as well. Moreover, as the government is encouraging the creation of cooperatives these can reap the same benefits as aggregators as shown in our study. NCCD has frequently highlighted that the benefits really come through when the cold chain is an integrated chain of activities all the way from the farmer to the retailer. Therefore, any incentives by way of subsidies should be designed taking a supply chain perspective.
Kinnow cold chain study | 2016 27

FURTHER READING
Barrett, J., Vallack, H., Jones, A., and Haq, G. (2012). A Material Flow Analysis and Ecological Footprint of York. Technical Report, Stockholm Environment Institute, Sweden - see Table 3.14, p. 42.
Choudhury, M. L. (2006). “Recent developments in reducing postharvest losses in the Asia-Pacific region.” Post-harvest management of fruit and vegetables in the Asia-Pacific region: 15-22. Desai, A. (2011). Case study on Potential for Scaling Up: Waste to wealth by incubating mini cold storage technology ventures in India”- World Bank, 2011.
Gangwar, L. S., D. Singh, and Singh, D. B. (2007). “Estimation of post-harvest losses in Kinnow Mandarin in Punjab using a modified formula.” Agricultural Economics Research Review, 20(2).
IPCC (2006). IPCC Good Practice Guidance and Uncertainty Management in National Greenhouse Gas Inventories, IPCC, Geneva.
Jha SN, Vishwakarma RK, Ahmad T, Rai A and Dixit AK (2015). Report on assessment of quantitative harvest and post-harvest losses of major crops and commodities in India. ICAR-All India Coordinated Research Project on Post-Harvest Technology, ICAR-CIPHET.
Mahajan, B., Singh, R., & Kumar, M. (2016). Quality Assurance and Shelf-Life Extension of Kinnow Mandarin Fruit Under Supermarket Conditions. International Journal of Fruit Science, 16(1), 94-102;
Mandal, G. (2015). Effect of lac-wax, citrashine and individual shrink wrapping of fruits on storage life of late harvested kinnow under ambient conditions. International Journal of Bio-resource, Environment and Agricultural Sciences, 1(3), 84-89.
NCCD (2012). Challenges to cold chain development, NCCD, New Delhi
NCCD (2015). Guidelines & Minimum System Standards for implementation in Cold-chain projects. NCCD, New Delhi.
NCCD (2015). All India Cold-chain Infrastructure Capacity (Assessment of Status & Gap), NCCD, New Delhi
Rais M, Sheoran A (2015) Scope of Supply Chain Management in Fruits and Vegetables in India. J Food Process Technol6:427. doi:10.4172/2157-7110.1000427.
Rana, K.R., Karol A., Dahiya, P.S., Pandey, N.K. and Kumar N.R. (2005). Estimation of post-harvest losses in kinnow marketing in India. Indian Journal of Agricultural Marketing, 19(3), 92-102.
Shashi, S., and R. Singh. “Modeling cold supply chain environment of organized farm products retailing in India.” Uncertain Supply Chain Management 3.3 (2015): 197-212.
Kinnow cold chain study | 201628

APPENDIX: A GENERIC FRAMEWORK FOR COLD CHAIN INVESTMENT
Table A1: Generic model for evaluating cold chain viability for fruits and vegetable
S.no.Level Activity for one MT sold by retailer
Peak season - No intervention
End of season : No intervention
End of season : Reefer truck
Off season: Cold storage and reefer
1. Retailer ’s revenues
Retailer level
Revenue from one unit quantity sold, for example, 1 MT or 1 Kg, etc.
2. Spoilage Spoilage at retailer level
4. Operational costs for retailer Operational costs for retailer
Spoilage from transportation/distribution
Quantity received by the distributor from the aggregator
Labour cost at distributor level
Cold storage cost at distributor level
Distributor’s commission, e.g., 9% of the aggregators’ revenues from selling to the retailer
The quantity the aggregator has to sell so that the retailer is able to sell one unit after adjusting for wastages at each stage
The quantity the aggregator has to buy so that the retailer is able to sell (for E.g. 1 MT or 1 Kg) after adjusting for wastages at
each stage
Cost of all operations, primarily labour and transportation from harvest to pack-house
Labour-related pre-cooling loading and unloading cost
Cold storage cost of electricity
Labour-related cold storage loading and unloading cost
5. Procurement cost adjusted for spoilage/Revenues from distribution
If retailer had to purchase 1.1 units to sell 1 unit (adjusting for wastages) the procurement cost of 1.1 units will come here
3. Quantity purchased Quantity purchased at retailer
6. Spoilage from transportation/distribution
Distributor level
7. Quantity received
9. Labour cost
10. Cold storage cost
8. Distributor’s commission
11.
16
Quantity transported
Operational cost (Harvesting till shipment)
Aggregator Level
12. Transportation cost Transportation cost
Post-harvest spoilage at orchard and pack-house
Procurement cost
Pre-cooling cost17. Pre-cooling cost
14. Quantity purchased
19. Cold Storage cost
15.
20.
Procurement cost
Cold Storage loading and unloading cost
13. Spoilage at orchard and pack-house
18. Pre-cooling loading and unloading cost
Kinnow cold chain study | 2016 29

TABLE A2-1: Investment-related costs for pre-cooler Units
Pre-cooler capital cost
Months of pre-cooler usage with one batch per day
Monthly Installment / MT sold in 3rd scenario (End of season : Reefer truck)
Rs
Months
Rs
Installation
Total quantity processed per year @ X MT/per batch
Monthly Installment / MT sold in 4th scenario (Off season: Cold storage and reefer)
Rs
MT
Rs
Monthly Installment for capital cost: X% for Y years
Monthly Installment / MT
Rs
Rs
UnitsTABLE A2-2: Fixed costs for cold storage
Cold storage capital cost
Capacity Utilization @ X %
Monthly Installment / MT
Rs
MT
MT
Monthly Installment for capital cost: X% for Y years
Inventory turnover
Monthly Installment / MT sold in 4th scenario (Off season: Cold storage and reefer)
Rs
per year
Rs
Capacity
Total MT processed/month
MT
MT
UnitsTable A2-3: Payback for pre cooler
Cold storage capital cost
Annual costs including depreciation @X % / month
Quantity shipped in year @ 13.5 MT/reefer
Payback in years
Rs
Rs
MT/year
years
Installation
Operating profit per MT
Annual operating profits
Rs
Rs
Rs/year
Total investment
No. of reefers shipped per year to Bangalore
Annual profits net of depreciation and maintenance
Rs
No.s
Rs/year
Kinnow cold chain study | 201630

UnitsTable A2-4: Payback for cold storage
Cold storage capital cost
Annual costs including depreciation over X years
Quantity shipped in year @ 13.5 MT/reefer
Annual profits net of depreciation-other produce only
Cost of electricity
Payback in years with kinnow
Rs
Rs
MT/year
Rs/year
Rs/year
years
Installation
Operating profit per MT of kinnow
Annual operating profits from kinnow
Annual profits net of depreciation - including kinnow
Rs
Rs
Rs/year
Rs/year
Total investment
No. of reefers shipped per year to Bangalore
Annual operating profits from renting space for other produce
Annual revenues from renting space for other produce
Payback in years without kinnow
Rs
No.s
Rs/year
Rs/year
years
Kinnow cold chain study | 2016 31
RupeesFixed costs (13.5 Ton)
TABLE A2-5: Payback period calculation for Transporter
Chassis
Total Fixed Cost
Return trip revenue percentage
Revenues in one year
Revenue per month
Annual Driver + helper
Annual fuel cost depending upon the trips
Payback in years
Annual Depreciation
Profitability and payback
Cabin + Insulated Body (box)
Revenues
Revenue per return trip
Yearly costs
AC unit
Revenue from outbound journey
No. of months of truck usage in one year
No. of trips/month per truck to destination
Monthly Driver + helper compensation
Fuel cost for a reefer truck: From - To
Profits in one year
Annual Insurance
Total annual costs
Kinnow cold chain study | 201632
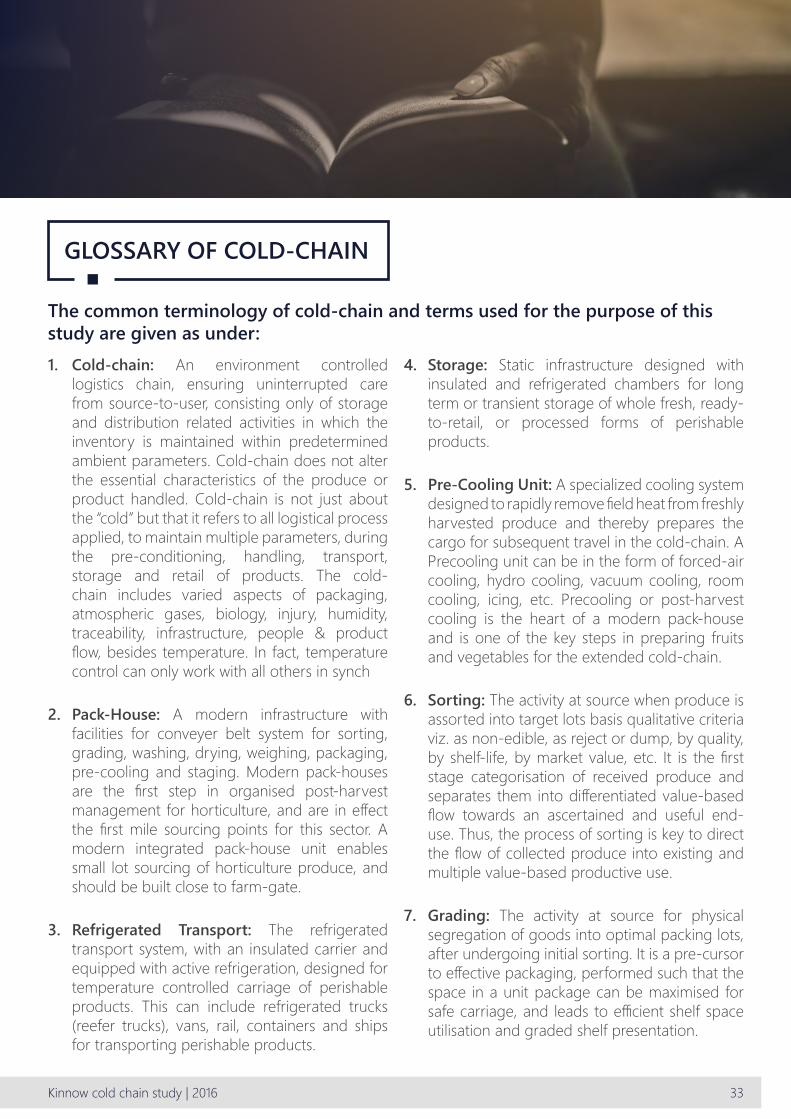
GLOSSARY OF COLD-CHAIN
The common terminology of cold-chain and terms used for the purpose of this study are given as under:1. Cold-chain: An environment controlled
logistics chain, ensuring uninterrupted care from source-to-user, consisting only of storage and distribution related activities in which the inventory is maintained within predetermined ambient parameters. Cold-chain does not alter the essential characteristics of the produce or product handled. Cold-chain is not just about the “cold” but that it refers to all logistical process applied, to maintain multiple parameters, during the pre-conditioning, handling, transport, storage and retail of products. The cold-chain includes varied aspects of packaging, atmospheric gases, biology, injury, humidity, traceability, infrastructure, people & product flow, besides temperature. In fact, temperature control can only work with all others in synch
2. Pack-House: A modern infrastructure with facilities for conveyer belt system for sorting, grading, washing, drying, weighing, packaging, pre-cooling and staging. Modern pack-houses are the first step in organised post-harvest management for horticulture, and are in effect the first mile sourcing points for this sector. A modern integrated pack-house unit enables small lot sourcing of horticulture produce, and should be built close to farm-gate.
3. Refrigerated Transport: The refrigerated transport system, with an insulated carrier and equipped with active refrigeration, designed for temperature controlled carriage of perishable products. This can include refrigerated trucks (reefer trucks), vans, rail, containers and ships for transporting perishable products.
4. Storage: Static infrastructure designed with insulated and refrigerated chambers for long term or transient storage of whole fresh, ready-to-retail, or processed forms of perishable products.
5. Pre-Cooling Unit: A specialized cooling system designed to rapidly remove field heat from freshly harvested produce and thereby prepares the cargo for subsequent travel in the cold-chain. A Precooling unit can be in the form of forced-air cooling, hydro cooling, vacuum cooling, room cooling, icing, etc. Precooling or post-harvest cooling is the heart of a modern pack-house and is one of the key steps in preparing fruits and vegetables for the extended cold-chain.
6. Sorting: The activity at source when produce is assorted into target lots basis qualitative criteria viz. as non-edible, as reject or dump, by quality, by shelf-life, by market value, etc. It is the first stage categorisation of received produce and separates them into differentiated value-based flow towards an ascertained and useful end-use. Thus, the process of sorting is key to direct the flow of collected produce into existing and multiple value-based productive use.
7. Grading: The activity at source for physical segregation of goods into optimal packing lots, after undergoing initial sorting. It is a pre-cursor to effective packaging, performed such that the space in a unit package can be maximised for safe carriage, and leads to efficient shelf space utilisation and graded shelf presentation.
Kinnow cold chain study | 2016 33

8. Cold Room (Staging): An insulated and refrigerated chamber which serves as a transient staging space, and is a necessary attachment to a Pre-Cooling Unit. Appended to pre-coolers, a staging cold room frees the pre-cooler space for the sequential batch of incoming freshly harvested produce. This component is typically installed at farm-gate as part of a modern pack house, and temporarily stores preconditioned fresh produce, awaiting transport link to a distribution point (a cold store close to market).
9. Cold Storage (Bulk): Environment controlled warehousing space with multiple chambers intended for the bulk storage of perishable produce. It is designed for long duration storage of produce so as to build an inventory buffer which will serve to smoothen the episodic production by stabilising & sustaining the supply lines. These are normally constructed in areas close to producing areas (farm-gate) to facilitate quick access to producers for a selective set of crops only.
10. Cold Storage (Hubs): Environment controlled warehousing space with multiple temperature zones for functioning as a distribution hub. It is designed for short term handling of products so as to serve as a distribution logistics platform for market ready packaged produce and ready to retail products. Cold storage (Hubs) are key to effective distribution of perishable foods and essentially at the front end of the cold-chain, constructed close to consuming centres.
11. Reefer Vehicles: Road transport vehicles with a fixed insulated body equipped with active refrigeration designed for environment
controlled carriage of products. These are effectively cold rooms on wheels – or mobile cold stores. The refrigeration on long haul trucks is powered through integrated diesel driven motors, independent of the main truck engine. In case of small vehicles, the use of direct drive systems linked to the vehicle engine or battery powered refrigeration is the norm. Normally Reefer trucks incorporate GPS based location tracking system and are installed with data logging temperature and humidity sensors.
12. Batch-Load: A capacity measurement utilised when the infrastructure is used to sequentially throughput goods after a time based activity or procedure. Usually used for pack-houses where the pre-coolers operate to cool a few tons of produce at a time, in multiple runs or batches per day. For example, a pre-cooler with holding volume of 5 tons can output 15 tons of conditioned vegetables if operated every 6 hours for three times in a day. The batch load in this case would compute to 5 tons/batch in 3 batches/day, or 15 tons per day. Similarly, in case of sorting and grading lines, the batch load is assessed in the volumetric throughput – or tons per hour or per day.
13. Holding Life: Also called Product Life, refers to the Saleable Life Span of a product. In case of Fresh produce, this commences at harvest and extends until the produce perishes. In case of processed food products, this is initiated after the manufacturing process and extends up to the predetermined expiry date. Holding life is divided into time spent in each activity in the supply chain, with Shelf Life being the time spent in the front end, on shelf.
Holding Life (saleable Life span of produce)
Harvest
The holding life of produce is extended with cold-chain, creating more opportunity for producers by expanding the range and accessibility to markets.
Preconditioning at Pack House
Transport & Cold House
Retail Store / Kitchen Shelf
Preparation Transit Shelf Life
Kinnow cold chain study | 201634

NOTES
Kinnow cold chain study | 2016

CARRIER AIRCONDITIONING & REFRIGERATION LIMITED Narsingpur, Kherki Daula Post, Gurgaon-122004, Haryana
www.carrierindia.com + 91 124 4825500


