26
Colombia Economic Outlook Second quarter 2018 Colombia Unit

Colombia Economic Outlook Second quarter 2018
Colombia Unit

Colombia Economic Outlook - Second quarter 2018 2
Contents
1. Editorial 3
2. Global economy: growth rate holds firm, but risks of protectionism intensify 4
3. Moving towards long-term macroeconomic balance 8
Box: The countryside and small cities support national employment 14
4. The Colombian economy in the medium term 21
5. Tables with forecasts 24
Closing date: 5 April 2018

Colombia Economic Outlook - Second quarter 2018 3
1. Editorial
The beginning of 2018, in line with the expectations outlined in the previous issues, has shown a consolidation of
global economic activity, with a developed world that is consolidating its good momentum and an emerging world
improving its performance based on the best prices of raw materials. However, along with this good momentum
and impetus, especially from the fiscal front in the US, some questions are being raised about the potential
vulnerability that this greater stimulus could create in the US public accounts. This, together with the process of
normalisation of monetary policy and the significant appreciation achieved in the capital markets, opens up space
for a more volatile economic environment than in 2017, as was observed at the end of January of this year.
As a result, investment flows to emerging economies have continued, on the basis of still-favourable returns,
although volatility has begun to increase in some of the main financial and economic variables, such as the
exchange rate. However, in a context of an increase of 100 bps in the Fed rates in 2018 (of which we have only
seen 25 bps) and a moderation in the prices of raw materials due to the reaction in the supply, the context of
appetite for regional assets in the second half of the year will be lower and thus the challenge of maintaining
economic momentum will become more significant.
In the case of Colombia, the recovery of economic activity, although slow, has been supported by a significant
reduction in the current account deficit, which in turn has been facilitated by a moderation in private domestic
demand that allows for a more robust balance sheet in households and businesses to face the recovery cycle.
Accordingly, despite the fact that the growth observed in 2017 was only 1.8% and that we anticipate 2% growth for
2018, the basis on which this improved economic performance is being achieved (especially in the second half of
2018) is more solid and will allow a more stable and lasting cycle of expansion. As a result, we expect a 3%
growth for 2019 and a growth that is above the potential (3.3% for Colombia) from 2020. Inflation is converging
with the target and remains around this figure, having overcome the different shocks, the increase in supply in the
last few years that diverted it for 3 years outside the target range, meaning that interest rates can respond again to
give impetus to economic activity and anchor inflation expectations, avoiding unwanted inflationary spirals.
However, the question arises whether reaching a potential growth of 3.3%, despite being achieved in a stable
manner and on a robust basis, is the target or objective at which the Colombian economy should be aiming. In this
regard, the major advances in social indicators reached in the middle of the super cycle of prices of raw materials
(between 2004 and 2014) suggest that to continue along this path requires growth greater than the estimated
potential in the midst of controlled inflation. This challenge, a significant one within a bubble that reduces its growth
potential, imposes the need to reassess the sources of growth of the Colombian economy. In recent years,
potential growth has been achieved through investment, reaching an investment rate of 29% of GDP at the peak
and as a result of the demographic bonus. For the new decade, it will be difficult to continue pressing these factors
because the demographic bonus, given the population growth, is running out and the investment rate is already
high compared to the OECD average. It is worth underlining the need to boost productivity, which has remained
virtually unchanged in the last 30 years in Colombia, judging by metrics such as the industrial product per worker.
And alongside it the boosting of growth with contained inflation and being able to continue making progress in the
reduction of poverty and access to opportunities for Colombians.
Colombia Economic Outlook - Second quarter 2018 4
2. Global economy: growth rate holds firm, but risks of protectionism intensify
The global economy is currently being subjected to divergent forces. The new fiscal stimulus measures approved
by the US administration will prolong the favourable phase in the world economic cycle, which has so far been
supported by high levels of confidence and the positive tone of industrial activity and international trade, which also
benefit China and Europe. However, the increased vulnerability of the US public accounts brought about by these
fiscal stimulus measures, combined with the prospect of financial markets facing greater volatility than in 2017,
make this scenario more uncertain. Added to this is the ratcheting up of protectionist rhetoric in the US, which has
started to find expression in specific measures. This is taking place within a context of normalisation of monetary
policies following years of exceptional stimulus measures, which may also give rise to additional doubts.
Global growth has remained stable at the beginning of 2018 (Figure 2.1), with greater dynamism in emerging economies and some signs of moderation in developed countries. Data available for the first two months of the year suggest that global growth in the first quarter will have been at a similar rate to the average for 2017 (1% QoQ). This growth is supported, firstly, by the strong performance of world trade, which accelerated significantly, especially exports by emerging economies, and in particular - in February - Asian countries (mainly China and India). A second factor is the solid expansion of industrial production, especially in emerging countries.
Probably the biggest novelty in the last three months in the global environment has been the fiscal stimulus approved in the US in February. This should have a moderate effect on growth in the short term (since the US economy is already very close to full employment) and could exert upward pressure on interest rates (in the middle of normalisation by the Fed). For all these reasons, we estimate that it will have a small multiplier effect on activity (of around 0.4), which would involve an upward revision in GDP of around 0.2 to 0.3 pp in both 2018 and 2019.
That said, in the short term the US fiscal stimulus could prolong the expansive cycle at global level, lengthening the cyclical recovery and leading to an increase in demand at global level. However, this effect will be countered in our scenario by the increase in volatility globally or by the resurgence of greater political uncertainty in some areas, as well as by the possible negative effect of the uncertainty associated with protectionist measures.
Following a year dominated by optimism and risk in the financial markets, the first quarter of 2018 showed a more cautious tone. Financial conditions, which have been highly accommodative, have started to be adjusted. Most importantly, volatility, which has been unusually low, seems to be moving towards a more “normal” regime (greater and possibly more persistent volatility shocks), while monetary policy is normalised. In particular, in the case of the Fed we expect that the process may even speed up a little (four 25 bps hikes in the base rate in 2018, as against the three previously forecast) following the fiscal boost. Furthermore, long-term interest rates are settling at higher levels, especially in the US, due to the increased growth and fiscal deterioration, which implies greater financing needs and adds a risk premium to the financing of the US Treasury.
Meanwhile, the episode of volatility at the beginning of February, which caused a major correction of the stock markets in developed countries, has had little transfer to other types of assets at the moment. All this has contributed to raising our indicator of financial tensions in both developed and emerging economies (Figure 2.2).
Given these circumstances, we are maintaining our forecast for world growth at 3.8% for the period 2018-19. However, this involves an upward correction in growth prospects for both the US and the euro zone, offset by slightly less momentum in emerging economies, especially in South America.

Colombia Economic Outlook - Second quarter 2018 5
Figure 2.1 World GDP growth.
(Forecasts based on BBVA-GAIN, % QoQ)
Figure 2.2 BBVA index of financial tensions and VIX
(pp)
Source: BBVA Research Source: BBVA Research based on EPFR
In China, we are maintaining our growth forecasts at 6.3% and 6% for 2018 and 2019 respectively. The majority of recent data shows that momentum in both domestic demand and exports is holding up. Confirmation of an economic policy approach combining cautious monetary policy with expansive fiscal policy, together with the approval of restrictive financial regulation measures make us somewhat more optimistic about the domestic risks associated with China’s economy.
In the case of the US, the positive figures for activity and external trade for the past few months come on top of the aforementioned short-term effects of a more expansive fiscal policy, which combines both tax cuts approved in December (already factored into our previous forecasts) and the new fiscal stimulus measures. As a result, US growth is estimated at 2.8% for both 2018 and 2019 (involving upward revisions of 0.2 pp and 0.3 pp respectively). In Europe, last quarter's solid exports and fixed investment figures, plus resilient private consumption, lead us to maintain the growth forecast for the euro zone (revised slightly upwards to 2.3% in 2018). For 2019, we continue to project a moderation in activity, with growth of around 1.8%, given a degree of exhaustion in the cyclical drive, as already anticipated by the advanced indicators.
Global risks in China are moderating, but are increasing in the US, especially protectionism
The risks around our global scenario have grown due to protectionist threats, materialised in the increase in tariffs by the US and the Chinese response. Although the impact of the measures adopted on global activity has so far been limited, it raises uncertainty about a possible escalation of trade restrictions among the major economic regions – including Europe – that could end up discouraging investment worldwide. Other sources of uncertainty lie in the normalisation of monetary policies, particularly a faster-than-expected exit by the Fed that is not associated with higher growth but rather an unexpected acceleration of inflation. Meanwhile, the risk linked to a sudden adjustment of the Chinese economy has somewhat diminished, following the measures approved in the wake of the Communist Party congress in October and the signs of progressive containment of debt.
0.4
0.6
0.8
1.0
1.2
Mar-
13
Sep
-13
Mar-
14
Sep
-14
Mar-
15
Sep
-15
Mar-
16
Sep
-16
Mar-
17
Sep
-17
Mar-
18
CI 20% CI 40% CI 60%
Point Estimates Period average
0
5
10
15
20
25
30
-1,5
-1,0
-0,5
0,0
0,5
1,0
1,5
ma
r-1
4
se
p-1
4
ma
r-1
5
se
p-1
5
ma
r-1
6
se
p-1
6
ma
r-1
7
se
p-1
7
ma
r-1
8
Developed Markets Emerging Markets VIX

Colombia Economic Outlook - Second quarter 2018 6
Latin American financial markets: resistance to rising volatility in developed markets
Despite the increase in global financial tensions highlighted in the previous section and local factors such as the political noise generated in countries such as Peru, Colombia, Mexico and Brazil and the concern about the effect in Mexico of the renegotiation of the Free Trade Agreement Trade in North America (NAFTA), the tone of financial markets in Latin America has not been especially negative so far this year (Figure 2.3).
In fact, so far this year in many markets there have been gains in the prices of financial assets. This is the case of the majority of the region's stock and exchange markets. With respect to the former, the main exception is Mexico, whose stock market has fallen almost 3% from the beginning of the year until now, erasing part of the increase of 8% registered in 2017. With respect to exchange rates, the Argentine peso and the Brazilian real contrast with the overall positive dynamics of the region’s currencies. In an environment of greater volatility in global markets with great need for external financing, the Argentine currency accumulates a depreciation of 6% in 2018 mainly due to concerns about a possible greater tolerance of local authorities with respect to inflation after the adjustment to the rise of the inflation targets in December 2017. In the case of the Brazilian real, which has depreciated 3% so far this year, the political noise has had a negative effect, in an environment where the presidential elections are beginning to dominate the political agenda, and the lack of significant measures to resolve the fiscal problem.
Likewise, the relative resilience of financial assets in the region has been supported by factors such as the progressive consolidation of the prospects for the recovery of economic activity and the prices of raw materials. With regard to the latter factor, the price of oil has risen 2% so far this year after increasing 18% in 2017. Meanwhile, soy prices are 8% up in 2018, offsetting the drop of 4% registered last year. The price of copper, another of the raw materials that is particularly important to the countries of the region, this year presents a downward correction (-5%), but remains at relatively high levels after having increased by more than 30% during 2017 (Figure 2.4). In general terms, the prices of raw materials are being supported by relatively robust global demand, as well as some supply factors (mainly in the case of soybeans, due to the prospect of a sharp fall in production in Argentina as a result of negative climatic effects) and financial (recent depreciation of the dollar, which mainly benefits the price of oil, and positioning of non-commercial agents in financial markets in the case of copper).
Figure 2.3 Main stock market indices and volatility (VIX) (base 100 June 2015, VIX in %)
Figure 2.4 BBVA Financial Stress Index
*Changes between 31 December 2017 and 5 April 2018. Exchange rate: domestic currency / dollar. In this case increases indicate depreciation. Country risk premium: EMBI. Source: Haver Analytics, Datastream and BBVA Research
Source: BBVA Research
-10
-5
0
5
10
15
20
AR
G
BR
A
CH
I
CO
L
ME
X
PA
R
PE
R
UR
U
Stock Market Risk premium Exchange range
0
20
40
60
80
100
120
mar-
14
jul-
14
no
v-1
4
mar-
15
jul-
15
no
v-1
5
mar-
16
jul-
16
no
v-1
6
mar-
17
jul-
17
no
v-1
7
mar-
18
jul-
18
no
v-1
8
mar-
19
jul-
19
no
v-1
9
BRENT SOYBEANS COPPER

Colombia Economic Outlook - Second quarter 2018 7
Going forward, it is likely that volatility in global financial markets and the gradual reduction of appetite for emerging market assets as long as interest rates in developed countries continue to limit gains in the financial markets in the region. In addition, the prices of raw materials will probably not be as favourable in the coming years as they were in the first few months of 2018, although they will remain slightly higher than we previously anticipated, at least in the case of soybeans and copper (the former due to a deterioration in the outlook for supply and the latter mainly due to higher global growth).Finally, it should be noted that presidential elections will be held in many countries this year (Colombia in May, Mexico in July and Brazil in October), which should increase the volatility of local markets.
Going forward, exchange rates will depreciate gradually given the rise of interest rates in the US
Taking into account the above, we expect that in general the currencies of the region will depreciate in nominal terms going forward (Figure 2.5 and tables of forecasts in section 3). However, mainly due to the upward revision in our commodity forecasts, we now expect the exchange rates of Chile, Colombia, Paraguay, Peru and Uruguay to converge at less depreciated levels than previously forecast (for details on our previous projections, please see our Latin American Economic Outlook for the first quarter).In contrast, we now expect the Argentine peso and the Mexican peso to remain at more depreciated levels in the coming months than we anticipated before.In the first case, we incorporated into our expected path the effect of the higher inflationary pressures and the greater current account deficit.In the second, we now see a weaker peso in 2018, which is explained by the political and renegotiation risks of NAFTA, but we maintain the assumption in our base scenario that these risks will not materialise and that therefore the exchange rate would appreciate significantly in 2019.

Colombia Economic Outlook - Second quarter 2018 8
3. Moving towards long-term macroeconomic balance
Volatility shows signs of life in international markets, even though locally the impact has been limited
So far this year, the global capital markets have shown strong movements, moving uncertainly between the
benefits of greater global growth and the expansive fiscal policy of the United States and the risks of the
imbalances that these policies can create and the response in global monetary policy.Thus, the first weeks of the
year were very positive for emerging assets, focused on the abundance of liquidity, a gradual policy of withdrawal
of stimuli and the improved returns with limited risks offered by these markets.
The markets quickly recognised the implicit risks of this context, and in light of the first signs of a possible economic
overheating, a significant sell-off proceeded to materialise.This event was closed by a salary increase report higher
than the average of the last years and its effect on the expectation of a faster rate increase in the US, which
resulted in a US Treasury bond quickly losing value and a subsequent preference for safe haven assets, in this
case especially in Japan and Europe.Despite these strong movements, the markets have returned to a more
relaxed state, even though they have not reached the levels prior to the risk event, perhaps as a sign of the current
greater sensitivity to these types of fluctuations (Figure 3.1).
Figure 3.1 VIX and S&P 500
(pesos per dollar, index)
Figure 3.2 Daily exchange rate and rate of return for 10-year TES (pesos per dollar,%)
Source: BBVA Research with Bloomberg data Source: BBVA Research with Bloomberg data
In the case of Colombia, as in most emerging markets, the effects were felt especially in the exchange rate, with a
volatility for the first quarter between 2,783 and 2,941 pesos per US dollar (Figure 3.2.), as well as in the stock
market, which had achieved positive advances so far this year of 5.8% (in the Colcap index) before the risk event
and its subsequent regression of -8.9%.Even so, the impact was contained, largely because there remained a
broad appetite for local bonds with entries by portfolio investors for US$1,586 million in the first two months of the
year and a less marked movement of local rates, as in emerging countries, than in international references, in part
also favoured by some raw materials with favourable prices. Part of the resistance shown by local debt was due to
the sharp drop in inflation that improved the real return on public debt and increased appetite on the part of local
investors.
5
15
25
35
45
55
65
75
2300
2400
2500
2600
2700
2800
2900
27
-Mar-
201
7
27
-Ap
r-201
7
27
-May-2
017
27
-Jun-2
017
27
-Jul-2
01
7
27
-Au
g-2
017
27
-Se
p-2
017
27
-Oct-
201
7
27
-No
v-2
01
7
27
-De
c-2
01
7
27
-Jan-2
018
27
-Feb
-201
8
27
-Mar-
201
8
S&P 500 (lft) VIX Index
6
6,1
6,2
6,3
6,4
6,5
6,6
6,7
6,8
6,9
7
2770
2820
2870
2920
2970
3020
3070
3120
27
-Ma
r-1
7
27
-Ap
r-17
27
-May-1
7
27
-Jun-1
7
27
-Jul-1
7
27
-Au
g-1
7
27
-Se
p-1
7
27
-Oct-
17
27
-No
v-1
7
27
-De
c-1
7
27
-Jan-1
8
27
-Feb
-18
27
-Ma
r-1
8
TRM (lft) TES 10Y

Colombia Economic Outlook - Second quarter 2018 9
Going forward, the markets will closely monitor the behaviour especially of US monetary policy, with which we
expect a lower appetite for local debt as the policy and US debt rates continue to rise.Some of this behaviour must
be evidenced by an increase in the risk premium and in the exchange rate.
More private spending in 2018 and 2019
In 2017, the Colombian economy grew 1.8%, completing at least two consecutive years below potential growth,
although the latter figure lessened following the oil crisis. In section 4 of this publication we will analyse in more
detail the potential growth of the economy, its implications and demands for improvement. Last year, the significant
positive contribution of public spending was a highlight, which, in and of itself, contributed half a percentage point to
growth. The other components of domestic demand, mostly from private sources, grew below total GDP, reflecting
the weakness of private spending in the first half of the year and the still gradual and unconsolidated recovery of
household consumption and investment of companies throughout the year (Figure 3.3).
This year, the economic activity will continue with its recovery process, although slow in the first half of the year and
being boosted as the year progresses. In total, the growth will be located at 2%, a figure that is marginally higher
than that observed in 2017, but with one fundamental difference. This time, the growth of private demand will be
located above the GDP expansion, boosting it, and public spending will lose momentum (Figure 3.4). For 2019 we
expect an acceleration of growth up to 3% (Figure 3.3).
Figure 3.3. Components of domestic demand
(Annual variations, %)
Figure 3.4 Growth forecasts and contributions by type of demand (Contribution to annual variation, %)
Source: BBVA Research with DANE data Source: BBVA Research with DANE data
As for the momentum during 2018, the speed will be differential. In the first half there will be a more moderate
rhythm similar to that of 2017. In the second half, there will be a greater expansion, thanks to a better performance
of the buildings sector and a more marked improvement in the confidence of the economy.
First, investment in buildings will fall during the first two quarters of the year, as anticipated by the lower initiations
of works (in square metres) during the year 2017. The recovery in housing sales that has already been evident at
the beginning of the year, although still restricted to low-value homes, may be satisfied with finished inventories
and the works that are already under construction. Only after mid-year, when stocks return to their equilibrium
levels and medium- and high-value home sales also grow, will builders start new housing construction projects at a
greater speed and frequency. However, the initiation of non-residential works, such as commercial premises,
-3
-2
-1
0
1
2
3
4
5
2016 2017 2018 2019
Private Consumption Pubilc Consumption
Fixed Investment
(f)
2,01,8
2,0
3,0
-2
-1
0
1
2
3
4
5
2016 2017 2018f 2010f
Private Demand Public Demand
External net Demand GDP

Colombia Economic Outlook - Second quarter 2018 10
offices and others, will continue slowly until the end of the year and will contribute more to growth after 2019
(Figure 3.5).
Secondly, the confidence of households and companies has been behaving very erratically, with an improving
trend which is not definitive. The negative current and future assessment of the country’s economic behaviour is
the main stumbling block in the case of household confidence. Although these have a better assessment of the
specific conditions of the household, which is already at positive levels, it has not been sufficient to compensate for
the distrust in the variables of the country (Figure 3.6). On the other hand, for industrialists, the expected low
demand and the low volume of current orders seem to explain their low confidence, which, although slightly
positive, is below its historical average since it was first measured in 1980.
Figure 3.5 Leading indicators of the housing construction sector (annual variations of the annual accumulated and% of the offer)
Figure 3.6 Confidence of households and their two main components (Summary of responses, annual average for 2014-2017 and last data for 2018)
Source: BBVA Research Source: BBVA Research with Fedesarrollo data
Investment: the main driver of domestic demand
In 2017, investment growth was driven by spending on civil works and, to a lesser extent, on machinery and
equipment. On the contrary, there were reductions in spending on transport equipment and buildings.
This year and in 2019, the boost to investment will be more extended (Figure 3.3). Within private investment, the
recovery will be more significant in machinery and equipment, which will explain the bulk of the acceleration in total
investment. The increased expense by oil companies will be very important for this. From late 2017, they
accelerated their investment processes thanks to the increase in the price of oil and we expect them to continue for
the same reason. In addition, the improved balance sheets of the manufacturing industry and its progressive
closing of the installed capacity gap will encourage more investments from this sector. Also, the good performance
of this sector and the recovery in foreign trade will once again boost the investment in transportation equipment.
On the other hand, the contribution by the construction of civil works will continue to be significant and, although it
will slow its expansion rate with respect to 2017, in both 2018 and 2019 it will have a growth figure comfortably
exceeding the GDP result (Figure 3.7). As in machinery and equipment, the investment of mining and oil
companies in productive infrastructure will be essential for this investment to continue at high levels. There will also
be a significant increase in expense by regional and local governments of resources from royalties and on territorial
roads, which ended 2017 with strong growth which we expect to continue in 2018. Finally, the execution of fourth-
0%
1%
2%
3%
4%
5%
6%
7%
-14
-9
-4
1
6
11
16
21
'14 '15 '16 '17 '18
Annual housing sales (annual variation)
Annual housing starts (annual variation)
housing inventories (% of total supply, rhs)
21,7
7,7
-11,8-14,9
-7,8
-40
-30
-20
-10
0
10
20
30
2014 2015 2016 2017 2018
Consumer confidence Household component Country component

Colombia Economic Outlook - Second quarter 2018 11
generation infrastructure works will continue to grow in the next two years, although we maintain our position that
the rate of progress thereof will be slower than was expected in the original project, both in number of concessions
and in execution speed, due to the delays in financial closures and the reputational costs of some ongoing
investigations (Figure 3.8).
Figure 3.7 Growth of investment components (annual change, %)
Figure 3.8 Confidence of households and their two main components (Summary of responses, annual average for 2014-2017 and latest data for 2018)
(f) Forecast ** Includes investment in services and agriculture (3.2% of total investment) Source: BBVA Research with DANE data
(f) Forecast
Source: BBVA Research with DANE data
Household consumption will also recover gradually and public spending will slow.
The recovery of private consumption, especially in its component of durable goods and services, will be helped by
the improvement in the financial conditions of households (lower interest rates and inflation), the stabilisation of the
average income of households after their fall following the oil shock, the devaluation of the exchange rate and its
boost to the consumption of domestic services and the upswing of economic activity in general.
Meanwhile, public spending will slow down due to the fiscal adjustments in the Central Government, necessary to
comply with the fiscal rule, and the validity of the Electoral Guarantees Law until June. Even so, government
spending will continue to have an expansion higher than that of GDP, but now with a smaller contribution. In part,
the boost to public spending will come from the decentralised regions (municipalities, governorates), since they are
in the third year of their governments, which is characterised by having a greater execution with respect to their
previous years, especially in the second part of the year.
In 2019, household consumption will continue to recover and will continue to be driven by the group of durable
goods and by the services sector. The investment will grow more uniformly among its components, at that time
including the buildings sector on the positive side. For the first time since 2011, public consumption will grow below
GDP, making the leadership in GDP from the private demand side all the more marked (Figure 3.4).
Finally, although the contribution of net external demand (exports minus imports) will continue to be negative in
growth (-0.1%), it will reduce the variation in GDP less than occurred in 2017 (-0.2%). This is due to the upswing in
4,1
5,0
5,9
3,7
5,6
-3,7
1,7
7,1
-11,3
-9,1
-0,4
6,4
-16 -12 -8 -4 0 4 8 12
Machinery and Equiptment
Civil Works
Housing
2016 2017 2018f 2019f
27,5% 27,0% 27,2% 27,7%
0%
5%
10%
15%
20%
25%
30%
2016 2017 2018f 2019f
Machinery and equipment Housing Civil works without 4G 4G
Colombia Economic Outlook - Second quarter 2018 12
world growth and, in particular, of our main trading partners, which will boost exports and the continued slow
momentum of imports.
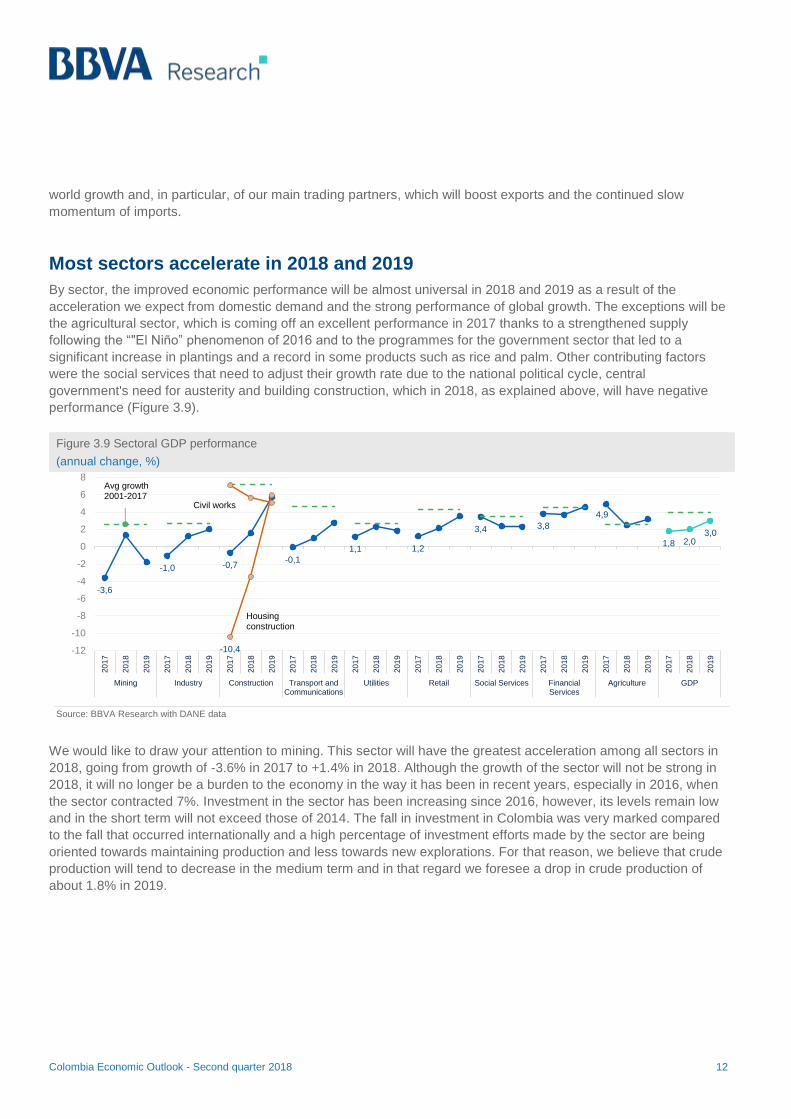
Most sectors accelerate in 2018 and 2019
By sector, the improved economic performance will be almost universal in 2018 and 2019 as a result of the
acceleration we expect from domestic demand and the strong performance of global growth. The exceptions will be
the agricultural sector, which is coming off an excellent performance in 2017 thanks to a strengthened supply
following the “"El Niño” phenomenon of 2016 and to the programmes for the government sector that led to a
significant increase in plantings and a record in some products such as rice and palm. Other contributing factors
were the social services that need to adjust their growth rate due to the national political cycle, central
government's need for austerity and building construction, which in 2018, as explained above, will have negative
performance (Figure 3.9).
Figure 3.9 Sectoral GDP performance
(annual change, %)
Source: BBVA Research with DANE data
We would like to draw your attention to mining. This sector will have the greatest acceleration among all sectors in
2018, going from growth of -3.6% in 2017 to +1.4% in 2018. Although the growth of the sector will not be strong in
2018, it will no longer be a burden to the economy in the way it has been in recent years, especially in 2016, when
the sector contracted 7%. Investment in the sector has been increasing since 2016, however, its levels remain low
and in the short term will not exceed those of 2014. The fall in investment in Colombia was very marked compared
to the fall that occurred internationally and a high percentage of investment efforts made by the sector are being
oriented towards maintaining production and less towards new explorations. For that reason, we believe that crude
production will tend to decrease in the medium term and in that regard we foresee a drop in crude production of
about 1.8% in 2019.
-3,6
-1,0 -0,7-0,1
1,1 1,2
3,4 3,8
4,9
1,8 2,03,0
-10,4-12
-10
-8
-6
-4
-2
0
2
4
6
8
2017
2018
2019
2017
2018
2019
2017
2018
2019
2017
2018
2019
2017
2018
2019
2017
2018
2019
2017
2018
2019
2017
2018
2019
2017
2018
2019
2017
2018
2019
Mining Industry Construction Transport andCommunications
Utilities Retail Social Services FinancialServices
Agriculture GDP
Avg growth 2001-2017
Housing construction
Civil works

Colombia Economic Outlook - Second quarter 2018 13
Figure 3.10 Investment for production and exploration in Colombia (millions of USD)
Figure 3.11 Investment in production and Colombia vs. World (index)
Source: BBVA Research with data from the Colombian Petroleum Association
Source: BBVA Research with data from the Colombian Petroleum Association
0
1000
2000
3000
4000
5000
6000
7000
2014 2015 2016 2017 2018f
Production Exploration
0
20
40
60
80
100
120
2014 2015 2016 2017 2018f
Colombia World without shale

Colombia Economic Outlook - Second quarter 2018 14
Box: The countryside and small cities support national employment
Since the year 2000, the 13 metropolitan areas have led the growth of employment, in most years contributing at
least half of the employment created in the country. This regularity was interrupted in the recent cycle of
deceleration, ending in 2017 with job destruction in the 13 metropolitan areas and job creation in the rural sector
and smaller cities. Despite this dynamic in large cities, in 2017 national employment grew by 226,000 people,
higher than the figure of 139,000 jobs in 2016, one of the lowest since 2007, when it increased by 211,000. In
2017, the smaller towns and cities1 and rural areas contributed 90% of the increase in national employment.
Figure R.1 Creation of national employment by area (2008-2017, thousands of jobs)
Figure R.2 National unemployment rate and 13 cities (% of the work force)
Source: BBVA Research with DANE data Source: BBVA Research with DANE data
This divergent behaviour in the creation of employment led to a distancing in the trends in unemployment at urban
and total national levels. The rate of urban unemployment or in 13 areas was 10.6% at the end of 2017 with an
increase of 0.6%, while national unemployment was at 9.4%, increasing by 0.2%.
Table R.1 Creation of sector employment and by area (thousands of jobs and % of employment created)
Source: BBVA Research with DANE data
1:It refers to the cities that the DANE calls other headings.
-2
25121
82
336
979
793 806
677
352455
514
139226
-200
0
200
400
600
800
1.000
1.200
20
08
20
09
20
10
20
11
20
12
20
13
20
14
20
15
20
16
20
17
13 main cities 10 other capital cities small cities Rural
9,6
9,18,9
9,29,4
10,6
9,99,8
10,0
10,6
8
10
12
2013 2014 2015 2016 2017
National Total 13 main cities
jobs% total
jobsjobs
% total
jobsjobs
% total
jobsjobs
% total
jobsjobs
% total
jobs
Agriculture -4 -2% 1 0% 24 11% 138 61% 159 70%
Industry -20 -9% 9 4% 57 25% 40 18% 86 38%
Real state activities 55 24% 4 2% 33 14% -7 -3% 85 37%
Transport 18 8% 1 0% 27 12% 16 -7% 29 13%
Construction 2 1% -2 -1% -19 -8% -9 -4% -28 -12%
Commerce, hotels and others -51 -22% 3 1% 5 2% -56 -25% -98 -43%
Others -2 -1% 10 4% -7 -3% -8 -3% -7 -3%
Total -2 -1% 25 11% 121 53% 82 36% 226 100%
TotalRuralSmall CitiesOther capital
cities (10)Main cities (13)

Colombia Economic Outlook - Second quarter 2018 15
To a large extent, the divergence between the behaviour of urban and national employment was based on the
strong impetus of agriculture, which represented 70% of the increase in national employment with 159,000 jobs
(x%), concentrated in the rural sector and small cities [Table R.1]. This phenomenon could be explained by the
sound performance of the sector in 2017, by the advances of the post-conflict period and by the public policies that
stimulated new sowing. A second significant sector in the creation of national employment was industry,
participating with 86,000 employees (38% of the employment created).
At urban level or in the 13 cities, the branch with the highest level of job creation was real estate activities with
55,000 jobs (24% of the total). Its sound performance, together with that of the transport sector, made it possible to
offset the loss of jobs in commerce (51,000 jobs) and in industry (20,000 jobs). This contributed to the loss of 2,000
jobs during 2017.
The breakdown of the creation of employment by occupational position gives us more insights about the type of
employment that is being created at national level. In 2017, 94% of the jobs created in rural areas and small cities
were non-salaried (212,000 out of the 226,000 jobs created). The dynamism in the creation of this type of
employment began in 2015, creating some uncertainty as traditionally it has a very high informal component (for
example, in the 13 large cities more than 80% of these jobs are informal)
This could send a message of lower productivity in the work created last year. For example, informal workers are
less educated than formal workers (at the level of 23 cities, only 72% of informal workers have secondary or higher
education compared to 90% of formal workers at the 23 city level) and usually work in less favourable conditions
(33% of informal workers work at a fixed site compared to 80% of formal employees in the 23 cities).
Figure R.3 Creation of national employment by area and type of labour dependency (thousands of employed persons)
Source: BBVA Research with DANE data
With that in mind, the resilience of national employment in 2017, associated with the creation of employment in
rural areas and small cities, is very good news but may be hiding a deterioration in the quality thereof that could
have an impact on productivity. However, in the current transit of the productive apparatus towards new
opportunities for growth, centred largely on agriculture, tourism and agro-industry, it is necessary to accompany
these growths with higher levels of formal employment and higher productivity.
213273
234
11458
179
191
85
25
-9-2
84
-10 -76 -35-39
-93
205
76 212
-200
-100
0
100
200
300
400
500
600
2013 2014 2015 2016 2017
23 capital cities wage earners Small cities and rural wage earners 23 capital cities non wage earners Small cities and rural non wage earners

Colombia Economic Outlook - Second quarter 2018 16
The majority of shocks that accelerated inflation have been diluted, with inflation thus approaching the target
In the context of still-weak demand and having diluted the effects of the VAT increase on several CPI products,
inflation so far in 2018 has fallen significantly. This reduction in inflation has been especially concentrated in food
inflation (1% YoY in March) and tradable goods (1.8% YoY in March) aided by the low level of the exchange rate in
the year so far. Looking ahead, we expect non-tradable inflation (4.8% YoY at March) to cool down thanks to the
decline in lease inflation and some indexed services, whose prices will be updated with an inflation rate that has
been falling since 2016 (Figures 3.12 and 3.13). Regulated prices (6% YoY as of March) will also help to reduce
inflation: fuel prices should not rise at the same speed as 2017, when the price of oil registered an increase higher
than that anticipated for 2018 and it would mitigate partially with the lower exchange rate. Also, a decrease in the
cleaning and sewage rate in Bogotá is expected, which will serve to offset the increases in energy distribution rates
that will be seen in some cities throughout this year.
Figure 3.12. Headline and indexed inflation
(annual change, %)
Figure 3.13. Headline and lease inflation
(annual change, %)
Source: BBVA Research with DANE data Source: BBVA Research with DANE data
In total, we expect inflation to continue falling to a minimum rate in the middle of this year close to 2.9%. From this
moment inflation will stabilise and end 2018 at a rate close to 3.1%. By 2019, with an economy that will continue to
grow below its potential, and with the updating of the cost of some services (leases and education) to lower
inflation levels that will follow the dynamics of Figures 3.12 and 3.13, we believe that inflation is likely to end the
year at a rate close to 2.8% YoY.
The monetary policy rate is slightly expansive, there would be some space to reduce it if inflation continues to fall as anticipated
The current level of the policy rate (4.5% at the time of writing) is slightly expansionary according to the Central
Bank.In our calculations it is in the upper part of the neutral range because we have a lower expected inflation than
the Central Bank.Going forward, as a result of the good performance of inflation, especially core inflation, which
since the beginning of the year has shown a significant downward trend and we expect it to converge around 3%
this year (it is already below that anticipated by the Central Bank), together with a weak closing of activity in 2017
and the prospect of a slow recovery in the first half of 2018, we believe that the Central Bank could make some
additional reduction in its policy rate. Partly to avoid its current slightly expansionist position (according to its
calculations) being diluted without having achieved its entire contribution in the reactivation of the economy.
3,0
3,5
4,0
4,5
5,0
5,5
6,0
6,5
7,0
0
1
2
3
4
5
6
7
8
9
Feb
-09
Sep
-09
Apr-
10
No
v-1
0
Ju
n-1
1
Ja
n-1
2
Aug
-12
Mar-
13
Oct-
13
May-1
4
De
c-1
4
Ju
l-15
Feb
-16
Sep
-16
Apr-
17
No
v-1
7
Ju
n-1
8
Ja
n-1
9
Total forwarded 12m (lhs) Indexed (rhs)
2,5
3,0
3,5
4,0
4,5
5,0
0
1
2
3
4
5
6
7
8
9
10
Feb
-09
Aug
-09
Feb
-10
Aug
-10
Feb
-11
Aug
-11
Feb
-12
Aug
-12
Feb
-13
Aug
-13
Feb
-14
Aug
-14
Feb
-15
Aug
-15
Feb
-16
Aug
-16
Feb
-17
Aug
-17
Feb
-18
Aug
-18
Feb
-19
Total forwarded 12m (lhs) Housing (rhs)

Colombia Economic Outlook - Second quarter 2018 17
However, in its communications in recent months, the Central Bank has underlined the fact that the space to
reduce rates is running out and has gradually shifted towards a language that justifies the end of the bearish cycle,
with the information available. This is due to some specific concerns about the convergence of the inflation of the
group of non-tradables to the target and the limitations that monetary policy in the US, with 100 bps of interest rate
increases this year, could impose on the local currency policy and its effects on foreign exchange and capital
flows.Here we agree with the Central Bank that the space for additional rate reductions is limited, but we see
arguments in the significant reduction of the current account deficit, higher than anticipated by analysts and the
Central Bank, and the ability to finance this imbalance in its vast majority with direct foreign investment, together
with the internal factors previously described, which will be able to reduce the policy rate by 50 bps in this second
quarter of the year, thus reaching a level of 4%.
Figure 3.14 Nominal and real policy interest rate
(with inflation expected by BBVA at 12 months, %)
Figure 3.15 Interest rates
(pesos per dollar)
Source: BBVA Research with BanRep and DANE data Source: BBVA Research based on Bloomberg data
Controlled depreciation of the Colombian peso for the remainder of the year
The scenario of better prices for raw materials that was consolidated since the end of 2017 together with a still
ample global liquidity in need of higher returns than those available in their local markets, allowed a significant
appreciation of the exchange rate at the beginning of the year.In spite of this, and taking into account that the cycle
of adjustment of the monetary policy of the United States throughout 2018 and with a crude oil price that would be
reduced gradually between 2018 and 2020 to reach US$60 per barrel Brent, we expect a gradual depreciation of
the exchange rate from the second quarter of the year and for it to continue until mid-2019.By 2018, we expect the
exchange rate to reach close to 2920 pesos per dollar at the close, even though its average would be 2859 pesos
per dollar (appreciated against the 2017 average).
By 2019, the improved performance of the economy and the completion of the policy adjustment of the United
States will allow a change in the currency trend, which would close to 2900 pesos per dollar but with an average
close to 2920.To a large extent, the reduced volatility of the exchange rate will come from a smaller external deficit
and the ability to finance it with long-term resources, as will be explained below.
1,0
1,2
1,4
1,6
1,8
2,0
2,2
3,0
3,5
4,0
4,5
5,0
5,5
oct-
17
no
v-1
7
dic
-17
en
e-1
8
feb-1
8
mar-
18
ab
r-18
may-1
8
jun
-18
jul-
18
ag
o-1
8
se
p-1
8
oct-
18
no
v-1
8
dic
-18
Nominal (rhs) Real Neutral range
2859
2920
2800
2820
2840
2860
2880
2900
2920
2940
2960
2980
3000
De
c-1
7
Feb
-18
Apr-
18
Ju
n-1
8
Aug
-18
Oct-
18
De
c-1
8
Feb
-19
Apr-
19
Ju
n-1
9
Aug
-19
Oct-
19
De
c-1
9

Colombia Economic Outlook - Second quarter 2018 18
The external deficit of the Colombian economy will continue to fall in 2018 and will be financed primarily from direct foreign investment
In 2017, the deficit in the current account stood at 3.3% of GDP (Figure 3.16), which is equivalent to US$10.359
billion (Figure 3.17.). It was a very positive fact, since the deficit reached 6.4% of GDP and almost US$20 billion
dollars in 2015. Since then, the adjustment of domestic demand has been progressive and orderly, allowing a
reduction in the deficit. More recently, the corrective trend has deepened with the sustained increase in the price of
raw materials, especially oil, and with relatively stable production, since the end of 2017. However, not only raw
materials increased their export value, but also shipments of non-traditional goods, particularly from agro-industry,
showed a satisfactory recovery, especially in the second half of 2017.
This year, the higher growth of our main trading partners and the stability of the prices of raw materials,
accompanied by a level of oil production similar to that observed in 2017, will allow a new growth of exports. These
will again, after four years, surpass the level of US$40 billion dollars in 2018, growing 6.9% annually.By 2019,
exports will have only slight growth (0.7%). Despite the higher external demand for other non-mining products,
largely from the United States due to its higher growth, we anticipate lower exported oil value due to lower prices
and quantities.
Imports, on the other hand, will grow at a slow pace, although they will accelerate slightly compared to previous
years, mainly in 2019. As a result, the trade deficit this year will be similar to that presented in 2017, only slightly
higher. In 2019, however, given the relative stability of exports, the trade deficit will again increase significantly from
US$4.6 billion to US$7.8 billion.
Thus, the deficit of the current account this year could stand at 2.7% of GDP and at a dollar value almost identical
to that presented in 2017, of US$10.4 billion. This will help the new increase in remittances, which will be driven by
the better performance of the labour market in the United States, Chile and Europe. The largest contribution to the
deficit during 2018 and 2019, on average, will come, as in 2017, from the imbalance in the factor income account.
This is due to the greater amount of foreign dividends sent by foreign companies with a presence in Colombia in
relation to the arrival of dividends from Colombian companies operating abroad.
Foreign direct investment (FDI) will be the main source of financing for the external deficit. This is positive, since
this capital has a longer duration, on average, than that observed in portfolio and other capital. During 2018 and
2019, the FDI will be equivalent to 138% of the value of the external deficit. This differs profoundly from the
tightness that occurred in 2014 and 2015, when FDI only accounted for 72% of external financing needs (Figure
3.16). Therefore, this year and, to a lesser extent, in 2019, unlike the previous four years, international reserves will
again be accumulated in a significant manner, a positive fact for the long-term stability of the Colombian economy.

Colombia Economic Outlook - Second quarter 2018 19
Figure 3.16 Current account deficit and its financing (% of GDP)
Figure 3.17 Components of the current account deficit (Billions of dollars)
Source: BBVA Research with BanRep data Source: BBVA Research with BanRep data
The improvement of oil revenues helps achieve the fiscal adjustment in 2018
In the 2018 tax balance, we expect the government to reach a deficit of 3.1% of GDP, thus decreasing compared to
3.6% in 2017 and the recent high of 4% in 2016. This reduction, of half a percentage point of GDP, in line with the
fiscal rule, depends especially on the austerity effort contemplated in the budget approved for this year with an
expected reduction in government spending from 19.3% of GDP in 2017 to 18.5% of GDP in 2018.This significant
expenditure effort responds in part to the fact that government revenues in 2018 will be situated at 15.4% of GDP,
below the figure reached in 2017 of 15.7%. This is to the extent that the higher revenues from oil revenues derived
from Ecopetrol’s increased profits last year only partially offset the fact that no one-off events are anticipated like
the arbitration award paid by the telecommunications companies in 2017.
For 2019, the fiscal rule requires that the deficit be 2.2% of GDP, 0.9 percentage points lower than in 2018. In
2019, the challenge is a complex one due to the corporate tax reduction calendar for large companies that needs to
be applied that year (removal of the 4% surcharge and tax rate for large companies would be 33% compared to
40% in 2017, 40% in 2016 and 39% in 2015). In the official scenario, the Government estimates an increase in
revenues of 0.6 points of GDP in 2019 due to better management of the DIAN and greater formalisation of the
economy to offset the lower income from the dismantling of the tax surcharge. Due to the traditional difficulties and
uncertainty in improving tax management, our scenario envisages a deficit of 2.5% of GDP. Which would thus
require an active fiscal policy to achieve the deficit established by the fiscal rule.
The main challenge to economic recovery is low confidence
The 2018 growth appears to be neutral to the risks of higher and lower growth, as they would cancel each other
out. On the upside, we consider a quicker-than-expected acceleration of the building sector. The greater
willingness to purchase housing in recent data from the consumer confidence survey makes this improved scenario
more likely. Also, a more positive effect of higher US growth on our exports could materialise, which is partially
included, but could be accelerated by the combination of the high exchange rate and high growth rates of that
country, a positive cocktail that Colombia has rarely had in its history. Finally, during 2017, public spending
surprised considerably on the upside, even at the end of the year when some regional and local governments were
(f)
5,26,4
4,3
3,3
2,7
3,2
4,34,0
4,94,7
4,4
4,9
0
1
2
3
4
5
6
7
20
14
20
15
20
16
20
17
20
18
20
19
Fiscal Deficit (% of GDP) FDI (% of GDP)
9,2
4,8 4,67,8
5,2
8,2 7,7
6,7
3,64,1 3,6
4,0
-5,9 -6,7 -7,0 -7,6
-10
-5
0
5
10
15
20
2016 2017 2018f 2019f
Commercial balance Factor remuneration Services Transfers

Colombia Economic Outlook - Second quarter 2018 20
already under the Electoral Guarantees Law. For this year, it has not been ruled out that a similar surprise could
occur.
The downward factors, which will offset the previous ones, are the continuation of low confidence (with effects on
consumption and investment) and a slower execution of infrastructure works.
By 2019, there does seem to be a downward bias in the projection, although it continues to have a low probability
of occurrence. The factors that will condition growth are the same as in 2018, with a very strong adjustment in the
fiscal deficit if the expected increases in tax and capital income do not materialise.
The good news is that there are two risks that were being monitored in the past and have been diluted to very low
probabilities of occurrence. These are: high and inertial inflation on the downside, with contractive monetary policy,
and a broad and poorly financed external deficit. As seen in the most recent data, inflation showed a clear
downward trend and gives space to monetary policy to place the interest rate in an expansive or slightly expansive
terrain. In addition, the current account deficit was reduced in 2017 and was financed comfortably by foreign direct
investment.
Colombia Economic Outlook - Second quarter 2018 21
4. The Colombian economy in the medium term
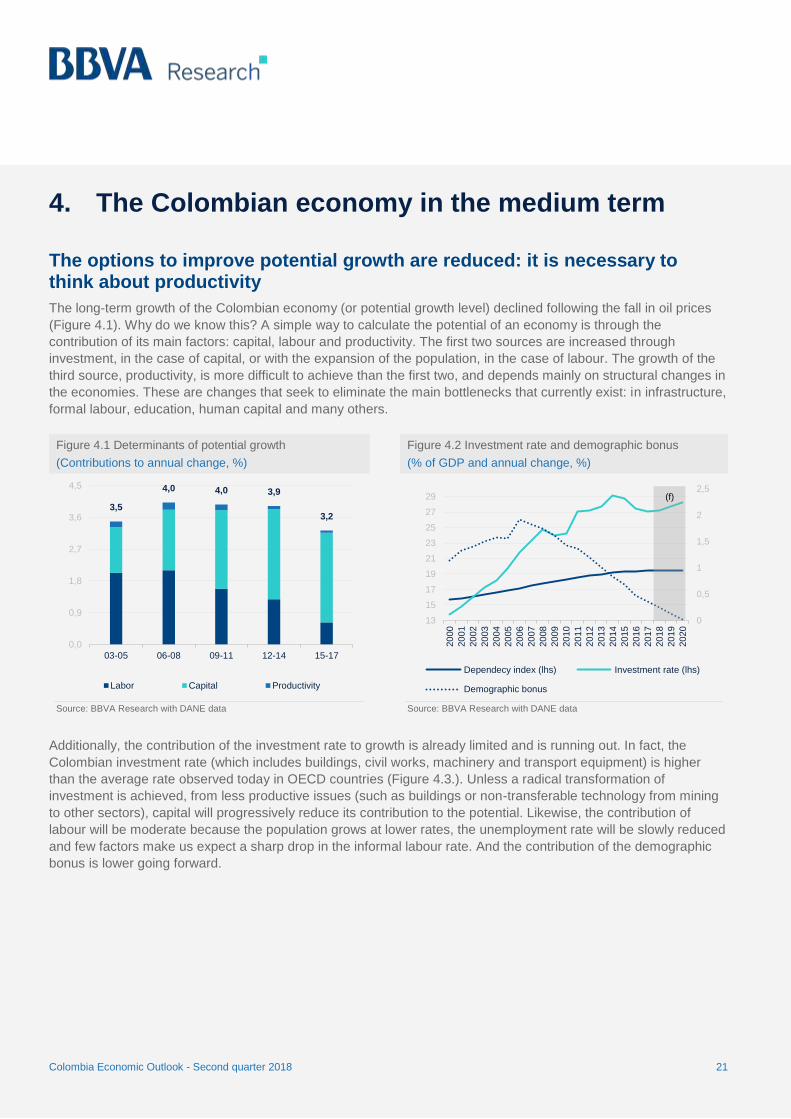
The options to improve potential growth are reduced: it is necessary to think about productivity
The long-term growth of the Colombian economy (or potential growth level) declined following the fall in oil prices
(Figure 4.1). Why do we know this? A simple way to calculate the potential of an economy is through the
contribution of its main factors: capital, labour and productivity. The first two sources are increased through
investment, in the case of capital, or with the expansion of the population, in the case of labour. The growth of the
third source, productivity, is more difficult to achieve than the first two, and depends mainly on structural changes in
the economies. These are changes that seek to eliminate the main bottlenecks that currently exist: in infrastructure,
formal labour, education, human capital and many others.
Figure 4.1 Determinants of potential growth
(Contributions to annual change, %)
Figure 4.2 Investment rate and demographic bonus
(% of GDP and annual change, %)
Source: BBVA Research with DANE data Source: BBVA Research with DANE data
Additionally, the contribution of the investment rate to growth is already limited and is running out. In fact, the
Colombian investment rate (which includes buildings, civil works, machinery and transport equipment) is higher
than the average rate observed today in OECD countries (Figure 4.3.). Unless a radical transformation of
investment is achieved, from less productive issues (such as buildings or non-transferable technology from mining
to other sectors), capital will progressively reduce its contribution to the potential. Likewise, the contribution of
labour will be moderate because the population grows at lower rates, the unemployment rate will be slowly reduced
and few factors make us expect a sharp drop in the informal labour rate. And the contribution of the demographic
bonus is lower going forward.
3,5
4,0 4,0 3,9
3,2
0,0
0,9
1,8
2,7
3,6
4,5
03-05 06-08 09-11 12-14 15-17
Labor Capital Productivity
0
0,5
1
1,5
2
2,5
13
15
17
19
21
23
25
27
29
20
00
20
01
20
02
20
03
20
04
20
05
20
06
20
07
20
08
20
09
20
10
20
11
20
12
20
13
20
14
20
15
20
16
20
17
20
18
20
19
20
20
Dependecy index (lhs) Investment rate (lhs)
Demographic bonus
(f)

Colombia Economic Outlook - Second quarter 2018 22
Figure 4.3 OECD comparative investment rate (% GDP, 2016)
Source: BBVA Research with OECD data
As a result, the Colombian economy will reach potential growth close to 3.3% between 2018 and 2022, lower than
that registered in the period of high prices of raw materials (between 4% and 4.5%). With that in mind, the era of
high growth from traditional sources, which are perhaps the simplest, is running out. Therefore, if achieving
improved growth of the economy in the long term is an objective, it is necessary to promote structural changes that
increase the productivity of the Colombian economy, aligning both private incentives and public policy with this
pole.
Figure 4.4 Industrial product / trade sales
Source: BBVA Research with DANE data
Why do we need higher growth?
To cite one example, the significant advances that Colombia has experienced in its poverty indicators in the last
fifteen years will not be easy to repeat in a context in which the economy cannot be accelerated. Fifteen years ago,
49.7% of the Colombian population lived in poverty. By the end of 2017, that figure stood at 26.9%. In other words,
7.1 million people moved out of poverty in these fifteen years. However, despite these great advances, many
25,123,4
20,4
23,4
29,2 28,7
20,221,9
24,8
29,1
19,822,4 22,8
19,1
9,9
14,9
20,422,5
17,0
21,3
28,9
17,019,8 19,7
26,223,9
20,0 19,621,5
19,7
22,9
19,7
23,321,6
25,5
0
5
10
15
20
25
30
35
Austr
alia
Ne
w Z
eala
nd
Isra
el
Ja
pa
n
Kore
a
Turk
ey
De
nm
ark
Fin
lan
d
Sw
eden
No
rwa
y
La
tvia
Belg
ium
Fra
nce
Ge
rma
ny
Gre
ece
Port
ug
al
Spa
in
Sw
itze
rla
nd
Un
ited
Kin
gdo
m
Ice
lan
d
Irela
nd
Ita
ly
Lu
xe
mb
ou
rg
Ne
the
rla
nds
Cze
ch R
ep
ub
lic
Esto
nia
Hu
ng
ary
Pola
nd
Slo
vak R
epu
blic
Slo
venia
Ca
na
da
Un
ited
Sta
tes
Mexic
o
Ch
ile
Co
lom
bia
-4
-2
0
2
4
6
8
10
12
14
'81 '82 '83 '84 '85 '86 '87 '88 '89 '90 '91 '92 '93 '94 '95 '96 '97 '98 '99 '00 '01 '02 '03 '04 '05 '06 '07 '08 '09 '10 '11 '12 '13 '14 '15 '16 '17
Average production per worker (Industry) Average sales per worker (retail)

Colombia Economic Outlook - Second quarter 2018 23
Colombians are still living in poverty. The task of reducing poverty is still enormous and for that reason the
Colombian economy must grow more and in a better way.
To highlight the importance of good growth, it is important to note that among the factors that most contributed to
this decline in poverty between 2002 and 2017 are the control of inflation and the acceleration of growth. In the
period between 2010-2014, when average inflation stabilised at low levels (2.89% per year for low incomes) and
growth was at high levels (4.8% on average) as a result of the good momentum of the raw materials, the most
significant reductions in poverty were achieved with 2.4 pp on average per year, a better figure than that of the
period between 2003 and 2009, where there was a reduction of 1.3 pp on average per year. Meanwhile, between
2015 and 2017, poverty only reached an average reduction of half a percentage point per year (0.5 pp) as a
consequence, among others, of the slowdown in growth and the increase in inflation. In particular, in 2016, a
combination of low growth (2%) and high average inflation (8% for low income) saw poverty increase by 0.2 pp.
Figure 4.5 Poverty and annual reduction of poverty (% of total population and percentage points)
Source: BBVA Research
To continue with these and other social advances that have been achieved in recent years is a significant
challenge, not only in order not to lose what has been gained but also to continue to create quality opportunities for
Colombians. Going forward, these advances will possibly be more difficult to consolidate, since the economy is
suggesting a slow recovery and a potential growth rate lower than that reached in the years of the greatest
improvements in the different indicators. It is therefore central to the economic and political discussion to see how
new social advances are going to materialise and without a doubt at the centre of the discussion will be the
capacity to improve the potential growth of the Colombian economy.
Growth based on higher productivity implies greater inclusion, reducing informal labour, which is one of the main
sources of poverty and inequality in Colombia. It also involves greater rates of education, contributing in a definitive
way to the consolidation of human capital and the ability to take advantage of the opportunities of the new
economic and social environment. The achievement of this objective requires a State that works with the private
sector and infrastructures that allow a reduction of the costs of inclusion for society and production within Colombia
and the world.
49,7
-1,7 -0,6-2,4
-1 -1 -1-1,7
-3,1
-3,1-1,4
-2,1-2,1 -0,7
0,2
-1,1
26,9
0
10
20
30
40
50
60
2002 2003 2004 2005 2008 2009 2010 2011 2012 2013 2014 2015 2016 2017 2017
Total poverty 2002 Total poverty en 2017
Annual inflation: 5,4%Annual growth: 4,7%
Annual inflation lower incomes : 2,89%Annual growth: 4,8%
Annual inflation lower incomes : 5,72%Annual growth: 2,3%

Colombia Economic Outlook - Second quarter 2018 24
5. Tables with forecasts
Table 5.1 Annual macroeconomic forecasts
2014 2015 2016 2017 2018 2019
GDP (YoY, %) 4.4 3.1 2.0 1.8 2.0 3.0
Private consumption (YoY, %) 4.3 3.2 1.5 1.7 2.5 3.4
Public consumption (YoY, %) 4.7 5.0 2.4 4.0 2.7 2.5
Fixed investment (YoY, %) 9.8 1.8 -2.7 0.1 2.7 4.8
Inflation (%, YoY, eop) 3.7 6.8 5.7 4.1 3.1 2.8
Inflation (%, YoY, average) 2.9 5.0 7.5 4.3 3.1 2.7
Exchange rate (eop) 2,392 3,149 3,001 2,984 2,920 2,900
Devaluation (%, eop) 24.2 31.6 -4.7 -0.6 -2.1 -0.7
Exchange rate (average) 2,001 2,742 3,055 2,951 2,858 2,920
Devaluation (%, average) 7.1 37.0 11.4 -3.4 -3.2 2.2
BanRep interest rate (%, eop) 4.50 5.75 7.50 4.75 4.00 4.00
Deposit interest rate (%, eop) 4.3 5.2 6.9 5.3 4.4 4.4
Fiscal balance (% of GDP) -2.4 -3.0 -4.0 -3.6 -3.1 -2.5
Current account balance (% of GDP) -5.2 -6.5 -4.4 -3.3 -2.7 -3.2
Unemployment rate (%, eop) 9.3 9.8 9.8 9.8 10.8 10.6
Source: Banco de la República, DANE and BBVA Research
Table 5.2 Quarterly macroeconomic forecasts
GDP
(%, YoY)
Inflation
(%YoY, eop)
Exchange rate
(vs. USD, eop)
BanRep rate
(%, eop)
Q1 15 2.6 4.6 2,576 4.50
Q2 15 3.0 4.4 2,585 4.50
Q3 15 3.2 5.4 3,122 4.75
Q4 15 3.4 6.8 3,149 5.75
Q1 16 2.5 8.0 3,022 6.50
Q2 16 2.2 8.6 2,916 7.50
Q3 16 1.5 7.3 2,880 7.75
Q4 16 1.8 5.7 3,001 7.50
Q1 17 1.5 4.7 2,880 7.00
Q2 17 1.7 4.0 3,038 6.25
Q3 17 2.3 4.0 2,937 5.25
Q4 17 1.6 4.1 2,984 4.75
Q1 18 1.8 3.1 2,780 4.50
Q2 18 1.7 2.8 2,850 4.00
Q3 18 2.1 3.1 2,860 4.00
Q4 18 2.7 3.1 2,920 4.00
Q1 19 3.1 2.7 2,950 4.00
Q2 19 3.1 2.7 2,920 4.00
Q3 19 2.8 2.6 2,900 4.00
Q4 19 2.9 2.8 2,900 4.00
Source: Banco de la República, DANE and BBVA Research

Colombia Economic Outlook - Second quarter 2018 25
DISCLAIMER
This document, prepared by BBVA Research Department, is informative in nature and contains data, opinions or
estimates as at the date of its publication. These derive from the department’s own research or are based on
sources believed to be reliable, and have not been independently verified by BBVA. BBVA therefore makes no
guarantee, express or implied, as to the document's accuracy, completeness or correctness.
Any estimates contained in this document have been made in accordance with generally accepted methods and
are to be taken as such, i.e. as forecasts or projections. The historical evolution of economic variables (positive or
negative) is no guarantee that they will evolve in the same way in the future.
The contents of this document are subject to change without prior notice for reasons of, for example, economic
context or market fluctuations. BBVA does not give any undertaking to update any of the content or communicate
such changes.
BBVA assumes no responsibility for any loss, direct or indirect, that may result from the use of this document or its
contents.
Neither this document nor its contents constitute an offer, invitation or solicitation to acquire, divest or obtain any
interest in assets or financial instruments, nor can they form the basis of any contract, commitment or decision of
any kind.
In particular as regards investment in financial assets that may be related to the economic variables referred to in
this document, readers should note that in no case should investment decisions be made based on the contents of
this document; and that any persons or entities which may potentially offer them investment products are legally
obliged to provide all the information they need to take these decisions.
The contents of this document are protected by intellectual property law. It is expressly prohibited to reproduce,
process, distribute, publicly disseminate, make available, take extracts, reuse, forward or use the document in any
way and by any means or process, except where it is legally permitted or expressly authorised by BBVA.

CONTACT DETAILS: BBVA Research Colombia Carrera 9 No 72-21 piso 10. Bogotá, (Colombia). Tel.: 3471600 ext 11448 [email protected] www.bbvaresearch.com
This report has been produced by the Colombia Unit
Head Economist Colombia Juana Téllez [email protected]
Fabián García [email protected]
Mauricio Hernández [email protected]
María Llanes [email protected]
Alejandro Reyes [email protected]
Diego Suárez [email protected]
BBVA Research
Group Chief Economist Jorge Sicilia Serrano
Macroeconomic Analysis Rafael Doménech [email protected]
Digital Economy Alejandro Neut [email protected]
Global Macroeconomic Scenarios Miguel Jiménez [email protected]
Global Financial Markets Sonsoles Castillo [email protected]
Long term Global Modelling and Analysis Julián Cubero [email protected]
Innovation and Processes Oscar de las Peñas [email protected]
Financial Systems and Regulation Santiago Fernández de Lis [email protected]
Digital Regulation and Trends Álvaro Martín [email protected]
Regulation Ana Rubio [email protected]
Financial Systems Olga Cerqueira [email protected]
Spain and Portugal Miguel Cardoso [email protected]
United States Nathaniel Karp [email protected]
Mexico Carlos Serrano [email protected]
Middle East, Asia and Big Data Álvaro Ortiz [email protected]
Turkey Álvaro Ortiz [email protected]
Asia Le Xia [email protected]
South America Juan Manuel Ruiz [email protected]
Argentina Gloria Sorensen [email protected]
Chile Jorge Selaive [email protected]
Colombia Juana Téllez [email protected]
Peru Hugo Perea [email protected]
Venezuela Julio Pineda [email protected]


