14
COM Data Dashboard Planning, Research and Institutional Effectiveness 1
| Date post: | 01-Apr-2015 |
| Category: |
Documents |
| Upload: | cassidy-rollerson |
| View: | 223 times |
| Download: | 2 times |
1
COM Data Dashboard
Planning, Research and Institutional Effectiveness
2
What is COM Data Dashboard
• Contains research and statistics on:-Student Demographics
• Student Enrollment
-Student Achievement• Course Retention• Course Success• Cohort Tracking• Student Persistence• Degrees/Certificates Awards• Program Review
3
How can Data Dashboard be used?Examples
• The Data Dashboard contains demographic data and passing rates for courses at College of Marin, and is accessible through the intranet.
• Data Dashboard can permit a snapshot of which students are enrolled in the course so that instructors can be aware of instructional modifications they may wish to make to maximize effectiveness.
• The Dashboard can also be used to encourage data-driven discussion among instructors around reaching particular groups of students.
4
Limitations
Live data (as of this moment) Waiting time Access on Campus network only

5
Access to ARGOS/Dashboard
• ARGOS account• COM intranet
6
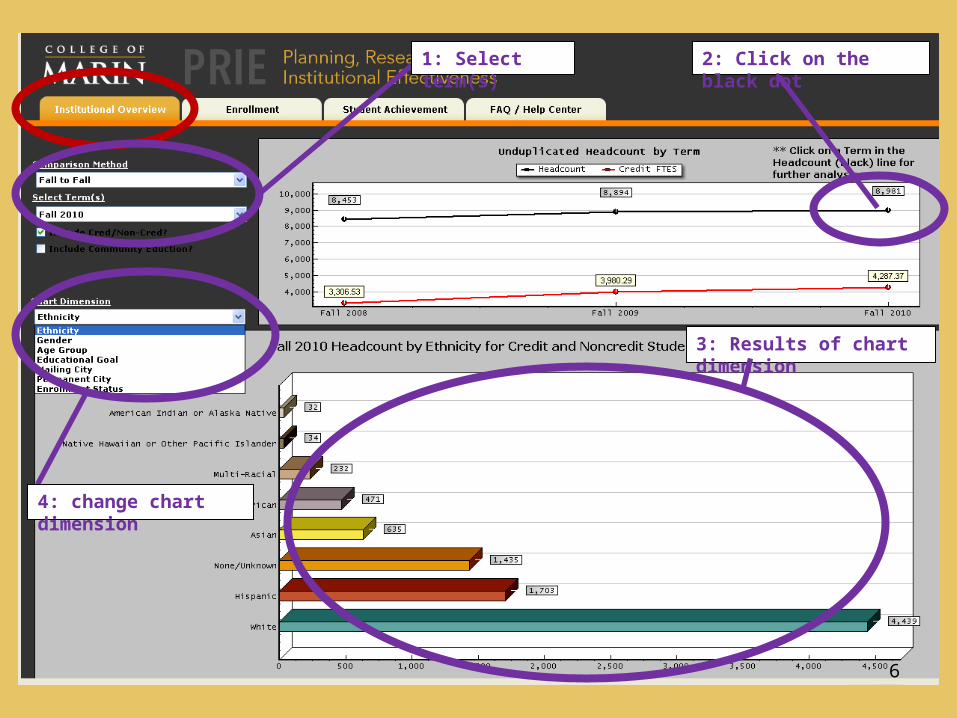
3: Results of chart dimension
1: Select term(s)
4: change chart dimension
2: Click on the black dot
7
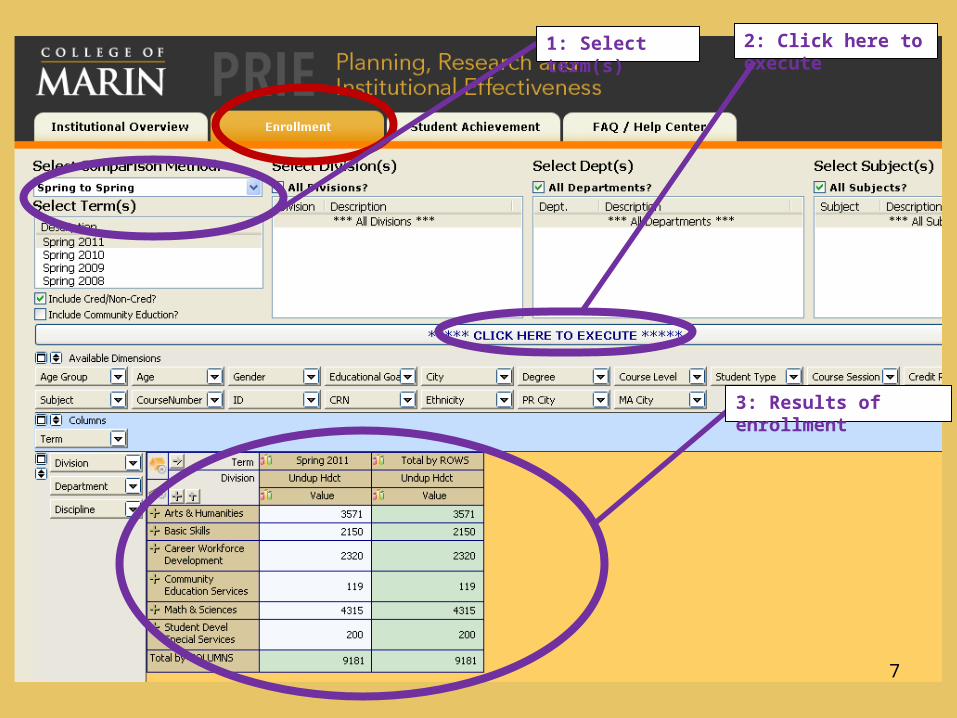
1: Select term(s) 2: Click here to execute
3: Results of enrollment

8
1: Select term(s) 2: Click here to execute
3: Results of course success
9
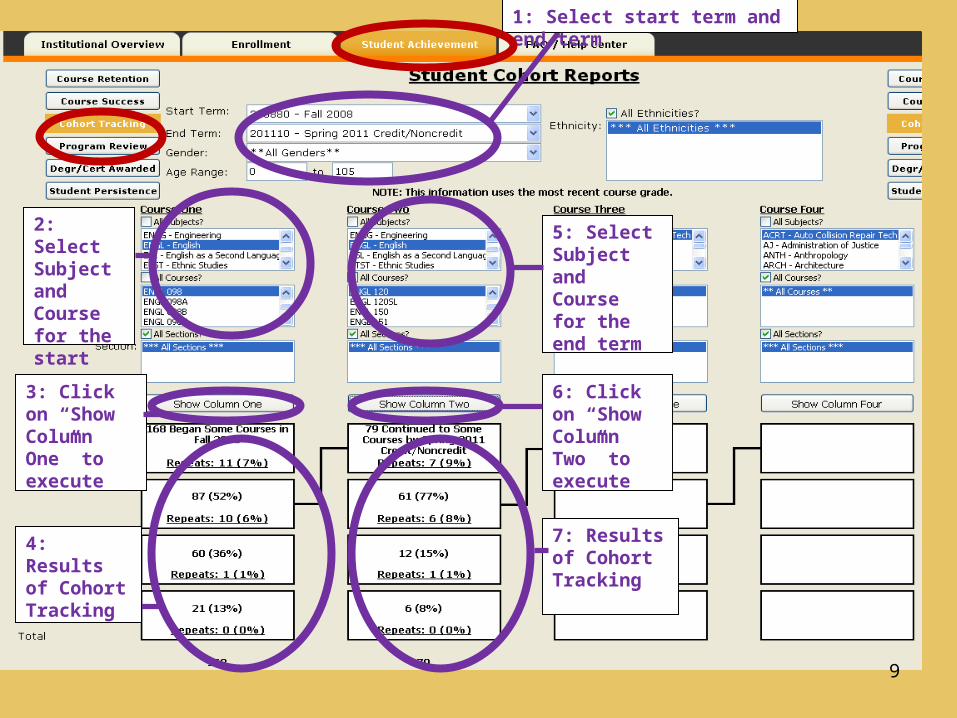
1: Select start term and end term
2: Select Subject and Course for the start term
4: Results of Cohort Tracking
3: Click on “Show Column One” to execute
5: Select Subject and Course for the end term
6: Click on “Show Column Two” to execute
7: Results of Cohort Tracking
10
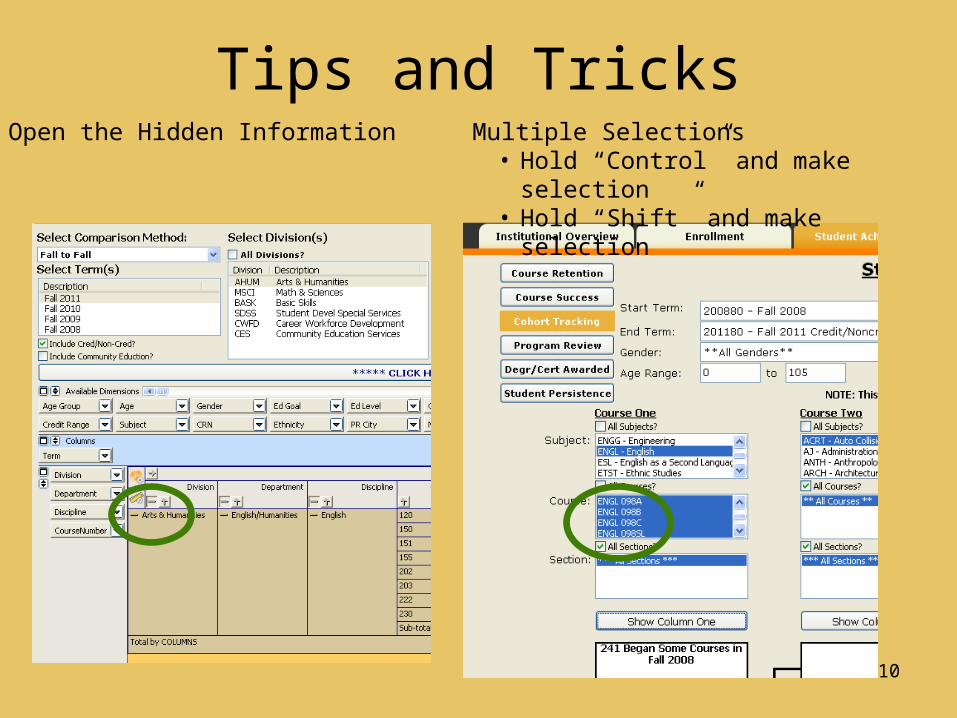
Tips and TricksOpen the Hidden Information Multiple Selections
• Hold “Control” and make selection
• Hold “Shift” and make selection
11
Practice
• Pick one page• Follow the direction: step 1, step 2,
…• Then click around and play

12
Feedback
• What works? • What changes are needed? What can
we improve? • Suggestions?
13
Agenda
1. What is COM Data Dashboard2. Access to ARGOS/Dashboard3. Demo 4. Practice 5. Feedback
14
COM Data Dashboard
Planning, Research and Institutional Effectiveness
December 15, 2011


