Chapter 12 Combined Higgs Results This chapter presents the combined ATLAS search for the Standard Model Higgs boson. The analysis has been performed using 4.7 fb −1 of √ s = 7 TeV data collected in 2011, and 5.8 fb −1 of √ s = 8 TeV data collected in the first half of 2012. The results of the H → WW (∗) → lνlν analyses presented in Chapter 11 are combined with searches in the H → ZZ (∗) → llll [1] and H → γγ [2] channels, using both the 7 TeV and 8 TeV data sets, and with several other Higgs searches using the 7 TeV data set [3]. Clear evidence for the production of a neutral boson with a mass of around 126 GeV is found [4]. This observation has a significance of 5.9 standard deviations and is compatible with the production and decay of the Standard Model Higgs boson. The remainder of the chapter is organized as follows: Section 12.1 provides a brief overview of the main Higgs searches used in the combination. Section 12.2 describes the procedure for combining the individual analyses. Section 12.3 presents the combined results. 12.1 Overview of other Higgs searches at ATLAS 12.1.1 H → ZZ (∗) → llll The search for the SM Higgs boson through the decay H → ZZ (∗) → llll, where l is an electron or muon, provides sensitivity over a wide mass range, from 110 to 600 GeV. The H → ZZ (∗) → llll analysis selects Higgs boson candidates by selecting two pairs of isolated high p T leptons. Each pair is required to be of same flavor and opposite charge. A visualization of an event selected by the H → ZZ (∗) → llll analysis is shown in Figure 12.1. An excess of observed events is searched for in the four lepton invariant mass distribution, m 4l , which would peak at the value of m h for resonant Higgs production. The largest background is from 291
Transcript
Chapter 12
Combined Higgs Results
This chapter presents the combined ATLAS search for the Standard Model Higgs boson. The analysis
has been performed using 4.7 fb−1 of√s = 7 TeV data collected in 2011, and 5.8 fb−1 of
√s = 8 TeV
data collected in the first half of 2012. The results of the H → WW(∗) → lνlν analyses presented
in Chapter 11 are combined with searches in the H → ZZ(∗) → llll [1] and H → γγ [2] channels,
using both the 7 TeV and 8 TeV data sets, and with several other Higgs searches using the 7 TeV
data set [3]. Clear evidence for the production of a neutral boson with a mass of around 126 GeV is
found [4]. This observation has a significance of 5.9 standard deviations and is compatible with the
production and decay of the Standard Model Higgs boson.
The remainder of the chapter is organized as follows: Section 12.1 provides a brief overview of the
main Higgs searches used in the combination. Section 12.2 describes the procedure for combining the
individual analyses. Section 12.3 presents the combined results.
12.1 Overview of other Higgs searches at ATLAS
12.1.1 H → ZZ(∗) → llll
The search for the SM Higgs boson through the decay H → ZZ(∗) → llll, where l is an electron or
muon, provides sensitivity over a wide mass range, from 110 to 600 GeV. The H → ZZ(∗) → llll
analysis selects Higgs boson candidates by selecting two pairs of isolated high pT leptons. Each pair
is required to be of same flavor and opposite charge. A visualization of an event selected by the
H → ZZ(∗) → llll analysis is shown in Figure 12.1.
An excess of observed events is searched for in the four lepton invariant mass distribution, m4l,
which would peak at the value of mh for resonant Higgs production. The largest background is from
291
12. Combined Higgs Results 292
Figure 12.1: Event display of a selected H → ZZ(∗) → llll event with four identified electrons.
The electrons are shown in red, and correspond to localized high energy deposits in the calorimetermatched to tracks in the inner detector, indicated by the red lines. The electrons have a combinedinvariant mass of 124.6 GeV. The upper-left panel shows the projection of the detector in the planeperpendicular to the beam line. The lower-left panel shows the projection of the detector along thebeam line, running left to right in the panel. The upper-right and lower-right panels are zoom-insof interesting regions. The middle-right panel depicts the energy deposited in the calorimeters as afunction of φ and η.
12. Combined Higgs Results 293
[GeV]4lm100 150 200 250
Eve
nts
/5 G
eV
0
5
10
15
20
25
-1Ldt = 4.8 fb! = 7 TeV: s
-1Ldt = 5.8 fb! = 8 TeV: s
4l"(*)
ZZ"H
Data(*)
Background ZZ
tBackground Z+jets, t
=125 GeV)H
Signal (m
Syst.Unc.
ATLAS
Figure 12.2: The four-lepton invariant mass distribution, m4l, for selected events in theH → ZZ(∗) →
llll analysis using the combined 7 TeV and 8 TeV data sets. The observed data is compared to thebackground expectation. The signal expectation for a SM Higgs with mH= 125 GeV is shown.
continuum Z(γ∗)Z(γ∗) production, referred to as SM ZZ. For low masses, there are also important
background contributions from Z/γ∗+ jets and tt̄ production, where two of the leptons arise from
misidentification.
Figure 12.2 shows the four-lepton invariant mass for selected events. The expected background and
observed data are shown along with the expected signal for mh= 125 GeV. The SM ZZ background is
predicted from MC simulation normalized to the theoretical cross section. The reducible Z/γ∗+jets
and tt̄ backgrounds are estimated using dedicated control regions in data. An observed excess of
events over the predicted background is seen in the m4l distribution in the region corresponding to
signal with mh = 125 GeV.
The results are interpreted statistically using a fit of signal and background models to the observed
m4l distribution. The fit accounts for the various sources of systematic uncertainty. The significance
of an excess is given by p0, the probability that the observed data is a result of a fluctuation of the
background in absence of signal. Figure 12.3 shows the observed p0, as a function of the tested Higgs
mass, using the combined 8 TeV and 7 TeV data sets. The results using the individual 7 TeV and 8
TeV data sets are also shown separately. In the combined analysis, the lowest observed p0 value is at
12. Combined Higgs Results 294
[GeV]Hm110 115 120 125 130 135 140 145 150
0Loca
l p
-710
-610
-510
-410
-310
-210
-110
1
2011 Exp.
2011 Obs.
2012 Exp.
2012 Obs.
2011-2012 Exp.
2011-2012 Obs.
ATLAS 2011 - 2012 4l! (*)
ZZ!H
"2
"3
"4
"5 -1Ldt = 4.8 fb# = 7 TeV: s -1Ldt = 5.8 fb# = 8 TeV: s
Figure 12.3: The observed p0 as a function of mh for the H → ZZ(∗) → llll channel. The dashed
line shows the corresponding expectation for the signal+background hypothesis at the given value ofmh. Results are shown separately for the
√s= 7 TeV data (dark, blue), the
√s= 8 TeV data (light,
red), and their combination (black).
mh = 125 GeV, with a value of 2.9× 10⁻⁴, corresponding to a statistical significance of 3.4 standard
deviations.
As a result of the observed excess of events over the expected background, and the consistency
of the excess with a potential Higgs signal, the observed data is used to perform a measurement of
mh and the production cross section. The cross section is reported in terms of the signal strength
parameter, µ. The signal strength parameter multiplies the expected signal yield, acting like a scale
factor on the total number of predicted signal events. It is defined such that µ = 0 corresponds to the
background-only hypothesis and a value of 1 corresponds to background plus Higgs signal produced
with the expected SM cross section. The measurements are made using the profile likelihood ratio,
see Section 11.6 for more details. Figure 12.4 shows the best fit values for µ and mH , with the
contours that correspond to the 68% and 95% confidence levels. The observed excess at 125 GeV has
an observed production cross section consistent with that of the SM Higgs boson, i.e. µ = 1.
The combined 7 TeV and 8 TeV H → ZZ(∗) → llll analyses shows a 3.4 standard deviation excess
at mh= 125 GeV with a production cross section that is consistent with the SM Higgs expectation.
Figure 12.4: Best fit values for µ and mh in the combined H → ZZ(∗) → llll analysis. The contours
that correspond to the 68% and 95% confidence levels are shown. The lighter lines indicate the effectof important systematic uncertainties effecting the measurements.
12.1.2 H → γγ
The search for the SM Higgs boson through the decay H → γγ is performed in the mass range between
110 GeV and 150 GeV. The H → γγ analysis selects Higgs boson candidates by selecting pairs of
isolated high pT photons. A visualization of an event selected by the H → γγ analysis is shown in
Figure 12.5.
An excess of observed events is searched for in the di-photon invariant mass distribution which
would peak at the value of mh for resonant Higgs production. The dominant background is from
continuum γγ production. Smaller contributions also arise from γ+jet and jet+jet production with
one or two jets mis-identified as photons. The level of background is constrained by a fit to the
observed data. To improve sensitivity, the selected events are divided into categories according to the
expected signal-to-background ratio and mass resolution.
Figure 12.6 shows the di-photon invariant mass for the selected events. The upper panel, marked a),
12. Combined Higgs Results 296
Figure 12.5: Event display of a selected H → γγ event. The photons are shown in yellow, andcorrespond to localized high energy deposits in the calorimeter not matched to tracks in the innerdetector. The photons have a combined invariant mass of 126.9 GeV. The upper-left panel shows theprojection of the detector in the plane perpendicular to the beam line. The lower-left panel shows theprojection of the detector along the beam line, running left to right in the panel. The lower-middleand lower-right panels are zoom-ins of interesting regions. The middle-right panel depicts the energydeposited in the calorimeters as a function of φ and η.
12. Combined Higgs Results 297
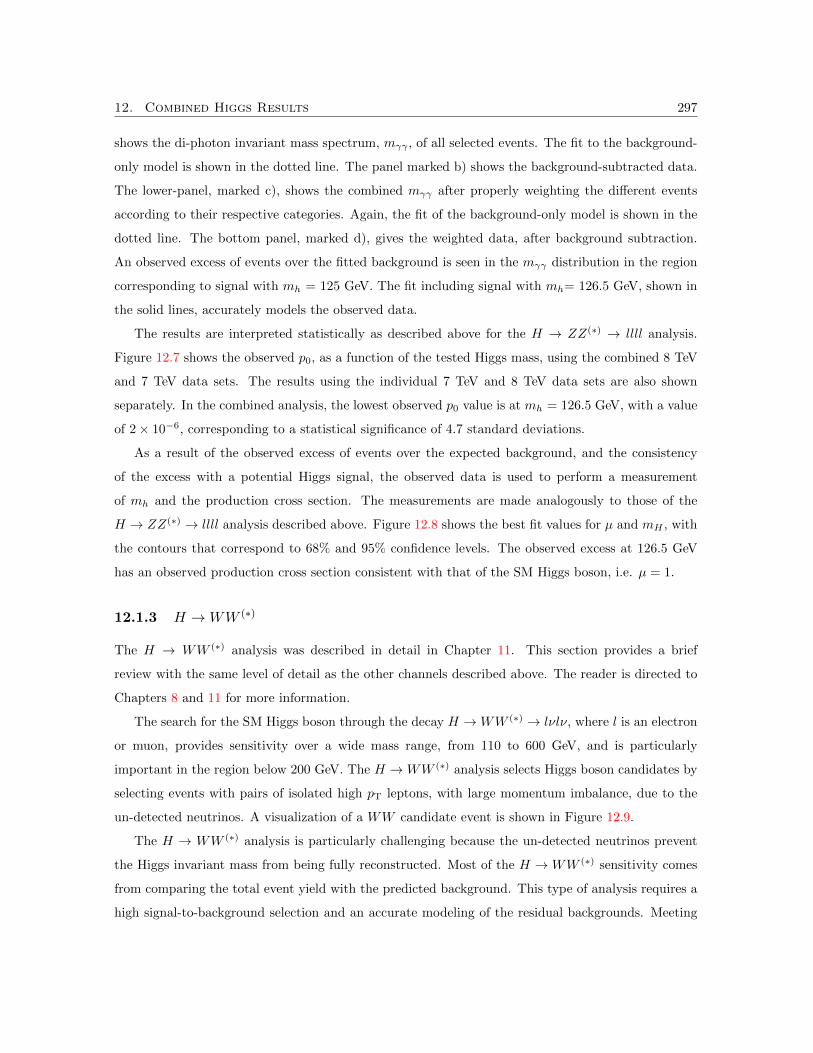
shows the di-photon invariant mass spectrum, mγγ , of all selected events. The fit to the background-
only model is shown in the dotted line. The panel marked b) shows the background-subtracted data.
The lower-panel, marked c), shows the combined mγγ after properly weighting the different events
according to their respective categories. Again, the fit of the background-only model is shown in the
dotted line. The bottom panel, marked d), gives the weighted data, after background subtraction.
An observed excess of events over the fitted background is seen in the mγγ distribution in the region
corresponding to signal with mh = 125 GeV. The fit including signal with mh= 126.5 GeV, shown in
the solid lines, accurately models the observed data.
The results are interpreted statistically as described above for the H → ZZ(∗) → llll analysis.
Figure 12.7 shows the observed p0, as a function of the tested Higgs mass, using the combined 8 TeV
and 7 TeV data sets. The results using the individual 7 TeV and 8 TeV data sets are also shown
separately. In the combined analysis, the lowest observed p0 value is at mh = 126.5 GeV, with a value
of 2× 10⁻⁶, corresponding to a statistical significance of 4.7 standard deviations.
As a result of the observed excess of events over the expected background, and the consistency
of the excess with a potential Higgs signal, the observed data is used to perform a measurement
of mh and the production cross section. The measurements are made analogously to those of the
H → ZZ(∗) → llll analysis described above. Figure 12.8 shows the best fit values for µ and mH , with
the contours that correspond to 68% and 95% confidence levels. The observed excess at 126.5 GeV
has an observed production cross section consistent with that of the SM Higgs boson, i.e. µ = 1.
12.1.3 H → WW(∗)
The H → WW(∗) analysis was described in detail in Chapter 11. This section provides a brief
review with the same level of detail as the other channels described above. The reader is directed to
Chapters 8 and 11 for more information.
The search for the SM Higgs boson through the decay H → WW(∗) → lνlν, where l is an electron
or muon, provides sensitivity over a wide mass range, from 110 to 600 GeV, and is particularly
important in the region below 200 GeV. The H → WW(∗) analysis selects Higgs boson candidates by
selecting events with pairs of isolated high pT leptons, with large momentum imbalance, due to the
un-detected neutrinos. A visualization of a WW candidate event is shown in Figure 12.9.
The H → WW(∗) analysis is particularly challenging because the un-detected neutrinos prevent
the Higgs invariant mass from being fully reconstructed. Most of the H → WW(∗) sensitivity comes
from comparing the total event yield with the predicted background. This type of analysis requires a
high signal-to-background selection and an accurate modeling of the residual backgrounds. Meeting
12. Combined Higgs Results 298
100 110 120 130 140 150 160
Eve
nts
/ 2
Ge
V
500
1000
1500
2000
2500
3000
3500 ATLAS
!!"H
Data
Sig+Bkg Fit
Bkg (4th order polynomial)
-1Ldt=4.8fb#=7 TeV, s
-1Ldt=5.9fb#=8 TeV, s
(a)
=126.5 GeV)H
(m
100 110 120 130 140 150 160
Eve
nts
- B
kg
-200
-100
0
100
200
(b)
100 110 120 130 140 150 160
we
igh
ts /
2 G
eV
$
20
40
60
80
100Data S/B Weighted
Sig+Bkg Fit
Bkg (4th order polynomial)
=126.5 GeV)H
(m
(c)
[GeV]!!m100 110 120 130 140 150 160
w
eig
hts
- B
kg$ -8
-4
0
4
8
(d)
Figure 12.6: The distributions of the invariant mass of di-photon candidates after all selections forthe combined 7 TeV and 8 TeV data sample. The inclusive sample is shown in upper figure, markeda). The distribution weighted according to the event categories is shown in the lower figure markedc). The result of a fit using a mh= 126.5 GeVsignal component and the background component issuperimposed. The excess of data with respect to the background fit are displayed in panels markedb) and d).
12. Combined Higgs Results 299
[GeV]Hm110 115 120 125 130 135 140 145 150
0Loca
l p
-710
-610
-510
-410
-310
-210
-110
1
!! "H
#2
#3
#4
#5
-1Ldt = 4.8 fb$ = 7 TeV: s
-1Ldt = 5.9 fb$ = 8 TeV: s
2011 Exp.
2011 Obs.
2012 Exp.
2012 Obs.
2011-2012 Exp.
2011-2012 Obs.
ATLAS 2011 - 2012
Figure 12.7: The observed p0 as a function of mh for the H → γγ channel. The dashed line shows thecorresponding expectation for the signal+background hypothesis at the given value of mh. Resultsare shown separately for the
Figure 12.8: Best fit values for µ and mh in the combined H → γγ analysis. The contours thatcorrespond to the 68% and 95% confidence levels are shown. The lighter lines indicate effect of theimportant systematic uncertainties effecting the measurements.
12. Combined Higgs Results 300
Figure 12.9: Event display of a WW event in the eνeν channel. The electrons are shown in yellow,and correspond to localized high energy deposits in the calorimeter matched to tracks in the innerdetector, indicated by the red and orange lines. The dashed line, label Emiss
T , indicates the direction ofthe measured momentum imbalance. The left panel shows the projection of the detector in the planeperpendicular to the beam line. The upper-right panel shows the projection of the detector along thebeam line, running left to right in the panel. The lower-right panel depicts the energy deposited inthe calorimeters, and the direction of the E
missT , as a function of φ and η.
this challenge has been the subject of this thesis.
The dominant backgrounds are continuum WW production and top-quark production, each of
which have real W pairs in the final state. Other important backgrounds include Z/γ∗ and W+jet
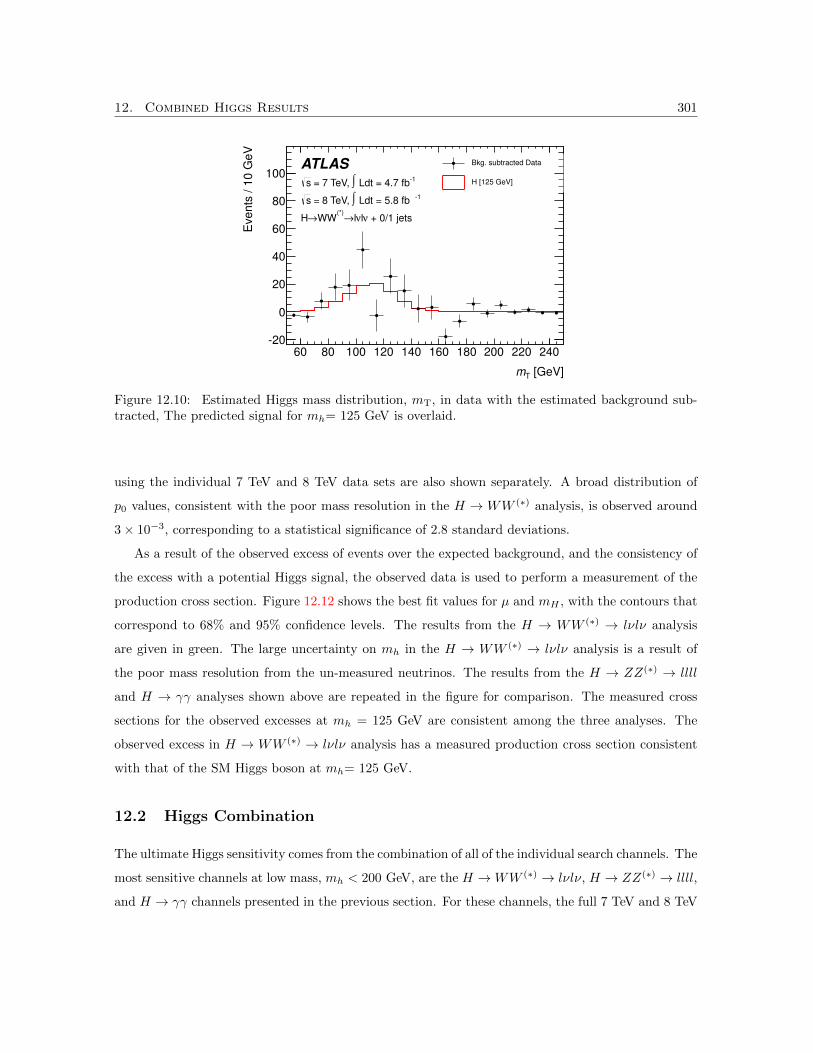
events. Figure 12.10 shows the best estimate of the Higgs mass for selected events using the observed
leptons and the measured momentum imbalance. The data is shown after subtracting the estimated
backgrounds, along with the corresponding signal distribution with mh = 125 GeV. An observed
excess of events over the predicted background is seen. The observed excess is consistent with the
expectation of a signal with mh = 125 GeV.
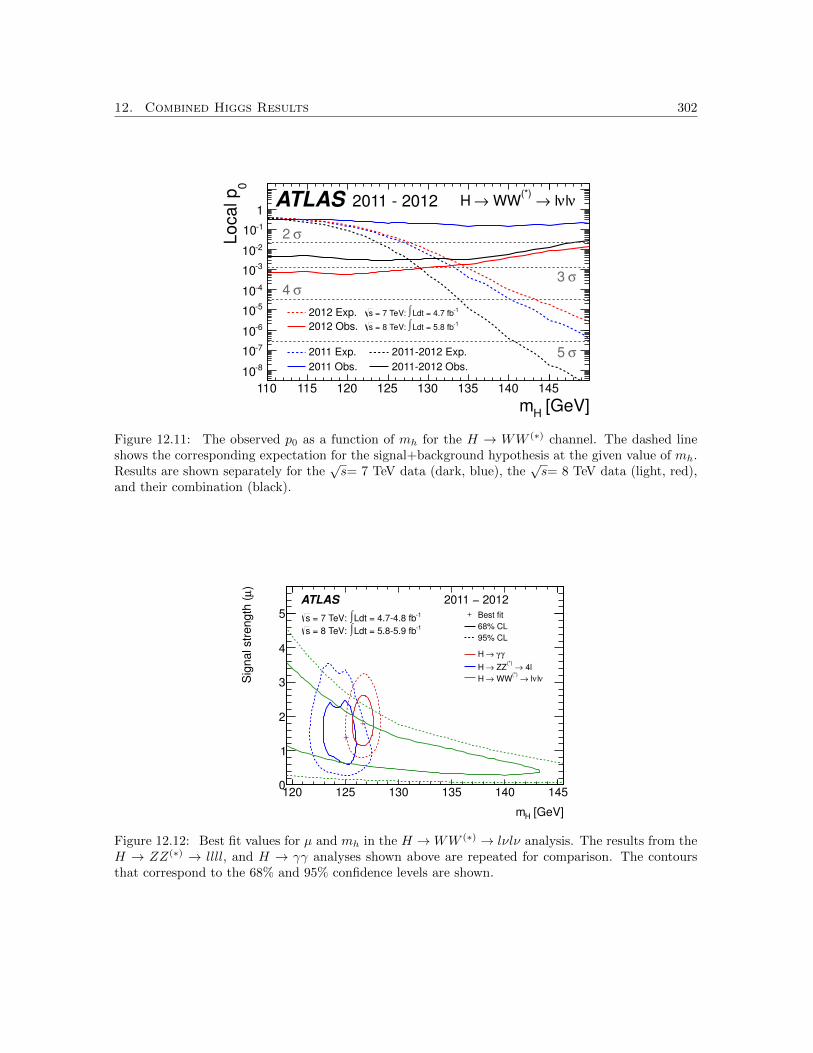
The results are interpreted statistically as described above. Figure 12.11 shows the observed p0,
as a function of the tested Higgs mass, using the combined 8 TeV and 7 TeV data sets. The results
12. Combined Higgs Results 301
[GeV]Tm
60 80 100 120 140 160 180 200 220 240
Eve
nts
/ 1
0 G
eV
-20
0
20
40
60
80
100 Bkg. subtracted Data
H [125 GeV]
ATLAS -1 Ldt = 4.7 fb! = 7 TeV, s
-1 Ldt = 5.8 fb! = 8 TeV, s
+ 0/1 jets"l"l#(*)
WW#H
Figure 12.10: Estimated Higgs mass distribution, mT, in data with the estimated background sub-tracted, The predicted signal for mh= 125 GeV is overlaid.
using the individual 7 TeV and 8 TeV data sets are also shown separately. A broad distribution of
p0 values, consistent with the poor mass resolution in the H → WW(∗) analysis, is observed around
3× 10⁻³, corresponding to a statistical significance of 2.8 standard deviations.
As a result of the observed excess of events over the expected background, and the consistency of
the excess with a potential Higgs signal, the observed data is used to perform a measurement of the
production cross section. Figure 12.12 shows the best fit values for µ and mH , with the contours that
correspond to 68% and 95% confidence levels. The results from the H → WW(∗) → lνlν analysis
are given in green. The large uncertainty on mh in the H → WW(∗) → lνlν analysis is a result of
the poor mass resolution from the un-measured neutrinos. The results from the H → ZZ(∗) → llll
and H → γγ analyses shown above are repeated in the figure for comparison. The measured cross
sections for the observed excesses at mh = 125 GeV are consistent among the three analyses. The
observed excess in H → WW(∗) → lνlν analysis has a measured production cross section consistent
with that of the SM Higgs boson at mh= 125 GeV.
12.2 Higgs Combination
The ultimate Higgs sensitivity comes from the combination of all of the individual search channels. The
most sensitive channels at low mass, mh < 200 GeV, are the H → WW(∗) → lνlν, H → ZZ
(∗) → llll,
and H → γγ channels presented in the previous section. For these channels, the full 7 TeV and 8 TeV
12. Combined Higgs Results 302
[GeV]Hm110 115 120 125 130 135 140 145
0Loca
l p
-810
-710
-610
-510
-410
-310
-210
-110
1
ATLAS 2011 - 2012 !l! l"
(*) WW"H
#2
#3 #4
#5 2011 Exp.
2011 Obs.
2012 Exp.
2012 Obs.
2011-2012 Exp.
2011-2012 Obs.
-1Ldt = 4.7 fb$ = 7 TeV: s -1Ldt = 5.8 fb$ = 8 TeV: s
Figure 12.11: The observed p0 as a function of mh for the H → WW(∗) channel. The dashed line
shows the corresponding expectation for the signal+background hypothesis at the given value of mh.Results are shown separately for the
Figure 12.12: Best fit values for µ and mh in the H → WW(∗) → lνlν analysis. The results from the
H → ZZ(∗) → llll, and H → γγ analyses shown above are repeated for comparison. The contours
that correspond to the 68% and 95% confidence levels are shown.
12. Combined Higgs Results 303
Channel mh range [GeV] Data SetH → WW
(∗) → lνlν 110 - 600 7 TeV and 8 TeVH → ZZ
(∗) → llll 110 - 600 7 TeV and 8 TeVH → γγ 110 - 150 7 TeV and 8 TeVH → ττ 110 - 150 7 TeV
V H → V bb̄ 110 - 130 7 TeVH → ZZ → llνν 200 - 600 7 TeVH → ZZ → llqq̄ 200 - 600 7 TeVH → WW → lνqq̄ 300 - 600 7 TeV
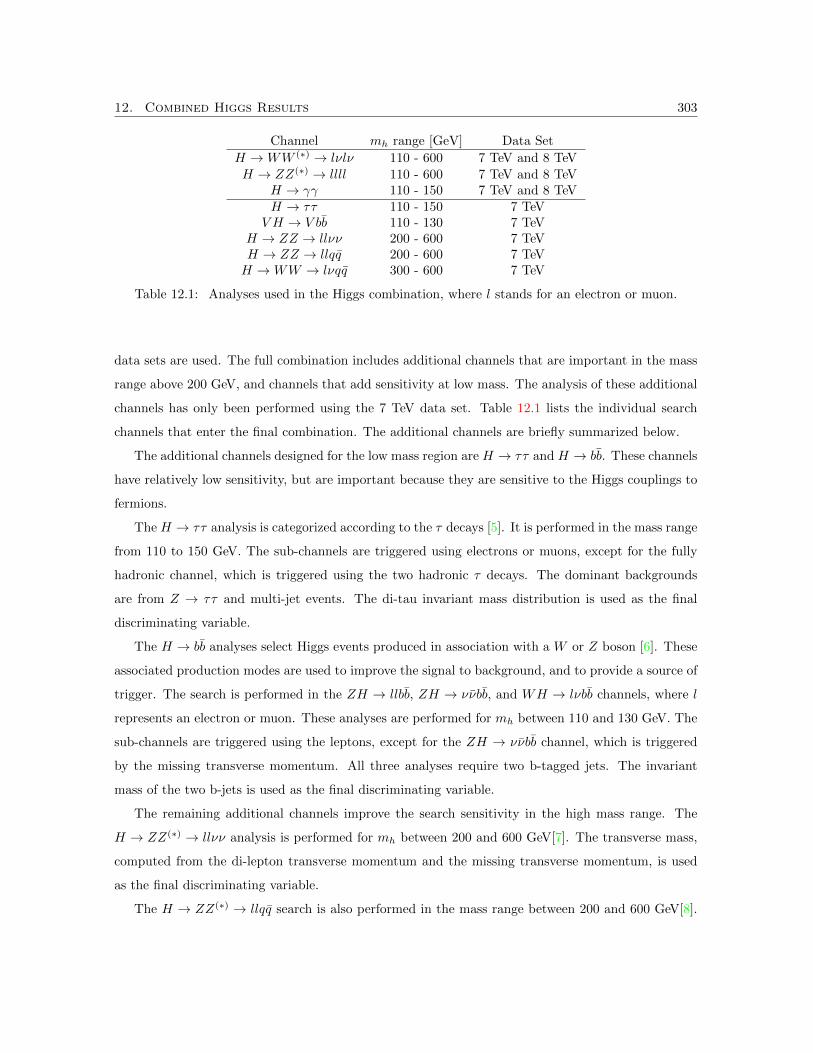
Table 12.1: Analyses used in the Higgs combination, where l stands for an electron or muon.
data sets are used. The full combination includes additional channels that are important in the mass
range above 200 GeV, and channels that add sensitivity at low mass. The analysis of these additional
channels has only been performed using the 7 TeV data set. Table 12.1 lists the individual search
channels that enter the final combination. The additional channels are briefly summarized below.
The additional channels designed for the low mass region are H → ττ and H → bb̄. These channels
have relatively low sensitivity, but are important because they are sensitive to the Higgs couplings to
fermions.
The H → ττ analysis is categorized according to the τ decays [5]. It is performed in the mass range
from 110 to 150 GeV. The sub-channels are triggered using electrons or muons, except for the fully
hadronic channel, which is triggered using the two hadronic τ decays. The dominant backgrounds
are from Z → ττ and multi-jet events. The di-tau invariant mass distribution is used as the final
discriminating variable.
The H → bb̄ analyses select Higgs events produced in association with a W or Z boson [6]. These
associated production modes are used to improve the signal to background, and to provide a source of
trigger. The search is performed in the ZH → llbb̄, ZH → νν̄bb̄, and WH → lνbb̄ channels, where l
represents an electron or muon. These analyses are performed for mh between 110 and 130 GeV. The
sub-channels are triggered using the leptons, except for the ZH → νν̄bb̄ channel, which is triggered
by the missing transverse momentum. All three analyses require two b-tagged jets. The invariant
mass of the two b-jets is used as the final discriminating variable.
The remaining additional channels improve the search sensitivity in the high mass range. The
H → ZZ(∗) → llνν analysis is performed for mh between 200 and 600 GeV[7]. The transverse mass,
computed from the di-lepton transverse momentum and the missing transverse momentum, is used
as the final discriminating variable.
The H → ZZ(∗) → llqq̄ search is also performed in the mass range between 200 and 600 GeV[8].
12. Combined Higgs Results 304
[GeV]Hm
100 200 300 400 500 600
SM
!/!95%
CL
Lim
it on
1
10
210 Expected Combined
"" #Expected H
bb#Expected H
llll# ZZ* #Expected H
$$ ll# ZZ* #Expected H
llqq# ZZ* #Expected H
$l$ l# WW* #Expected H
qq$ l# WW* #Expected H
%% #Expected H
ATLAS 2011 + 2012 Data = 7 TeVs, -1 L dt ~ 4.6-4.8 fb& = 8 TeVs, -1 L dt ~ 5.8-5.9 fb&
Figure 12.13: The expected 95% CL cross section upper limits as a function of mh for the individ-ual search channels and their combination. The expected limits are those for the background-onlyhypothesis, in the absence of a Higgs boson signal.
The dominant background arises from Z+jet production. The sensitivity is improved by adding a
dedicated llbb̄ sub-channel. The invariant mass of the llqq̄ system is used as the final discriminating
variable.
The final analysis included in the combined Higgs result is H → WW(∗) → lνqq̄. This analysis is
performed for mh from 300 to 600 GeV[9]. The mass of the two selected jets are required be consistent
with a W boson. This mass constraint allows for an event-by-event estimate of the Higgs mass. The
reconstructed Higgs mass is then used as the final discriminating variable.
To provide a feeling for the relative sensitivity of the various Higgs searches, in the different
mass ranges, Figure 12.13 shows the expected limits of the individual channels as a function of
mh. At the lowest masses the sensitivity is driven by the H → γγ analysis; the H → ττ and
H → bb̄ analyses provide additional sensitivity. From 125 to 200 GeV, the sensitivity is driven by the
H → WW(∗) → lνlν and H → ZZ
(∗) → llνν analyses. Above 200 GeV, H → ZZ(∗) → llll is the
strongest channel. The H → ZZ(∗) → llνν, H → ZZ
(∗) → llqq̄, and H → WW(∗) → lνqq̄ analyses
provide additional sensitivity at high mass.
The analyses introduced above are combined using a statistical procedure similar to that described
in previous section. Different values of µ are tested with a statistic described in Chapter 11, based
on the profile likelihood ratio. The likelihood function includes all the parameters that describe the
12. Combined Higgs Results 305
systematic uncertainties and their correlations. Uncertainties on background normalizations or back-
ground model parameters from control regions or sidebands are uncorrelated among channels. The
uncertainties due to: luminosity, lepton efficiency and energy scale, jet energy scale, and theoreti-
cal uncertainties on the Higgs production mechanisms are properly correlated among the different
analyses.
The CLs prescription is used to extract 95% exclusion limits. A SM Higgs boson with mass mh
is considered excluded at the 95% confidence level (CL) when µ = 1 is excluded at that mass. The
combined significance of an excess in the data is quantified using p0, which represents the probability
that the background can produce a fluctuation greater than or equal to the excess observed in data.
12.3 Results
An excess of events is observed around 125 GeV in both the H → ZZ(∗) → llll and H → γγ analyses.
The H → WW(∗) → lνlν channel saw an consistent excess in this region. The combined p0 is shown
in Figure 12.14. The largest significance for the combination of channels is found at mh = 126.5 GeV,
with a p0 value corresponding to a significance of 6.0σ. The expected significance is 4.9σ, with an
uncertainty band indicated in the figure. The global significance for an excess of this size to occur
anywhere in the mass range 110-600 GeV is estimated to be 5.1 σ. This corresponds to the observation
of new particle.
The mass of the newly observed particle as measured using H → ZZ(∗) → llll and H → γγ
channels is 126.0 ± 0.4(stat.) ± 0.4(sys.) GeV. The leading sources of systematic uncertainty come
from the electron and photon energy scales and resolutions.
A summary of the measured signal strengths in the combined and individual channels is shown in
Figure 12.15. The combined signal strength of the observed excess is µ = 1.4± 0.3 at mh = 126 GeV.
The measured cross section is consistent with the SM Higgs boson prediction of µ = 1.
The observed decays to pairs of vector bosons, with zero net charge, indicates that the new particle
is a neutral boson. The observation in the di-photon channel disfavors the spin-1 hypothesis [10, 11].
Figure 12.16 shows the observed p0 in full search range. The only significant excess is observed at
126 GeV. The data is consistent with the background only hypothesis throughout the rest of the mass
range. The observed data is used to set limits on the Higgs production cross section. Figure 12.17
shows the combined 95% CL exclusion limits, in terms of the signal strength parameter, as a function
of mh. The expected exclusion region is from 110 GeV to 582 GeV. Apart from the region between 122
and 131 GeV, corresponding to the observed excess, the mass range from 110 to 560 GeV is excluded
at the 95% CL level. Figure 12.18 shows the break down of the observed limits according to channel.
12. Combined Higgs Results 306
[GeV]Hm110 115 120 125 130 135 140 145 150
0Loca
l p
-1110
-1010
-910
-810
-710
-610
-510
-410
-310
-210
-110
1
Obs. Exp.
!1 ±-1Ldt = 5.8-5.9 fb" = 8 TeV: s
-1Ldt = 4.6-4.8 fb" = 7 TeV: s
ATLAS 2011 - 2012
!0!1!2
!3
!4
!5
!6
Figure 12.14: The observed and expected p0 as a function of mh in the low mass range for thecombined Higgs search. The dashed curve shows the corresponding expectation for p0 for the sig-nal+background hypothesis at the given values of mh; the blue band gives the ±1 one sigma region.The horizontal dashed lines indicate the p-values corresponding to significances of 1 to 6 sigma.
Figure 12.15: Measurements of the signal strength parameter µ for mh = 126 GeV for the individualchannels and their combination.
12. Combined Higgs Results 307
[GeV]Hm200 300 400 500
0L
oca
l p
-1010
-910
-810
-710
-610
-510
-410
-310
-210
-110
1
ATLAS 2011 - 2012
Sig. Expected
Observed
!2
!3
!4
!5
!6
110 150
-1Ldt = 4.6-4.8 fb" = 7 TeV: s
-1Ldt = 5.8-5.9 fb" = 8 TeV: s
Figure 12.16: The observed and expected p0 as a function of mh for the entire search range forthe combined analysis. The dashed curve shows the corresponding expectation for p0 for the sig-nal+background hypothesis at the given values of mh. The horizontal dashed lines indicate thep-values corresponding to significances of 2 to 6 sigma.
[GeV]Hm200 300 400 500
µ9
5%
CL L
imit
on
-110
1
10! 1±
! 2±
Observed
Bkg. Expected
ATLAS 2011 - 2012-1Ldt = 4.6-4.8 fb" = 7 TeV: s -1Ldt = 5.8-5.9 fb" = 8 TeV: s
LimitssCL110 150
Figure 12.17: The observed (solid) 95% CL upper limit on the signal strength as a function of mh.The dashed line gives the expected exclusion under the background-only hypothesis. The green andyellow shaded bands give the one and two sigma uncertainties on the expected exclusion.
12. Combined Higgs Results 308
[GeV]Hm
100 200 300 400 500 600
SM
!/!95%
CL
Lim
it on
1
10
210Expected Combined
Observed Combined"" #Expected H "" #Observed H
bb#Expected H
bb#Observed H
llll# ZZ* #Expected H
llll# ZZ* #Observed H
$$ ll# ZZ* #Expected H
$$ ll# ZZ* #Observed H
llqq# ZZ* #Expected H
llqq# ZZ* #Observed H
$l$ l# WW* #Expected H
$l$ l# WW* #Observed H
qq$ l# WW* #Expected H
qq$ l# WW* #Observed H
%% #Expected H
%% #Observed H
ATLAS 2011 + 2012 Data = 7 TeVs, -1 L dt ~ 4.6-4.8 fb& = 8 TeVs, -1 L dt ~ 5.8-5.9 fb&
Figure 12.18: The observed (solid) and expected (dashed) 95% CL cross section upper limits for theindividual search channels and the combination as a function of mh.
12.4 Conclusions
Excesses consistent with the production of the Standard Model Higgs boson have been observed in the
H → WW(∗) → lνlν, H → ZZ
(∗) → llll, H → γγ decay channels. The combined excess corresponds
to a significance of 5.9 standard deviations. These results provide conclusive evidence for the discovery
of a new neutral boson with mass of 126.0± 0.4(stat)± 0.4(sys) GeV. The measured signal strength
is consistent with the SM Higgs prediction. While all of the current observations are consistent with
new particle being the Standard Model Higgs boson, the relatively large uncertainties of the current
data set cannot exclude significant deviations from the Standard Model hypothesis. More precise
tests the compatibility of the new particle with the Standard Model Higgs boson will be the subject
of future work.
12.5 Bibliography
[1] ATLAS Collaboration, Observation of an excess of events in the search for the Standard Model
Higgs boson in the H → ZZ(∗) → 4� channel with the ATLAS detector ,
[2] ATLAS Collaboration, Observation of an excess of events in the search for the Standard Model
Higgs boson in the gamma-gamma channel with the ATLAS detector , ATLAS-CONF-2012-091
(2012) . http://cdsweb.cern.ch/record/1460410.
12. Combined Higgs Results 309
[3] ATLAS Collaboration, Combined search for the Standard Model Higgs boson in pp collisions at√s = 7 TeV with the ATLAS detector , Phys.Rev. D86 (2012) 032003, arXiv:1207.0319 [hep-ex].
[4] ATLAS Collaboration, Observation of a new particle in the search for the Standard Model Higgs
boson with the ATLAS detector at the LHC , Phys.Lett. B716 (2012) 1–29, arXiv:1207.7214
[hep-ex].
[5] ATLAS Collaboration, Search for the Standard Model Higgs boson in the H → τ+τ− decay
mode in√s = 7 TeV pp collisions with ATLAS , submitted to JHEP (2012) , arXiv:1206.5971
[hep-ex].
[6] ATLAS Collaboration, Search for the Standard Model Higgs boson produced in association with
a vector boson and decaying to a b-quark pair with the ATLAS detector , submitted to
Phys. Lett. B (2012) , arXiv:1207.0210 [hep-ex].
[7] ATLAS Collaboration, Search for a Standard Model Higgs boson in the H → ZZ → llνν decay
channel using 4.7 fb−1 of√s = 7 TeV data with the ATLAS detector , submitted to
Phys. Lett. B (2012) , arXiv:1205.6744 [hep-ex].
[8] ATLAS Collaboration, Search for a Standard Model Higgs boson in the mass range 200-600
GeV in the H → ZZ → llqq decay channel , submitted to Phys. Lett. B (2012) ,
arXiv:1206.2443 [hep-ex].
[9] ATLAS Collaboration, Search for the Higgs boson in the H → WW → lνjj decay channel at√s = 7 TeV with the ATLAS detector , submitted to Phys. Lett. B (2012) , arXiv:1206.6074
[hep-ex].
[10] L. D. Landau, The moment of a 2-photon system, Dokl. Akad. Nawk. USSR 60 (1948) 207.
[11] C. N. Yang, Selection Rules for the Dematerialization of a Particle Into Two Photons, Phys.