19
INVESTMENT MANAGEMENT Not FDIC Insured | May Lose Value | No Bank Guarantee Commercial Mortgage Loans Market Overview and Analysis

INVESTMENT MANAGEMENT
For financial professional use only. Not for inspection by, distribution or quotation to, the general public.Not FDIC Insured | May Lose Value | No Bank Guarantee
INVESTMENT MANAGEMENT
Not FDIC Insured | May Lose Value | No Bank Guarantee
Commercial Mortgage Loans Market Overview and Analysis

Commercial Mortgage Loans2
Executive SummaryThis paper explores the features, advantages and benefits of investing in commercial mortgage “whole” loans — debt instruments secured by income-producing commercial buildings such as offices, apartments, industrial properties and shopping centers. A pillar of insurance company portfolios for many years, the asset class is less well understood outside the insurance industry. Among other compelling characteristics, we find:
■ Commercial mortgage loans have historically offered attractive and stable income, efficient diversification, favorable risk-based capital treatment, yield protection and tax efficiency.
■ Commercial mortgage loans have had a strong return-to-risk ratio, historically producing returns similar to commercial mortgage-backed securities (CMBS) — with less than half the risk.
■ The U.S. commercial real estate and mortgage loan markets remain healthy.
■ Life insurers are the leaders in commercial mortgage loan resources, with many years of experience, extensive loan origination networks and sophisticated servicing systems.
■ Commercial mortgage loan portfolios managed by insurance companies have tended to perform better than the overall market, due in part to conservative underwriting standards.
■ Historical simulations show the potential of commercial mortgage loans to expand the attainable efficient frontier for institutional investors.
Table of Contents
Commercial Mortgage Loans in Perspective 3
U.S. Commercial Real Estate and Mortgage Market Overview 4
U.S. Commercial Real Estate and Mortgage Market Outlook 5
Characteristics of Commercial Mortgages in the Insurance Industry 5
Commercial Mortgage Loans in Insurance Portfolios 9
Potential Benefits of Commercial Mortgage Loans in Diversified Portfolios 12
Conclusion 15
Appendix: Historical Simulation Portfolio Data— Life Insurance Portfolio 16
Appendix: Historical Simulation Portfolio Data—Property & Casualty Portfolio 17
Appendix: Historical Simulation Portfolio Data— Health Insurance Portfolio 18
3
Commercial Mortgage Loans in PerspectiveA commercial mortgage loan (in contrast with a residential mortgage loan) is secured by a mortgage on a commercial property such as an office building, multifamily apartment complex, industrial warehouse or shopping center. Directly negotiated commercial mortgages (“whole loans”, as distinct from securitized CMBS pools) may be tailored to suit the needs of both the borrower and underwriting criteria of the lender; to this end, an extensive underwriting and due diligence process will precede the actual funding.
The mortgage underwriting process will typically include, among other things, a financial analysis of the prospects for the property and the property owner, as well as various third-party reports, such as appraisals, environmental reports and engineering reports. In terms of the underwriting criteria, loan-to-value (LTV) ratios, debt-service coverage and net operating income are paramount, but numerous metrics are employed, depending on the location, property type and economic environment. According to the National Association of Insurance Commissioners (NAIC) website, commercial mortgage underwriting tends to be more conservative than for residential properties; for example, (LTV) ratios will typically fall between 55% and 70%, while residential LTVs may be 80–90% or more.
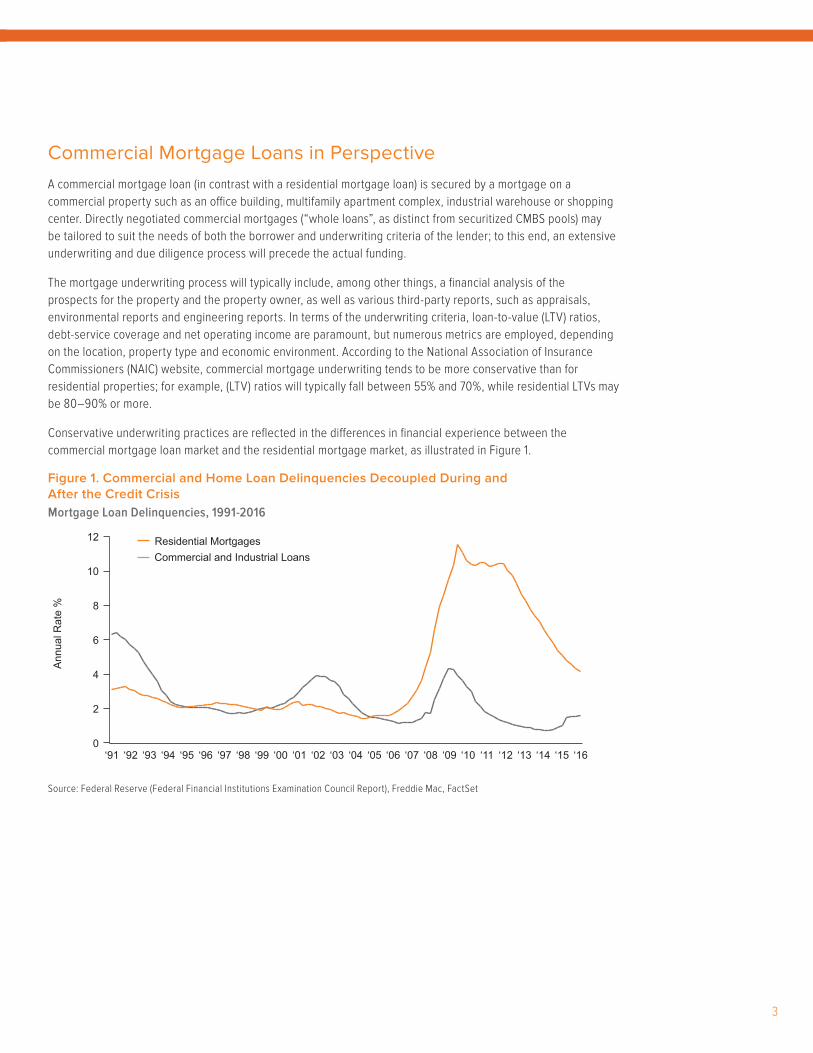
Conservative underwriting practices are reflected in the differences in financial experience between the commercial mortgage loan market and the residential mortgage market, as illustrated in Figure 1.
Figure 1. Commercial and Home Loan Delinquencies Decoupled During and After the Credit CrisisMortgage Loan Delinquencies, 1991-2016
Source: Federal Reserve (Federal Financial Institutions Examination Council Report), Freddie Mac, FactSet
‘14 ‘16‘95 ‘99 ‘01 ‘03 ‘04 ‘05 ‘06 ‘07 ‘08 ‘10 ‘12‘09 ‘11 ‘13‘93 ‘94 ‘96 ‘97 ‘98 ‘00 ‘02‘92‘91
Annu
al R
ate
%
Residential Mortgages
‘15
Commercial and Industrial Loans
0
2
4
6
8
10
12

Commercial Mortgage Loans4
U.S. Commercial Real Estate and Mortgage Market Overview The health and prospects for the commercial mortgage loan market depend on the condition of the U.S. economy and the real estate market in general. As measured by gross domestic product, the U.S. economy continues to show signs of moderate but steady growth. Meanwhile, the U.S. Department of Labor (DOL) reported growth in nonfarm payrolls over the past few years has brought the unemployment rate to 4.5% in March 2017. Consumer spending remained on an upward trajectory.
According to a report from Real Capital Analytics, U.S. commercial real estate transaction volume decreased about 11% in 2016 versus 2015. On the other hand, multifamily construction was up about 3% from the previous year, making apartments the winner among property types for 2016.
The National Association of Realtors (NAR) reported lower average prices of commercial real estate by about 5.5%. Notwithstanding lower prices, the NAR saw vacancy rates declining, from a low of 7.2% for apartments to 10.6% for industrial buildings and 14.6% for office properties. Lease terms were described as steady.
In 2016, $502 billion in commercial mortgages was originated — down slightly from the $504 billion originated the previous year and well short of the Mortgage Bankers Association (MBA) prediction of $537 billion. The earlier prediction assumed a strong rebound in issuance of commercial mortgage-backed securities (CMBS) for the second half of the year, but the CMBS market did not realize the expected growth.
The TREPP-i Survey of Loan Spread levels— based on a survey of balance sheet lenders — recently indicated that average loan spreads in 2016 were down to 156 basis points from 167 basis points at year-end 2015. Overall average lending rates, however, climbed slightly from 3.94% to 4.00% because the benchmark 10-year U.S. Treasury yield rose slightly year-over-year.
Figure 2. Banks and Insurance Companies Dominate the Commercial Mortgage Loan MarketCommercial and Multifamily Mortgage Loans
2012 2013 2014 2015 2016
Banks, Savings and Loans, Trust Companies1 1,504,637 1,571,315 1,674,491 1,843,581 2,019,801
Life insurance companies 321,964 339,870 357,588 393,253 420,039
Federal and related agencies2 347,176 329,120 325,997 331,336 358,663
Mortgage pools or trusts3 681,451 555,773 566,602 617,835 626,728
Individuals and others4 249,847 391,866 419,852 382,172 376,234
Total Outstanding 3,105,075 3,187,944 3,344,530 3,568,177 3,801,4651 Includes loans held by nondeposit trust companies but not loans held by bank trust departments. Includes savings banks and savings and
loan associations.2 Outstanding principal balances of mortgage-backed securities insured or guaranteed by the agency indicated. 3 Includes securitized home equity loans.4 Others include mortgage companies, real estate investment trusts, state and local credit agencies, state and local retirement funds,
noninsured pension funds, credit unions, and finance companies.Source: Federal Reserve Board Data from various institutional and government sources. Interpolations and extrapolations, as necessary, are estimated in part by the Federal Reserve.

5
U.S. Commercial Real Estate and Mortgage Market Outlook Returns on U.S. real estate remain attractive relative to other asset classes, the cost of leverage is still relatively low, and owners appear to be optimistic about economic conditions. Commercial real estate total returns as measured by the NCREIF Property Index were 13% in 2015 and 8% in 2016. Strong market fundamentals, an abundance of equity capital flowing into the sector, historically low cap rates and low-rate debt financing continue to support solid returns.
When looking ahead, the MBA looks at general economic conditions, interest rates, and the attractiveness of commercial real estate versus other alternatives. Their analysts expect gross domestic product to grow by at least 2 percent this year — without regard for any potential benefits from pro-growth federal tax or regulatory policies. Meanwhile, interest rates will likely increase, with the yield on the 10-year Treasury expected to climb from its current level of roughly 2.4% to 2.8% by year-end.
That outlook would potentially benefit commercial real estate, often regarded as a hedge against inflation since leases typically include escalation clauses that rise along with the Consumer Price Index. By all accounts both domestic and foreign investors continue to view U.S. commercial real estate as a safe haven in a sea of uncertainty.
Growth prospects for the commercial mortgage market remain healthy. The MBA is forecasting $515 billion of lending activity for 2017, which, if realized, would top the origination record of $508 billion set in 2007. A total of $267 billion of this year’s expected volume would be comprised of multifamily loans. The housing finance agencies — Fannie Mae and Freddie Mac — have been on a win streak, between them writing in excess of $110 billion last year.
Characteristics of Commercial Mortgages in the Insurance IndustryGiven its appealing characteristics, commercial real estate has always represented a significant component in the portfolios of U.S. insurance companies; as a result, insurers are among the leaders in commercial mortgage loan management. As of December 31, 2013 — the latest data available — insurers reported book value of $342 billion, which represented more than 50% (see Figure 3) of investments in commercial real estate in the insurance industry. Life insurers — as distinct from property and casualty, health, fraternal and other companies — held about 85% of the insurance industry’s total.
Figure 3: Life Insurers Dominate Insurance Industry’s Exposure to Commerce Real Estate Insurance Industry Year-End 2013 Commercial Real Estate Exposure
Source: National Association of Insurance Commissioners Note: December 31, 2013, reflects the latest data available.
0102030405060708090
100%
Life Property/Casualty
Fraternal Title Health Total
Perc
enta
ge o
f Por
tfolio
Insurance Company
% of Total
Commercial Real Estate-JV6.4% Property Owned5.8% REITs7.6% CMBS28.8% Commercial Mortgage Loans51.4%
85% 11% 3% 1%0.1% 100%

Commercial Mortgage Loans6
Indicative of the concentration among the largest life companies, the top 10 life insurers accounted for 45%, according to the NAIC, while the top 25 accounted for 69%.
Figure 4. U.S. Insurers Dramatically Increased Commercial Mortgage Investments Since 2009Total Outstanding Loan Balances–USD Billions
Source: National Association of Insurance Commissioners
Loan Origination Large life insurance companies have been among the leading commercial mortgage lenders for a number of reasons. On average, major insurance company participants have the resources to place several billion dollars of business annually through direct relationships with property owners, including pension plans, insurance companies, public and private REITs, and high net worth individuals, as well as through their extensive networks of U.S. mortgage banking firms.
Insurance company loan originators are geographically focused within their respective markets and have long-term relationships with mortgage bankers, brokers and borrowers active in their local areas, placing their representatives on the ground in almost every state and every primary and secondary property market in the U.S.
Property DiversificationThe commercial mortgage loan market is commonly classified into the following primary property types: office buildings, retail, industrial, apartments, hotel/motel, mixed use, and others. The vast majority of the average life insurer’s mortgage holdings are comprised of office, retail, industrial and apartments, as shown in Figure 5 below. Like any prudent investor, insurance companies favor mortgage loan portfolios that are diversified by property type and geography and are in accordance with credit risk assessments that vary across property types and locations.
Specific credit quality and underwriting criteria can vary significantly by property type, reflecting risk disparities and the objective of adequate portfolio diversification. For instance, a property with longer-term leases and a diverse mix of tenants will tend to be less exposed to cyclical fluctuations and, accordingly, may bear less credit risk. Using the lease term as one example, the effective lease period may range from one night (a hotel) to many years (offices and retail properties). Hotels’ cash flow volatility, capital intensity and high fixed operating costs make them an inherently higher risk.
Billio
ns
$186$201 $215 $219 $230
$245 $253 $243 $236$250 $262
$285 $278
$317$342
100
150
200
250
300
350
$400
2003 20042002 2005 2006 2007 2008 2009 2010 2011 2012 2013 2014 2015 2016

7
Figure 5. Life Companies Focus on Office, Retail, Industrial and ApartmentsLife Insurer Commercial Mortgage Holdings by Property Type as of December 31, 2016
Principal Average Loan
Property Type Outstanding ($) # of Loans Outstanding ($) Allocation (%)Office Building 99,024,627 6,298 15,723 28.92
Retail 81,541,193 11,068 7,367 23.82
Apartment 80,144,263 5,113 15,675 23.41
Industrial 48,372,441 7,616 6,351 14.13
Hotel/Motel 14,514,179 569 25,508 4.24
Other 13,890,108 1,962 7,080 4.06
Mixed Use 4,881,130 357 13,673 1.43
Total 342,367,941 32,983 91,377 100.00
Source: American Council of Life Insurance. Data as of December 31, 2016.
Office buildings were life insurers’ largest property type, comprising 29% of their commercial mortgage loan holdings as of December 31, 2016. Retail real estate, such as regional malls and neighborhood centers, was the second-largest exposure, at 24%. Apartments consist of multifamily buildings offering primary residencies to tenants. Industrial properties — typically warehouses and distribution centers, not factories — are often subject to lower ongoing capital needs compared to other asset types.
According to the NAIC, lenders are particularly active in gateway markets such as New York City, Washington DC and San Francisco, among other leading cities with large, liquid, diversified economies and commercial and residential real estate markets. Insurer lending tends to be concentrated in major metropolitan areas, mainly on the U.S. East and West Coasts.
Mortgage Servicing and Portfolio Management Unlike portfolios of securities, commercial mortgage loans require hands-on management after closing. Standard servicing includes collection of updated rent rolls and operating statements, property inspections, and confirmation of paid taxes and insurance premiums as well as other items. Properties also encounter non-standard issues requiring lender review and analysis, such as loan assumptions, eminent domain issues, lease approvals and tenant agreements, management of escrows and transfer of ownership interests. Asset managers must develop and maintain extensive systems, technology platforms, policies and procedures to meet industry standards and effectively manage the risks and the assets in the portfolio. It has become increasingly cost prohibitive for smaller investors to invest in the technology and human capital required.
Commercial Mortgage Loan Delinquency and Foreclosure Data and reports published by the NAIC indicate that insurer commercial loan portfolios have tended to perform better than the overall commercial mortgage market, presumably due in part to more conservative underwriting standards. In 2016, commercial mortgages held by U.S. insurers mainly consisted of performing loans, with more than 99% classified as “current” — reflecting increasing values and decreasing vacancies in real estate markets. The risks of delinquency and foreclosure in commercial mortgage loans have historically been extremely low. As shown in Figure 6, the annual rate of life insurer commercial mortgage loan foreclosures has been extremely low for virtually all of the past 14 years.

Commercial Mortgage Loans8
Figure 6. Life Company Mortgage Foreclosures Have Been Very Low for Many YearsAnnual Rate of Foreclosures in Life Insurer Portfolios, 2002-2016
Source: American Council of Life Insurance
Mortgage Loan Portfolio Profile The Mortgage Loan Portfolio Profile report is a quarterly publication that reports on life insurers’ delinquency experience on mortgage loans. It includes number and principal of outstanding loans, restructured loans, delinquent loans, loans in foreclosure and foreclosed loans by type of property and geographic region. Currently, the survey participants include both member and non-member companies and the coverage is about 85% of the whole industry.
Commercial Mortgage Loan Portfolio PerformanceCommercial mortgage loans historically have provided steady returns above comparable public bonds. There is no universally accepted index for commercial mortgage loans, but investors track total returns versus public benchmarks of their own choosing. As industry data for this asset class is limited, illustrated below are the historical return and risk data for the proprietary Voya Real Estate Finance portfolio. Over every measurement period, the commercial mortgage loan portfolio has outperformed a comparable public bond index with less risk as measured by standard deviation.
Figure 7. Commercial Mortgage Loans Have Outperformed a Public Credit Index with Lower Risk
2014 2015 20162003 2004 2005 2006 2007 2008 2010 20122009 2011 201320020.0
0.1
0.2
0.3
0.5%
0.4
Annualized Total Returns for Periods Ending 12/31/2016 (%)
Quarter 1 Year 3 Years 5 Years 10 Years
Voya REF CML Gross Return -0.50 3.10 5.58 5.27 6.03
Voya REF CML Net Return -0.55 2.90 5.37 5.06 5.82
Bloomberg Barclays "A" Corporate Bond Index -3.11 4.65 4.13 3.95 4.92
Excess Return (Gross) 2.62 -1.55 1.45 1.32 1.11
Annualized Standard Deviation as of 12/31/2014 (%)
3 Years 5 Years 10 Years
Voya REF CML Gross Return 1.55 1.65 2.41
Bloomberg Barclays "A" Corporate Bond Index 4.00 4.15 6.52
Difference -2.45 -2.50 -4.11
Past performance is no guarantee of future success. Please refer to the Performance Disclosures at the end of this paper. Source: Voya Investment Management, FactSet
9
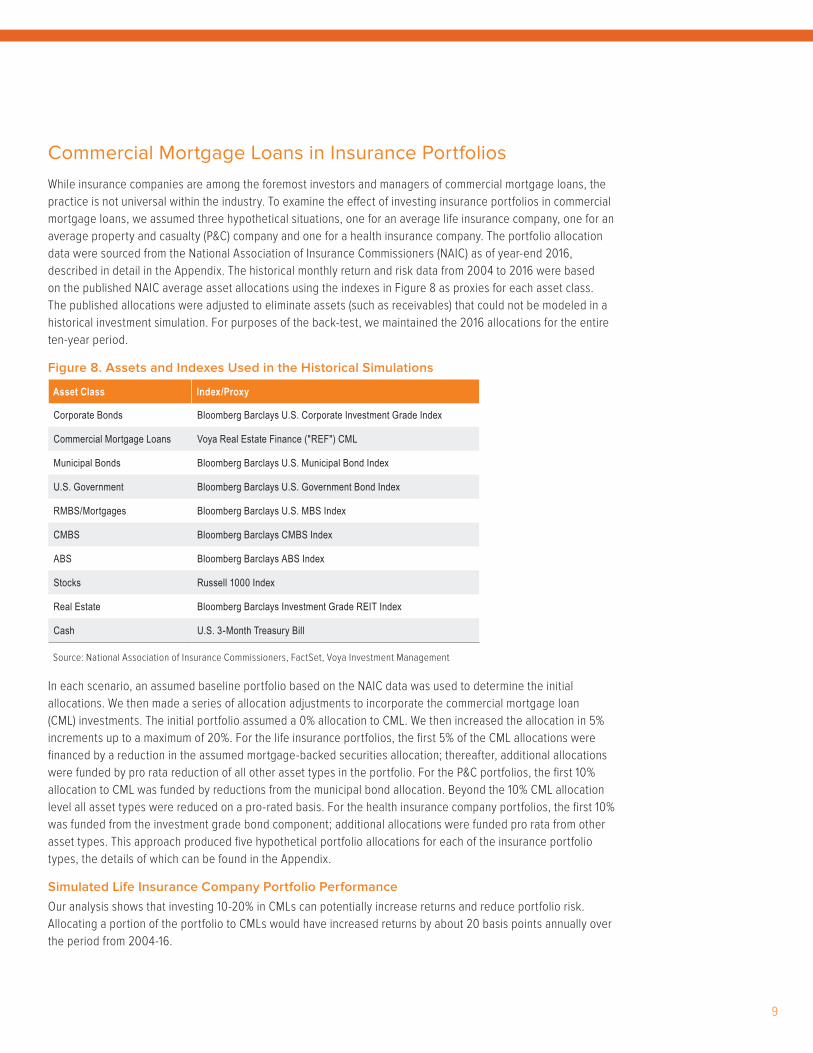
Commercial Mortgage Loans in Insurance PortfoliosWhile insurance companies are among the foremost investors and managers of commercial mortgage loans, the practice is not universal within the industry. To examine the effect of investing insurance portfolios in commercial mortgage loans, we assumed three hypothetical situations, one for an average life insurance company, one for an average property and casualty (P&C) company and one for a health insurance company. The portfolio allocation data were sourced from the National Association of Insurance Commissioners (NAIC) as of year-end 2016, described in detail in the Appendix. The historical monthly return and risk data from 2004 to 2016 were based on the published NAIC average asset allocations using the indexes in Figure 8 as proxies for each asset class. The published allocations were adjusted to eliminate assets (such as receivables) that could not be modeled in a historical investment simulation. For purposes of the back-test, we maintained the 2016 allocations for the entire ten-year period.
Figure 8. Assets and Indexes Used in the Historical Simulations
Asset Class Index/Proxy
Corporate Bonds Bloomberg Barclays U.S. Corporate Investment Grade Index
Commercial Mortgage Loans Voya Real Estate Finance ("REF") CML
Municipal Bonds Bloomberg Barclays U.S. Municipal Bond Index
U.S. Government Bloomberg Barclays U.S. Government Bond Index
RMBS/Mortgages Bloomberg Barclays U.S. MBS Index
CMBS Bloomberg Barclays CMBS Index
ABS Bloomberg Barclays ABS Index
Stocks Russell 1000 Index
Real Estate Bloomberg Barclays Investment Grade REIT Index
Cash U.S. 3-Month Treasury Bill
Source: National Association of Insurance Commissioners, FactSet, Voya Investment Management
In each scenario, an assumed baseline portfolio based on the NAIC data was used to determine the initial allocations. We then made a series of allocation adjustments to incorporate the commercial mortgage loan (CML) investments. The initial portfolio assumed a 0% allocation to CML. We then increased the allocation in 5% increments up to a maximum of 20%. For the life insurance portfolios, the first 5% of the CML allocations were financed by a reduction in the assumed mortgage-backed securities allocation; thereafter, additional allocations were funded by pro rata reduction of all other asset types in the portfolio. For the P&C portfolios, the first 10% allocation to CML was funded by reductions from the municipal bond allocation. Beyond the 10% CML allocation level all asset types were reduced on a pro-rated basis. For the health insurance company portfolios, the first 10% was funded from the investment grade bond component; additional allocations were funded pro rata from other asset types. This approach produced five hypothetical portfolio allocations for each of the insurance portfolio types, the details of which can be found in the Appendix.
Simulated Life Insurance Company Portfolio Performance Our analysis shows that investing 10-20% in CMLs can potentially increase returns and reduce portfolio risk. Allocating a portion of the portfolio to CMLs would have increased returns by about 20 basis points annually over the period from 2004-16.

Commercial Mortgage Loans10
Figure 9. Simulation Shows Favorable Return and Risk Effects of Commercial Mortgage LoansThe Effect of Adding CML Exposure to Life Insurance Company Portfolios, 2004-2016
For illustration purposes only. Simulated historical performance is no guarantee of future results. Actual performance may vary significantly from the results shown.
Source: Barclays, FactSet, Voya Investment Management
Simulated Property & Casualty Company Portfolio PerformanceThe data we analyzed showed that investment in commercial mortgage loans — at any allocation — can potentially reduce overall portfolio risk and increases returns. Although the typical P&C company has smaller allocations to CMLs than do life insurers, the impact was similar, a beneficial effect given P&C companies’ tendency toward larger equity allocations.
Figure 10. Favorable Return and Risk Effects on Simulated P&C Company Portfolios The Effect of Adding CML Exposure to P&C Insurance Company Portfolios–2004-2016
For illustration purposes only. Simulated historical performance is no guarantee of future results. Actual performance may vary significantly from the results shown.
Source: Barclays, FactSet, Voya Investment Management
20% allocation to CMLs
10% allocation to CMLs
0% allocation to CMLs
Allocating 10% or more to Commercial Mortgage Loans historically reduced risk and increased returns.
Ret
urn
%
Standard Deviation %
4.75
4.80
4.85
4.90
4.95
5.00
5.05
3.98 4.024.00 4.04 4.06 4.08 4.10 4.12 4.14
20% allocation to CMLs
0% allocation to CMLs
Any allocation to Commercial Mortgage Loans has historically benefited the risk/return ratio.
Ret
urn
%
Standard Deviation %
5.65
5.70
5.75
5.80
5.85
5.90
5.36 5.38 5.40 5.42 5.44 5.505.485.46

11
Simulated Health Insurance Company Portfolio PerformanceThe simulated portfolio data for health insurance companies showed that investment in commercial mortgage loans — at any allocation — would have potentially benefited the risk/return ratio in particular by reducing overall portfolio risk. Although the hypothetical impact to historical returns was more modest than for life and P&C companies, the overall beneficial effect was similar, given the potential risk reduction.
Figure 11. Favorable Return and Risk Effects on Simulated Health Company Portfolios is ApparentThe Effect of Adding CML Exposure to Health Insurance Company Portfolios–2004-2016
For illustration purposes only. Simulated historical performance is no guarantee of future results. Actual performance may vary significantly from the results shown.
Source: Barclays, FactSet, Voya Investment Management
20% allocation to CMLs
10% allocation to CMLs
0% allocation to CMLs
Any allocation to Commercial Mortgage Loans would have historically benefited the risk/return ratio.
Ret
urn
%
Standard Deviation %
4.64
4.66
4.68
4.70
4.72
4.76
4.74
3.30 3.40 3.50 3.60 3.70 4.003.903.80
Commercial Mortgage Loans12
Potential Benefits of Commercial Mortgage Loans in Diversified Portfolios
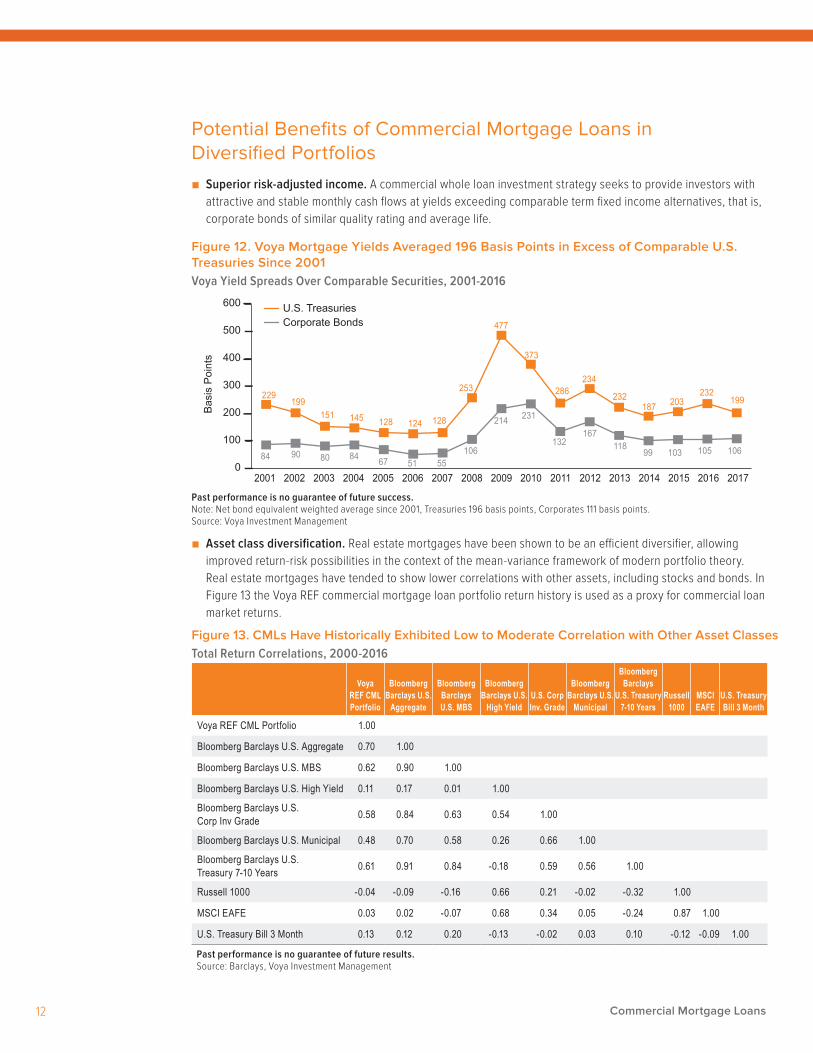
■ Superior risk-adjusted income. A commercial whole loan investment strategy seeks to provide investors with attractive and stable monthly cash flows at yields exceeding comparable term fixed income alternatives, that is, corporate bonds of similar quality rating and average life.
Figure 12. Voya Mortgage Yields Averaged 196 Basis Points in Excess of Comparable U.S. Treasuries Since 2001Voya Yield Spreads Over Comparable Securities, 2001-2016
Past performance is no guarantee of future success. Note: Net bond equivalent weighted average since 2001, Treasuries 196 basis points, Corporates 111 basis points. Source: Voya Investment Management
■ Asset class diversification. Real estate mortgages have been shown to be an efficient diversifier, allowing improved return-risk possibilities in the context of the mean-variance framework of modern portfolio theory. Real estate mortgages have tended to show lower correlations with other assets, including stocks and bonds. In Figure 13 the Voya REF commercial mortgage loan portfolio return history is used as a proxy for commercial loan market returns.
2001 20092002 20102003 2011 20152013 20172016201420122004 2005 2006 2007 20080
100
200
300
400
500
600
Corporate BondsU.S. Treasuries
229199
151 145 128 124 128
253
477
373
234286 232
187199
232203
84 90 80 84 67 51 55106
214 231
132167
99 103 105 106118
Basi
s Po
ints
Figure 13. CMLs Have Historically Exhibited Low to Moderate Correlation with Other Asset ClassesTotal Return Correlations, 2000-2016
Voya REF CML Portfolio
Bloomberg Barclays U.S.
Aggregate
Bloomberg Barclays U.S. MBS
Bloomberg Barclays U.S.
High YieldU.S. Corp Inv. Grade
Bloomberg Barclays U.S.
Municipal
Bloomberg Barclays
U.S. Treasury 7-10 Years
Russell 1000
MSCI EAFE
U.S. Treasury Bill 3 Month
Voya REF CML Portfolio 1.00
Bloomberg Barclays U.S. Aggregate 0.70 1.00
Bloomberg Barclays U.S. MBS 0.62 0.90 1.00
Bloomberg Barclays U.S. High Yield 0.11 0.17 0.01 1.00
Bloomberg Barclays U.S. Corp Inv Grade 0.58 0.84 0.63 0.54 1.00
Bloomberg Barclays U.S. Municipal 0.48 0.70 0.58 0.26 0.66 1.00
Bloomberg Barclays U.S. Treasury 7-10 Years 0.61 0.91 0.84 -0.18 0.59 0.56 1.00
Russell 1000 -0.04 -0.09 -0.16 0.66 0.21 -0.02 -0.32 1.00
MSCI EAFE 0.03 0.02 -0.07 0.68 0.34 0.05 -0.24 0.87 1.00
U.S. Treasury Bill 3 Month 0.13 0.12 0.20 -0.13 -0.02 0.03 0.10 -0.12 -0.09 1.00
Past performance is no guarantee of future results.Source: Barclays, Voya Investment Management

13
■ Yield protection. Fixed rate commercial mortgages typically include yield protection in the form of make-whole pre-payment provisions, which enhance the portfolio management and asset-liability characteristics of the asset class. The make-whole pre-payment conditions, in effect, assure that in the event of prepayment, the lender will receive the same amount of income as would have been paid if the loan were still in effect.
■ Multiple Sources of Income. Commercial mortgages have shown high relative risk-adjusted returns compared to other major asset classes. Commercial mortgages typically exhibit low volatility due to a number of factors, including diversification (geographically and by product type), relatively low loss rates and the fact that income to pay mortgages is ultimately derived from multiple tenants in many businesses. As an example (illustrated in Figure 14) Voya REF’s statutory portfolio has averaged realized losses of about 4.9 bps per year since 2001.
Figure 14. Auspicious Loss Experience Exemplifies Commercial Mortgage Loan AdvantagesVoya REF Loss History as a Percentage of the Portfolio
Past performance is no guarantee of future success. *Proprietary benchmark based on a select bond portfolio of similar rating, vintage and average life. Source: Voya Investment Management
■ Favorable risk-based capital treatment. In 2013 a new framework was adopted for assigning life insurance company risk-based capital (RBC) for commercial mortgages in good standing. The new framework has five risk cohorts, each with an assigned RBC factor. Each loan in a portfolio of mortgages is assigned to one of the risk cohorts based on debt-service coverage and loan-to-value ratio. Commercial mortgage investments require low absolute capital compared to real estate equities and relatively low risk-based capital charges in relation to comparable fixed income alternatives. Given this background, U.S. commercial mortgage loan investments may allow investors to generate attractive income yields in a capital efficient manner.
■ Customization based on specific needs. The availability of individually managed separate accounts — and in some cases, direct co-investment alongside a professional manager and other investors — allows the flexibility to position a commercial mortgage portfolio to effectively complement other asset classes in accordance with each investor’s specific investment needs.
■ Tax efficiency for international investors. U.S. commercial mortgages potentially can provide international investors with a tax-efficient income stream as a result of investment returns from interest income in contrast to U.S. equity real estate strategies.
Average loss from 2001-2016 was 4.9 basis points/year.
Voya REF CML
Benchmark*
Difference
-.07
-.49
-.19
-.10
.00-.01
-.30
-.53
-.11-.15
-.07
.00
.23
.04
-.08
.05 .07
.01.00 .01.01
2008
Net
Gai
n/Lo
ss %
2009 2010 2011 2012 2016201520142013-0.60
-0.50
-0.40
-0.30
-0.20
-0.10
0.0
0.10
0.20
0.30%
.00 .00 .00 .00 .00 .00

Commercial Mortgage Loans14
■ Attractive historical rates of return and risk. Figure 15 illustrates the historical risk and return data for various asset types included in insurance company portfolios. Given the lack of a standard index or benchmark for commercial mortgage loan investments, the Voya REF historical return series is used to represent the asset class. Seen in this context, the potential advantages of its risk/return profile are evident; for instance, CMLs offer higher returns than mortgage-backed securities and lower volatility than investment grade corporate bonds.
Figure 15. The Favorable Return-to-Risk Profile of Commercial Mortgage Loans Is EvidentRisk and Return, 2004–14
Past performance is no guarantee of future results.Source: Barclays, FactSet, Voya Investment Management.
0.0
2.0
6.0
4.0
8.0
10.0%
Ret
urn
%
0.0 5.0 10.0 15.0%
Standard Deviation %
Bloomberg Barclays CMBS Index
Russell 1000 Index
Bloomberg Barclays ABS Index
Bloomberg Barclays US Corporate Investment Grade Index
Bloomberg Barclays US Municipal Index
Bloomberg Barclays US Government Index
Bloomberg Barclays US MBS Index
Bloomberg Barclays Investment Grade REIT Index
Life Insurance Portfolio
U.S. 3-Month Treasury Bill
Voya REF Commercial Mortgage Loans

15
ConclusionCommercial mortgage loans provide attractive opportunities to realize incremental yield spreads and other benefits for investors whose objectives make their distinctive characteristics suitable.
■ Commercial mortgage loans can potentially offer attractive and stable income, efficient diversification, favorable risk-based capital treatment, yield protection and tax efficiency.
■ Commercial mortgage loans are relatively low risk fixed income investments, historically offering returns similar to commercial mortgage-backed securities — with less than half the risk (as measured by standard deviation).
■ Among those active in the commercial mortgage loan markets, life insurance companies are the leading managers, offering experience, resources and an enviable record of past performance.
■ The U.S. commercial real estate and mortgage loan markets remain healthy; the moderate but steady growth generated in 2016 can potentially continue in 2017.
■ In terms of delinquencies and foreclosures, commercial mortgage loans managed by insurance companies have tended to perform better than the overall market, due in part to conservative underwriting standards.
■ Historical simulations show the potential of commercial mortgage loans to expand the efficient frontier for institutional investors.

Commercial Mortgage Loans16
Appendix: Historical Simulation Portfolio Data—Life Insurance Portfolio
Life Insurance Portfolio (%)Bonds 80.5Stocks 5.0Mortgages 10.9Real Estate 0.7Cash 2.9Total 100.0
Bond AllocationCorporate Bonds 62.8Municipal Bonds 6.5U.S. Government 5.4RMBS 11.7CMBS 6.2ABS 7.4Total 100.0
Life Insurance Portfolio 1Corporate Bonds US Corporate Investment Grade Index 50.6Municipal Bonds US Municipal Bond Index 5.2US Government US Government Bond Index 4.3RMBS/Mortgages US MBS Bond Index 20.3CMBS CMBS Bond Index 5.0ABS ABS Bond Index 6.0Stocks Russell 1000 Index 5.0Real Estate Investment Grade REIT Index 0.7Cash US 3 Month Treasury Bill 2.9Total 100.0
Life Insurance Portfolio 2Corporate Bonds US Corporate Investment Grade Index 50.6CML Voya REF CML 5.0Municipal Bonds US Municipal Bond Index 5.2US Government US Government Bond Index 4.3RMBS/Mortgages US MBS Bond Index 15.3CMBS CMBS Bond Index 5.0ABS ABS Bond Index 6.0Stocks Russell 1000 Index 5.0Real Estate Investment Grade REIT Index 0.7Cash US 3 Month Treasury Bill 2.9Total 100.0
Life Insurance Portfolio 3Corporate Bonds US Corporate Investment Grade Index 50.6CML Voya REF CML 10.0Municipal Bonds US Municipal Bond Index 4.5US Government US Government Bond Index 3.7RMBS/Mortgages US MBS Bond Index 13.2CMBS CMBS Bond Index 4.3ABS ABS Bond Index 5.1Stocks Russell 1000 Index 5.0Real Estate Investment Grade REIT Index 0.7Cash US 3 Month Treasury Bill 2.9Total 100.0
Life Insurance Portfolio 4Corporate Bonds US Corporate Investment Grade Index 50.6CML Voya REF CML 15.0Municipal Bonds US Municipal Bond Index 3.8US Government US Government Bond Index 3.1RMBS/Mortgages US MBS Bond Index 11.0CMBS CMBS Bond Index 3.6ABS ABS Bond Index 4.3Stocks Russell 1000 Index 5.0Real Estate Investment Grade REIT Index 0.7Cash US 3 Month Treasury Bill 2.9Total 100.0
Life Insurance Portfolio 5Corporate Bonds US Corporate Investment Grade Index 50.6CML Voya REF CML 20.0Municipal Bonds US Municipal Bond Index 3.0US Government US Government Bond Index 2.5RMBS/Mortgages US MBS Bond Index 8.9CMBS CMBS Bond Index 2.9ABS ABS Bond Index 3.5Stocks Russell 1000 Index 5.0Real Estate Investment Grade REIT Index 0.7Cash US 3 Month Treasury Bill 2.9Total 100.0
Index details appear in Figure 8.
17
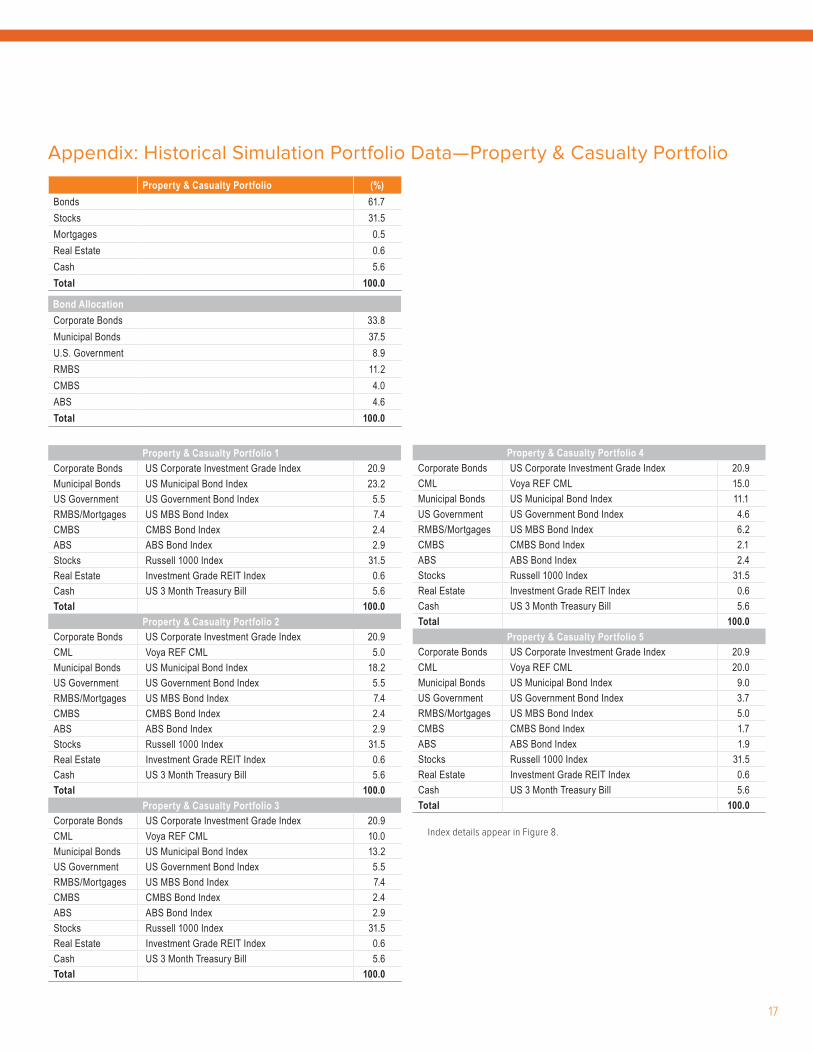
Appendix: Historical Simulation Portfolio Data—Property & Casualty Portfolio
Property & Casualty Portfolio (%)Bonds 61.7Stocks 31.5Mortgages 0.5Real Estate 0.6Cash 5.6Total 100.0
Bond AllocationCorporate Bonds 33.8Municipal Bonds 37.5U.S. Government 8.9RMBS 11.2CMBS 4.0ABS 4.6Total 100.0
Property & Casualty Portfolio 1Corporate Bonds US Corporate Investment Grade Index 20.9Municipal Bonds US Municipal Bond Index 23.2US Government US Government Bond Index 5.5RMBS/Mortgages US MBS Bond Index 7.4CMBS CMBS Bond Index 2.4ABS ABS Bond Index 2.9Stocks Russell 1000 Index 31.5Real Estate Investment Grade REIT Index 0.6Cash US 3 Month Treasury Bill 5.6Total 100.0
Property & Casualty Portfolio 2Corporate Bonds US Corporate Investment Grade Index 20.9CML Voya REF CML 5.0Municipal Bonds US Municipal Bond Index 18.2US Government US Government Bond Index 5.5RMBS/Mortgages US MBS Bond Index 7.4CMBS CMBS Bond Index 2.4ABS ABS Bond Index 2.9Stocks Russell 1000 Index 31.5Real Estate Investment Grade REIT Index 0.6Cash US 3 Month Treasury Bill 5.6Total 100.0
Property & Casualty Portfolio 3Corporate Bonds US Corporate Investment Grade Index 20.9CML Voya REF CML 10.0Municipal Bonds US Municipal Bond Index 13.2US Government US Government Bond Index 5.5RMBS/Mortgages US MBS Bond Index 7.4CMBS CMBS Bond Index 2.4ABS ABS Bond Index 2.9Stocks Russell 1000 Index 31.5Real Estate Investment Grade REIT Index 0.6Cash US 3 Month Treasury Bill 5.6Total 100.0
Property & Casualty Portfolio 4Corporate Bonds US Corporate Investment Grade Index 20.9CML Voya REF CML 15.0Municipal Bonds US Municipal Bond Index 11.1US Government US Government Bond Index 4.6RMBS/Mortgages US MBS Bond Index 6.2CMBS CMBS Bond Index 2.1ABS ABS Bond Index 2.4Stocks Russell 1000 Index 31.5Real Estate Investment Grade REIT Index 0.6Cash US 3 Month Treasury Bill 5.6Total 100.0
Property & Casualty Portfolio 5Corporate Bonds US Corporate Investment Grade Index 20.9CML Voya REF CML 20.0Municipal Bonds US Municipal Bond Index 9.0US Government US Government Bond Index 3.7RMBS/Mortgages US MBS Bond Index 5.0CMBS CMBS Bond Index 1.7ABS ABS Bond Index 1.9Stocks Russell 1000 Index 31.5Real Estate Investment Grade REIT Index 0.6Cash US 3 Month Treasury Bill 5.6Total 100.0
Index details appear in Figure 8.

Commercial Mortgage Loans18
Appendix: Historical Simulation Portfolio Data—Health Insurance Portfolio
Health Insurance (%)Bonds 55.9Stocks 19.1Mortgages 0.0Real Estate 3.4Cash 21.7Total 100.0
Bond AllocationCorporate Bonds 38.6Municipal Bonds 23.4U.S. Government 13.6RMBS 14.4CMBS 5.1ABS 4.8Total 100.0
Health Insurance Portfolio 1 Corporate Bonds US Corporate Investment Grade Index 21.6Municipal Bonds US Municipal Bond Index 13.1US Government US Government Bond Index 7.6RMBS/Mortgages US MBS Bond Index 8.1CMBS CMBS Bond Index 2.8ABS ABS Bond Index 2.7Stocks Russell 1000 Index 19.1Real Estate Investment Grade REIT Index 3.4Cash US 3 Month Treasury Bill 21.6Total 100.0
Health Insurance Portfolio 2Corporate Bonds US Corporate Investment Grade Index 16.6Private Credit Voya REF CML 5.0Municipal Bonds US Municipal Bond Index 13.1US Government US Government Bond Index 7.6RMBS/Mortgages US MBS Bond Index 8.1CMBS CMBS Bond Index 2.8ABS ABS Bond Index 2.7Stocks Russell 1000 Index 19.1Real Estate Investment Grade REIT Index 3.4Cash US 3 Month Treasury Bill 21.6Total 100.0
Health Insurance Portfolio 3Corporate Bonds US Corporate Investment Grade Index 11.6Private Credit Voya REF CML 10.0Municipal Bonds US Municipal Bond Index 13.1US Government US Government Bond Index 7.6RMBS/Mortgages US MBS Bond Index 8.1CMBS CMBS Bond Index 2.8ABS ABS Bond Index 2.7Stocks Russell 1000 Index 19.1Real Estate Investment Grade REIT Index 3.4Cash US 3 Month Treasury Bill 21.6Total 100.0
Health Insurance Portfolio 4Corporate Bonds US Corporate Investment Grade Index 11.0Private Credit Voya REF CML 15.0Municipal Bonds US Municipal Bond Index 12.4US Government US Government Bond Index 7.2RMBS/Mortgages US MBS Bond Index 7.6CMBS CMBS Bond Index 2.7ABS ABS Bond Index 2.5Stocks Russell 1000 Index 18.1Real Estate Investment Grade REIT Index 3.2Cash US 3 Month Treasury Bill 20.3Total 100.0
Health Insurance Portfolio 5Corporate Bonds US Corporate Investment Grade Index 10.4Private Credit Voya REF CML 20.0Municipal Bonds US Municipal Bond Index 11.7US Government US Government Bond Index 6.8RMBS/Mortgages US MBS Bond Index 7.2CMBS CMBS Bond Index 2.5ABS ABS Bond Index 2.4Stocks Russell 1000 Index 17.0Real Estate Investment Grade REIT Index 3.0Cash US 3 Month Treasury Bill 19.1Total 100.0
Index details appear in Figure 8.

For financial professional use only. Not for inspection by, distribution or quotation to, the general public.Not FDIC Insured | May Lose Value | No Bank Guarantee
©2017 Voya Investments Distributor, LLC • 230 Park Ave, New York, NY 10169 • All rights reserved.
For financial professional or qualified institutional investor use only. Not for inspection by, distribution or quotation to, the general public.BSWP-CML 061217 • IM0608-35093-0618 • 172138
Performance DisclosuresVoya REF historical returns are based on the performance of the Voya Real Estate Finance proprietary portfolio through December 31, 2014. The performance presented is based on portfolios managed for our proprietary insurance assets. These assets fall outside of our GIPS firm definition and therefore not subject to the input, calculation, presentation, and disclosure requirements of GIPS. Gross-of-fees returns are calculated on a monthly basis by taking market values which use a spread pricing process and contain cash flows that are inclusive of regular principal and income payments, loan advances, loan payoffs, new loans, payment reversals, late charges, curtailments, and prepayment premiums and then geometrically linking the results to produce annual returns shown. Net-of-fees returns are calculated by deducting a hypothetical management fee (20 bps) from the gross return on a monthly basis and geometrically linking the results to produce annual returns shown. The hypothetical management fee is equal to the highest fee from any fee schedule currently offered for the strategy shown. While fee schedules can change over time, any amended fee resulting from a change will not be retroactively applied to performance history, but will rather be applied on a prospective basis from the point of change. The annual management fee will vary according to the size of the account, and will depend on the type of investment vehicle selected. The performance data is offered as supplemental information only. Performance shown for less than one year is not annualized. Further information regarding applicable fee schedules is available upon request. Past performance is no guarantee of future results.
The Barclays Corporate A Index includes both corporate and non-corporate sectors. The corporate sectors are Industrial, Utility, and Finance, which include both U.S. and non-U.S. corporations. The non-corporate sectors are Sovereign, Supranational, Foreign Agency, and Foreign Local Government. The Index does not reflect fees, brokerage commissions, taxes or other expenses of investing. The Barclays Corp A index is the “A”-rated component of the Barclays U.S. Corporate Investment Grade public bond index. The index does not contain commercial mortgages and is not a typical performance benchmark for a commercial mortgage loan portfolio. The credit quality and loss profile of our Commercial Mortgage Loan portfolio is viewed as being similar to that of a single-A rated corporate bond portfolio. As such, the Barclays Corp A index was negotiated with a proprietary client after years of experimentation with various other indexes in an effort to compare the contribu-tion of a portfolio of commercial mortgages to a portfolio of similar quality public corporate bonds over the same investment horizon. Investors cannot invest directly in an index.
Diversification and Past PerformanceCommercial mortgage loan portfolios are typically diversified by property type and geography, but there are no guarantees a diversified portfolio will outperform a non-diversified portfolio. Diversification does not guarantee a profit or ensure against loss. Historical returns are useful as indicators of general trends and relationships; however, past performance is no guarantee of future results.
General Fixed Income RisksThe principal risks are generally similar to those attributable to bond investing. All investments in bonds are subject to market risks as well as issuer, credit, prepay-ment, extension, and other risks, and their values may fluctuate. Market risk is the risk that securities may decline in value due to factors affecting the securities markets or particular industries. Bonds have fixed principal and return if held to maturity, but may fluctuate in the interim. Generally, when interest rates rise, bond prices fall. Bonds with longer maturities tend to be more sensitive to changes in interest rates. Issuer risk is the risk that the value of a security may decline for reasons specific to the issuer, such as changes in its financial condition.
General Risks Associated with Commercial Mortgage LoansInvestments in commercial mortgage loans are subject to risks associated with general economic conditions, national, regional and local market risks and direct ownership risks, which may impact the ability of a borrower to meet its obligations on the loan because cash flows and value are derived from the performance of the underlying commercial real estate. These risks include:
■ Changes in economic conditions, interest rates and tax laws ■ Declines in the real estate values, rental or occupancy rates ■ Changes in zoning laws and other governmental regulation ■ Overbuilding and resulting high vacancy rates for extended periods ■ Lack of available credit to refinance mortgage loans at or before maturity ■ Inability to attract and retain tenants
■ Financial inability to adequately maintain or improve a building ■ Expenses related to environmental problems, tenant defaults or bankruptcy ■ Casualty losses, terrorist threats and attacks, social unrest and civil disturbances ■ Weather, floods, earthquakes or other natural disasters
Specific Risks Associated with Commercial Mortgage LoansThe value of commercial mortgage loans will be influenced by the rate of delin-quencies and defaults experienced on the commercial mortgage loans and by the severity of potential losses incurred. The factors influencing delinquencies, defaults, and loss severity include: (1) economic and real estate market conditions by property type (e.g., office, multifamily, retail, and hotels); (2) the terms and structure of the mortgage loans; and (3) limitations on legal and financial recourse in the event of default.
Commercial mortgage loans may expose a lender to potentially greater risk of loss through delinquency and foreclosure than residential mortgage loans. Repayment of a loan secured by income-producing property typically is dependent upon the ability of tenants to make lease payments, the ability of a property to attract and retain tenants, and the ability of the owner to maintain the property, control operating expenses, and comply with applicable laws, rather than upon the existence of independent income or assets of the borrower. Most commercial mortgage loans provide recourse only to the property and not against the borrower’s other assets or personal guarantees.
Some commercial mortgage loans do not fully amortize, which can necessitate a sale of the property or refinancing of any terminal “balloon” payment or payments at or prior to maturity. Investors in commercial mortgage loans bear the risk that the borrower will be unable to refinance or otherwise repay the mortgage loan at maturity, possibly increasing the likelihood of a default.
The liquidity of commercial mortgage loans will fluctuate with, among other things, general economic conditions, political events, developments or trends in particular industries or economic sectors. Credit markets have periodically experienced reduced liquidity during periods of extreme market volatility, such as during the global credit crisis, and similar conditions could re-occur and impact the valuations of properties, debt instruments and securities.
When making investments in commercial mortgage loans Voya Investment Management will conduct a due diligence process to evaluate factors believed to govern the success of those investments. There may be little publicly available information about the prospective investments other than what is developed on a proprietary basis by the Voya Real Estate Finance Division. Voya cannot provide any assurances that these due diligence processes will uncover all relevant facts of the mortgage loans or that any investment will be successful.
Important InformationThis information is proprietary and cannot be reproduced or distributed. Certain information may be received from sources Voya Investment Management (“Voya IM”) considers reliable; Voya IM does not represent that such information is accurate or complete. Certain statements contained herein may constitute “projections,” “forecasts” and other “forward-looking statements” which do not reflect actual results and are based primarily upon applying retroactively a hypothetical set of assumptions to certain historical financial data. Actual results, performance or events may differ materially from those in such statements. Any opinions, projec-tions, forecasts and forward looking statements presented herein are valid only as of the date of this document and are subject to change. Nothing contained herein should be construed as (i) an offer to buy any security or (ii) a recommendation as to the advisability of investing in, purchasing or selling any security. Voya IM assumes no obligation to update any forward-looking information.
Past performance is no guarantee of future results.
The opinions, views and information expressed in this presentation regarding holdings are subject to change without notice. The information provided regarding holdings is not a recommendation to buy or sell any security. Portfolio holdings are fluid and are subject to daily change based on market conditions and other factors.
Products and services are offered through Voya family of companies. Please visit us at http://voya.com for information regarding other products and services offered through Voya family of companies. Not all products are available in all states.
This material may not be reproduced in whole or in part in any form whatsoever without the prior written permission of Voya Investment Management.


